
Seasonal Plant Nitrogen Use and Soil N pools in Intermediate Wheatgrass (Thinopyrum intermedium)

Abstract
:1. Introduction
2. Materials and Methods
2.1. Experimental Design and Location
2.2. Plant Biomass, Grain Yield, and Biomass Nitrogen Yield
2.3. Lodging, and Plant Heights
2.4. Soil Total N and N Mineralization
2.5. Plant Nitrogen Use Efficiency
2.6. Statistical Analysis and Calculations
3. Results
3.1. Above- and Belowground Biomass, Grain Yield, and Lodging
3.2. Plant N Concentrations and Biomass N Yield
3.3. Plant Nitrogen Use Efficiency and Net Uptake

| PNUE | NIE | |||
|---|---|---|---|---|
| Factor | Maturity | Fall Regrowth | Maturity | Fall Regrowth |
| 1-year-old stand | ||||
| Treatment | 0.0317 | 0.0012 | 0.1128 | 0.2064 |
| Tissue | <0.0001 | <0.0001 | 0.6069 | 0.0323 |
| Tissue X Treatment | 0.0454 | 0.8987 | 0.4669 | 0.7286 |
| 2-year-old stand | ||||
| Treatment | 0.3723 | 0.0023 | 0.7694 | 0.6111 |
| Tissue | <0.0001 | <0.0001 | 0.0844 | 0.5735 |
| Tissue X Treatment | 0.4734 | 0.9658 | 0.9197 | 0.9423 |
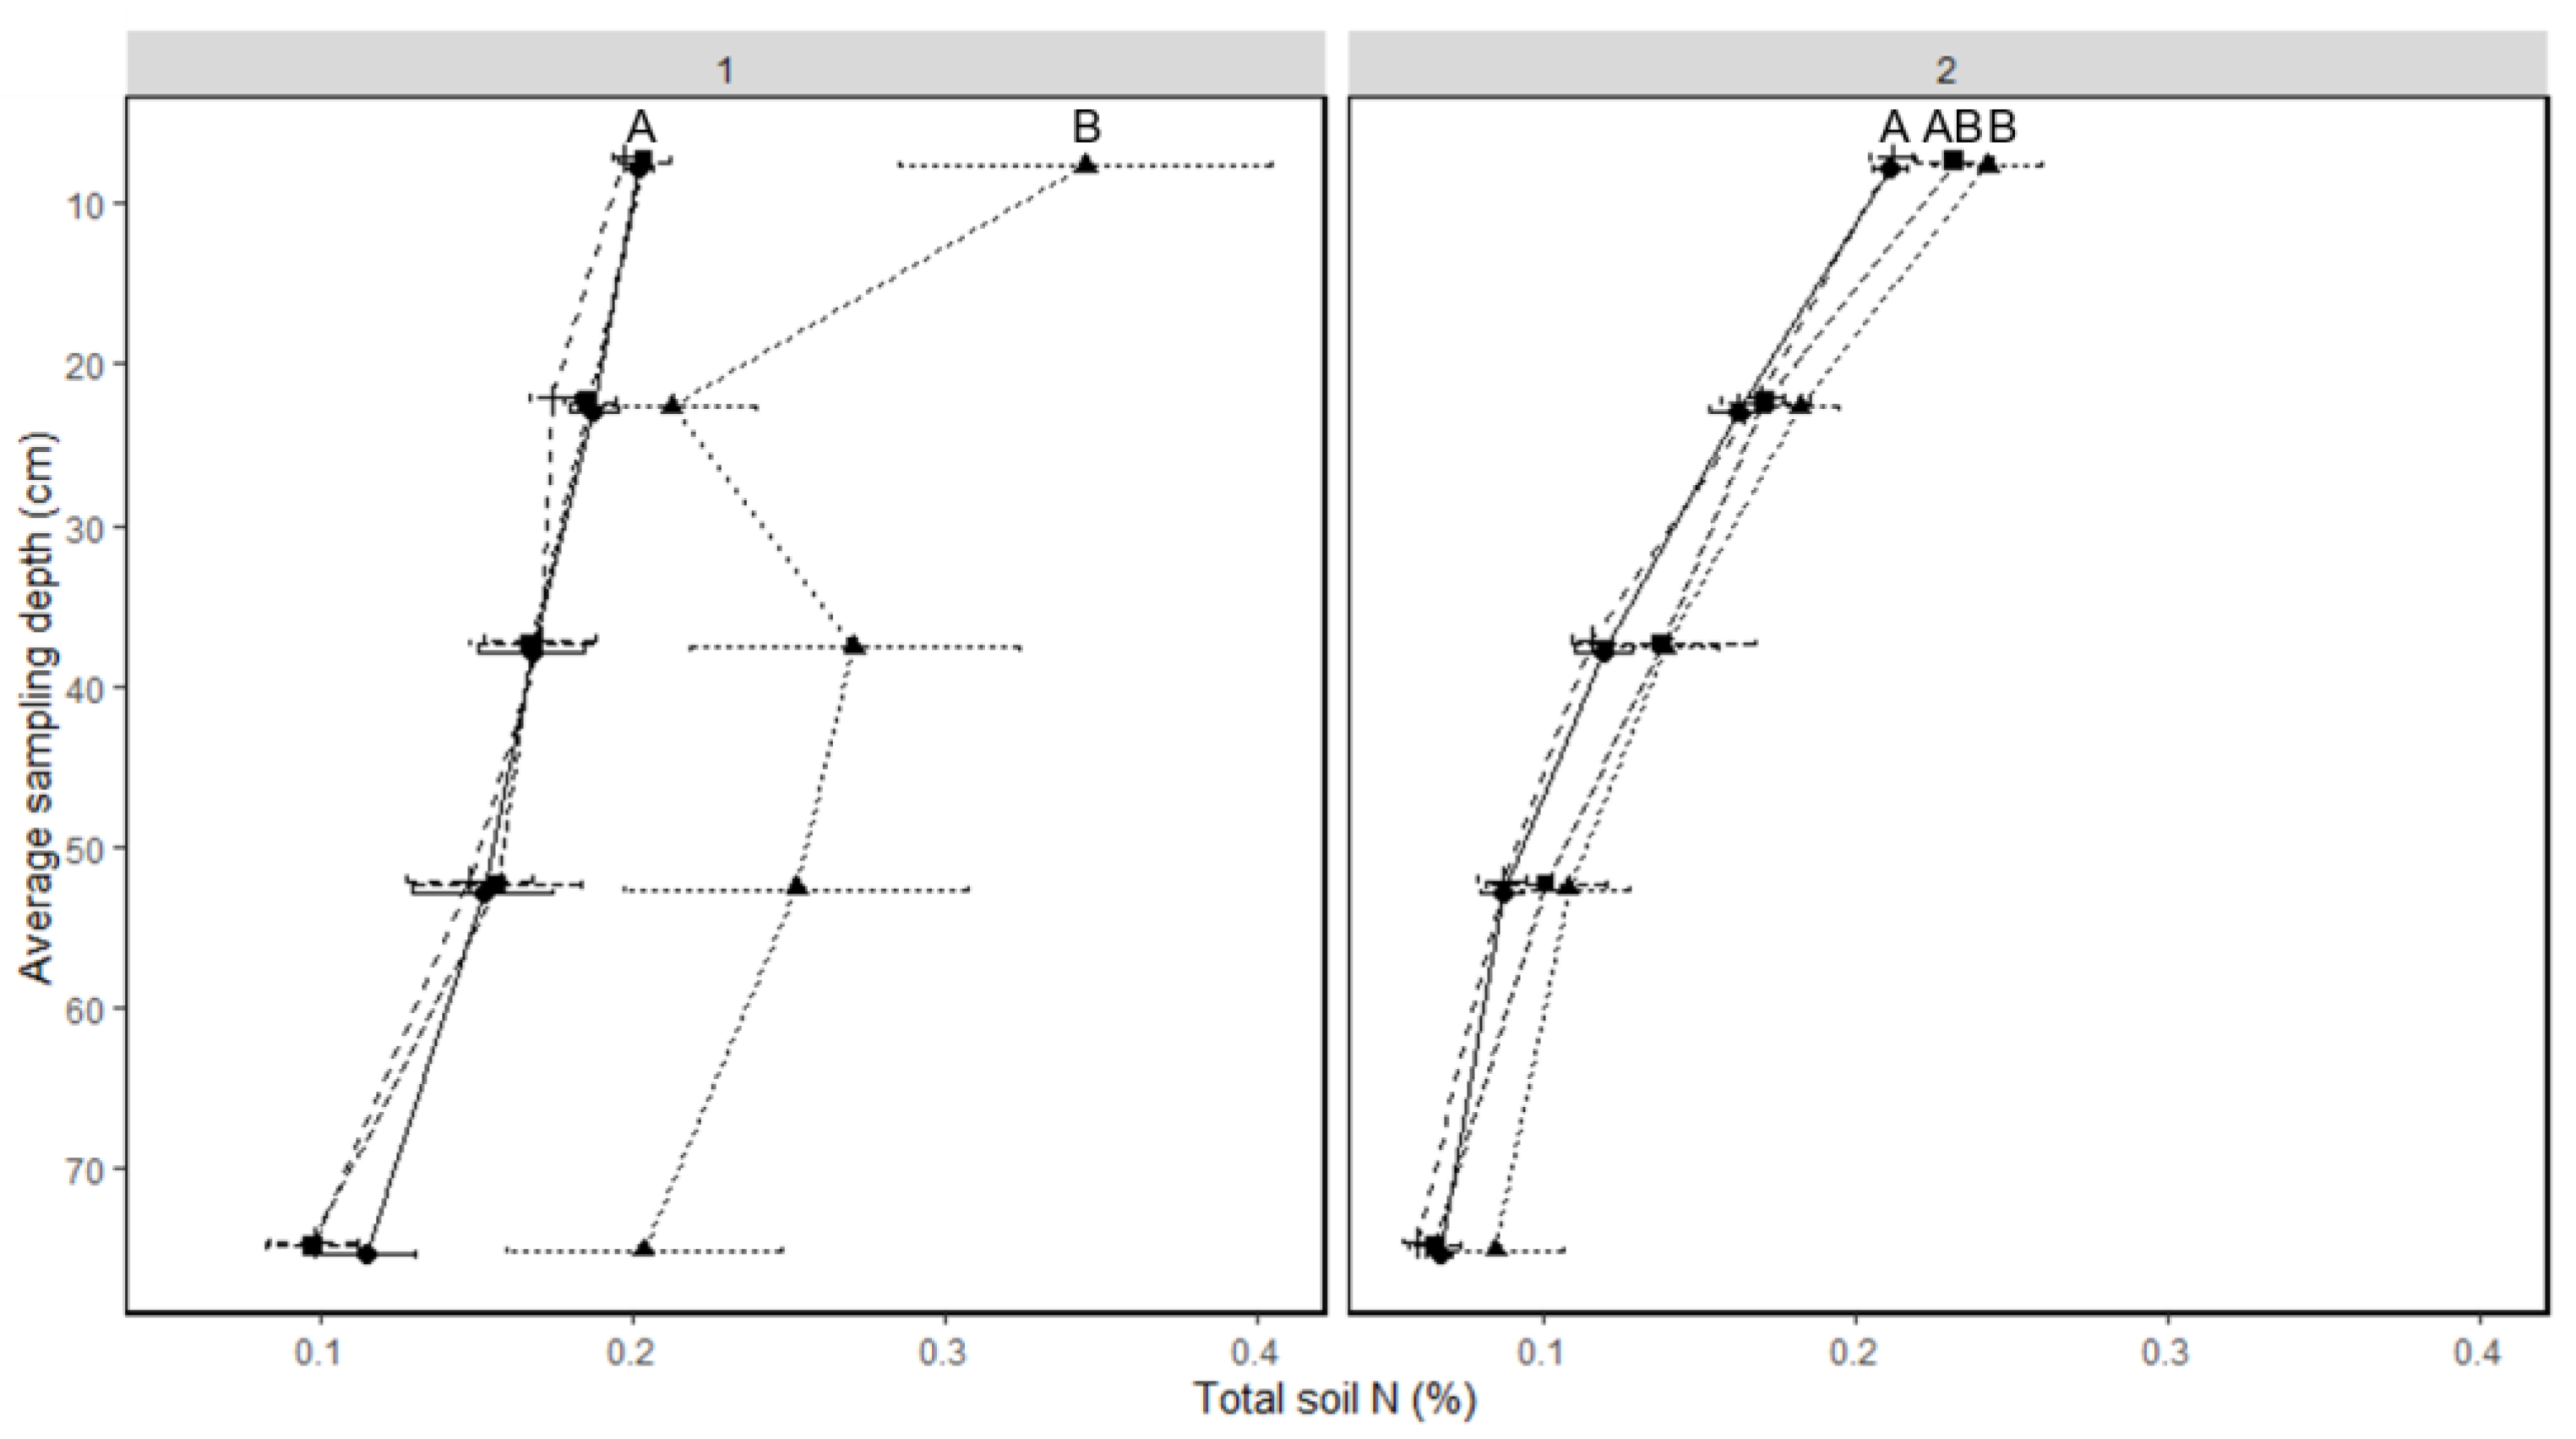
3.4. Soil% Nitrogen
3.5. Soil Mineral Nitrogen
3.6. Net Mineralized Nitrogen and Mineralization Rates
4. Discussion
5. Conclusions
Supplementary Materials
Author Contributions
Funding
Institutional Review Board Statement
Data Availability Statement
Acknowledgments
Conflicts of Interest
References
- Keeler, B.L.; Gourevitch, J.D.; Polasky, S.; Isbell, F.; Tessum, C.W.; Hill, J.D.; Marshall, J.D. The Social Costs of Nitrogen. Sci. Adv. 2016, 2, e160021. [Google Scholar] [CrossRef] [PubMed] [Green Version]
- Ward, M.H.; Jones, R.R.; Brender, J.D.; De Kok, T.M.; Weyer, P.J.; Nolan, B.T.; Villanueva, C.M.; Van Breda, S.G. Drinking water nitrate and human health: An updated review. Int. J. Environ. Res. Public Health 2018, 15, 1557. [Google Scholar] [CrossRef] [PubMed] [Green Version]
- Ryan, M.R.; Crews, T.E.; Culman, S.W.; DeHaan, L.R.; Hayes, R.C.; Jungers, J.M.; Bakker, M.G. Managing for multifunctionality in perennial grain crops. Bioscience 2018, 68, 294–304. [Google Scholar] [CrossRef] [PubMed]
- Dawson, J.C.; Huggins, D.R.; Jones, S.S. Characterizing nutrient use efficiency in natural and agricultural ecosystems to improve the performance of cereal crops in low-input and organic agricultural systems. Field Crops Res. 2008, 107, 89–101. [Google Scholar] [CrossRef]
- Reilly, E.C.; Gutknecht, J.L.M.; Sheaffer, C.C.; Jungers, J.M. Reductions in soil water nitrate beneath a perennial grain crop compared to an annual crop rotation on sandy soil. Front. Sustain. Food Syst. 2022, 6, 996586. [Google Scholar] [CrossRef]
- Jungers, J.M.; DeHaan, L.H.; Mulla, D.J.; Sheaffer, C.C.; Wyse, D.L. Reduced nitrate leaching in a perennial grain crop compared to maize in the Upper Midwest, USA. Agric. Ecosyst. Environ. 2019, 272, 63–73. [Google Scholar] [CrossRef]
- Culman, S.W.; Snapp, S.S.; Ollenburger, M.; Basso, B.; DeHaan, L.R. Soil and water quality rapidly responds to the perennial grain Kernza wheatgrass. Agron. J. 2013, 105, 735–744. [Google Scholar] [CrossRef] [Green Version]
- Fagnant, L.; Duchêne, O.; Celette, F.; David, C.; Bindelle, J.; Dumont, B. Learning about the growing habits and reproductive strategy of Thinopyrum intermedium through the establishment of its critical nitrogen dilution curve. Field Crops Res. 2023, 291, 108802. [Google Scholar] [CrossRef]
- Sprunger, C.D.; Culman, S.; Robertson, G.; Snapp, S. How does nitrogen and perenniality influence belowground biomass and nitrogen use efficiency in small grain cereals? Crop Sci. 2018, 58, 2110–2120. [Google Scholar] [CrossRef]
- Jungers, J.M.; Sheaffer, C.C.; Lamb, J.A. The Effect of Nitrogen, Phosphorus, and Potassium Fertilizers on Prairie Biomass Yield, Ethanol Yield, and Nutrient Harvest. Bioenerg. Res. 2015, 8, 279–291. [Google Scholar] [CrossRef]
- Sainju, U.M.; Allen, B.L.; Lenssen, A.W.; Mikha, M. Root and soil total carbon and nitrogen under bioenergy perennial grasses with various nitrogen rates. Biomass Bioenergy 2017, 107, 326–334. [Google Scholar] [CrossRef] [Green Version]
- Pugliese, J.Y.; Culman, S.W.; Sprunger, C.D. Correction to: Harvesting forage of the perennial grain crop kernza (Thinopyrum intermedium) increases root biomass and soil nitrogen cycling. Plant Soil 2019, 437, 255. [Google Scholar] [CrossRef] [Green Version]
- Bergquist, G.; Gutknecht, J.; Sheaffer, C.C.; Jungers, J.M. Plant Suppression and Termination Methods to Maintain Intermediate Wheatgrass (Thinopyrum intermedium) Grain Yield. Agriculture 2022, 12, 1638. [Google Scholar] [CrossRef]
- Jungers, J.M.; DeHaan, L.R.; Betts, K.J.; Sheaffer, C.C.; Wyse, D.L. Intermediate wheatgrass grain and forage yield responses to nitrogen fertilization. Agron. J. 2017, 109, 462–472. [Google Scholar] [CrossRef] [Green Version]
- Reilly, E.C.; Gutknecht, J.L.M.; Tautges, N.E.; Sheaffer, C.C.; Jungers, J.M. Nitrogen transfer and yield effects of legumes intercropped with the perennial grain crop intermediate wheatgrass. Field Crops Res. 2022, 286, 108627. [Google Scholar] [CrossRef]
- Tautges, N.E.; Jungers, J.M.; DeHaan, L.R.; Wyse, D.L.; Sheaffer, C.C. Maintaining grain yields of the perennial cereal intermediate wheatgrass in monoculture v. bi-culture with alfalfa in the Upper Midwestern USA. J. Agric. Sci. 2018, 156, 758–773. [Google Scholar] [CrossRef]
- Kering, M.K.; Butler, T.J.; Biermacher, J.T.; Guretzky, J.A. Biomass yield and nutrient removal rates of perennial grasses under nitrogen fertilization. Bioenergy Res. 2012, 5, 61–70. [Google Scholar] [CrossRef]
- Garten, C.T.; Smith, J.L.; Tyler, D.D.; Amonette, J.E.; Bailey, V.L.; Brice, D.J.; Castro, H.F.; Graham, R.L.; Gunderson, C.A.; Izaurralde, R.C.; et al. Intra-annual changes in biomass, carbon, and nitrogen dynamics at 4-year old switchgrass field trials in west Tennessee, USA. Agric. Ecosyst. Environ. 2010, 136, 177–184. [Google Scholar] [CrossRef]
- Redmann, R.E.; van Kessel, C. Nitrogen Budget and 15N Translocation in a Perennial Wheatgrass. Funct. Ecol. 1992, 6, 221–225. [Google Scholar]
- Syme, H.; Acuna, T.B.; Abrecht, D.; Wade, L.J. Nitrogen contributions in a windmill grass (Chloris truncata)–wheat (Triticum aestivum L.) system in south-western Australia. Soil Res. 2007, 45, 635–642. [Google Scholar] [CrossRef] [Green Version]
- Smaje, C. The strong perennial vision: A critical review. Agroecol. Sustain. Food Syst. 2015, 5, 471–499. [Google Scholar] [CrossRef]
- Puka-Beals, J.; Sheaffer, C.C.; Jungers, J.M. Forage yield and profitability of grain-type intermediate wheatgrass under different harvest schedules. Agroecosyst. Geosci. Environ. 2022, 5, e20274. [Google Scholar] [CrossRef]
- Hunter, M.C.; Sheaffer, C.C.; Culman, S.W.; Lazarus, W.F.; Jungers, J.M. Effects of defoliation and row spacing on intermediate wheatgrass II: Forage yield and economics. Agron. J. 2020, 112, 1862–1880. [Google Scholar] [CrossRef]
- Crews, T.E.; Kemp, L.; Bowden, J.H.; Murrell, E.G. How the Nitrogen Economy of a Perennial Cereal-Legume Intercrop Affects Productivity: Can Synchrony Be Achieved? Front. Sustain. Food Syst. 2023, 6, 755548. [Google Scholar] [CrossRef]
- Dodds, D.; Carter, J.; Meyer, D.; Haas, R. Grass Seed Production in North Dakota. Coop. Extensive Serv. North Dakota State Univ. Agric. Appl. Sci. 1987, R917, 1–30. [Google Scholar]
- Horton, H.; Asay, K.H.; Glover, T.F.; Young, S.A.; Haws, B.A.; Dewey, S.A.; Evans, J.O. Grass Seed Production Guide for Utah; Utah State University: Logan, UT, USA, 1990. [Google Scholar]
- Koeritz, E.J.; Watkins, E.; Ehlke, N.J. A split application approach to nitrogen and growth regulator management for perennial ryegrass seed production. Crop Sci. 2013, 53, 1762–1777. [Google Scholar] [CrossRef]
- Vleugels, T.; Rijckaert, G.; Gislum, R. Seed yield response to N fertilization and potential of proximal sensing in Italian ryegrass seed crops. Field Crop Res. 2017, 211, 37–47. [Google Scholar] [CrossRef]
- Nakamura, K.; Harter, T.; Hirono, Y.; Horino, H.; Mitsuno, T. Assessment of Root Zone Nitrogen Leaching as Affected by Irrigation and Nutrient Management Practices. Vadose Zone J. 2004, 3, 1353–1366. [Google Scholar] [CrossRef]
- Lasisi, A.A.; Akinremi, O.O.; Tenuta, M.; Cattani, D. Below-ground plant biomass and nitrogen uptake of perennial forage grasses and annual crops fertilized with pig manures. Agric. Ecosyst. Environ. 2018, 268, 1–7. [Google Scholar] [CrossRef]
- Moore, K.J.; Moser, L.E. Quantifying Developmental Morphology of Perennial Grasses. Crop Sci. 1995, 35, 37–43. [Google Scholar] [CrossRef]
- Smucker, A.J.M.; McBurney, S.L.; Srivastava, A.K. Quantitative separation of roots from compacted soil profiles by the hydropneumatic elutriation system. Agron. J. 1982, 74, 500–503. [Google Scholar] [CrossRef] [Green Version]
- Raison, R.J.; Connell, M.J.; Khanna, P.K. Methodology for studying fluxes of soil mineral-N in situ. Soil Biol. Biochem. 1987, 19, 521–530. [Google Scholar] [CrossRef]
- Sinsabaugh, R.L.; Reynolds, H.; Long, T.M. Rapid assay for amidohydrolase (urease) activity in environmental samples. Soil Biol. Biochem. 2000, 32, 2095–2097. [Google Scholar] [CrossRef]
- Doane, T.A.; Horwáth, W.R. Spectrophotometric determination of nitrate with a single reagent. Anal. Lett. 2003, 36, 2713–2722. [Google Scholar] [CrossRef]
- Schetter, A.; Lin, C.H.; Zumpf, C.; Jang, C.; Hoffmann, L.; Rooney, W.; Lee, D.K. Genotype-Environment-Management Interactions in Biomass Yield and Feedstock Composition of Photoperiod-Sensitive Energy Sorghum. Bioenergy Res. 2022, 15, 1017–1032. [Google Scholar] [CrossRef]
- Vogel, K.P.; Brejda, J.J.; Walters, D.T.; Buxton, D.R. Switchgrass Biomass Production in the Midwest USA. Agron. J. 2002, 94, 413–420. [Google Scholar] [CrossRef]
- Sanchez-Bragado, R.; Serret, M.D.; Araus, J.L. The nitrogen contribution of different plant parts to wheat grains: Exploring genotype, water, and nitrogen effects. Front. Plant Sci. 2017, 7, 1986. [Google Scholar] [CrossRef] [Green Version]
- Maeoka, R.E.; Sadras, V.O.; Ciampitti, I.A.; Diaz, D.R.; Fritz, A.K.; Lollato, R.P. Changes in the Phenotype of Winter Wheat Varieties Released Between 1920 and 2016 in Response to In-Furrow Fertilizer: Biomass Allocation, Yield, and Grain Protein Concentration. Front. Plant Sci. 2020, 10, 1786. [Google Scholar] [CrossRef] [Green Version]
- Sullivan, M.W.; Jiang, Z.; Hull, R.J. Root morphology and its relationship with nitrate uptake in Kentucky bluegrass. Crop Sci. 2000, 40, 765–772. [Google Scholar] [CrossRef]
- Lal, R.; Augustin, B. Carbon Sequestration in Urban Ecosystems; Springer: Berlin/Heidelberg, Germany, 2012. [Google Scholar]
- Huang, B.; Gao, H. Growth and Carbohydrate Metabolism of Creeping Bentgrass Cultivars. Crop Sci. 2000, 40, 1115–1120. [Google Scholar] [CrossRef]
- Liu, X.; Huang, B. Mowing effects on root production, growth, and mortality of creeping bentgrass. Crop Sci. 2002, 42, 1241–1250. [Google Scholar] [CrossRef]
- Lemus, R.; Parrish, D.J.; Abaye, O. Nitrogen-use dynamics in switchgrass grown for biomass. BioEnergy Res. 2008, 1, 153–162. [Google Scholar] [CrossRef]
- Smith, S.D.; Monson, R.K.; Anderson, J.E. Physiological Ecology of North American Desert Plants; Springer Science & Business Media: Berlin/Heidelberg, Germany, 1997. [Google Scholar]
- Wayman, S.; Bowden, R.D.; Mitchell, R.B. Seasonal Changes in Shoot and Root Nitrogen Distribution in Switchgrass (Panicum virgatum). Bioenergy Res. 2014, 7, 243–252. [Google Scholar] [CrossRef] [Green Version]
- Ryan, M.C.; Kachanoski, R.G.; Gillham, R.W. Overwinter soil nitrogen dynamics in seasonally frozen soils. Can. J. Soil Sci. 2000, 80, 541–550. [Google Scholar] [CrossRef]
- Malhi, S.S.; Nyborg, M. Increase in Mineral N in Soils During Winter and Loss of Mineral N During Early Spring in North-Central Alberta. Can. J. Soil Sci. 2010, 66, 397–409. [Google Scholar] [CrossRef]
- Biswell, H.H.; Weaver, J.E. Effect of Frequent Clipping on the Development of Roots and Tops of Grasses in Prairie Sod. Ecol. Soc. Am. 1933, 14, 368–390. [Google Scholar] [CrossRef] [Green Version]
- Shamoot, S.; McDonald, L.; Batholomew, W.V. Rhizo-deposition of organic debris in soil. Soil Sci. Soc. Am. J. 1968, 32, 817–820. [Google Scholar] [CrossRef]


| Sampling Time | Stage Index | Sample Date | DOY | GDDs |
|---|---|---|---|---|
| 1-year-old stand | ||||
| Spring regrowth | 1.3 | 7-May | 127 | 493 |
| Anthesis | 3.7 | 13-Jun | 164 | 1443 |
| Maturity | 4.9 | 21-Aug | 231 | 3339 |
| Fall regrowth | 1.5 | 23-Oct | 293 | 4523 |
| 2-year-old stand | ||||
| Spring regrowth | 1.3 | 2-May | 122 | 373 |
| Anthesis | 3.7 | 12-Jun | 162 | 1391 |
| Maturity | 4.9 | 13-Aug | 223 | 3109 |
| Fall regrowth | 1.5 | 29-Oct | 299 | 4589 |
| N Concentration (%) | Biomass Yield (kg ha−1) | Biomass N Yield (kg N ha−1) | Lodging | Height | PNUE | NIE | ||||||||||
|---|---|---|---|---|---|---|---|---|---|---|---|---|---|---|---|---|
| Factor | Total | Root | Shoot | Grain | Total | Root | Shoot | Grain | Total | Root | Shoot | Grain | Shoots | Shoots | ||
| 1-year-old stand | ||||||||||||||||
| Treatment | -- | 0.0024 | 0.0003 | 0.297 | 0.16 | 0.4004 | 0.2496 | 0.59 | 0.0947 | 0.137 | 0.0766 | 0.615 | 0.0141 | 0.905 | 0.001 | 0.1684 |
| Sampling time | -- | <0.0001 | <0.0001 | -- | <0.0001 | 0.0187 | <0.0001 | -- | <0.0001 | 0.6309 | <0.0001 | -- | -- | -- | <0.0001 | 0.0625 |
| Treatment X sampling time | -- | 0.0483 | 0.062 | -- | 0.4963 | 0.1241 | 0.4038 | -- | 0.2706 | 0.1296 | 0.5649 | -- | -- | -- | 0.3027 | 0.8124 |
| 2-year-old stand | ||||||||||||||||
| Treatment | -- | 0.0007 | 0.5997 | 0.007 | 0.6812 | 0.0902 | 0.1425 | 0.6 | 0.422 | 0.1543 | 0.0822 | 0.622 | 0.3125 | 0.13 | 0.5069 | 0.6898 |
| Sampling time | -- | 0.0012 | 0.0034 | -- | <0.0001 | <0.0001 | <0.0001 | -- | <0.0001 | <0.0001 | <0.0001 | -- | -- | -- | <0.0001 | 0.7093 |
| Treatment X sampling time | -- | 0.2018 | 0.6958 | -- | 0.7439 | 0.5387 | 0.8185 | -- | 0.8401 | 0.5568 | 0.877 | -- | -- | -- | 0.0545 | 0.9524 |
| Sampling Time | Biomass N Yield (kg N ha−1) | N Concentration (%) | Biomass Yield (kg ha−1) | PNUE | |||||
|---|---|---|---|---|---|---|---|---|---|
| Total | Root | Shoot | Root | Shoot | Total | Root | Shoot | Shoots | |
| 1-year-old stand | |||||||||
| Spring regrowth | 13.20 b | 8.89 a | 4.32 c | 1.6 a | 2.6 a | 749.09 b | 561.32 b | 187.77 b | 40.3 c |
| Anthesis | -- | -- | 130.47 a | -- | 2.5 a | -- | -- | 5291.04 a | 41.85 c |
| Maturity | 103.14 a | 7.89 a | 82.51 b | 1.1 b | 1.1 b | 8548.87 a | 730.92 ab | 7431.16 a | 91.92 a |
| Fall regrowth | 100.66 a | 8.83 a | 91.82 ab | 1.1 b | 1.4 b | 7287.57 a | 819.68 a | 6467.89 a | 73.01 b |
| 2-year-old stand | |||||||||
| Spring regrowth | 26.068 b | 16.20 b | 7.26 b | 1.1 a | 1.1 ab | 2217.4 c | 1545.19 b | 489.16 c | 73.15 b |
| Anthesis | -- | -- | 46.81 a | -- | 1.4 a | -- | -- | 3229.76 b | 71.58 b |
| Maturity | 112.39 a | 31.67 a | 63.79 a | 0.9 b | 0.9 b | 10680.2 a | 3356.47 a | 6787.51 a | 107.25 a |
| Fall regrowth | 76.5 c | 17.87 b | 58.63 a | 0.9 b | 1.4 a | 6148.7 b | 1956.18 b | 4192.51 b | 76.17 b |
| Factor | Mineral N (mg kg−1) | Mineralized N (mg kg−1) | Mineralization Rate (mg kg−1 day−1) | Soil N (%) |
|---|---|---|---|---|
| 1-year-old stand | ||||
| Treatment | 0.0005 | 0.0088 | 0.0169 | 0.3426 |
| Sampling time | <0.0001 | <0.0001 | <0.0001 | 0.0013 |
| Treatment X sampling time | 0.0029 | 0.1126 | 0.0804 | 7267 |
| 2-year-old stand | ||||
| Treatment | 0.1451 | 0.2031 | 0.258 | 0.3317 |
| Sampling time | 0.015 | 0.049 | 0.0562 | 0.0594 |
| Treatment X sampling time | 0.0533 | 0.0461 | 0.0574 | 0.039 |
Disclaimer/Publisher’s Note: The statements, opinions and data contained in all publications are solely those of the individual author(s) and contributor(s) and not of MDPI and/or the editor(s). MDPI and/or the editor(s) disclaim responsibility for any injury to people or property resulting from any ideas, methods, instructions or products referred to in the content. |
© 2023 by the authors. Licensee MDPI, Basel, Switzerland. This article is an open access article distributed under the terms and conditions of the Creative Commons Attribution (CC BY) license (https://creativecommons.org/licenses/by/4.0/).
Share and Cite
Dobbratz, M.; Jungers, J.M.; Gutknecht, J.L.M. Seasonal Plant Nitrogen Use and Soil N pools in Intermediate Wheatgrass (Thinopyrum intermedium). Agriculture 2023, 13, 468. https://doi.org/10.3390/agriculture13020468
Dobbratz M, Jungers JM, Gutknecht JLM. Seasonal Plant Nitrogen Use and Soil N pools in Intermediate Wheatgrass (Thinopyrum intermedium). Agriculture. 2023; 13(2):468. https://doi.org/10.3390/agriculture13020468
Chicago/Turabian StyleDobbratz, Michelle, Jacob M. Jungers, and Jessica L. M. Gutknecht. 2023. "Seasonal Plant Nitrogen Use and Soil N pools in Intermediate Wheatgrass (Thinopyrum intermedium)" Agriculture 13, no. 2: 468. https://doi.org/10.3390/agriculture13020468