Article

Positive Effect of High Zinc on Growth of Sedum alfredii

1
MOE Key Laboratory of Environment Remediation and Ecological Health, College of Natural Resource & Environmental Sciences, Zhejiang University, Hangzhou 310058, China
2
Key Laboratory of Subtropical Soil Science and Plant Nutrition of Zhejiang Province, College of Environmental and Resource Sciences, Zhejiang University, Hangzhou 310058, China
*
Author to whom correspondence should be addressed.
Agriculture 2023, 13(2), 400; https://doi.org/10.3390/agriculture13020400
Submission received: 12 January 2023 / Revised: 31 January 2023 / Accepted: 6 February 2023 / Published: 8 February 2023
(This article belongs to the Section Crop Production)

Abstract

:
Sedum alfredii Hance (S. alfredii) is a native hyperaccumulator plant species in China that has strong tolerance and accumulation ability for Zn and Cd. In addition, it is a good material for the phytoextraction of soil heavy metal pollutants. However, the specific effect of high Zn concentrations on the growth of S. alfredii and its metabolic mechanisms are not clear. Using an untargeted metabolomics method, we analysed the differential metabolites of the two ecotypes in S. alfredii roots under different Zn treatments. The results showed that high Zn levels significantly promoted plant growth in the hyperaccumulating ecotype (HE), while growth was inhibited in the non-hyperaccumulating ecotype (NHE). We detected 624 metabolites in the roots of S. alfredii. Under the high Zn treatment, lots of lipids and lipid-like molecules, such as glyceryl monooleate and 9,12,13-trihydroxyoctadecane-10-enoic acid, along with organic acids, such as lauramidopropylbetaine, L-malic acid, and their derivatives, decreased significantly in HE roots. Differential metabolites, such as some lipids and lipid-like molecules, were significantly upregulated in NHE roots. The above results indicate that the exogenous high Zn treatment induces the downregulation of HE differential metabolites in response to Zn, but significantly induces the upregulation of differential metabolites in NHE.

1. Introduction

Zinc (Zn) is an indispensable plant element that is vital to organisms for normal metabolic functions and mediates lots of plant physiological and biochemical reactions in plants [1,2]. Zn can change plant growth conditions by affecting the root dry matter quality, shoot biomass, and leaf area [3]. Zn regulates and activates related genes, affects protein synthesis and chloroplast development, and maintains the structural integrity of ribosomes and biofilm [1,4,5]. Zn plays an important role in plant metabolism such as the synthesis and activation of some enzymes, and metabolism of carbohydrates, lipids, and organic acid [6,7,8]. However, Zn may have serious toxic effects on plants at excessive levels [9,10,11]. Excessive Zn causes deficiencies of other essential nutrients, disturbs photosynthesis and transpiration, induces leaf chlorosis, and decreases plant growth and structural integrity [12,13,14]. Moreover, excessive Zn can disturb normal plant metabolic processes and cause oxidative damage, leading to the damage of RNA and DNA and the degradation of protein in plants [15,16]. Therefore, it is crucial to provide an optimum supply of Zn for plants to maintain normal metabolic functions to prevent deficiency and phytotoxicity [1,9].
Sedum alfredii Hance (S. alfredii) is a native hyperaccumulator plant found in China; it has strong tolerance and accumulation ability for Zn and Cd, and is a good material for phytoextraction of soil heavy metal pollutants [17]. The maximum Zn concentration in the shoots of HE is more than 20,000 mg/kg, which was approximately 20 times higher than that of its non-hyperaccumulating ecotype [18]. For HE, the high accumulation of Zn has no obvious toxic effect but promotes plant growth. The remediation efficiency of phytoremediation can be improved by increasing the biomass of HE. However, preliminary studies of S. alfredii have focused on Zn uptake, transport, and accumulation characteristics [19,20,21]; in contrast, few studies have paid attention to the phenomenon that appropriate concentrations of Zn may promote the growth of hyperaccumulator plants. Moreover, the specific effect of high Zn concentration on the growth of S. alfredii and its metabolic mechanisms are not clear.
Metabolomics technology can reveal complex physiological and biochemical mechanisms by measuring the changes in the type and quantity of endogenous metabolites [22,23,24]. It is important in the functional annotation of genes and understanding the relative relationship between metabolites and physiological changes [25,26]. Nowadays, liquid chromatography-mass spectrometry (LC-MS) has become a mature analytical, which enables the measurement of more compounds and becomes an ideal tool for metabolomics research [27,28]. Plants produce numerous types of metabolites, including primary and secondary metabolites, which is essential to cell maintenance, development, and reproduction [29,30]. Metabolomics can identify these metabolites, which is vital to screen the potentially associated species and metabolites and plays a guiding role in downstream experiments.
Studying the effect of high Zn on growth of S. alfredii and its metabolic mechanisms not only has a guiding role in the bio-enhancement of Zn in plants, but also provides the possibility to improve the efficiency of phytoremediation. Therefore, our study used two ecotypes of S. alfredii roots (hyper- and non-hyper accumulator ecotypes) and applied untargeted metabolomics to analyse the effect of different Zn treatments on the growth of S. alfredii. We also explored the metabolic pathways in which different metabolites may participate, further explaining the metabolite changes induced by Zn in hyperaccumulator plants. This study provides a theoretical basis for the optimisation of the phytoremediation technology for heavy metal-contaminated soil, and it can also provide a new perspective for interpreting the theory of plant Zn nutrition.

2. Materials and Methods

2.1. Plant Materials and Pre-Cultivation

Seeds of HE were obtained from an old Pb/Zn mine area in Zhejiang Province, China, and seeds of NHE were obtained from a tea plantation in Hangzhou, Zhejiang Province. Plants were cultivated in non-contaminated soil for several generations to minimize the internal metal content. After germination, the consistent growth seedlings were selected and transferred to pure water for 7 days, then subjected to ¼ and ½ strength nutrient solution for 4 d successively, and then pre-cultured in full strength nutrient solution. The nutrient solution formula and plant culture conditions were described by Tian et al. [31].

2.2. Plant Growth and Biomass

One-week-old seedlings of the two ecotypes were treated with different Zn concentrations (0.5, 5, 100, or 250 μM) for 21 days; these experiments were classified as low Zn (0.5 μM), control (5 μM), and excessive Zn (100 μM and 250 μM). Zn2+ was added as ZnSO4. At harvest, the plants were soaked in 20 mM Na2-EDTA for 15 min and rinsed three times with deionized water. The plants were then separated into roots, stems, and leaves and the fresh weight (biomass) of each sample was recorded.

2.3. Element Analysis

The harvested plants were oven dried at 65 °C for 72 h to a constant weight and dry weight was recorded. Dry plant samples from each treatment were digested with 5 mL HNO3 (1.0 M) and 1 mL H2O2 (1.0 M) at 180 °C. Zn and Cd contents were determined using an atomic absorption spectrophotometer (SP-3530AA).

2.4. Metabolite Measurements

Plant tissues (80 mg roots) were immediately frozen in liquid nitrogen immediately and grounded into a fine powder. Subsequently, 1000 μL of methanol/acetonitrile/H2O (2:2:1, v/v/v) was added to the homogenised solution for metabolite extraction. The mixture was centrifuged for 15 min (14,000× g, 4 °C). The supernatant was dried using a vacuum centrifuge. For LC-MS analysis, the samples were re-dissolved in 100 μL of an acetonitrile/water (1:1, v/v) solvent. Analyses were performed using an UHPLC (1290 Infinity LC, Agilent Technologies, Shanghai, China) coupled to a quadrupole time-of-flight (AB Sciex TripleTOF 6600) at Shanghai Applied Protein Technology Co., Ltd. (Shanghai, China).

2.5. Data Processing

The raw MS data (wiff.scan files) were converted to MzXML files using ProteoWizard MSConvert before being imported into the freely available XCMS software [32,33]. After normalisation to the total peak intensity, the processed data were analysed using the R package (ropls), where it was subjected to multivariate data analysis, including Pareto-scaled principal component analysis (PCA) and orthogonal partial least-squares discriminant analysis (OPLS-DA). The variable importance in the projection (VIP) value of each variable in the OPLS-DA model was calculated to indicate its contribution to the classification.

2.6. Statistical Analysis

All statistical analyses were performed using the SPSS v22.0 software. Single factor analysis of variance (ANOVA) was used to calculate and analyse the mean and standard deviation of each group of data.

3. Results

3.1. Effects of Zn on Plant Growth and Zn Concentration

After three weeks of treatment with different Zn levels, the biomass of the roots, stems, and leaves of HE increased significantly. Zn treatments at 100 μM and 250 μM, increased the root biomass by 23.4% and 43.9%, stem biomass by 21.9% and 22.0%, and leaf biomass by 30.9% and 41.0%, respectively, compared with that of the control at 5 μM. Low-Zn (0.5 μM) treatment significantly reduced the biomass of HE roots and stems by 25.7% and 12.6%, respectively. In contrast, excess Zn significantly inhibited NHE growth (Figure 1A,B). Compared with that of the control (5 μM Zn), the 100 μM and 250 μM Zn treatments decreased the biomass of roots by 14.4% and 57.1%, stems by 22.6% and 41.6%, and leaves by 21.3% and 50.0%, respectively. There was no significant effect on the biomass of NHE roots, stems, and leaves in the low Zn (0.5 μM Zn) treatment compared with that of the control (5 μM) (Figure 1B).
Both ecotypes showed significant differences in Zn concentrations at different Zn levels. An external Zn supply of 100/250 μM resulted in an increased in HE concentration by 2.54/4.06 times in roots, 1.19/1.67 times in stems, and 2.71/4.11 times in leaves, compared with that in the control (5 μM Zn). Low Zn (0.5 μM Zn) treatment significantly decreased the Zn concentration in HE roots, stems, and leaves (Figure 1C). The concentration of Zn in the HE was the highest in the stems or leaves. However, in NHE, the concentration of Zn was up to nine times higher in the roots than in the shoots (Figure 1C).

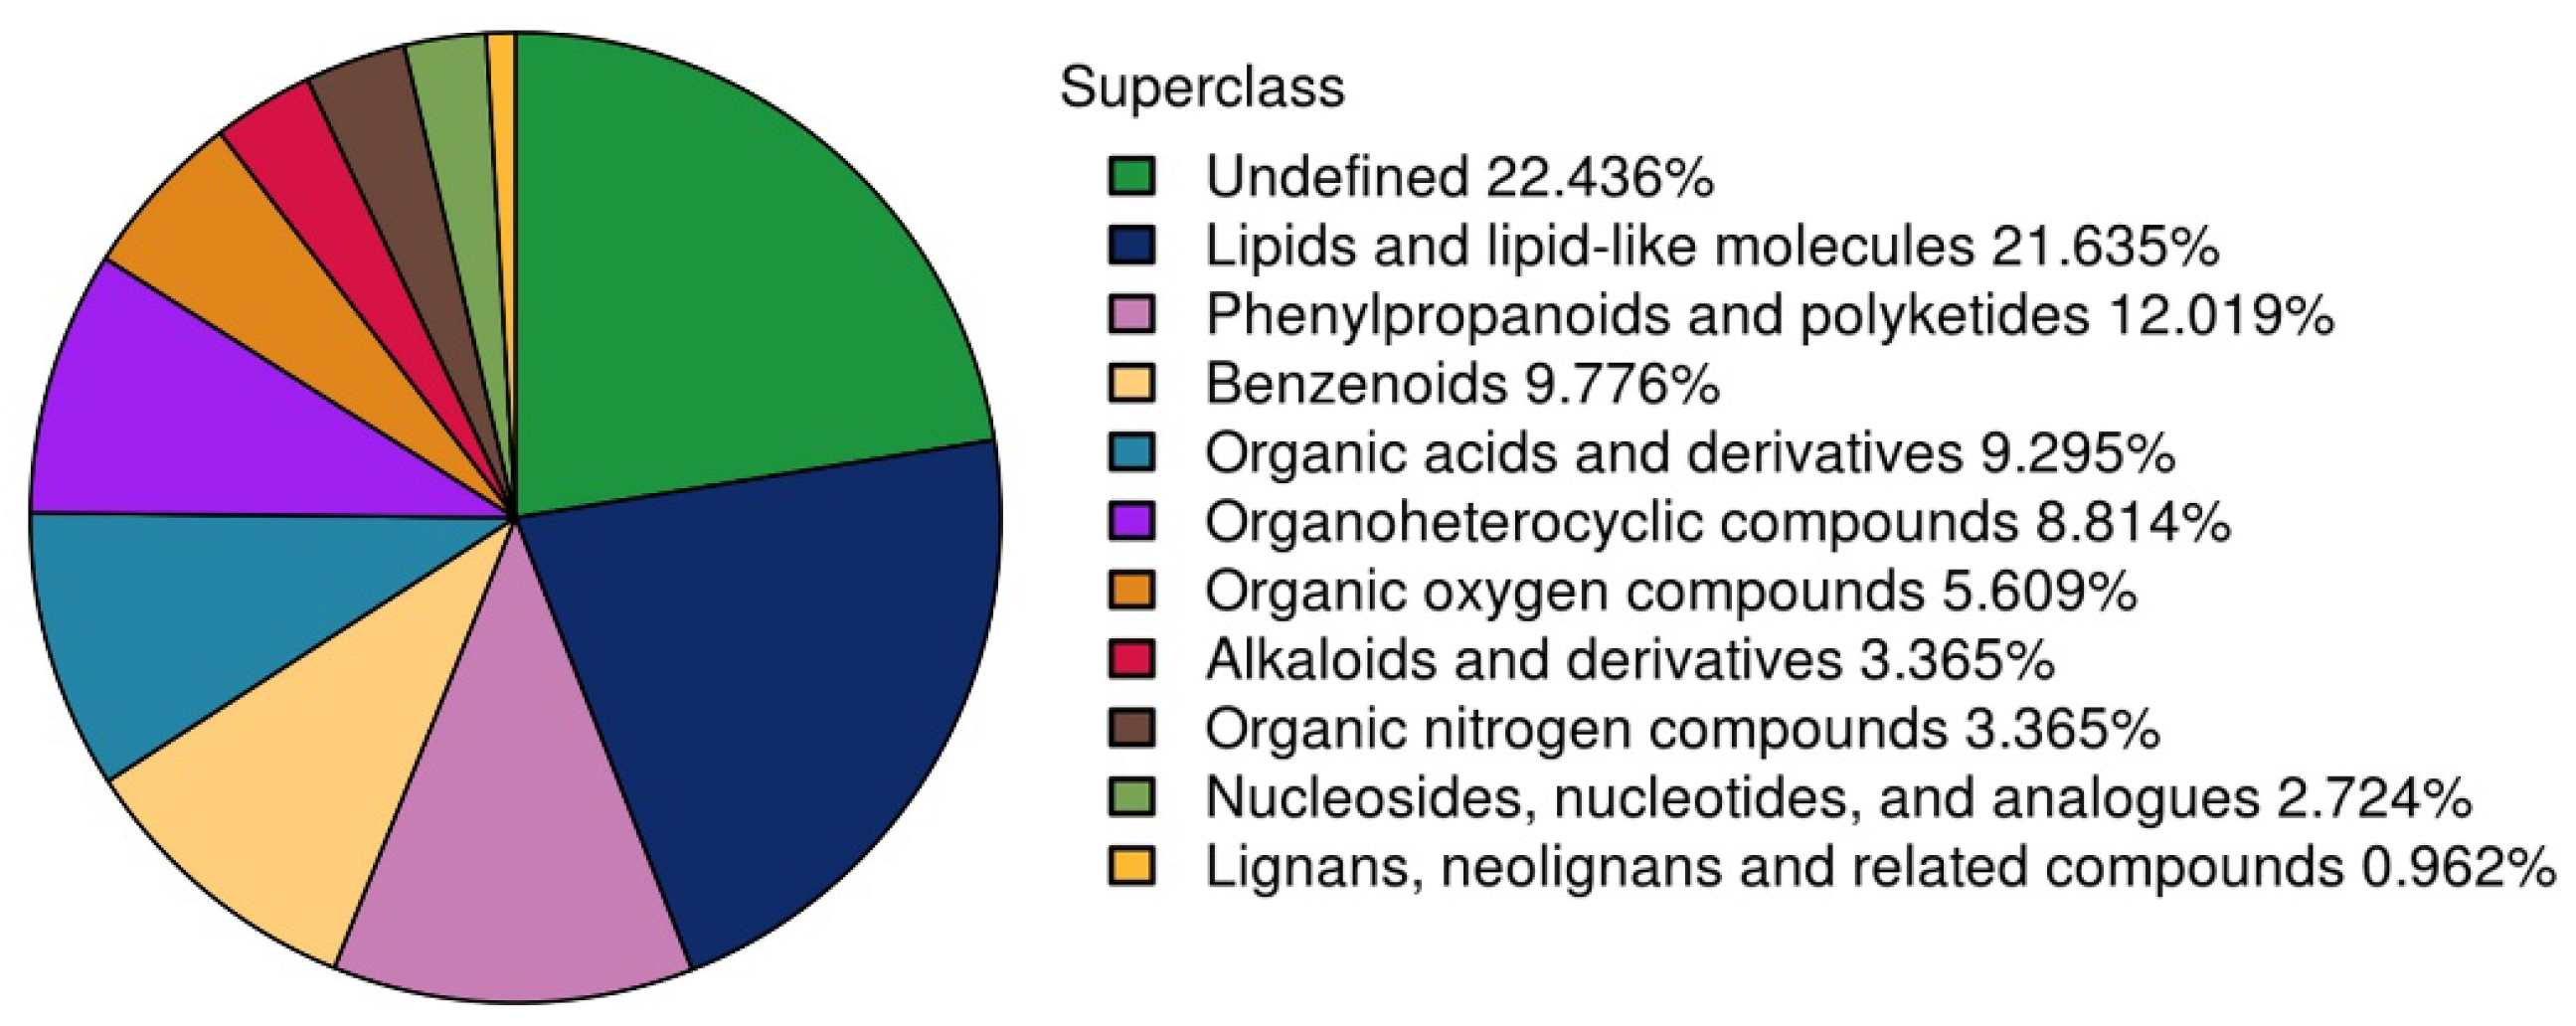
3.2. Sample Quality Inspection and Overview of the Metabolites Profiles

The total ion chromatogram (TIC) of quality control (QC) samples had a strong signal, large peak volume and strong reproducibility of retention time, indicating that the metabolomics results are reliable. Relative standard deviation (RSD) is an important indicator of reflecting the quality of test data [33]. The smaller the RSD, the better the stability of the instrument. In this test, under the two different ion modes, the proportion of the number of ion peaks with RSD ≤ 30%, among the total number of ion peaks of QC samples was >80%, indicating that the instrument was in good condition (Figure S1).
The chromatographic differences between the different sample groups were significant, and 624 metabolites were identified in total (Table S1). Subsequently, classification and statistics were performed according to the chemical taxonomy attributes (Figure 2). It was found that more than three-quarters of the metabolites could be classified as chemical attribute items, in which lipids and lipid-like molecules accounted for 21.6% of the total metabolites. Phenylpropane and polyketides accounted for 12.0% of the total metabolites.

3.3. Multidimensional Statistical Analysis

Metabolomic data have high dimensionality characteristics and a high correlation between variables. Generally, a multidimensional statistical analysis is used to reflect the differences between groups and variability within groups at the overall level. Through sample primary component analysis (PCA), it was observed that under the two detection modes of positive and negative ions, the repeats in the four treatments could gather together, and the samples of HE and NHE could be well separated, whereas the separation degree of samples between HE was higher than that of NHE (Figure 3). In conclusion, multidimensional statistical analysis showed that Zn treatment induced significant differences in root metabolites between the two ecotypes.

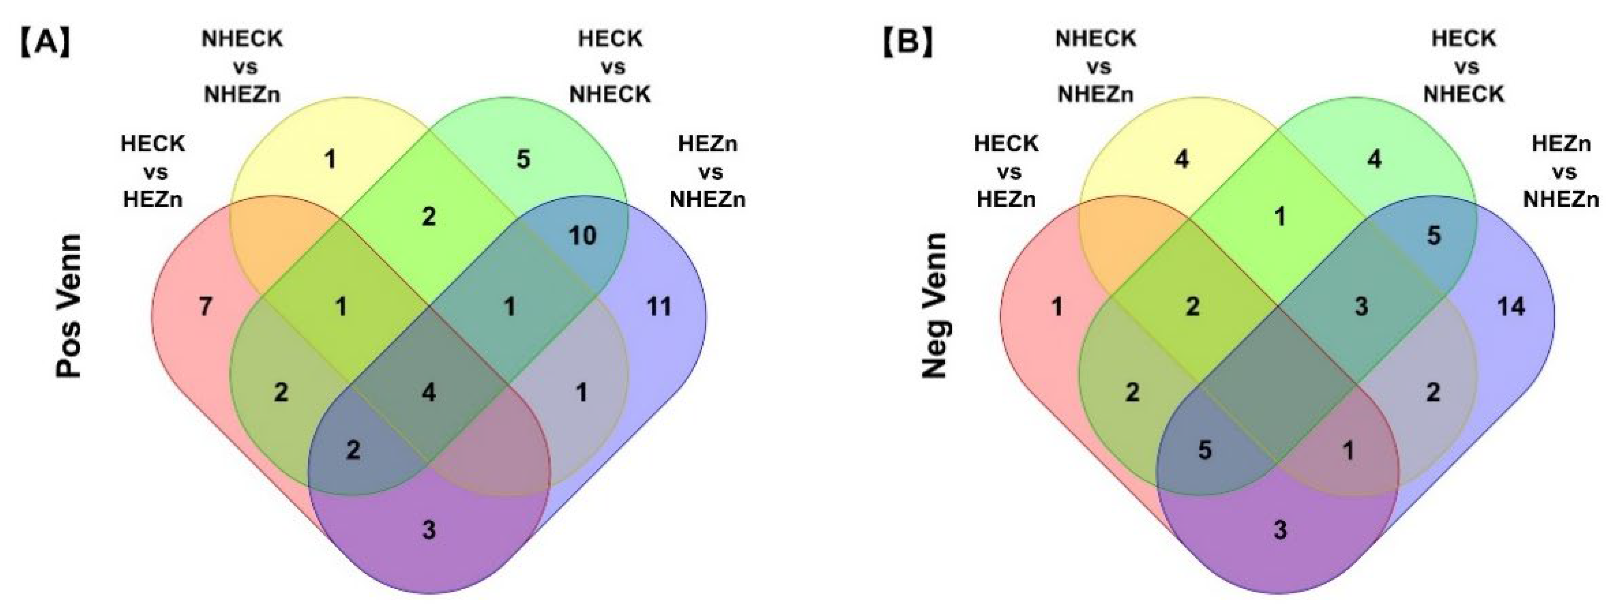
3.4. Fold Change Analysis

Fold change analysis (FC) is a commonly used univariate system, which can screen for metabolites with significant differences. We performed a significant difference analysis for all metabolites (including unclassified metabolites). We screened according to VIP > 1 and p < 0.05 (yellow background), and VIP > 1 and p < 0.1 (blue background). Differential metabolites of HEZn and NHEZn are listed in Table 1 and Table 2, respectively. Subsequent analyses mainly concentrated on the differential metabolites of VIP > 1 and p < 0.05, and the rest were only used for reference.
Under the induction of exogenous Zn, lots of lipids and lipid-like molecules in HE roots, such as glycerol monooleate and 9,12,13-trihydroxyoctadecane-10-enoic acid, as well as the organic acids and their derivatives, such as lauroamidopropyl betaine and L-malic acid, decreased significantly, indicating that HE under high-Zn treatment downregulated the differential metabolites (Figure 4). In general, the lipids and lipid-like molecules, organic heterocyclic compounds, and some undefined compounds in HE roots decreased, while those in NHE roots increased (Figure 5).
The appraisal of potential metabolites under different Zn treatments might contribute to revealing the specific effects of high Zn concentrations on the growth of S. alfredii and its metabolic mechanisms. We constructed a Venn diagram (Figure 6) to depict the shared metabolites of different expressions among HECK vs. HEZn, NHECK vs. NHEZn, HECK vs. NHECK HEZn, and NHEZn. In the positive ion mode, we found that the abundances of 2-Aminooctadecane-1,3,4-triol, Tetradecanoylcarnitine, DG(18:2(9Z,12Z)/18:2(9Z,12Z)), and PC32:4|PC14:1_18:3 showed an obvious change in response to Zn treatment, indicating that these four overlapping metabolites could be regarded as key metabolites.

3.5. KEGG Enrichment Analysis

To further explore the biological processes involved in the differential expression of metabolites induced by Zn, we annotated the differential metabolites using Kyoto Encyclopedia of Genes and Genomes (KEGG) pathways. By analysing the KEGG pathways of differential metabolites in HE roots induced by Zn, we found that these metabolites may be involved in proximal tubule bicarbonate reclamation of the excretory system, citrate cycle (TCA cycle), pyruvate of carbohydrate metabolism, carbon fixation in photosynthetic organisms of energy metabolism, glucagon signalling pathway of the endocrine system, linoleic acid metabolism of lipid metabolism, and taste transduction of sensory system (Figure 7). The enriched KEGG pathways of differential metabolites in NHE roots induced by Zn showed that these metabolites mainly participated in the biosynthesis of unsaturated fatty acids in lipid metabolism. The differential metabolites of NHE roots are involved in biological activities, such as environmental adaptation, aging, cell growth and death, and lipid metabolism (Figure 8).

4. Discussion

4.1. Effect of High Zn on Growth of S. alfredii

In general, high concentration of Zn will cause toxicity to plants. The toxicity of Zn first acts on the roots of plants, which manifests as damage to the root tip and the inhibition of root growth [34]. Toxicity then occurs in the upper part of the plants, limiting the synthesis of various sugars, acids, small molecular compounds, and other metabolites, affecting the normal physiological activities of the plant cells, resulting in plant growth retardation and dwarfing [35]. In our study, the root growth of NHE was inhibited and the plant was stunted under excessive Zn (Figure 1A), which is consistent with the general symptoms of Zn poisoning in plants. However, high Zn level did not inhibit the growth of HE, in contrast, it had a certain promoting effect. In addition, with the increase of Zn treatment level, the Zn concentration of HE and NHE increased, indicating that the higher the Zn concentration in the environment, the higher the Zn content absorbed by plants (Figure 1C). The Zn concentration in the stems of HE plants was the highest, while that in the roots of NHE plants was the highest. This resulted a large amount of Zn accumulation in the shoots (stems and leaves) of HE and a considerable part of Zn accumulation in the roots of NHE. This is related to the high accumulation capacity of HE for Zn. HE root cells induce cell wall methylation and hemicellulose modification after absorbing Zn [36,37], promote the root cell wall to resolve Zn, rapidly transport it to the shoots, and then participate in phloem retransfer in the stems [21]. However, Zn is mainly adsorbed on the cell wall or stored in vacuoles, and is not transported to the shoots in NHE [18].

4.2. Changes of Organic Acids and Their Derivatives Induced by Zn

At present, few studies are made on the metabolomics of S. alfredii, making it difficult to compare and identify many metabolites. In the present study, we found that the differential metabolites in HE roots showed a downward trend under the induction of exogenous Zn. These metabolites may not only directly participate in the regulation of plant growth but also indirectly promote plant growth by alleviating stress damage. Previous studies have shown that organic acids are closely related to the storage and transport of Zn [15,21]. Organic acids such as malate, citrate, and oxalate have been reported to transport metals through the xylem and are involved in sequestering ions in vacuoles [38]. Malate chelates Zn and is mainly involved in chelating cytosolic ions [39]. Malic acid may be chelated with Zn, and the reduction of malic acid in roots may cause HE roots to absorb more Zn and transport it upward. Under Zn deficiency, organic acids (such as malic acid) accumulate in plant roots and exude low-molecular-weight organic acids from roots to seek more Zn that may be released from the environment [40]. In our study, we identified some organic acids and their derivatives, such as lauramidopropylbetaine and L-malic acid. Treatment with 100 μM Zn promoted the growth of HE and reduced the level of organic acids and their derivatives, such as lauramidopropylbetaine and L-malic acid.

4.3. Changes of Lipids and Lipid Molecules Induced by Zn

Lipids are an important component of plant cells and form the basis of cell membranes and various plasma membranes. They also provide energy for basic metabolic activities and participate in the responses of plants to environmental changes. Plant lipid metabolism is an important process for providing energy to cells and is a source of signalling compounds [41]. In this study, it was found that lipids and lipid molecules accounted for an important share of Zn-responsive metabolites in the roots of S. alfredii, especially phosphate esters and fatty acids. Phosphate esters are related to the stress responses to such as external heavy metals, such as the toxic aluminium or cadmium, which strongly affect the enzyme and metabolic processes in plants through chelates, while resistant plants can reduce this damage through lipid remodelling [42]. Fatty acids play an important roles in plant plasma membrane stability, stress resistance, tissue aging [43], and seed development [44]. Zn deficiency can induce an increase in the fatty acid content of roots [45]. In our study, we found that lipids and lipid-like molecules such as glyceryl monooleate and 9,12,13-trihydroxyoctadecane-10-enoic acid, and some other compounds in HE roots decreased, while some lipids and lipid-like molecules in NHE roots increased under 100 μM Zn. We speculate that the decrease in the lipid content of HE roots after Zn treatment may be related to Zn supplementation compared with the control (5 μM Zn). However, excessive Zn is harmful to NHE. The biomass of NHE decreased under the high Zn treatment and the abundance of some lipids and lipid-like molecules in NHE roots increased under 100 μM Zn.

5. Conclusions

The results of this study showed that high Zn significantly promote plant growth in HE but inhibited growth in NHE. S. alfredii respondes to a high-Zn environment by inducing changes in lipids, organic acids, and other metabolites. These results provide metabonomic data and support for Zn to promote the growth of hyperaccumulating ecotype, which is of great significance for understanding the Zn tolerance mechanism of hyperaccumulating ecotype and the optimisation of the phytoremediation technology for heavy metal-contaminated soil.

Supplementary Materials

The following supporting information can be downloaded at: https://www.mdpi.com/article/10.3390/agriculture13020400/s1, Figure S1: Data quality evaluation of instrument of QC. [A] Positive and [C] Negative sample total ion current (TIC) of QC. [B] Positive and [D] Negative sample relative standard deviation (RSD) of QC; Table S1: Identified metabolites (624 metabolites were identified in total).

Author Contributions

Conceptualization, C.X., H.Y. and L.L.; Data Curation, C.X. and H.Y.; Writing—Original Draft Preparation, C.X.; Writing—Review & Editing, C.X., H.Y. and L.L.; Visualization, L.L.; Supervision, L.L.; Project Administration, L.L.; Funding Acquisition, L.L. All authors have read and agreed to the published version of the manuscript.

Funding

This work was supported by projects from the National Natural Science Foundation of China (Nos. 41977130 and 41877116), and projects from the Natural Science Foundation of Zhejiang Province (No. LZ22D010004).

Institutional Review Board Statement

Not applicable.

Informed Consent Statement

Not applicable.

Data Availability Statement

Not applicable.

Conflicts of Interest

The authors declare no conflict of interest.

References

  1. Sturikova, H.; Krystofova, O.; Huska, D.; Adam, V. Zinc, zinc nanoparticles and plants. J. Hazard. Mater. 2018, 349, 101–110. [Google Scholar] [CrossRef]
  2. Broadley, M.R.; White, P.J.; Hammond, J.P.; Zelko, I.; Lux, A. Zinc in plants. New Phytol. 2007, 173, 677–702. [Google Scholar] [CrossRef] [PubMed]
  3. Hussain, A.; Zahir, Z.A.; Ditta, A.; Tahir, M.U.; Ahmad, M.; Mumtaz, M.Z.; Hayat, K.; Hussain, S. Production and implication of bio-activated organic fertilizer enriched with zinc-solubilizing bacteria to boost up maize (Zea mays L.) production and biofortification under two cropping seasons. Agronomy 2020, 10, 39. [Google Scholar] [CrossRef]
  4. Noman, A.; Aqeel, M.; Khalid, N.; Islam, W.; Sanaullah, T.; Anwar, M.; Khan, S.; Ye, W.; Lou, Y. Zinc finger protein transcription factors: Integrated line of action for plant antimicrobial activity. Microb. Pathog. 2019, 132, 141–149. [Google Scholar] [CrossRef] [PubMed]
  5. Hansch, R.; Mendel, R.R. Physiological functions of mineral micronutrients (Cu, Zn, Mn, Fe, Ni, Mo, B, Cl). Curr. Opin. Plant Biol. 2009, 12, 259–266. [Google Scholar] [CrossRef]
  6. Palmer, C.M.; Guerinot, M.L. Facing the challenges of Cu, Fe and Zn homeostasis in plants. Nat. Chem. Biol. 2009, 5, 333–340. [Google Scholar] [CrossRef]
  7. Cakmak, I. Possible roles of zinc in protecting plant cells from damage by reactive oxygen species. New Phytol. 2000, 146, 185–205. [Google Scholar] [CrossRef]
  8. Castillo-González, J.; Ojeda-Barrios, D.; Hernández-Rodríguez, A.; González-Franco, A.C.; Robles-Hernández, L.; López-Ochoa, G.R. Zinc Metalloenzymes in Plants. Interciencia 2018, 43, 242–248. [Google Scholar]
  9. Natasha, N.; Shahid, M.; Bibi, I.; Iqbal, J.; Khalid, S.; Murtaza, B.; Bakhat, H.F.; Farooq, A.B.U.; Amjad, M.; Hammad, H.M.; et al. Zinc in soil-plant-human system: A data-analysis review. Sci. Total Environ. 2021, 808, 152024. [Google Scholar] [CrossRef]
  10. Wei, C.; Jiao, Q.; Agathokleous, E.; Liu, H.; Li, G.; Zhang, J.; Fahad, S.; Jiang, Y. Hormetic effects of zinc on growth and antioxidant defense system of wheat plants. Sci. Total Environ. 2022, 807 Pt 2, 150992. [Google Scholar] [CrossRef]
  11. Gu, H.-H.; Zhan, S.-S.; Wang, S.-Z.; Tang, Y.-T.; Chaney, R.L.; Fang, X.-H.; Cai, X.-D.; Qiu, R.-L. Silicon-mediated amelioration of zinc toxicity in rice (Oryza sativa L.) seedlings. Plant Soil 2012, 350, 193–204. [Google Scholar] [CrossRef] [Green Version]
  12. Bankaji, I.; Pérez-Clemente, R.; Caçador, I.; Sleimi, N. Accumulation potential of Atriplex halimus to zinc and lead combined with NaCl: Effects on physiological parameters and antioxidant enzymes activities. S. Afr. J. Bot. 2019, 123, 51–61. [Google Scholar] [CrossRef]
  13. Chakraborty, S.; Mishra, A.K. Mitigation of zinc toxicity through differential strategies in two species of the cyanobacterium Anabaena isolated from zinc polluted paddy field. Environ. Pollut. 2020, 263 Pt B, 114375. [Google Scholar] [CrossRef]
  14. Mateos-Naranjo, E.; Perez-Romero, J.A.; Redondo-Gómez, S.; Mesa-Marín, J.; Castellanos, E.M.; Davy, A.J. Salinity alleviates zinc toxicity in the saltmarsh zinc-accumulator Juncus acutus. Ecotoxicol. Environ. Saf. 2018, 163, 478–485. [Google Scholar] [CrossRef] [PubMed]
  15. Bernardy, K.; Farias, J.G.; Pereira, A.S.; Dorneles, A.O.S.; Bernardy, D.; Tabaldi, L.A.; Neves, V.M.; Dressler, V.L.; Nicoloso, F.T. Plants’ genetic variation approach applied to zinc contamination: Secondary metabolites and enzymes of the antioxidant system in Pfaffia glomerata accessions. Chemosphere 2020, 253, 126692. [Google Scholar] [CrossRef] [PubMed]
  16. Sidhu, G.P.S.; Bali, A.S.; Singh, H.P.; Batish, D.R.; Kohli, R.K. Insights into the tolerance and phytoremediation potential of Coronopus didymus L. (Sm) grown under zinc stress. Chemosphere 2019, 244, 125350. [Google Scholar] [CrossRef] [PubMed]
  17. Yang, X.E.; Long, X.X.; Ye, H.B.; He, Z.L.; Calvert, D.V.; Stoffella, P.J. Cadmium tolerance and hyperaccumulation in a new Zn-hyperaccumulating plant species (Sedum alfredii Hance). Plant Soil 2004, 259, 181–189. [Google Scholar] [CrossRef]
  18. Yang, X.E.; Li, T.Q.; Long, X.X.; Xiong, Y.H.; He, Z.L.; Stoffella, P.J. Dynamics of zinc uptake and accumulation in the hyperaccumulating and non-hyperaccumulating ecotypes of Sedum alfredii Hance. Plant Soil 2006, 284, 109–119. [Google Scholar] [CrossRef]
  19. Li, T.-Q.; Yang, X.-E.; Jin, X.-F.; He, Z.-L.; Stoffella, P.-J.; Hu, Q.-H. Root responses and metal accumulation in two contrasting ecotypes of Sedum alfredii Hance under lead and zinc toxic stress. J. Environ. Sci. Health Part A-Toxic/Hazard. Subst. Environ. Eng. 2005, 40, 1081–1096. [Google Scholar]
  20. Li, T.; Yang, X.; Lu, L.; Islam, E.; He, Z. Effects of zinc and cadmium interactions on root morphology and metal translocation in a hyperaccumulating species under hydroponic conditions. J. Hazard. Mater. 2009, 169, 734–741. [Google Scholar] [CrossRef]
  21. Lu, L.; Tian, S.; Zhang, J.; Yang, X.; Labavitch, J.M.; Webb, S.M.; Latimer, M.; Brown, P.H. Efficient xylem transport and phloem remobilization of Zn in the hyperaccumulator plant species Sedum alfredii. New Phytol. 2013, 198, 721–731. [Google Scholar] [CrossRef] [PubMed]
  22. Patti, G.J.; Yanes, O.; Siuzdak, G. Innovation: Metabolomics: The apogee of the omics trilogy. Nat. Rev. Mol. Cell Biol. 2012, 13, 263–269. [Google Scholar] [CrossRef] [PubMed] [Green Version]
  23. Wang, Y.; Xu, L.; Shen, H.; Wang, J.; Liu, W.; Zhu, X.; Wang, R.; Sun, X.; Liu, L. Metabolomic analysis with GC-MS to reveal potential metabolites and biological pathways involved in Pb &Cd stress response of radish roots. Sci. Rep. 2015, 5, 18296. [Google Scholar] [PubMed]
  24. Wang, J.; Chen, X.; Chu, S.; You, Y.; Chi, Y.; Wang, R.; Yang, X.; Hayat, K.; Zhang, D.; Zhou, P. Comparative cytology combined with transcriptomic and metabolomic analyses of Solanum nigrum L. in response to Cd toxicity. J. Hazard. Mater. 2022, 423, 127168. [Google Scholar] [CrossRef]
  25. Ghatak, A.; Chaturvedi, P.; Weckwerth, W. Metabolomics in Plant Stress Physiology. Adv. Biochem. Eng. Biotechnol. 2018, 164, 187–236. [Google Scholar]
  26. Tang, Q.; Zheng, X.; Chen, W.; Ye, X.; Tu, P. Metabolomics reveals key resistant responses in tomato fruit induced by Cryptococcus laurentii. Food Chem. Mol. Sci. 2022, 4, 100066. [Google Scholar] [CrossRef]
  27. Ogura, T.; Bamba, T.; Fukusaki, E. Development of a practical metabolite identification technique for non-targeted metabolomics. J. Chromatogr. A 2013, 1301, 73–79. [Google Scholar] [CrossRef]
  28. Zhang, X.; Wang, X.; Ayala, J.; Liu, Y.; An, J.; Wang, D.; Cai, Z.; Hou, R.; Zhang, M. Possible Effects of Early Maternal Separation on the Gut Microbiota of Captive Adult Giant Pandas. Animals 2022, 12, 2587. [Google Scholar] [CrossRef]
  29. Yeo, H.J.; Baek, S.-A.; Sathasivam, R.; Kim, J.K.; Park, S.U. Metabolomic analysis reveals the interaction of primary and secondary metabolism in white, pale green, and green pak choi (Brassica rapa subsp. chinensis). Appl. Biol. Chem. 2021, 64, 3. [Google Scholar] [CrossRef]
  30. Erb, M.; Kliebenstein, D.J. Plant Secondary Metabolites as Defenses, Regulators, and Primary Metabolites: The Blurred Functional Trichotomy. Plant Physiol. 2020, 184, 39–52. [Google Scholar] [CrossRef]
  31. Tian, S.; Lu, L.; Zhang, J.; Wang, K.; Brown, P.; He, Z.; Liang, J.; Yang, X. Calcium protects roots of Sedum alfredii H. against cadmium-induced oxidative stress. Chemosphere 2011, 84, 63–69. [Google Scholar] [CrossRef] [PubMed]
  32. Gu, Z.; Li, L.; Tang, S.; Liu, C.; Fu, X.; Shi, Z.; Mao, H. Metabolomics Reveals that Crossbred Dairy Buffaloes Are More Thermotolerant than Holstein Cows under Chronic Heat Stress. J. Agric. Food Chem. 2018, 66, 12889–12897. [Google Scholar] [CrossRef] [PubMed]
  33. Shen, X.; Gong, X.; Cai, Y.; Guo, Y.; Tu, J.; Li, H.; Zhang, T.; Wang, J.; Xue, F.; Zhu, Z.-J. Normalization and integration of large-scale metabolomics data using support vector regression. Metabolomics 2016, 12, 89. [Google Scholar] [CrossRef]
  34. Dos Santos, L.R.; da Silva, B.R.S.; Pedron, T.; Batista, B.L.; Lobato, A.K.D.S. 24-Epibrassinolide Improves Root Anatomy and Antioxidant Enzymes in Soybean Plants Subjected to Zinc Stress. J. Soil Sci. Plant Nutr. 2020, 20, 105–124. [Google Scholar] [CrossRef]
  35. Anjum, N.A.; Singh, H.P.; Khan, M.I.R.; Masood, A.; Per, T.S.; Negi, A.; Batish, D.R.; Khan, N.; Duarte, A.; Pereira, E.; et al. Too much is bad-an appraisal of phytotoxicity of elevated plant-beneficial heavy metal ions. Environ. Sci. Pollut. Res. 2015, 22, 3361–3382. [Google Scholar] [CrossRef] [PubMed]
  36. Guo, X.; Liu, Y.; Zhang, R.; Luo, J.; Song, Y.; Li, J.; Wu, K.; Peng, L.; Liu, Y.; Du, Y.; et al. Hemicellulose modification promotes cadmium hyperaccumulation by decreasing its retention on roots in Sedum alfredii. Plant Soil 2020, 447, 241–255. [Google Scholar] [CrossRef]
  37. Guo, X.; Luo, J.; Du, Y.; Li, J.; Liu, Y.; Liang, Y.; Li, T. Coordination between root cell wall thickening and pectin modification is involved in cadmium accumulation in Sedum alfredii. Environ. Pollut. 2021, 268, 115665. [Google Scholar] [CrossRef]
  38. Rauser, W.E. Structure and function ofmetal chelators produced by plants. The case for organic acids, amino acids, phytin and metallothioneins. Cell Biochem. Biophys. 1999, 31, 19–48. [Google Scholar] [CrossRef]
  39. Mathys, W. The Role of Malate, Oxalate, and Mustard Oil Glucosides in the Evolution of ZincResistance in Herbage Plants. Physiol. Plant. 1977, 40, 130–136. [Google Scholar] [CrossRef]
  40. Broadley, M.R.; Rose, T.; Frei, M.; Pariasca-Tanaka, J.; Yoshihashi, T.; Thomson, M.; Hammond, J.P.; Aprile, A.; Close, T.J.; Ismail, A.M.; et al. Response to zinc deficiency of two rice lines with contrasting tolerance is determined by root growth maintenance and organic acid exudation rates, and not by zinc-transporter activity. New Phytol. 2010, 186, 400–414. [Google Scholar]
  41. Lavell, A.A.; Benning, C. Cellular Organization and Regulation of Plant Glycerolipid Metabolism. Plant Cell Physiol. 2019, 60, 1176–1183. [Google Scholar] [CrossRef] [PubMed]
  42. Ruelland, E.; Kravets, V.; Derevyanchuk, M.; Martinec, J.; Zachowski, A.; Pokotylo, I. Role of phospholipid signalling in plant environmental responses. Environ. Exp. Bot. 2015, 114, 129–143. [Google Scholar] [CrossRef]
  43. Rontani, J.; Rabourdin, A.; Pinot, F.; Kandel, S.; Aubert, C. Visible light-induced oxidation of unsaturated components of cutins: A significant process during the senescence of higher plants. Phytochemistry 2005, 66, 313–321. [Google Scholar] [CrossRef] [PubMed]
  44. Smith, M.A.; Moon, H.; Chowrira, G.; Kunst, L. Heterologous expression of a fatty acid hydroxylase gene in developing seeds of Arabidopsis thaliana. Planta 2003, 217, 507–516. [Google Scholar] [CrossRef] [PubMed]
  45. Mohamed, A.A.; Khalil, I.; Varanini, Z.; Pinton, R. Increase in NAD(P)H-dependent generation of active oxygen species and changes in lipid composition of microsomes isolated from roots of zinc-deficient bean plants. J. Plant Nutr. 2000, 23, 285–295. [Google Scholar] [CrossRef]
Figure 1. Hyperaccumulating ecotype (HE) and non-hyperaccumulating ecotype (NHE) of S. alfredii treated with 0.5, 5, 100, or 250 μM Zn for 21 days. (A) Phenotype of plants Side view. Scale bar: 10 cm. (B) Biomass of plants. (C) Zn Concentration of in plants. Bars: means ± SD (n = 5); different letters: significant (p < 0.05).
Agriculture 13 00400 g001
Figure 2. Identified metabolites proportion in each chemical classification of HE and NHE treated with 5 or 100 μM Zn for 24 h. The colour blocks in the figure express different chemical attribute classification items, and metabolites without chemical classification are defined as ‘undefined’.
Agriculture 13 00400 g002
Figure 3. Principal component analysis (PCA) of the HE and NHE treated with 5 μM Zn (CK) or 100 μM Zn for 24 h. (A) Positive (PCA). (B) Negative (PCA). Different colours represent different treatments.
Agriculture 13 00400 g003
Figure 4. Classification of differential metabolites of HE treated with 5 or 100 μM Zn for 24 h. Different colours represent different chemical classifications. The abscissa represents the multiple difference, where positive and negative numbers represent upward and downward adjustments, respectively.
Agriculture 13 00400 g004
Figure 5. Classification of differential metabolites of NHE treated with 5 or 100 μM Zn for 24 h. Different colours represent different chemical classifications. The abscissa represents the multiple difference, where positive and negative numbers represent upward and downward adjustments, respectively.
Agriculture 13 00400 g005
Figure 6. Comparison of the different metabolites of HE and NHE treated with 5 μM Zn (CK) or 100 μM Zn for 24 h. Venn diagram of differential metabolites in (A) positive ion mode and (B) negative ion mode. Different circles in the figure represent different comparison groups.
Agriculture 13 00400 g006
Figure 7. Map of enriched KEGG pathways of HE treated with 5 or 100 μM Zn for 24 h. The abscissa represents the impact factor; circle size represents the number of metabolites; the colour represents the significance, where the deeper the red the greater the significance. Annotation colours are classified according to the channel.
Agriculture 13 00400 g007
Figure 8. Map of enriched KEGG pathways of NHE treated with 5 or 100 μM Zn for 24 h. The abscissa represents the impact factor; circle size represents the number of metabolites; the colour represents the significance, where the deeper the red the greater the significance. Annotation colours are classified according to the channel.
Agriculture 13 00400 g008
Table 1. Significantly different metabolites in Zn vs. CK (HE). Notes: adduct ion information of the compound (adduct), Name of Metabolite (Name), Variable Importance for the Projection (VIP), Fold Change (FC, represents the multiple difference), p value (p), mass-to-charge ratio (m/z), retention time of metabolites on the chromatography [rt (s)]. Yellow background means VIP > 1 and p < 0.05, Blue background means VIP > 1 and p < 0.1.
AdductNameVIPFCpm/zrt (s)
[M+H]+Tetradecanoylcarnitine3.760.210.0037210.99
[M+H−H2O]+12,19,20-Trihydroxy-14-methylenegeranylnerol3.840.280.0033710.88
[M+H]+1-Hexadecanoyl-sn-glycero-3-phosphoethanolamine1.440.570.0045410.89
[M+H]+Glyceryl monooleate1.340.340.0035711.25
[M+H]+3alpha,17beta-Dihydroxy-5alpha-androstane2.060.480.0029311.51
[M+H]+Anileridine1.650.440.003537.35
[M+H]+1-Stearoyl-sn-glycero-3-phosphocholine1.050.560.0052411.42
[M+H]+2-Aminooctadecane-1,3,4-triol2.210.570.003188.50
[M]+Lauramidopropylbetaine1.180.210.003438.88
[M+H]+[4,6-diethyl-6-(4-ethyl-2-methyloctyl)-3H-1,2-dioxin-3-yl]acetic acid1.020.530.0035510.30
[M+NH4]+1-O-linoleoyl-3-O-beta-D-galactopyranosyl-syn-glycerol1.060.630.0053410.55
[M+H-H2O]+5-dodecyl-4-hydroxy-4-methylcyclopent-2-en-1-one4.370.720.0026310.88
[M+Na]+Deoxykhivorin1.020.160.0059311.71
[M+H]+6-{9a,11a-dimethyl-1H,2H,3H,3aH,3bH,4H,8H,9H,9bH,10H,11H-cyclopenta[a]phenanthren-1-yl}-3-ethyl-2-methylheptane1.571.180.0139712.65
[M+H]+Lupenone1.260.280.0142512.98
[M+Na]+3-Deoxo-3-beta-Acetoxydeoxydihydrogedunin2.060.050.0253512.17
[M+H-H2O]+DG(18:2(9Z,12Z)/18:2(9Z,12Z))3.110.730.0260012.27
[M+H]+Fenpropimorph2.000.850.0330411.19
[M+H]+PC 32:4|PC 14:1_18:32.840.620.0472712.16
[M-H]−Linoleic acid2.070.530.0027911.30
[M−H]−2-Azaniumylethyl (3-hexadecanoyloxy-2-hydroxypropyl) phosphate1.580.460.0045210.88
[M−H]−(Z)-5,8,11-Trihydroxyoctadec-9-enoic acid2.410.400.003297.35
[M−H]−(15Z)-9,12,13-Trihydroxy-15-octadecenoic acid6.880.380.003297.85
[M−H]−PA 36:5|PA 18:2_18:31.840.370.0069312.14
[M−H]−PA 36:4|PA 18:2_18:21.350.530.0069512.25
[M−H]−9,12,13-Trihydroxyoctadec-10-enoic acid1.820.370.003297.53
[M+HCOO]−[2-Hydroxy-3-[3,4,5-trihydroxy-6-(hydroxymethyl)oxan-2-yl]oxypropyl] octadeca-9,12-dienoate1.050.580.0056110.54
[M−H]−9-Hexadecenoic acid1.590.260.0025311.15
[M+HCOO]−[2-Hydroxy-3-[3,4,5-trihydroxy-6-[[3,4,5-trihydroxy-6-(hydroxymethyl)oxan-2-yl]oxymethyl]oxan-2-yl]oxypropyl] octadeca-9,12,15-trienoate1.100.540.007219.88
[M−H]−L-Malic acid2.600.490.001330.74
[M+H]+PE 34:2|PE 16:0_18:21.060.390.0571712.34
[M+H]+Palmitic amide4.910.830.0825611.07
[M+ACN+H]+5-[(1S,4aS,8aS)-Decahydro-5,5,8a-trimethyl-2-methylene-1-naphthalenyl]-3-methyl-, (2E)-2-penten-1-ol1.250.840.0933211.67
[M−H]−PMeOH 34:3|PMeOH 16:0_18:31.750.550.0668312.27
[M−H]−PMeOH 34:2|PMeOH 16:0_18:23.680.650.0968512.39
Table 2. Significantly different metabolites in Zn vs. CK (NHE). Notes: adduct ion information of the compound (adduct), name of metabolite (Name), variable importance for the projection (VIP), fold change (FC, representing multiple differences), p value (p), mass-to-charge ratio (m/z), retention time of metabolites on the chromatography [rt (s)]. Yellow background means VIP > 1 and p < 0.05, Blue background means VIP > 1 and p < 0.1.
AdductNameVIPFCpm/zrt (s)
[M+H]+MMPE 34:2|MMPE 16:0_18:21.271.980.0073112.40
[M+H]+Tetradecanoylcarnitine2.090.630.0037210.99
[M+H]+PC 36:4|PC 18:2_18:23.7915.910.0078312.89
[M+H]+3-{7-[5-(1-hydroxyhenicosa-4,8-dien-1-yl)oxolan-2-yl]heptyl}-5-methyl-5H-furan-2-one1.401.580.0057312.15
[M+NH4]+4-[5-[[4-[5-[Acetyl(hydroxy)amino]pentylamino]-4-oxobutanoyl]-hydroxyamino]pentylamino]-4-oxobutanoic acid3.771.860.0047810.46
[M+H-H2O]+12,19,20-Trihydroxy-14-methylenegeranylnerol1.830.610.0033710.88
[M+H]+2-Aminooctadecane-1,3,4-triol1.351.370.003188.50
[M+H]+Cyclic AMP2.350.840.0133010.46
[M+H-H2O]+DG(18:2(9Z,12Z)/18:2(9Z,12Z))3.471.310.0160012.27
[M+H]+PC 32:4|PC 14:1_18:31.091.250.0472712.16
[M−H]−PG 34:2|PG 16:0_18:21.472.710.0074612.29
[M−CH3] −Phosphatidylcholine lyso 18:21.251.980.0050410.43
[M−H]−PMeOH 34:2|PMeOH 16:0_18:25.731.450.0068512.39
[M−H]−9-Hexadecenoic acid1.240.750.0125311.15
[M−H]−PMeOH 36:4|PMeOH 18:2_18:24.101.280.0270912.28
[M−H]−Linoleic acid3.950.820.0227911.30
[M−H]−Linolenic acid1.570.730.0227710.97
[M−H]−PE 36:4|PE 18:2_18:22.001.260.0273912.01
[M+HCOO]−(2-Hydroxy-3-octadeca-9,12-dienoyloxypropyl) 2-(trimethylazaniumyl)ethyl phosphate1.601.550.0356410.59
[M−H]−PI 34:23.491.480.0483412.27
[M−H]−9-Hydroxy-10E,12Z-octadecadienoic acid1.840.790.042959.76
[M−H]-PA 36:5|PA 18:2_18:31.351.260.0469312.14
[M−H]−PMeOH 34:3|PMeOH 16:0_18:31.381.270.0468312.27
[M+H]+Erucamide7.831.140.0533812.07
[M+H]+3alpha,17beta-Dihydroxy-5alpha-androstane1.040.780.0629311.51
[M+H]+N-(2-Phenylethyl)hexadecanamide2.660.930.1036012.07
[M−H]−[3-[2-Aminoethoxy(hydroxy)phosphoryl]oxy-2-hydroxypropyl] octadeca-9,12-dienoate2.181.500.0847610.61
Disclaimer/Publisher’s Note: The statements, opinions and data contained in all publications are solely those of the individual author(s) and contributor(s) and not of MDPI and/or the editor(s). MDPI and/or the editor(s) disclaim responsibility for any injury to people or property resulting from any ideas, methods, instructions or products referred to in the content.

