Article

Integrating Assessment of Characterization, Sustainability and Efficiency for the Production of Rainbow Trout (Oncorhynchus mykiss): A Case Study in the Amazonas Region of Peru

by
Roberto Carlos Mori Zabarburú
1,*,
Carlos Millones
2,
Grobert A. Guadalupe
1,
Guillermo Idrogo-Vásquez
1,
Fred William Chu-Koo
3,
Armstrong B. Fernández-Jeri
1,
Elizabeth Gill
4,
Segundo G. Chavez
1,4 and
Ligia García
4
1
Instituto de Investigación, Innovación y Desarrollo para el Sector Agrario y Agroindustrial de la Región Amazonas (IIDAA), Universidad Nacional Toribio Rodríguez de Mendoza de Amazonas, Chachapoyas 01001, Peru
2
Laboratorio de Biología, Universidad Nacional Toribio Rodríguez de Mendoza de Amazonas, Chachapoyas 01001, Peru
3
Facultad de Zootecnia, Agronomía, Ciencias Biológicas y Acuicultura, Universidad Nacional Autónoma de Alto Amazonas—UNAAA, Yurimaguas 16501, Loreto, Peru
4
Instituto de Investigación para el Desarrollo Sustentable de Ceja de Selva (INDES-CES), Universidad Nacional Toribio Rodríguez de Mendoza de Amazonas, 342 Higos Urco, Chachapoyas 01001, Peru
*
Author to whom correspondence should be addressed.
Agriculture 2023, 13(2), 390; https://doi.org/10.3390/agriculture13020390
Submission received: 19 October 2022 / Revised: 29 January 2023 / Accepted: 1 February 2023 / Published: 7 February 2023
(This article belongs to the Special Issue Sustainable Aquaculture: Current Perspectives and Future Challenges)

Abstract

:
In this research, aspects of sustainability and efficiency were evaluated to provide information to decision makers. First, 39 rainbow trout farms were characterized, sustainability indices were determined for 36 production units using Sarandon’s methodology, and technical efficiency was evaluated using input-oriented Data Envelopment Analysis (DEA). The production units studied were grouped into three clusters, and the most determining variables were associated with total annual production. In addition, a medium-level general index was obtained with a total of 60 sub-indicators, divided into four social indicators (with 10 sub-indicators), four economic indicators (with 34 sub-indicators) and three environmental indicators (totaling 16 sub-indicators). Of 33 production units evaluated, 14 were identified as efficient; the Amazonas region’s trout farmers were found to operate at 83.87% technical efficiency on average. All resources showed room for improvement and thus can be further adjusted. The most underutilized resources were land (area), feed and seed (fry), which could be reduced to increase technical efficiency. In conclusion, the trout farming units in northeastern Peru are differentiated into three groups by production volume and operate at a medium level of sustainability, with most at levels of technical inefficiency.

1. Introduction

Ensuring food security in the world population is one of the major contemporary priorities and concerns. Despite the remarkable growth in food production, there remain about 900 million people without access to sufficient protein, carbohydrates and lipids in their diets [1]. In response, aquaculture makes an outstanding contribution to food security and the world economy [2,3]. It is the fastest growing sector in agriculture, with an annual growth rate close to 6%; according to the Food and Agriculture Organization (FAO), fish and fishery products are a fundamental source of protein worldwide, especially in low-income countries [4]. In fact, it has been the main source of fish for human consumption, providing 53% of fish, which is expected to increase in the long term as part of the solution to provide sufficient food and protein for the projected global population of more than nine billion people by 2050 [5].
Rainbow trout is an exotic species in Peru. It was introduced from the United States in 1925. The development of the culture during the last three decades involved a large number of egg and fish imports as well as adaptation of the sanitary conditions of Peruvian aquaculture facilities [6].
Designing, implementing and evaluating an aquaculture system involves, among other issues, water quality and quantity, fish growth performance and water saving [7]. Resource efficiency, involving the ratio of inputs to outputs, is essential for profitability and production impact [8]. The success of this industry is highly dependent on aquafeeds, and nutritional composition is an important factor for the quality, productivity and profitability of aquaculture species [2]. However, due to its high dependence on agricultural and fishery resources, its growth is constantly constrained by environmental impacts beyond aquacultural production systems [3]. In this scenario, capture fisheries have declined rapidly due to the reduction of available fish stocks, while aquaculture has increased in the last 20 to 30 years, representing a huge potential to alleviate pressure on natural populations [9].
The development of aquaculture depends largely on the implementation of technologies focused on achieving better production while increasing sustainability [10]. Accordingly, the aquaculture sector needs to invest in assessing water quality in real time, recording production data, and implementing platforms that facilitate communication among actors representing the technological, institutional social, and environmental aspects of the value chain [11,12]. Environmental sustainability indicators identified in the scientific literature for fish aquaculture operations include the amount of resources used (e.g., water, energy, space, feed, amount of raw marine ingredients), waste discharges (nitrogen, phosphorus, organic particulate matter, greenhouse gases, metals), chemical use (e.g., antibiotics, pesticides, hormones), disease incidence, escaped fish, genetic interactions, and impacts on biodiversity [13]. Economic sustainability indicators for aquaculture generally measure the employment characteristics of the industry (e.g., full- and part-time employment, wage levels, female participation, layoff rates) and the economic viability or financial performance of the sector (e.g., profitability, capital efficiency, revenue investment rate, internal rate of return) [14]. The social dimensions of sustainability are associated with issues of poverty, education, health, culture, governance, equity and social cohesion, with some dimensions (e.g., employment, education) being easier to measure than others (e.g., culture, social cohesion) [15].
The present research aims to evaluate the sustainability index and relative efficiency of rainbow trout (Oncorhynchus mykiss) production, a topic not yet explored in the Amazonas Region of Peru.

2. Materials and Methods
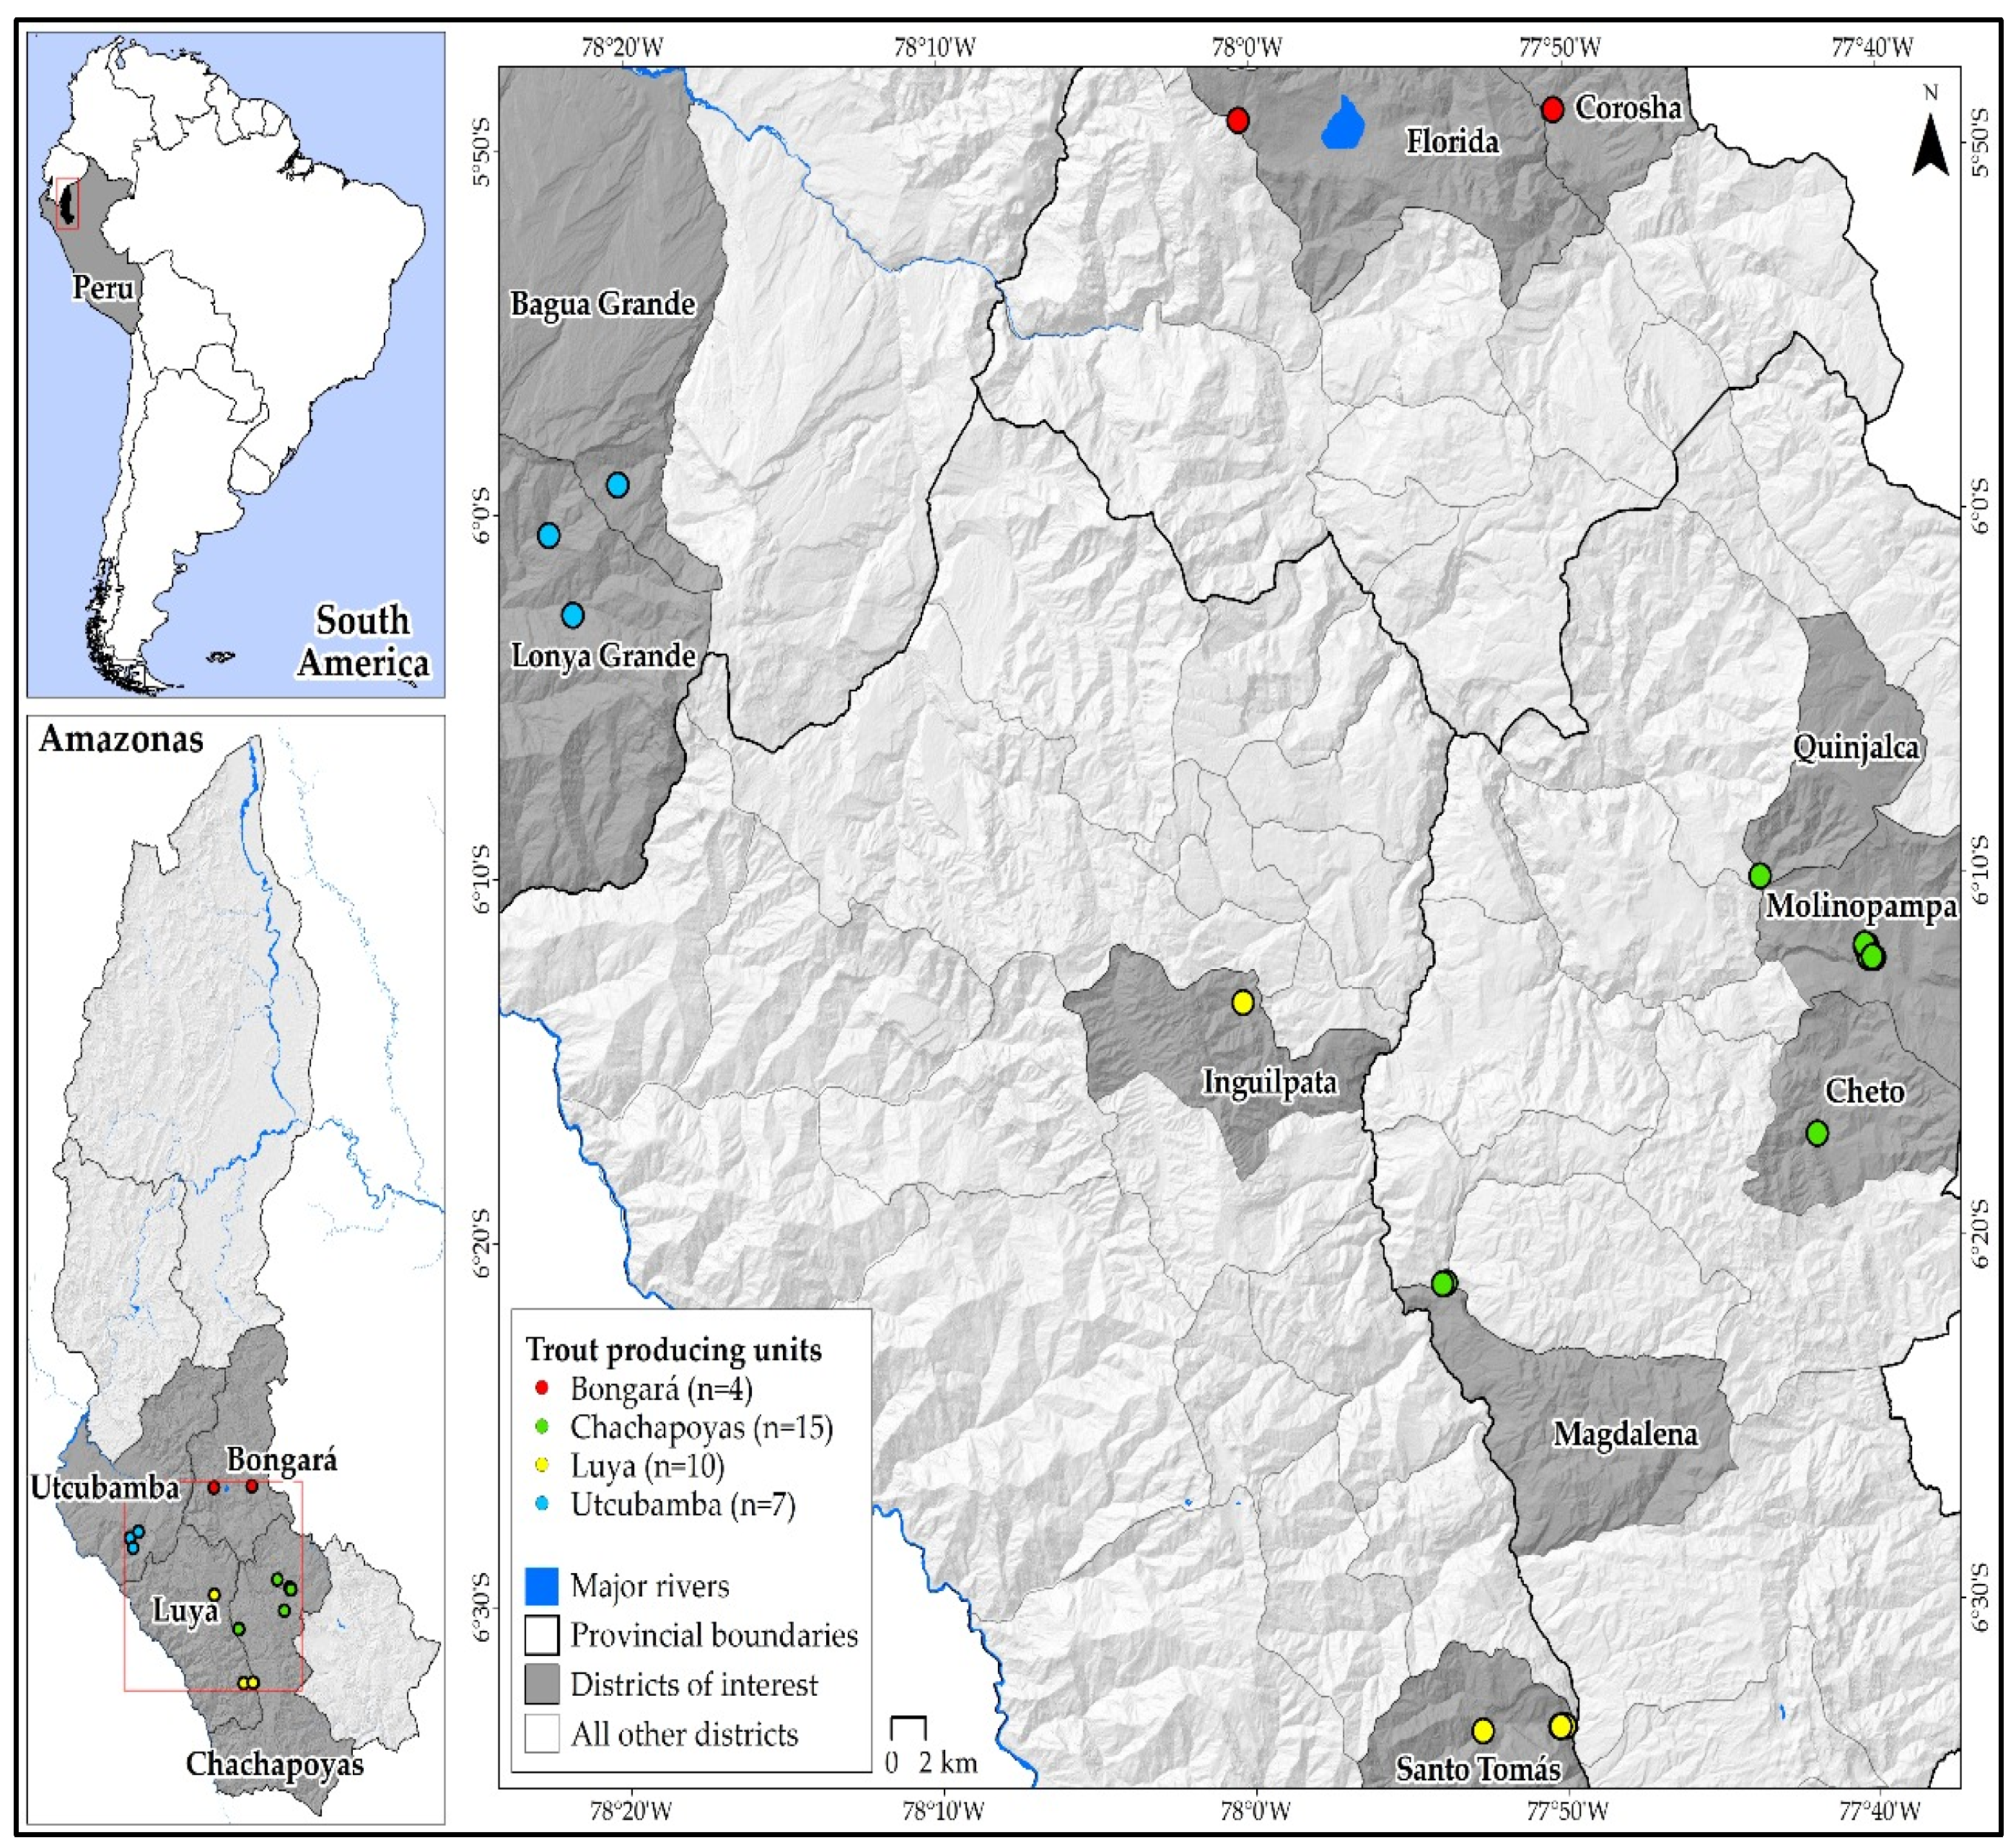
2.1. Place of Study

Of 60 trout production units in Amazonas registered in the Peruvian aquaculture cadastre (http://catastroacuicola.produce.gob.pe/web/ accessed on 20 November 2020), a total of 37 were evaluated, as these were in operation at the time of the study (see distribution of the production units in Figure 1).

2.2. Characterization of Trout Production Units

In the characterization of trout production, a diagnosis of the production units was carried out with the objective of recognizing the capability of the management system that will allow the assessment, evaluation and analysis of variables, causes, effects and trends of the Trout Production Units (TPUs) [16]. The information from the TPUs was collected from a survey related to socioeconomic aspects of the producer and environmental factors, which were used as the basis for the preparation of a questionnaire with indicators that were easily understood by the producers [17]. A total of 39 questions distributed in 3 dimensions were used. In the case of the social dimension, 12 questions were asked; for the economic dimension, 18 questions were asked; and finally, in the environmental dimension, 9 questions were coded for the respective processing and analysis. The TPUs were analyzed as production systems with social, economic and environmental variables that allowed the classification of production systems and the classification of homogeneous groups of trout producers in the Amazonas region. Multivariate analysis was also used to summarize and classify the data obtained from the surveys [18]. The information was tabulated in a spreadsheet (Excel). For the 39 variables evaluated, the coefficients of variation were calculated to discard those variables with low discriminatory power (<40%) and to take into consideration those variables that contribute to the multivariate analysis [19,20]. Similarly, 23 variables were used for the greatest discriminatory power for the principal component analysis, using the ggbiplot package. In addition, orthogonal rotation of the components (Varimax rotation) was used for a better interpretation of the variables. For the cluster analysis, Ward’s method was used, which allowed obtaining homogeneous groups of systems with similar characteristics (typologies), with minimum intra-group variability and maximum inter-group variability, for a better understanding of the analysis of the complexity of trout production systems [21].

2.3. Evaluation of the Sustainability Index

For the evaluation of the sustainability index, field data was collected from 36 TPUs, since the remaining three could not be located at the time of data collection. The Principle-Criteria-Indicator (PCI) technique was used [22]. Likewise, the criteria for choosing the indicators were defined as SMART: Specific, Measurable, Achievable, Relevant and Time-bound [23]. To collect data, a survey was used, consisting of 60 questions, divided into three dimensions. The social dimension included the sub-dimension of human resources (3 questions), labor conditions and safety at work (2 questions), and corporate social responsibility and transparency (5 questions). The economic dimension included the following sub-dimensions: level of economic performance (5 questions), operations and production (16 questions), technology, research and development (5 questions), and marketing and sales (8 questions). Finally, the environmental dimension had the following sub-dimensions: carbon footprint level (7 questions), ecological footprint level (3 questions), and water quality (6 questions). Each sub-indicator was assigned a scale from 1 to 4, with 4 being the highest value and 1 the lowest sustainability value. The ranges of values were adapted as follows: 0–1 very low, 1.1–2 low, 2.1–3 medium and 3.1–4 high [24,25]. The sub-indicators were readjusted according to the results generated in the diagnosis of the trout producing units derived in the previous section.
In order to determine the level of association between sustainability dimensions, Pearson’s correlation was applied [26].

2.4. Technical Efficiency Analysis

The efficiency index was calculated from the information collected in the field for all the production units (TPU) under study. Through previous runs, the number of TPUs was reduced to 33, eliminating oversized units and those that were not in production.
Data Envelopment Analysis (DEA) was used to determine the frontier TPUs, and the clearances and references for the efficient units were calculated. An input-oriented model (Table 1) was used, with constant scale returns Banker–Charnes–Cooper (BCC) [27,28] convex structure, radial distance and blocking of super efficiencies.

3. Results

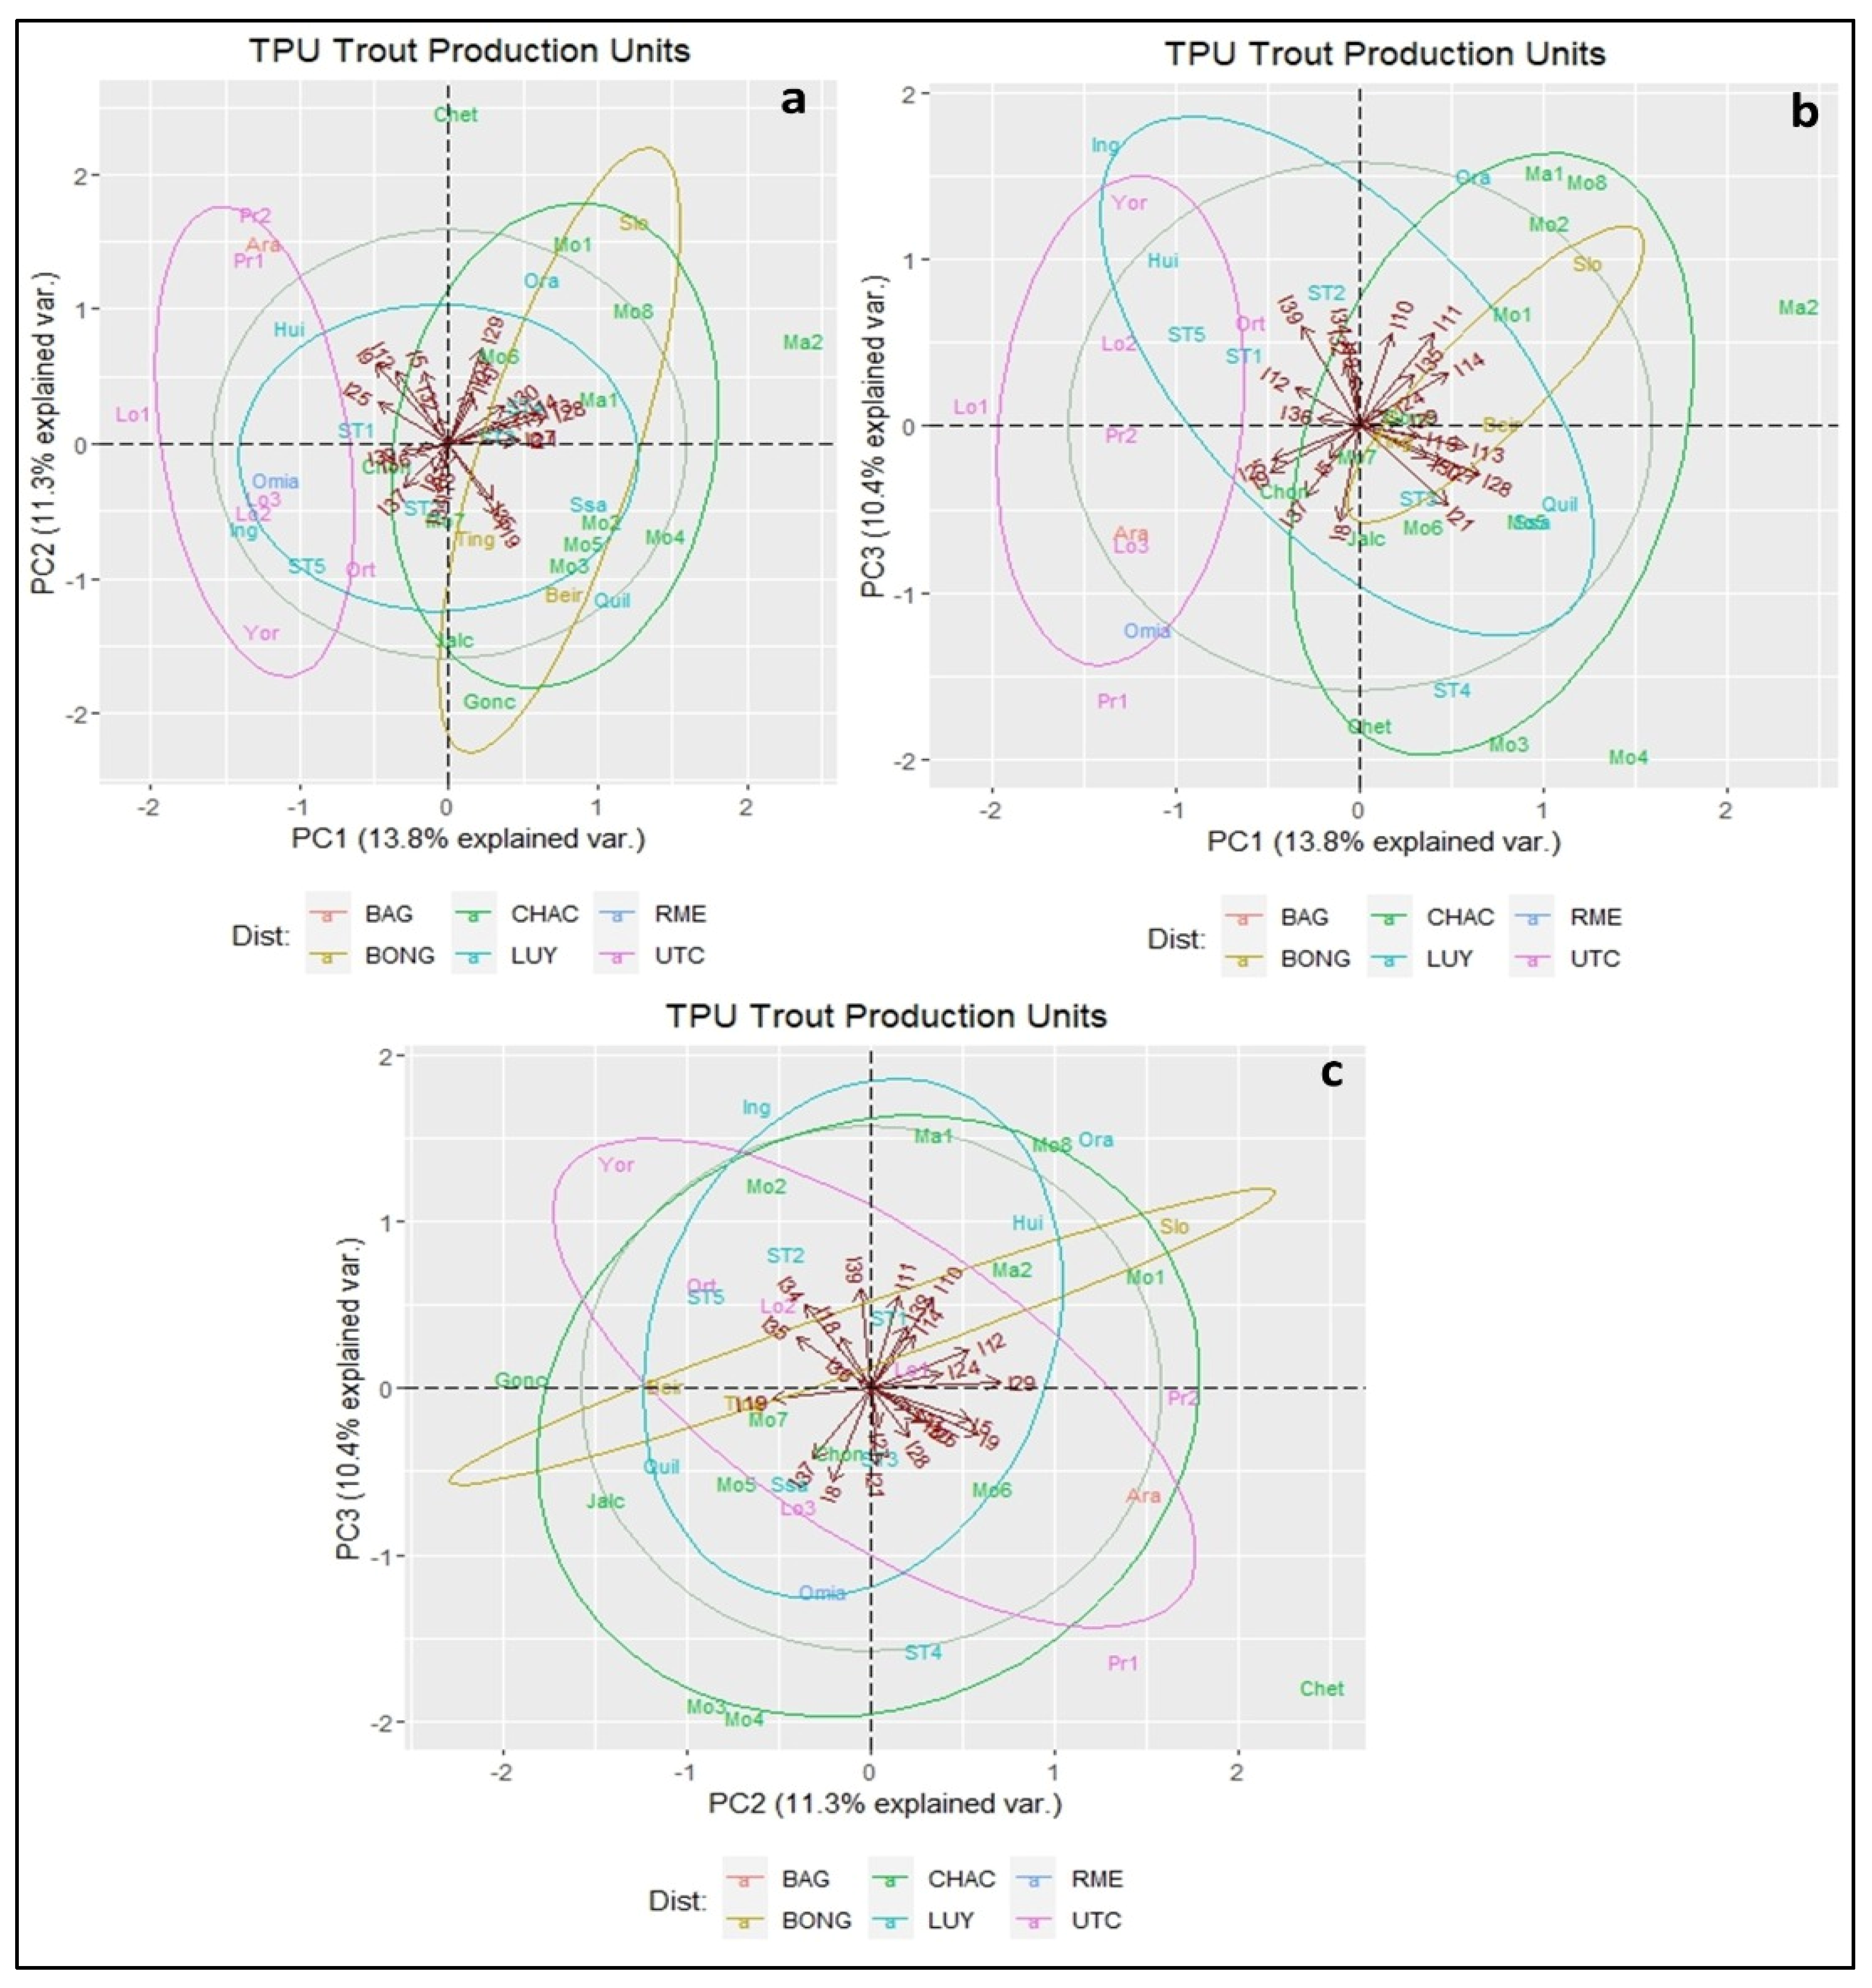
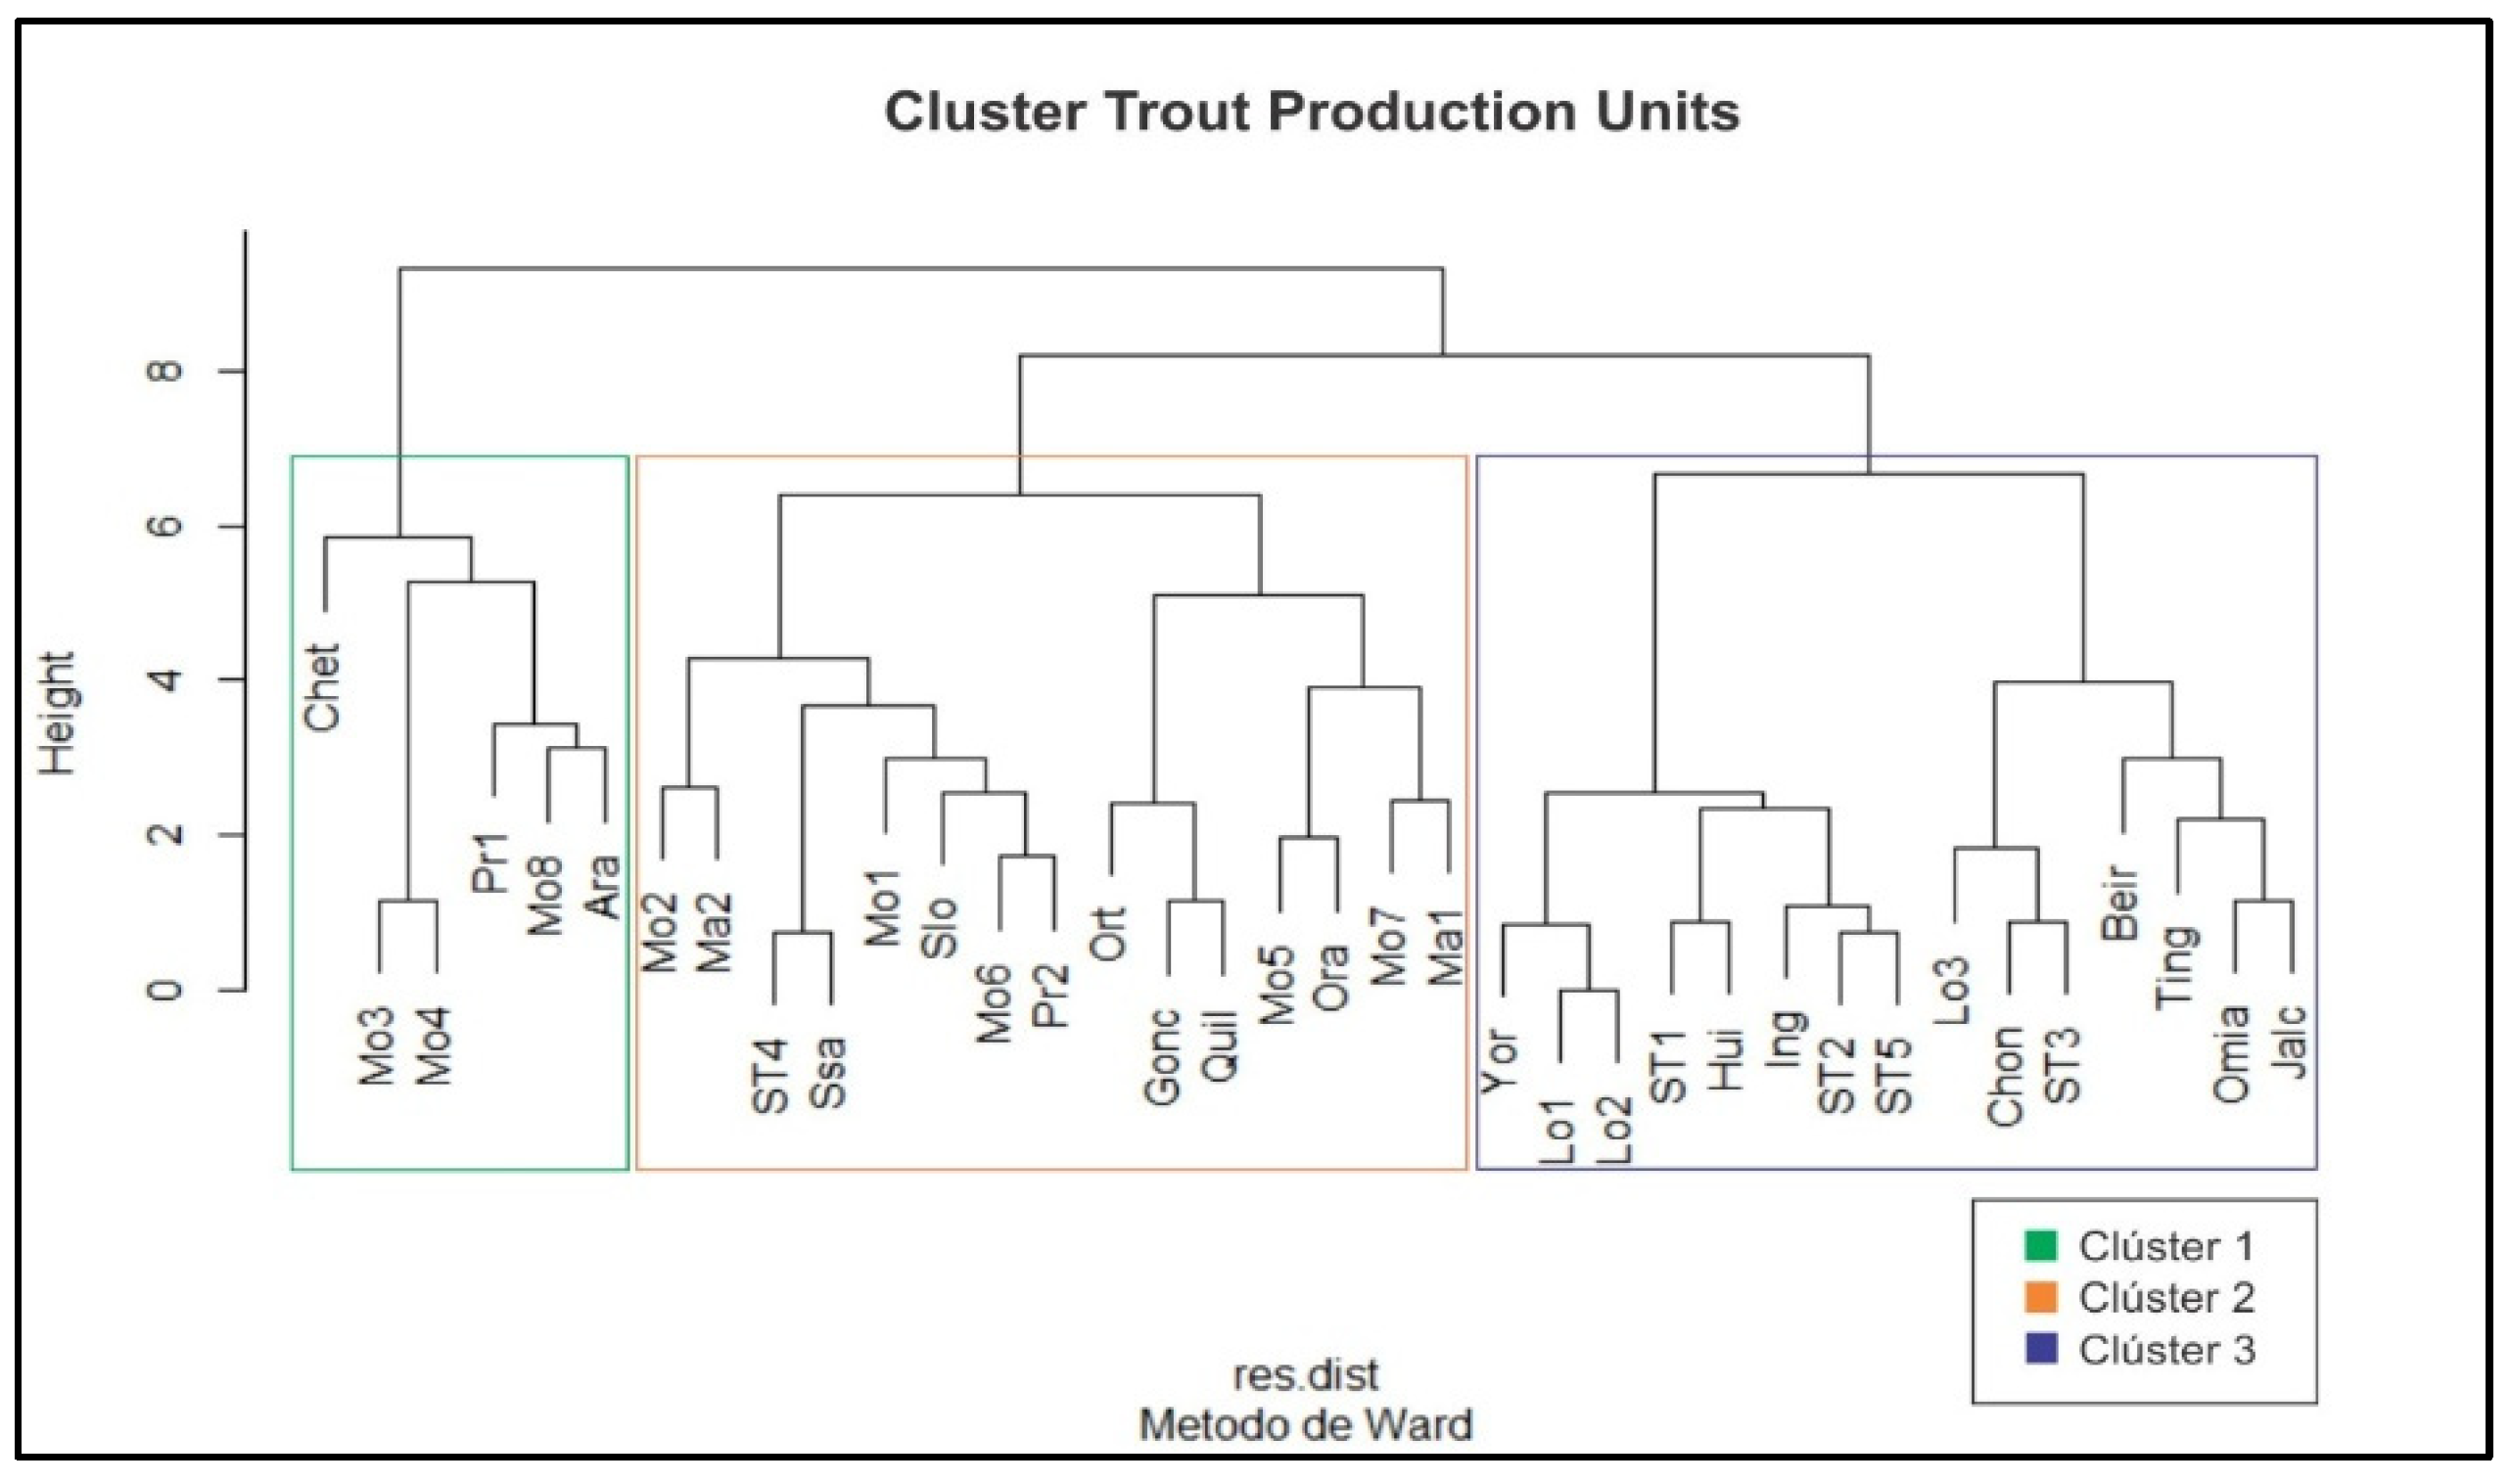
3.1. Characterization of Trout Production Units

The information collected from the socioeconomic aspects of the producer and environmental factors of the TPU survey was comprised of 39 variables. Using the CV < 40%, 23 variables were selected, with a variability coefficient range of 42.8%, I-25 (sales price per kilo of trout) and 155.9%, I-9 (participates or belongs to a productive association). In addition, these variables corresponded to the social aspect, 11 to the economic aspect and 6 to the environmental aspect (Table 2).
The principal component analysis recorded nine principal components that explain 72.8% of the total variance (Table 3). The first three principal components explain 35.4% of the total variance in the data. CP1, CP2 and CP3 explain 13.8%, 11.3% and 10.4% of the data, respectively.
The varimax rotation of the factors made it possible to generate three synthetic variables (Table 4), assigning these names: income generation of the TPU (I-10, I-11 and I-37), socio-environmental reality of the TPU (I-9, I-29, I-34 and I-35) and production of the TPU (I-21 and I-28). In the three-dimensional space of the principal components, the variables monthly economic income (I-10) and access to credit for production (I-11) are directly correlated with each other, while the variable main problems that occur in the TPU is inversely correlated with these variables (Figure 2). This would represent the synthetic variable income generation of the TPU (Table 4).
The variable participates or belongs to a productive association (I-9) is inversely correlated with the variable has another type of authorization apart from DIREPRO. Likewise, the variable number of people working in its productive center (I-29) is inversely correlated with the variable final disposal of its waste (I-34) (Figure 2), which would represent the synthetic variable socio-environmental reality of the TPU (Table 4). The variable average density per m2 of trout in the fattening stage (I-21) is correlated with the variable where production is sold (I-28) (Figure 1), which would represent the synthetic variable production of the TPU (Table 4).
The cluster analysis through the dendrogram identifies three groups of trout production systems from the synthetic variables of the new factors established from the principal component analysis (Figure 3). There are three TPU clusters, of which clusters 2 and 3 had the highest number of TPU (41.7%), while cluster 1 had the lowest number of TPU (16.7%) (Figure 3). On the other hand, cluster 3 (group 3) comprised the mini-trout producer, cluster 2 (group 2) comprised the small producers and cluster 3 (group 3) comprised the medium producer. The typification variables that gave rise to the clusters were trout harvests per year (I-13) and production volume per harvest in tons (I-14).

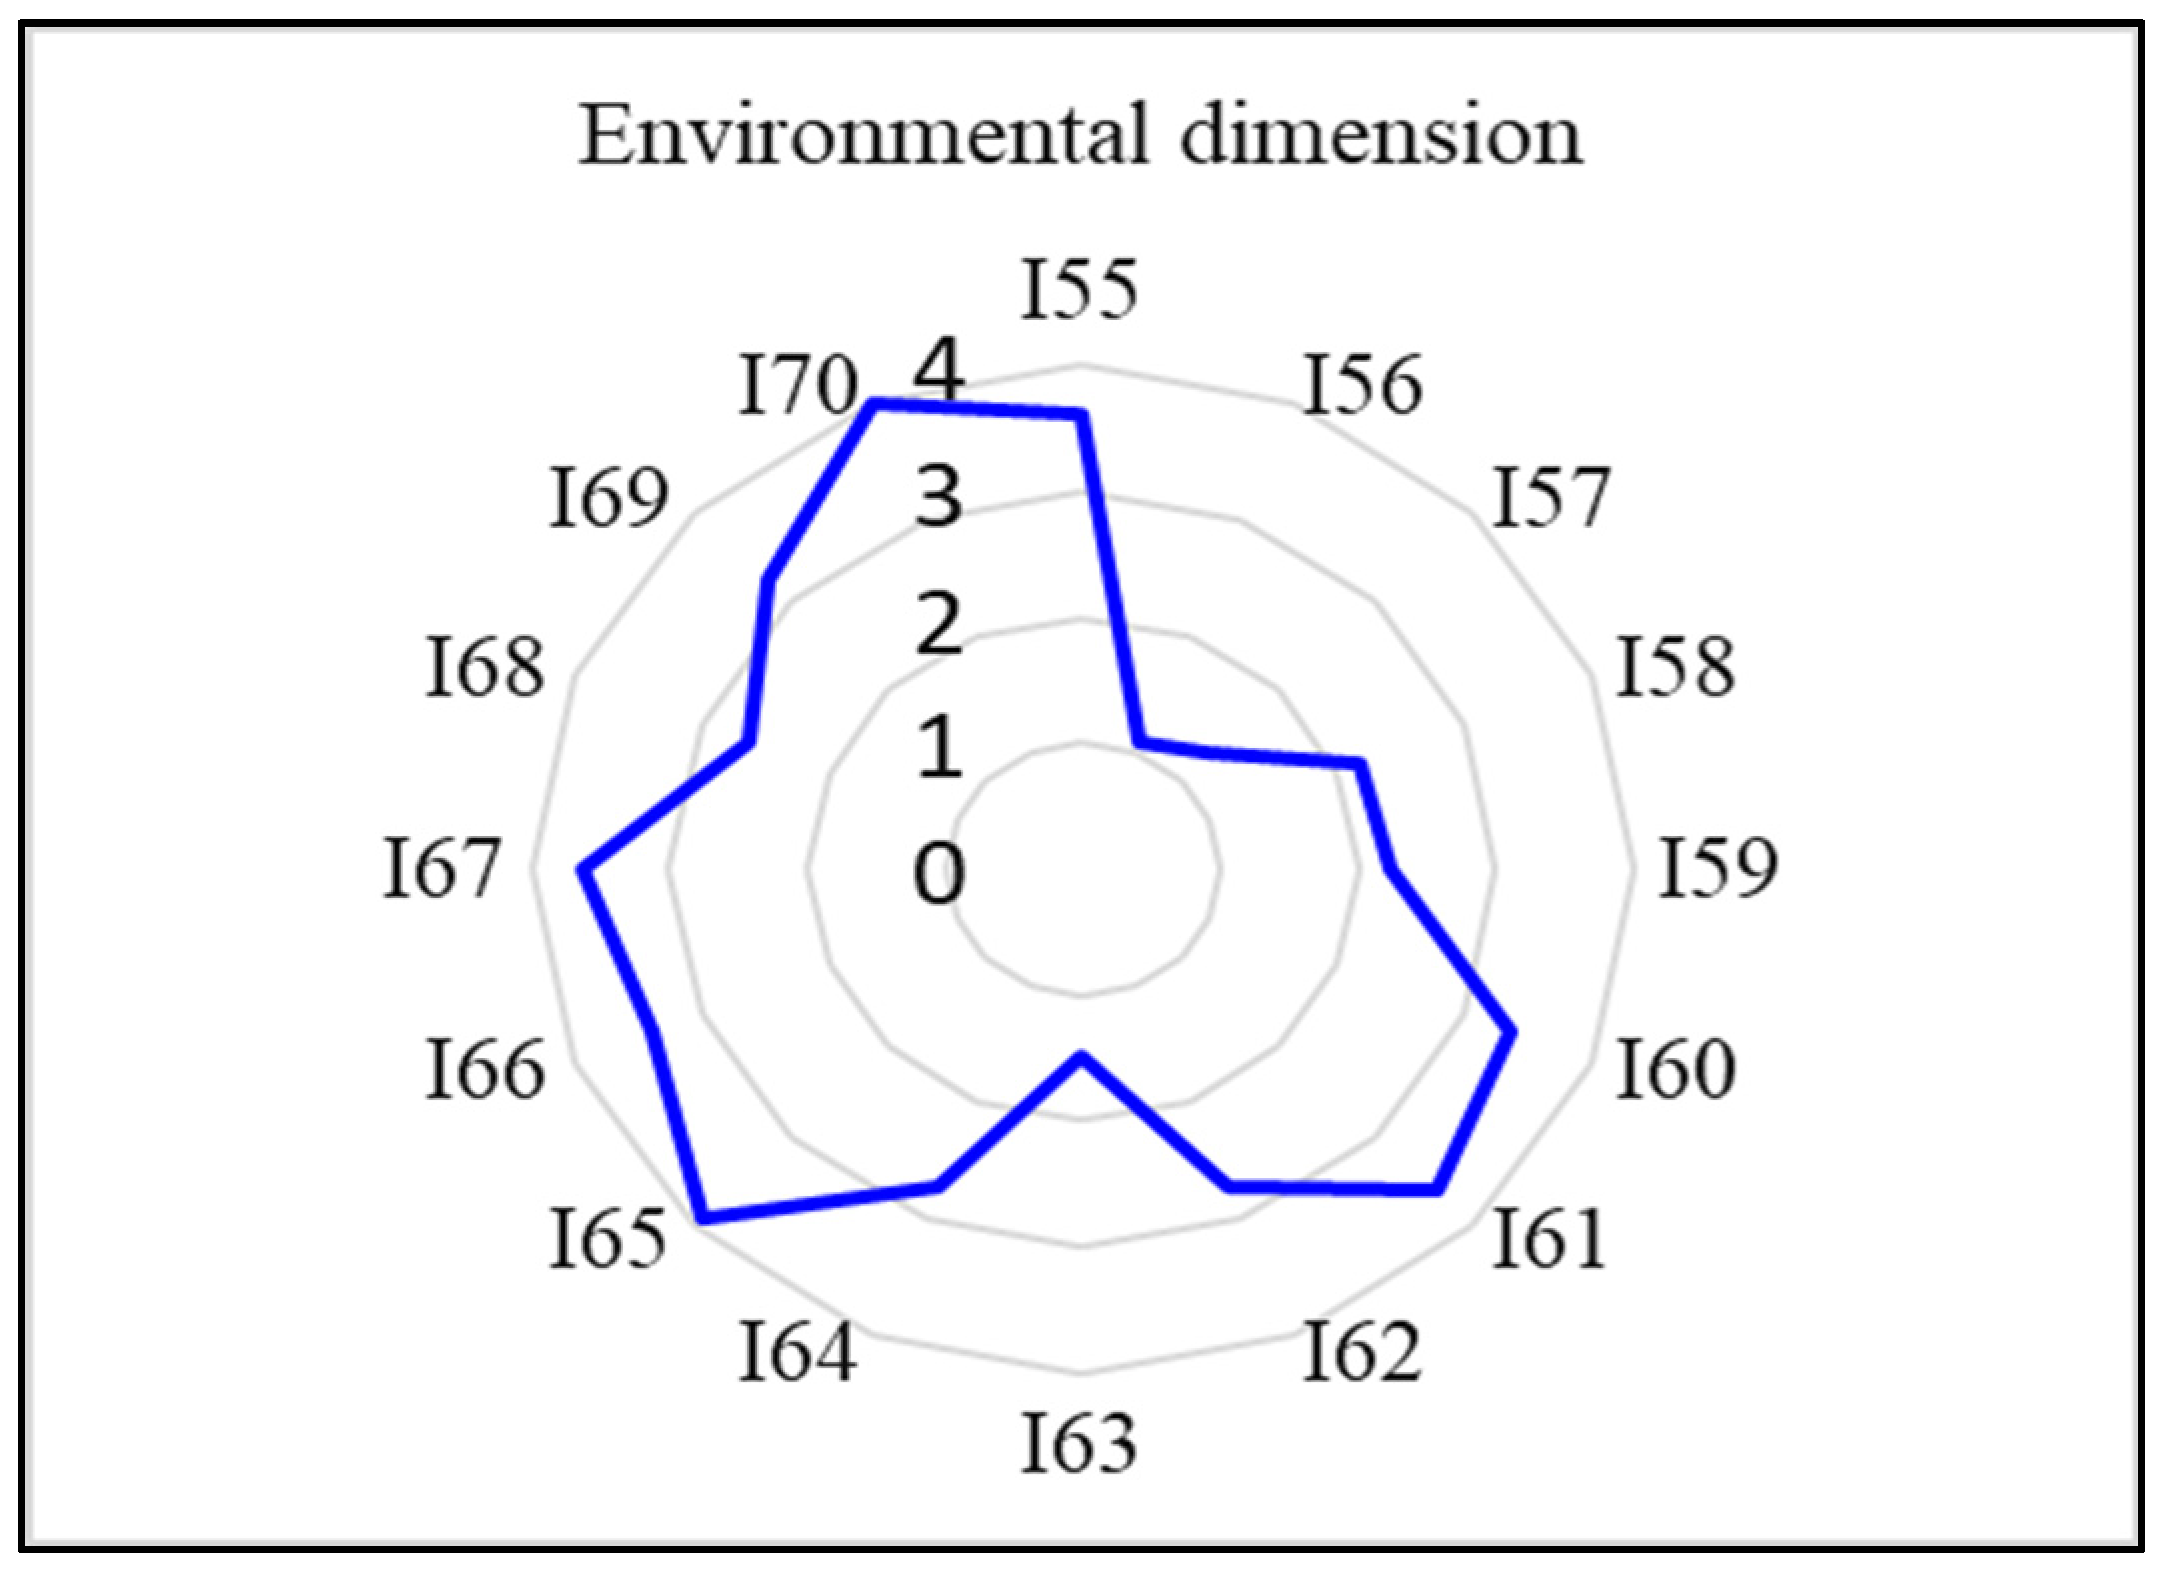
3.2. Evaluation of the Sustainability Index

A total of 60 sub-indicators were determined, divided into four social aspect indicators (with 10 sub-indicators), four economic aspect indicators (with 34 sub-indicators) and three environmental aspect indicators (totaling 16 sub-indicators).
The sub-indicators that contributed the most were those corresponding to the environmental aspect, which averaged a sustainability index of 2.7. The marketing and sales (2.5), carbon footprint (2.5), and ecological footprint (2.3) indicators averaged medium indexes, while water quality estimated a high sustainability index (3.5) (Figure 4, Table 5). Meanwhile, indicators of low sustainability performance should be given more attention and refer to labor conditions (1.3) and aspects of technology, research and development (1.4).
Regarding the economic sub-indicators, they represented a medium level of sustainability (2.1) with the following index values (from highest to lowest): economic performance level (2.6), operations and production (2.3), technical, research and development (1.4) (Figure 5, Table 5).
In the same sense, the lowest average values of the indexes correspond to the sub-indicators of the social aspect with 1.9, which represents a low index of sustainability. From highest to lowest, indices of 2.5 for social responsibility, 2.1 for human resources and 1.3 for working conditions were rated (Figure 6, Table 5). Using the resulting indicators, an overall index of 2.3 was obtained, corresponding to the medium level (Figure 7, Table 5).
When we correlated the sustainability dimensions, none of the cases (social with environmental, social with economic, and environmental with economic) showed a moderate, high or very high correlation. On the contrary, there was a low positive correlation between the social and economic dimensions (0.30) and a low negative correlation between the economic and environmental dimensions. There was a small or negligible relationship between the social and environmental dimensions (Figure 8).

3.3. Technical Efficiency Analysis

According to the constant scale efficiency index, of the 33 TPUs, 14 showed efficiency (Table 6) and 19 were inefficient, of which 2 TPUs were more than 50% inefficient.
In general, the trout production units in the Amazonas region operate with 83.87% efficiency at a constant scale.
The goals for the inefficient TPUs have different meanings. For example, only two groups (70–90 and 90–100) should reduce the number of employees (Empl.); the group whose index was between 70–90 should reduce the number of fry (Alev.) planted and should increase their campaigns per year (from 3 to 4). The other TPUs should increase or maintain the levels of these factors used. On the other hand, most of the inefficient TPUs should increase their area dedicated to aquaculture (Area), which indicates that their inefficiency may be due to the size of their farm (scale). The amount of feed used in the different stages can also be optimized. Most of the TPUs should increase the amount of feed.
As can be seen in Table 6, the efficient TPUs are very dispersed, with farms ranging from 60 to 600 m2 of water surface, with 2 to 100 thousand fingerlings. In addition to the wide range in the amount of feed used and the amount of water, production volumes are between 1500 and 7000 kg of fish per season. This indicates a great heterogeneity in the aquaculture TPUs studied.
On the other hand, the TPUs that proved to be inefficient are smaller. The maximum production volume is 3000 kg of fish per season; however, the facilities occupy a larger area than the efficient TPUs (1000 m2 versus 600 m2, as maximum values for both groups; see Table 7 and Table 8). In addition, similar to the efficient TPUs, the inefficient farms are very heterogeneous.
When analyzing the targets for inefficient TPUs (Table 5 and Table 6), the changes that must be made in the amount of resources employed to produce the same amount are heterogeneous. With the exception of the number of employees and the number of campaigns per year, all factors can be adjusted to increase efficiency (Table 9).
The adjustments that can be made in the amount of resources employed are more than 40% (Table 10). There is evidence that systems are wasting feed at all stages of the process (from 41.82% in finishing feed to 74.73% of pre-start feed). The 19 inefficient farms can also optimize water use by 46.54% and should reduce their production area by 59.66% (Table 10).

4. Discussion

4.1. Characterization of the TPU

The principal component analysis allowed selecting 23 of 39 variables and defining nine new components that explain 72.8% of the total variance (Table 3). The authors of [29] studied the typification of Creole hens in peasant agroecosystems, identifying nine principal components from 25 variables, with a higher degree of discrimination and the absence of correlation between them, explaining 71% of the total variance. In the characterization of agricultural farms (cattle raising, sugarcane and blackberry cultivation) one study used 43 variables to characterize the agricultural units [30].
The typology of the TPUs makes it possible to establish and generate groupings based on the characteristics recorded in the data collection [31]. Grouping the producer units is of utmost importance, because in each group, actions can be carried out jointly and not individually [32]. The use of principal component analysis and varimax rotation with factor loadings greater than 0.5 (Table 4) was considered for the analysis of the variables [30,33], allowing the generation of three synthetic variables through principal component analysis [31,34]: income generation of the TPU (I-10, I-11 and I-37), socio-environmental reality of the TPU (I-9, I-29, I-34 and I-35) and production of the TPU (I-21 and I-28). The cluster analysis (Figure 3) with a Euclidean distance of 10 allowed for identification of three groups of TPUs, where 83.4% of the TPU comprised small and medium trout producers.
These results are important because the high Andean areas of the Amazonas region have hydrological potential, including riverbeds where trout farming is practiced. Thus, in the district of Molinopampa, moderately suitable and marginally suitable areas represent 93% of the total area of the district and are recommended for trout farming [16], which would indicate the potential for trout production in this area of the country. However, the criteria for sustainability must be taken into account. The constant increase in the volume of trout production can affect sustainability, particularly the production of food, as is the case with salmon [35]. There may be alternatives for sustainable trout production, depending on the efficiency in the cultural use of energy (diet, general management, transport and machinery, equipment and construction), a good indicator of sustainability, because as the projected annual production capacity increases the cultural energy expended per kg of carcass and trout fillet marketed decreases [36]. Another alternative could be ecosystem services, as in the case of salmon [37], which can be gradually adapted to trout farming.

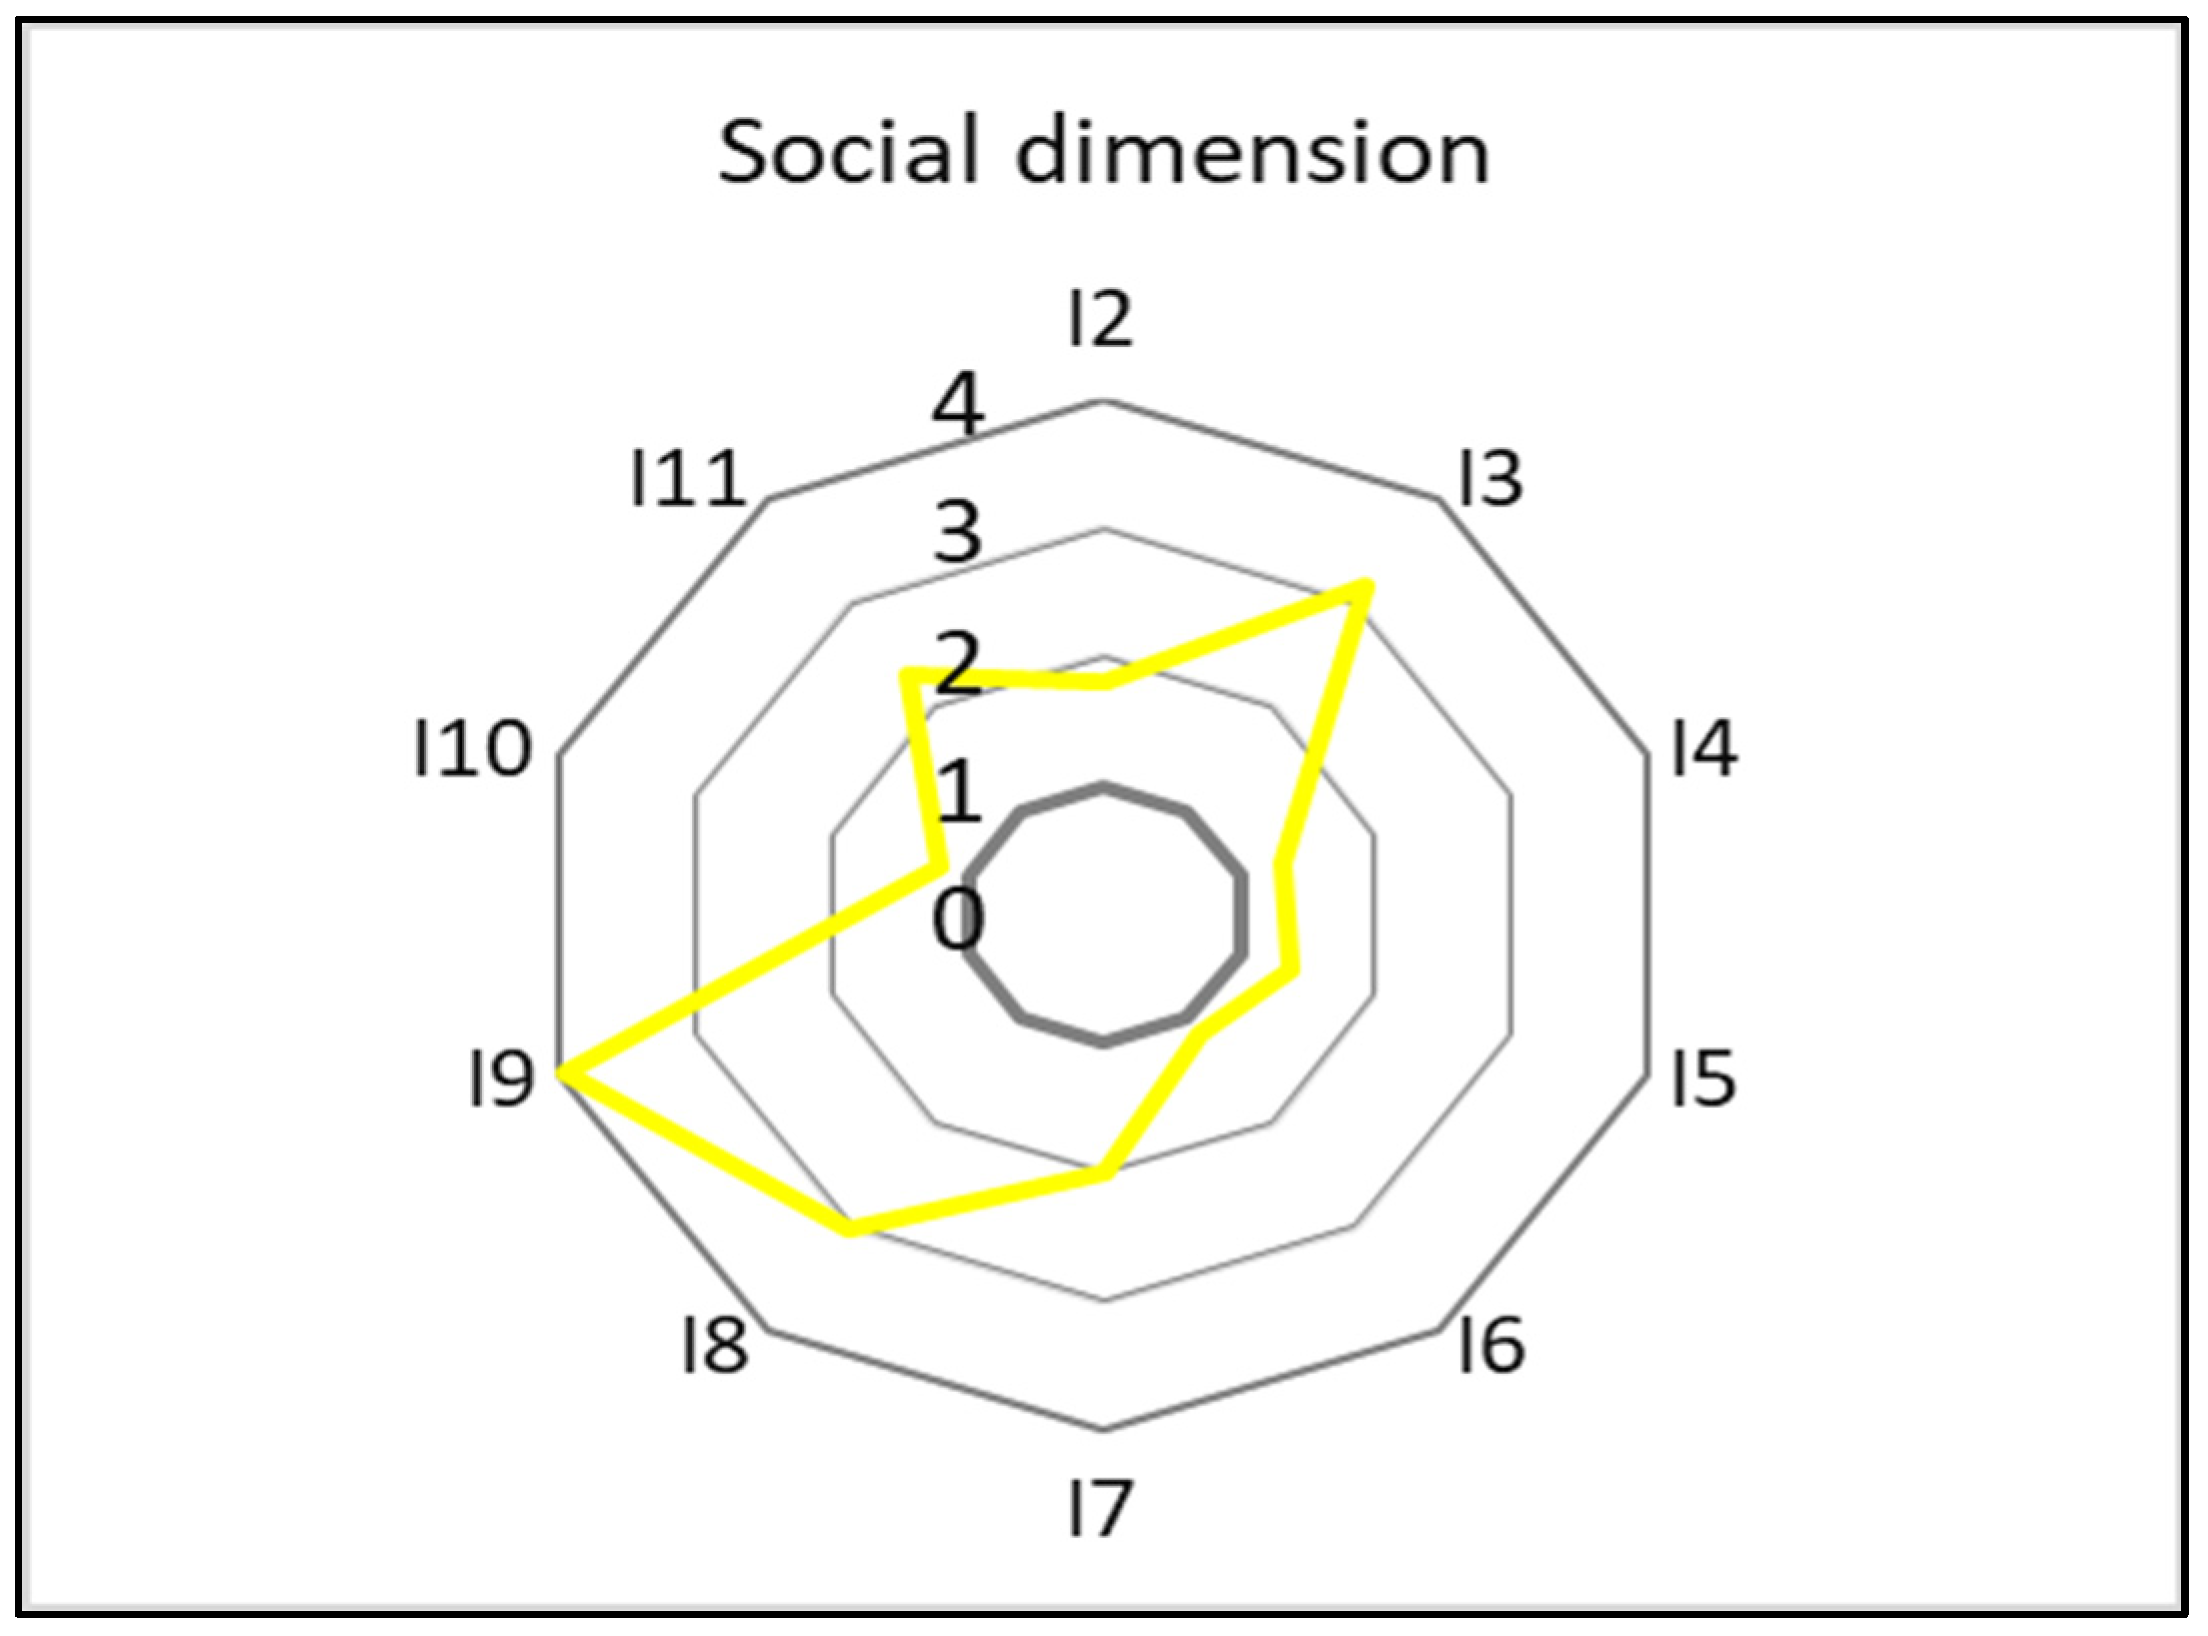
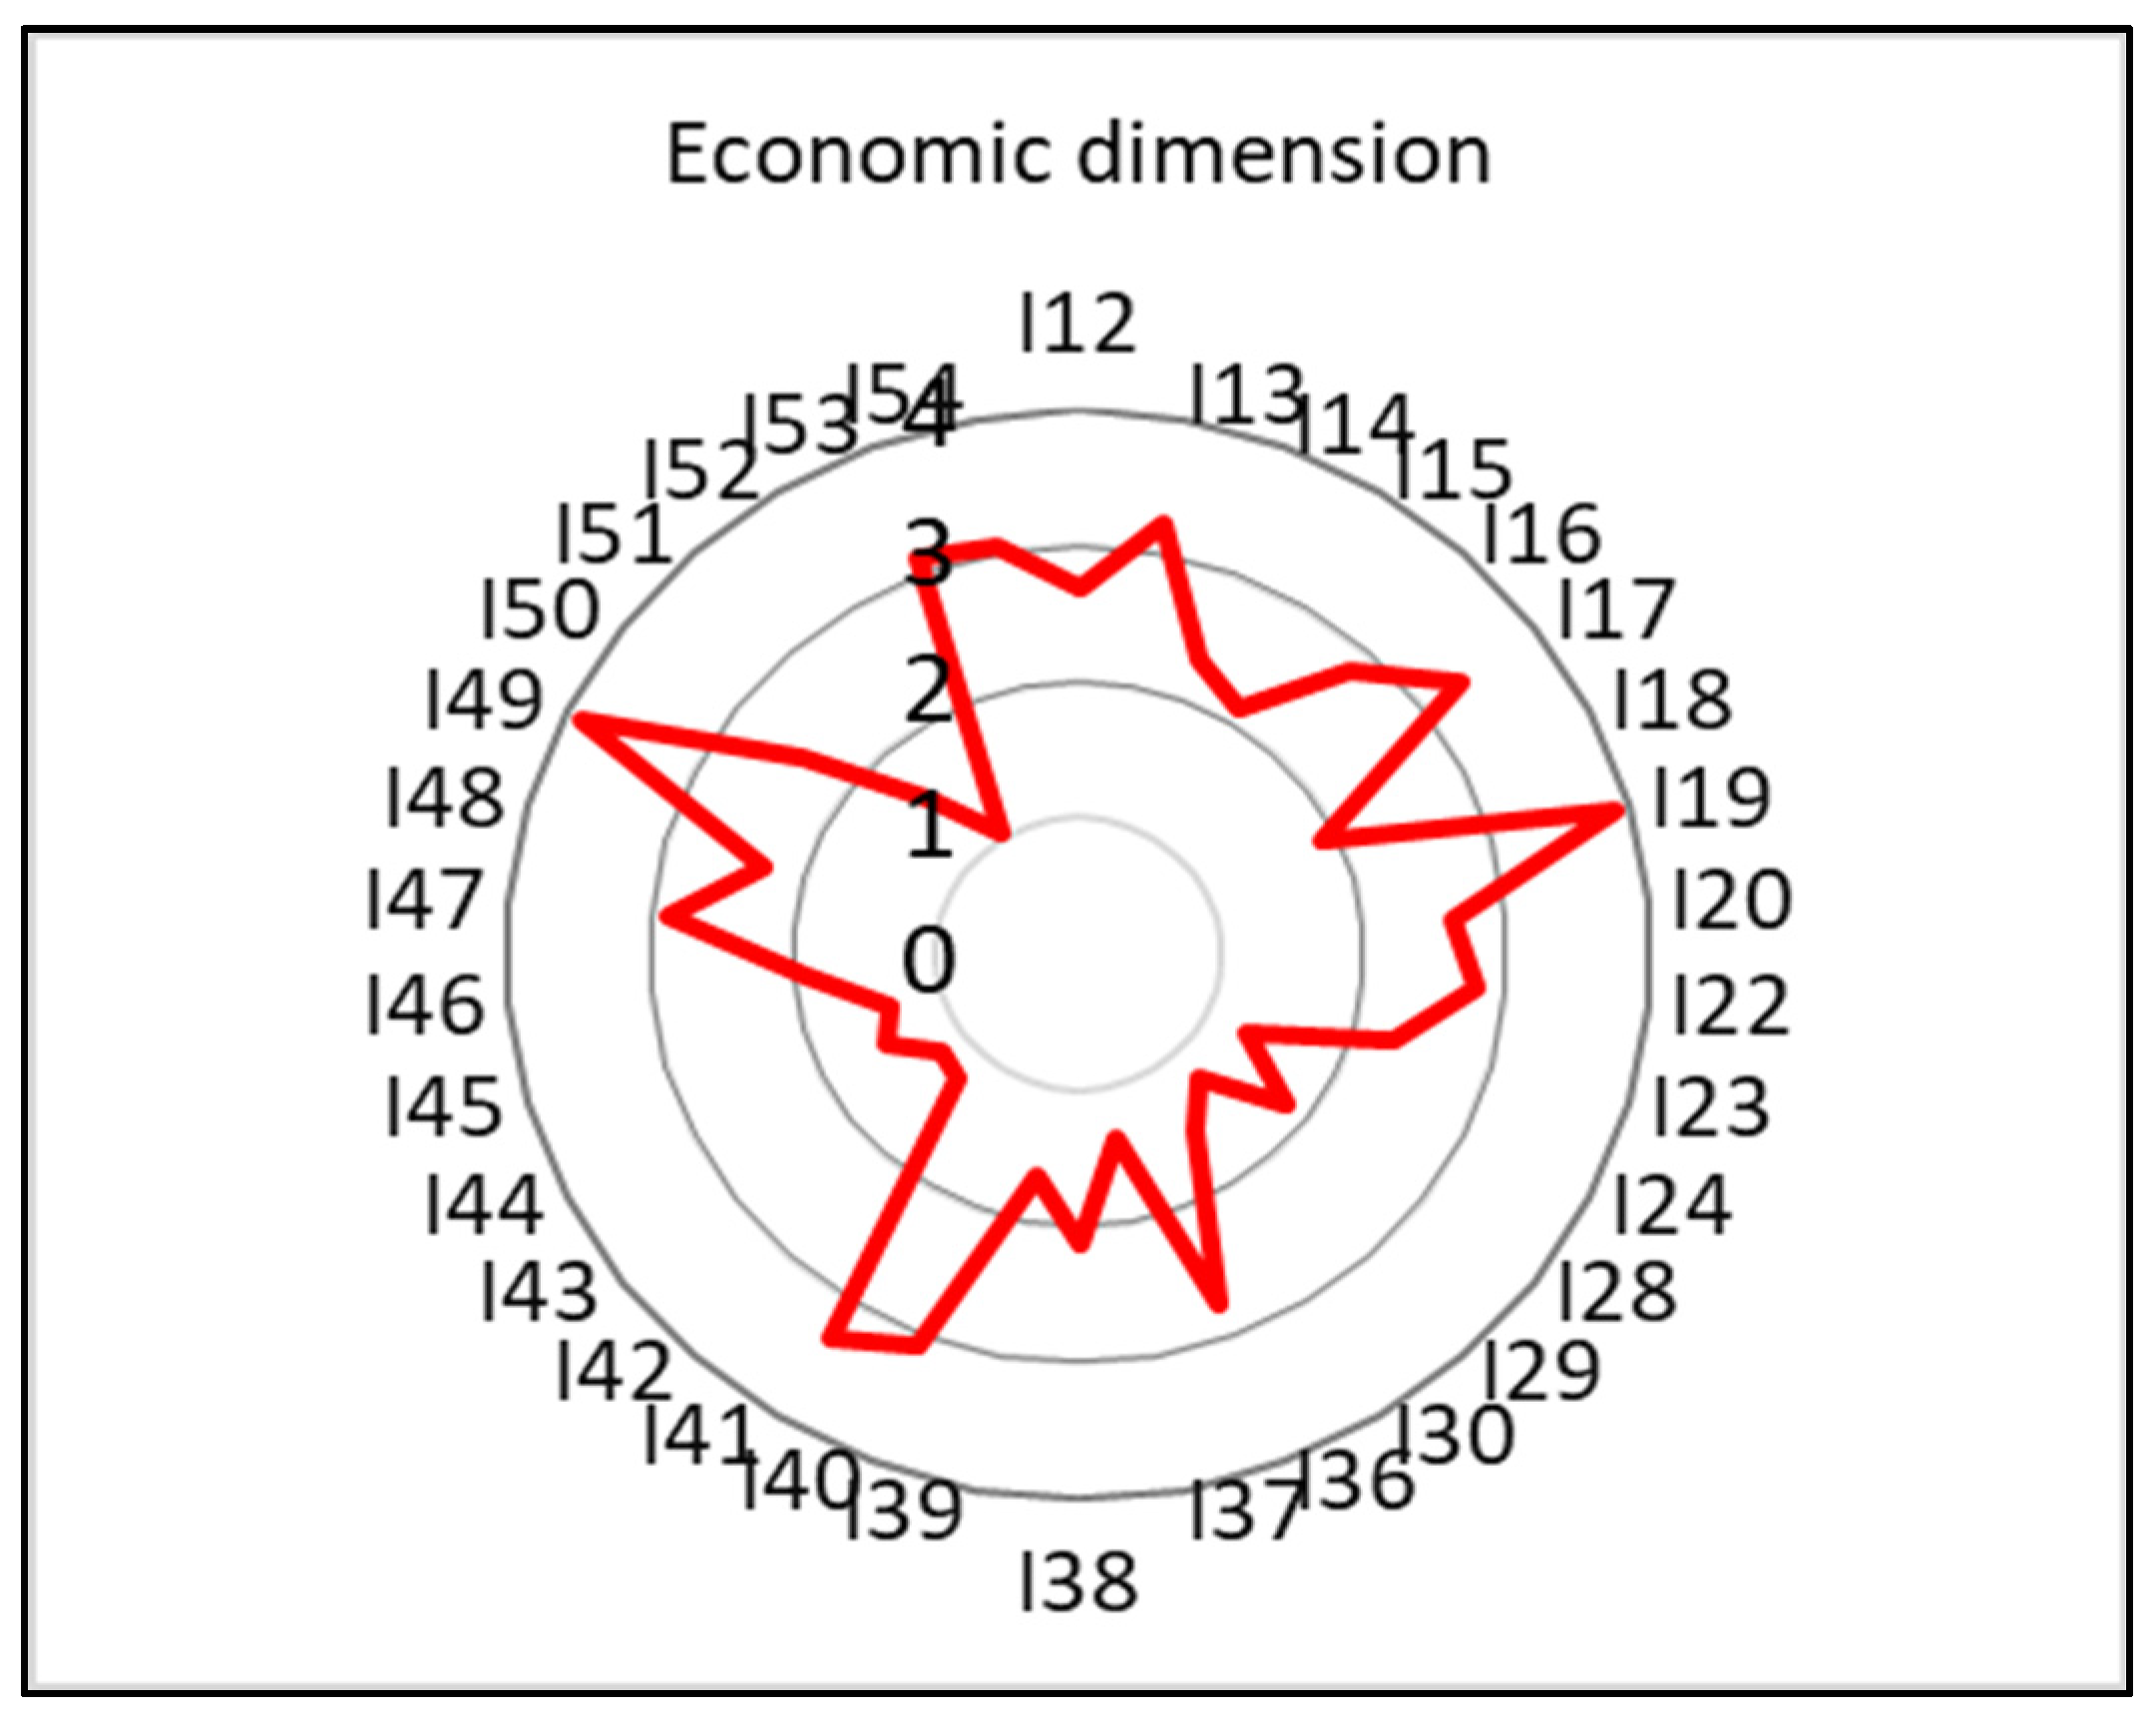
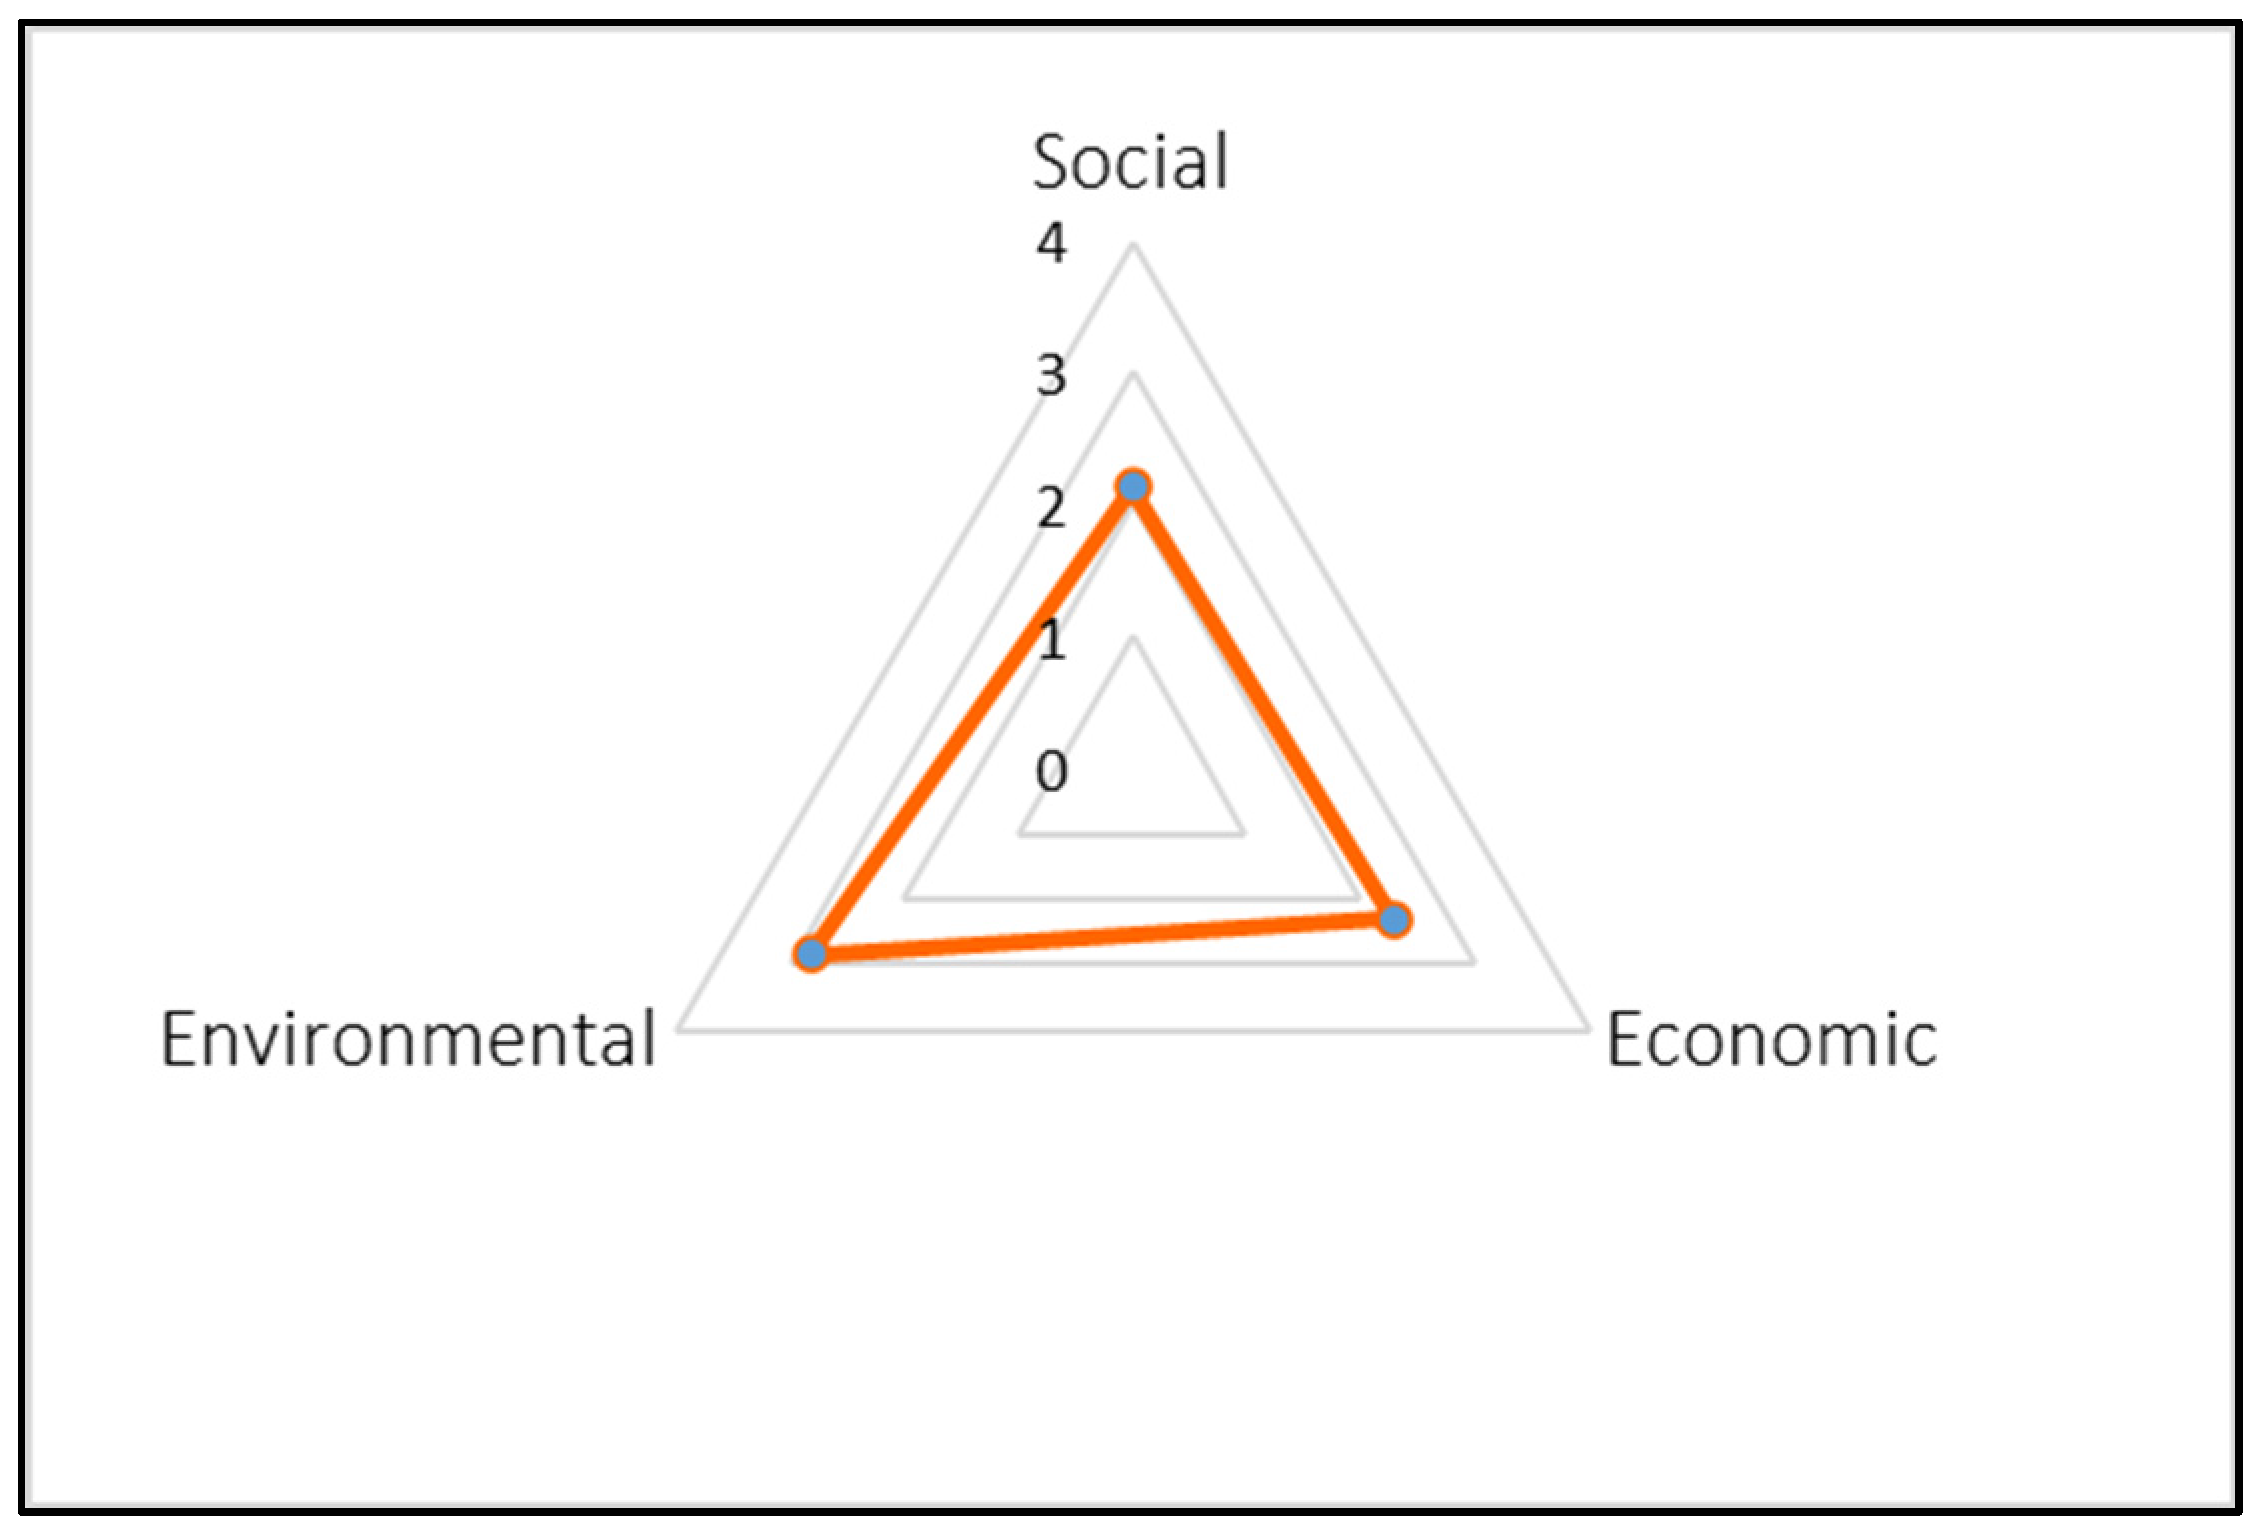
4.2. Evaluation of the Sustainability Index

Thanks to the Bruntland Commission, one of the best-known definitions of sustainability was established by Michael Redclift in 2005; it is now common to establish a multidimensional approach [38,39]. It is possible, then, to consider economic, social and environmental criteria to study the sustainability of a territory [40,41], in this case, trout production units in the Amazonas region of Peru.
Despite methodological efforts, capturing the systemic complexity of sustainability through evaluation is difficult [42,43] and has become a constant challenge that seeks to integrate aspects from various approaches (for example, in this research, characterizing and searching for indices as well as evaluating production efficiency in fish farming). However, it is justified by the attention of policy makers beyond productivity to include dimensions of human welfare and ecological soundness [41].
The methodological tools integrated to obtain the sustainability index in this research made it possible to determine problems in a simple way and within the reach of farmers, thanks to the Principle-Criteria-Indicator (PCI) (Ruiz Cabello), the SMART approach (Specific, Measurable, Achievable, Relevant and Time-bound) [44,45], sustainability scales (Sarandón) and correlation analysis. New approaches can be integrated with new dimensions, such as ecological, cultural and political-institutional [46]. Likewise, new indicators and sub-indicators can be developed to represent reality more accurately. This will allow new research in fish culture to be strengthened with respect to commonly used indicators [47,48].
Despite the low correlations between the dimensions of sustainability, higher values between sub-indicators are possible, since in our sample of subjects there are subgroups, and the relationships found can differ greatly when calculated in each group or in all subjects. In these cases, we can obtain future proof by calculating the correlations that interest us in each subgroup and in each subsample [14].

4.3. Technical Efficiency

In the 33 trout production units evaluated, a high average efficiency index was found (83.87%), which indicates that production operates with higher technical efficiency levels than aquaculture operations in Asia, Africa and the United States, and with comparable levels to European aquaculture farms, as reported in previous studies [49]. However, it should be noted that the technique used, being a deterministic method, tends to present overestimations in the calculations [23], and average efficiency may not be an accurate indicator, so a range analysis is necessary.
Farm size is a determinant of the level of efficiency observed, suggesting that, as in other studies, aquaculture units could be more efficient when they increase in size [50].
Although all resources had room for improvement, feed underutilization requires special care, because it has the highest cost of production [49,51]. This opens the possibility that the local industry may seek to improve feed supply efficiency through pond modifications or adjustments in the feed formulations used. An alternative could be the implementation of polyculture systems that make more efficient use of the feed supplied [52].
However, as recommended by other researchers [53], studies of allocative and economic efficiency would be necessary for a better understanding of decision making.
Data envelopment analysis is one of the most widely used tools to measure efficiency in aquaculture production units [54]. Therefore, the results found could be very useful for decision makers and policy makers to help improve competitiveness and efficiency in the TPUs studied.

5. Conclusions

Three groups of trout production units were found in the Amazonas region of Peru, grouped according to total annual fish production.
When we calculate the sustainability index in which the trout production units of the Amazonas region, Peru, operate, we obtained a general index of a medium level, with a total of 60 sub-indicators, divided into four social indicators (with 10 sub-indicators), four economic indicators (with 34 sub-indicators) and three environmental indicators (totaling 16 sub-indicators).
On the other hand, out of 33 production units finally evaluated, 14 were identified as efficient; in general, the Amazonas region’s trout farmers operate at 83.87% technical efficiency. All of the resources had slack; therefore, all can be adjusted, with the most underutilized resources being land (area), feed and seed (fry).
Finally, it can be affirmed that the trout farming units in northeastern Peru can be assigned to three groups differentiated by production volume, operate at a medium level of sustainability and are largely operating at levels of technical inefficiency.

Author Contributions

Conceptualization, R.C.M.Z., G.A.G., F.W.C.-K. and C.M.; methodology, R.C.M.Z., C.M., G.I.-V., F.W.C.-K., A.B.F.-J., S.G.C. and L.G.; software, R.C.M.Z.; validation, R.C.M.Z., and E.G.; formal analysis, C.M., F.W.C.-K. and R.C.M.Z.; investigation, R.C.M.Z.; resources, R.C.M.Z., G.I.-V. and A.B.F.-J.; data curation, R.C.M.Z., G.A.G., C.M., S.G.C. and L.G.; writing—original draft preparation, R.C.M.Z., G.A.G., C.M., A.B.F.-J., S.G.C., E.G. and F.W.C.-K.; writing—review and editing, R.C.M.Z., C.M., F.W.C.-K. and L.G.; visualization, R.C.M.Z. and C.M.; supervision, R.C.M.Z., C.M., G.I.-V., F.W.C.-K., A.B.F.-J. and L.G.; project administration, R.C.M.Z., G.I.-V. and A.B.F.-J.; funding acquisition, R.C.M.Z., C.M., G.I.-V., and A.B.F.-J. All authors have read and agreed to the published version of the manuscript.

Funding

This research was funded by the project: “Creación de los servicios de investigación, innovación y desarrollo de tecnología para el sector agrario y agroindustrial de la UNTRM sede Chachapoyas, Provincia de Chachapoyas, Región Amazonas”, C.U. No. 2313205 and SNIP No. 350318. (IIDAA), of the Universidad Nacional Toribio Rodríguez de Mendoza de Amazonas.

Institutional Review Board Statement

Not applicable.

Data Availability Statement

Not applicable.

Acknowledgments

We are appreciative of the support of the rainbow trout producers surveyed in the Amazonas region of Peru.

Conflicts of Interest

The authors declare no conflict of interest.

References

  1. Chopin, P.; Mubaya, C.P.; Descheemaeker, K.; Öborn, I.; Bergkvist, G. Avenues for Improving Farming Sustainability Assessment with Upgraded Tools, Sustainability Framing and Indicators. A Review. Agron. Sustain. Dev. 2021, 41, 19. [Google Scholar] [CrossRef]
  2. Idenyi, J.N.; Eya, J.C.; Nwankwegu, A.S.; Nwoba, E.G. Aquaculture Sustainability through Alternative Dietary Ingredients: Microalgal Value-Added Products. Eng. Microbiol. 2022, 2, 100049. [Google Scholar] [CrossRef]
  3. Sanchez-Matos, J.; Regueiro, L.; González-García, S.; Vázquez-Rowe, I. Environmental Performance of Rainbow Trout (Oncorhynchus mykiss) Production in Galicia-Spain: A Life Cycle Assessment Approach. Sci. Total Environ. 2022, 856, 159049. [Google Scholar] [CrossRef] [PubMed]
  4. Costa-Pierce, B.; Chopin, T. The Hype, Fantasies and Realities of Aquaculture Development Globally and in Its New Geographies. World Aquac. 2021, 52, 23–35. [Google Scholar]
  5. Wilfart, A.; Garcia-Launay, F.; Terrier, F.; Soudé, E.; Aguirre, P.; Skiba-Cassy, S. A Step Towards Sustainable Aquaculture: Multiobjective Feed Formulation Reduces Environmental Impacts at Feed and Farm Levels for Rainbow Trout. Aquaculture 2023, 562, 738826. [Google Scholar] [CrossRef]
  6. Bastardo, A.; Sierralta, V.; León, J.; Ravelo, C.; Romalde, J.L. Phenotypical and Genetic Characterization of Yersinia ruckeri Strains Isolated from Recent Outbreaks in Farmed Rainbow Trout Oncorhynchus mykiss (Walbaum) in Peru. Aquaculture 2011, 317, 229–232. [Google Scholar] [CrossRef]
  7. Gallego-Alarcón, I.; Fonseca, C.R.; García-Pulido, D.; Díaz-Delgado, C. Proposal and Assessment of an Aquaculture Recirculation System for Trout Fed with Harvested Rainwater. Aquac. Eng. 2019, 87, 102021. [Google Scholar] [CrossRef]
  8. Kause, A.; Nousiainen, A.; Koskinen, H. Improvement in Feed Efficiency and Reduction in Nutrient Loading from Rainbow Trout Farms: The Role of Selective Breeding. J. Anim. Sci. 2022, 100, skac214. [Google Scholar] [CrossRef]
  9. Freitas, J.; Vaz-Pires, P.; Câmara, J.S. From Aquaculture Production to Consumption: Freshness, Safety, Traceability and Authentication, the Four Pillars of Quality. Aquaculture 2020, 518, 734857. [Google Scholar] [CrossRef]
  10. Carrera-Quintana, S.C.; Gentile, P.; Girón-Hernández, J. An Overview on the Aquaculture Development in Colombia: Current Status, Opportunities and Challenges. Aquaculture 2022, 561, 738583. [Google Scholar] [CrossRef]
  11. Fuentes-Pérez, J.F.; Sanz-Ronda, F.J. A Custom Sensor Network for Autonomous Water Quality Assessment in Fish Farms. Electronics 2021, 10, 2192. [Google Scholar] [CrossRef]
  12. Bush, S.R.; Pauwelussen, A.; Badia, P.; Kruk, S.; Little, D.; Luong, L.T.; Newton, R.; Nhan, D.T.; Rahman, M.M.; Sorgeloos, P.; et al. Implementing Aquaculture Technology and Innovation Platforms in Asia. Aquaculture 2021, 530, 735822. [Google Scholar] [CrossRef]
  13. Milewski, I.; Smith, R.E. Sustainable Aquaculture in Canada: Lost in Translation. Mar. Policy 2019, 107, 103571. [Google Scholar] [CrossRef]
  14. Valenti, W.C.; Barros, H.P.; Moraes-Valenti, P.; Bueno, G.W.; Cavalli, R.O. Aquaculture in Brazil: Past, Present and Future. Aquac. Rep. 2021, 19, 100611. [Google Scholar] [CrossRef]
  15. Boström, M. A Missing Pillar? Challenges in Theorizing and Practicing Social Sustainability: Introduction to the Special Issue. Sustain. Sci. Pract. Policy 2012, 8, 3–14. [Google Scholar] [CrossRef]
  16. Yunis, C.R.C.; López, R.S.; Cruz, S.M.O.; Castillo, E.B.; López, J.O.S.; Trigoso, D.I.; Briceño, N.B.R. Land Suitability for Sustainable Aquaculture of Rainbow Trout (Oncorhynchus mykiss) in Molinopampa (Peru) Based on RS, GIS, and AHP. ISPRS Int. J. Geo-Inf. 2020, 9, 28. [Google Scholar] [CrossRef]
  17. Machado, M.; Nicholls, I.; Márquez, S.; Turbay, S. Caracterización de Nueve Agroecosistemas de Café de La Cuenca Del Río Porce, Colombia, Con Un Enfoque Agroecológico. IDESIA (Chile) 2015, 33, 69–83. [Google Scholar] [CrossRef]
  18. Wadood, S.A.; Nie, J.; Li, C.; Rogers, K.M.; Khan, A.; Khan, W.A.; Qamar, A.; Zhang, Y.; Yuwei, Y. Rice Authentication: An Overview of Different Analytical Techniques Combined with Multivariate Analysis. J. Food Compos. Anal. 2022, 112, 104677. [Google Scholar] [CrossRef]
  19. Lores, A.; Leyva, A.; Varela, M. Los Dominios de Recomendaciones: Establecimiento e Importancia Para El Análisis Científico de Los Agroecosistemas. Cultiv. Trop. 2008, 29, 5–10. [Google Scholar]
  20. César, V.; Zacarías, A.; Félix; Mayta, C.; Otiniano, A.J.; Jiménez, J.E.; Molina, L.; La Molina-Lima, P. Caracterización Multivariada de Fincas Productoras de Tarwi (Lupinus mutabilis Sweet) Del Valle Del Mantaro, Perú. Sci. Agropecu. 2018, 9, 269–279. [Google Scholar] [CrossRef]
  21. Ogasawara, Y.; Kon, M. Two Clustering Methods Based on the Ward’s Method and Dendrograms with Interval-Valued Dissimilarities for Interval-Valued Data. Int. J. Approx. Reason. 2021, 129, 103–121. [Google Scholar] [CrossRef]
  22. Alvarado, J. Desarrollo de Indicadores de Sostenibilidad Para La Maricultura Del Ecuador. Rev. Int. Investig. Docencia 2016, 1, 20. [Google Scholar] [CrossRef]
  23. Bravo-Ureta, B.E.; Solís, D.; Moreira López, V.H.; Maripani, J.F.; Thiam, A.; Rivas, T. Technical Efficiency in Farming: A Meta-Regression Analysis. J. Product. Anal. 2007, 27, 57–72. [Google Scholar] [CrossRef]
  24. Sarandón, S.J. El desarrollo y uso de indicadores para evaluar la sustentabilidad de los agroecosistemas. In Agroecología. El Camino hacia una Agricultura Sustentable; Ediciones Científicas Americanas: La Plata, Argentina, 2002; pp. 393–414. [Google Scholar]
  25. Chambers, J.M.; Wyborn, C.; Ryan, M.E.; Reid, R.S.; Riechers, M.; Serban, A.; Bennett, N.J.; Cvitanovic, C.; Fernández-Giménez, M.E.; Galvin, K.A.; et al. Six Modes of Co-Production for Sustainability. Nat. Sustain. 2021, 4, 983–996. [Google Scholar] [CrossRef]
  26. Djordjević, B.; Mane, A.S.; Krmac, E. Analysis of Dependency and Importance of Key Indicators for Railway Sustainability Monitoring: A New Integrated Approach with DEA and Pearson Correlation. Res. Transp. Bus. Manag. 2021, 41, 100650. [Google Scholar] [CrossRef]
  27. Banker, R.D.; Charnes, A.; Cooper, W.W. Some Models for Estimating Technical and Scale Efficiencies in Data Envelopment Analysis. Mgmt Sci. 1984, 30, 1078–1092. [Google Scholar] [CrossRef]
  28. Charnes, A.; Cooper, W.W.; Rhodes, E. Measuring the Efficiency of Decision Making Units. Eur. J. Oper. Res. 1978, 2, 429–444. [Google Scholar] [CrossRef]
  29. Tovar-Paredes, J.L.; Narváez-Solarte, W.; Agudelo-Giraldo, L. Tipificación de la gallina criolla en los agroecosistemas campesinos de producción en la zona de influencia de la selva de Florencia (Caldas). Luna Azul 2015, 41, 57–72. [Google Scholar] [CrossRef]
  30. Pinedo-Taco, R.; Pinedo-Taco, R.E.; Gómez-Pando, L.R.; Julca-Otiniano, A.M. Quinoa (Chenopodium quinoa Willd.) farmers typology in agroecosystems of inter-Andean valleys from peru. Trop. Subtrop. Agroecosystems 2021, 24, 110. [Google Scholar] [CrossRef]
  31. Rocha-Rodríguez, C.; Mora-Delgado, J.; Romero-Vargas, J.C. Tipología de Sistemas de Producción En La Zona Rural Del Municipio de Ibagué, Colombia. Agron. Mesoam. 2016, 27, 253–264. [Google Scholar] [CrossRef]
  32. Criollo Escobar, H.; Lagos Burbano, T.C.; Ibarra, T.B.; Muñoz Belalcazar, J.A. CARACTERIZACIÓN DE LOS SISTEMAS PRODUCTIVOS DE CAFÉ EN NARIÑO, COLOMBIA. Rev. U.D.C.A Actual. Divulg. Científica 2016, 19, 105–113. [Google Scholar]
  33. Coaquira Incacari, R.; Julca Otiniano, A.; Coaquira Lastarria, R.J.; Mendoza Cortez, J.W.; Coaquira Incacari, R.; Julca Otiniano, A.; Coaquira Lastarria, R.J.; Mendoza Cortez, J.W. Caracterización de Las Unidades Productoras de Papa (Solanum tuberosum L.) En La Provincia de Jauja, Junín, Perú. Idesia (Arica) 2019, 37, 101–108. [Google Scholar] [CrossRef]
  34. Coronel de Renolfi, M.; Ortuño Pérez, S.F. Tipificación de Los Sistemas Productivos Agropecuarios En El Área de Riego de Santiago Del Estero, Argentina. Probl. Desarro. 2005, 36, 64–88. [Google Scholar] [CrossRef]
  35. Cadillo-Benalcazar, J.J.; Giampietro, M.; Bukkens, S.G.F.; Strand, R. Multi-Scale Integrated Evaluation of the Sustainability of Large-Scale Use of Alternative Feeds in Salmon Aquaculture. J. Clean. Prod. 2020, 248, 119210. [Google Scholar] [CrossRef]
  36. Diken, G.; Koknaroglu, H. Projected Annual Production Capacity Affects Sustainability of Rainbow Trout (Oncorhynchus mykiss Walbaum, 1792) Reared in Concrete Ponds in Terms of Energy Use Efficiency. Aquaculture 2022, 551, 737958. [Google Scholar] [CrossRef]
  37. Rector, M.E.; Filgueira, R.; Grant, J. Ecosystem Services in Salmon Aquaculture Sustainability Schemes. Ecosyst. Serv. 2021, 52, 101379. [Google Scholar] [CrossRef]
  38. Altintas, K.; Vayvay, O.; Apak, S.; Cobanoglu, E. An Extended GRA Method Integrated with Fuzzy AHP to Construct a Multidimensional Index for Ranking Overall Energy Sustainability Performances. Sustainability 2020, 12, 1602. [Google Scholar] [CrossRef]
  39. Valizadeh, N.; Hayati, D. Development and Validation of an Index to Measure Agricultural Sustainability. J. Clean. Prod. 2021, 280, 123797. [Google Scholar] [CrossRef]
  40. Torres, B.; Cayambe, J.; Paz, S.; Ayerve, K.; Heredia-R, M.; Torres, E.; Luna, M.; Toulkeridis, T.; García, A. Livelihood Capitals, Income Inequality, and the Perception of Climate Change: A Case Study of Small-Scale Cattle Farmers in the Ecuadorian Andes. Sustainability 2022, 14, 5028. [Google Scholar] [CrossRef]
  41. Heredia-R, M.; Torres, B.; Cayambe, J.; Ramos, N.; Luna, M.; Diaz-Ambrona, C.G.H. Sustainability Assessment of Smallholder Agroforestry Indigenous Farming in the Amazon: A Case Study of Ecuadorian Kichwas. Agronomy 2020, 10, 1973. [Google Scholar] [CrossRef]
  42. Pope, J.; Annandale, D.; Morrison-Saunders, A. Conceptualising Sustainability Assessment. Environ. Impact Assess. Rev. 2004, 24, 595–616. [Google Scholar] [CrossRef]
  43. Purvis, B.; Mao, Y.; Robinson, D. Three Pillars of Sustainability: In Search of Conceptual Origins. Sustain. Sci. 2019, 14, 681–695. [Google Scholar] [CrossRef]
  44. Kubina, M.; Šulyová, D.; Vodák, J. Comparison of Smart City Standards, Implementation and Cluster Models of Cities in North America and Europe. Sustainability 2021, 13, 3120. [Google Scholar] [CrossRef]
  45. Hughes, A.C.; Qiao, H.; Orr, M.C. Extinction Targets Are Not SMART (Specific, Measurable, Ambitious, Realistic, and Time Bound). Bioscience 2021, 71, 115–118. [Google Scholar] [CrossRef]
  46. Islahuddin, I.; Akib, H.; Eppang, B.M.; Salim, M.A.M.; Darmayasa, D. View of Reconstruction of the Actor Collaboration Model in the Development of Marine Tourism Destinations in the New Normal Local Economy. Linguist. Cult. Rev. 2021, 5, 1505–1520. [Google Scholar] [CrossRef]
  47. d’Orbcastel, E.R.; Blancheton, J.-P.; Aubin, J. Towards Environmentally Sustainable Aquaculture: Comparison between Two Trout Farming Systems Using Life Cycle Assessment. Aquac. Eng. 2009, 40, 113–119. [Google Scholar] [CrossRef]
  48. Dekamin, M.; Veisi, H.; Safari, E.; Liaghati, H.; Khoshbakht, K.; Dekamin, M.G. Life Cycle Assessment for Rainbow Trout (Oncorhynchus mykiss) Production Systems: A Case Study for Iran. J. Clean. Prod. 2015, 91, 43–55. [Google Scholar] [CrossRef]
  49. Iliyasu, A.; Mohamed, Z.A.; Ismail, M.M.; Abdullah, A.M.; Kamarudin, S.M.; Mazuki, H. A review of production frontier research in Aquaculture (2001–2011). Aquac. Econ. Manag. 2014, 18, 221–247. [Google Scholar] [CrossRef]
  50. Arita, S.; Leung, P. A Technical Efficiency Analysis of Hawaii’s Aquaculture Industry. J. World Aquac. Soc. 2014, 45, 312–321. [Google Scholar] [CrossRef]
  51. Iliyasu, A.; Mohamed, Z.A.; Terano, R. Comparative Analysis of Technical Efficiency for Different Production Culture Systems and Species of Freshwater Aquaculture in Peninsular Malaysia. Aquac. Rep. 2016, 3, 51–57. [Google Scholar] [CrossRef]
  52. Aung, Y.M.; Khor, L.Y.; Tran, N.; Shikuku, K.M.; Zeller, M. Technical Efficiency of Small-Scale Aquaculture in Myanmar: Does Women’s Participation in Decision-Making Matter? Aquac. Rep. 2021, 21, 100841. [Google Scholar] [CrossRef]
  53. Iliyasu, A.; Mohamed, Z.A.; Ismail, M.M.; Abdullah, A.M. A Meta-Analysis of Technical Efficiency in Aquaculture. J. Appl. Aquac. 2014, 26, 329–339. [Google Scholar] [CrossRef]
  54. See, K.F.; Ibrahim, R.A.; Goh, K.H. Aquaculture Efficiency and Productivity: A Comprehensive Review and Bibliometric Analysis. Aquaculture 2021, 544, 736881. [Google Scholar] [CrossRef]
Figure 1. Location of the production units studied.
Agriculture 13 00390 g001
Figure 2. Two-dimensional projections: (a) the first (PC1) and second (PC2), (b) the first (PC1) and third (PC3), (c) the second (PC2) and third (PC2).
Agriculture 13 00390 g002
Figure 3. Dendrogram of 23 TPUs resulting from cluster analysis (Ward’s method, cut-off distance 7) based on three new factors.
Agriculture 13 00390 g003
Figure 4. Levels of sustainability for sub-indicators of the environmental dimension in trout producing units in the Amazonas region. The blue line indicates the average level of sustainability per item (I) of the questionnaire.
Agriculture 13 00390 g004
Figure 5. Sustainability levels for sub-indicators of the social dimension in trout production units in the Amazonas region. The yellow line indicates the average level of sustainability per item (I) of the questionnaire.
Agriculture 13 00390 g005
Figure 6. Levels of sustainability for sub-indicators of the economic dimension in trout producing units in the Amazonas region.- The red line indicates the average level of sustainability per item (I) of the questionnaire.
Agriculture 13 00390 g006
Figure 7. Sustainability levels for the environmental, social and economic dimensions in the trout producing units in the Amazonas region. The orange line indicates the average level of sustainability per dimension.
Agriculture 13 00390 g007
Figure 8. Plot correlation for the dimensions of sustainability in trout production units in Amazonas region. The black line above the bars indicates the distribution of the data and the red lines the relationship between the dimensions.
Agriculture 13 00390 g008
Table 1. DEA model used to calculate efficiency.
Inputs {I}Output {o}
DescriptionAbbreviationUnit
Number of employeesEmpl.PersonGross fish production per season
Quantity of fry seed used per seasonAlev.Millar
Number of seasons per yearCamp.Unit
Area of the farmAream2
Pre-start feedAl_preikg
Starter feedAl_ikg
Growth feedAl_ckg
Feed for fatteningAl_ekg
Finishing feedAl_akg
Amount of water usedAguam3/s
The Efficiency Measurement System V 1.3.0 downloaded from http://www.holger-scheel.de/ems/ (accessed on 05 April 2022) was used for the calculation.
Table 2. Use of the CV for the selection of variables in the TPU, Amazonas region, Peru.
Item No.VariableMeanStandard DeviationCV (%)
Social Aspect
I-5Basic service not provided1.890.9952.5
I-8District/village/village/hamlet has public transportation0.780.4253.2
I-9Participates or belongs to a productive association0.300.46155.9
I-10Monthly income3.762.0253.8
I-11Has access to credit for production0.350.48137.7
I-12Receives training in trout farming0.680.4770.2
Economic aspect
I-13Trout harvests per year2.241.1651.9
I-14Volume of production per harvest in tons2.621.2146.2
I-18Activity other than trout farming2.811.8565.9
I-19Owns title deed to fish farm0.460.51110.0
I-21Average density per m2 of trout in fattening stage2.921.6757.3
I-24How trout is sold 2.111.4970.5
I-25Selling price per kilo of trout1.890.8142.8
I-27To whom you sell your production2.491.2650.7
I-28Where you sell your production2.921.3847.3
I-29Number of people working in your production center1.350.6346.9
I-30Years of experience in fish farming2.651.1643.8
Environmental aspect
I-32Water flow0.650.4874.6
I-34Final waste disposal0.840.3744.6
I-35Has other type of authorization apart from DIREPRO0.730.4561.7
I-36Antibiotics are used in production0.350.48137.7
I-37Main problems at UPT2.651.1643.8
I-39Adequate management of ordinary solid waste0.540.5193.5
Table 3. Principal component analysis of the variables evaluated in the TPUs.
Principal ComponentsComponent VarianceProportion of VarianceProportion of Cumulative Variance
CP11.33413.7613.76
CP21.26911.2825.04
CP31.24210.3535.40
CP41.1597.8443.24
CP51.1387.3050.54
CP61.1126.6557.19
CP71.0966.2763.45
CP81.0365.0168.47
CP90.9994.3372.80
Table 4. Factor loadings of the rotated factors (Varimax) with the generation of new synthetic variables in the TPUs.
ItemItem CodeComponent/Factor LoadingsGeneration of Synthetic Variable
C1C2C3
Monthly income
I-100.8140.0000.131TPU revenue generation
They have access to credit for their production
I-110.5280.0000.000
Main problems presented in the TPU
I-37−0.5340.0000.000
Participates or belongs to a productive association
I-9−0.2330.572−0.254Socio-environmental reality of the TPU
Number of people working in the production center
I-290.4250.6410.000
Has final disposal of its waste
I-340.000−0.577−0.143
Has another type of authorization apart from DIREPRO
I-350.000−0.5400.000
Average density per m2 of trout at fattening stage
I-210.0000.1320.949TPU production
Where production is sold
I-280.0000.1360.500
Table 5. Social, economic and environmental sustainability index values, according to indicators.
DimensionsIndicatorsValue *General Index *
SocialHuman Resources2.11.9
Working Conditions1.3
Social Responsibility2.5
EconomicEconomic Performance Level2.62.1
Operations and Production2.3
Tech. Research and Development1.4
EnvironmentalMarketing and Sales2.52.7
Carbon Footprint2.5
Ecological Footprint2.3
Water Quality3.5
* The values of the indicators and the general index were evaluated by assigning a scale from 1 to 4, with 4 being the highest value and 1 being the lowest sustainability value.
Table 6. Achievement of goals by tranches (averages).
Efficiency (%)TPUFEmpl. {I}Alev. {I}Camp {I}Area {I}Al_prei {I}Al_i {I}Al_c{I}Al_e {I}Al_a {I}Water {I}Meta
Production {O}
1002CHCH, 5CHM, 6CHM, 7CHM, 11CHM, 21CHJ, 22CHJ, 23CHJ, 25LST, 26LST, 27LST, 31LST, 33LST, 41LOR, 48BET, 53UPB, 55UNY, 56ULG, 58UP, 59BA142274234739267115841814923371
90–1002CHCH, 23CHJ, 31LST, 58UP4394762116937815251875591325
70–9011CHM, 21CHJ, 22CHJ, 26LST, 27LST, 59BA633439410710075612801540841640
50–705CHM, 6CHM, 7CHM, 33LST, 41LOR, 48BET, 53UPB, 55UNY8219431053864759381225751325
45–5025LST, 56ULG217483631757001100140070750
Table 7. Efficient trout production units.
CriteriaEmpl. {I}Alev. {I}Camp {I}Area {I}Al_prei {I}Al_i {I}Al_c {I}Al_e {I}Al_a {I}Water {I}Target Production {O}
Minimum122603401006801000601500
Average2274234739267115841814923371
Maximum410066005002503000400060002617000
Std. dev.1331153133587099391280521951
Table 8. Inefficient trout productive units.
CriteriaEmpl. {I}Alev. {I}Camp {I}Area {I}Al_prei {I}Al_i {I}Al_c {I}Al_e {I}Al_a {I}Water {I}Target Production {O}
Minimum13246525250600100015500
Average21941945911354311801465741335
Maximum4150510004505002300320036001203000
Std. dev.134122210312244561355823525
Table 9. Achievement of goals.
CriteriaEmpl. {I}Alev. {I}Camp {I}Area {I}Al_prei {I}Al_i {I}Al_c {I}Al_e {I}Al_a {I}Water {I}Target
Production {O}
Minimum010223159029736511500
Average162781534230631852391335
Maximum3173181489040515011767673000
Std. dev.1413611179124931815525
Table 10. Differences between inefficient DMUs and targets.
CriteriaEmpl. {I}Alev. {I}Camp {I}Área {I}Al_prei {I}Al_i {I}Al_c {I}Al_e {I}Al_a {I}Water {I}
Inefficient2194194591135431180146574
Target16278153423063185239
Improvement47.26%69.26%55.45%59.66%74.73%69.71%57.62%46.49%41.82%46.54%
Disclaimer/Publisher’s Note: The statements, opinions and data contained in all publications are solely those of the individual author(s) and contributor(s) and not of MDPI and/or the editor(s). MDPI and/or the editor(s) disclaim responsibility for any injury to people or property resulting from any ideas, methods, instructions or products referred to in the content.

