Article

Partition Management of Soil Nutrients Based on Capacitive Coupled Contactless Conductivity Detection

1
National Engineering Research Center for AgroEcological Big Data Analysis & Application, School of Internet, Anhui University, Hefei 230039, China
2
Institute of Intelligent Machines, Hefei Institutes of Physical Science, Chinese Academy of Sciences, Hefei 230031, China
3
Zhongke Hefei Institutes of Collaborative Research and Innovation for Intelligent Agriculture, Hefei 231131, China
*
Author to whom correspondence should be addressed.
Agriculture 2023, 13(2), 313; https://doi.org/10.3390/agriculture13020313
Submission received: 30 December 2022 / Revised: 19 January 2023 / Accepted: 25 January 2023 / Published: 28 January 2023
(This article belongs to the Section Digital Agriculture)

Abstract

:
A method based on capacitively coupled contactless conductivity detection (C4D), which has been proven effective for the rapid detection of available soil potassium content, was firstly proposed to apply to soil nutrient detection. By combining a detection signal spectrum analysis, geographic information system (GIS) data, and a cluster analysis, a soil nutrient management system to match the detection device was developed. This system included six modules: soil sample information management, electrophoresis analysis, quantitative calculation, nutrient result viewing, cluster analysis, and nutrient distribution map generation. The soil samples, which were collected from an experimental field in Xuchang City of Henan Province, were analyzed using the C4D and flame photometer methods. The results showed that the detection results for the soil samples obtained via the two methods were in good agreement. C4D technology was feasible for the detection of the soil available nutrients and had the advantages of a high timeliness, low sample volume, and low pollution. The soil nutrient management system adopted the hierarchical clustering method to classify the grid cells of the experimental field according to the nutrient detection results. A soil nutrient distribution map displayed the spatial difference in nutrients. This paper provides a systematic solution for soil nutrient zone management that includes nutrient detection, signal analysis, data management for the nutrient zone, and field nutrient distribution map generation to support decision making in variable fertilization.

1. Introduction

The sustainable development of agriculture is the basis for human survival and development, so industrial agriculture, which sustains a high output with high inputs, is facing increasing economic and environmental pressures [1,2,3]. For the current outstanding issues of excessive fertilization and a low quality of arable land, China’s first document repeatedly stresses the need to pay attention to the quality of arable land, expand soil testing and formulated fertilization, and implement a ‘grain in the ground, grain in technology’ strategy to improve food production capacity [4,5,6].
In agricultural production, realizing better soil nutrient zone management and optimizing the amount of fertilization according to crop needs and farmland soil nutrients are effective ways to enhance nutrient utilization efficiency, improve food quality, and protect the agricultural environment [7,8,9,10,11,12]. Accurate, rapid, and low-cost access to nitrogen (N), phosphorus (P), and potassium (K) nutrient contents in field soils is a prerequisite for implementing soil nutrient zone management [13,14].
The determination of N, P, K, and other nutrients in soil usually adopts traditional chemical methods such as the flame photometer method [15], the atomic absorption method [16], molybdenum antimony spectrophotometry [17], etc. These methods have the problems of a high cost, long duration, complicated operation, and so on. The measurement methods for different nutrient types and different forms of nutrients are different and need to be determined separately [18,19]. Spectroscopy technology can quickly and easily obtain soil spectral information for the detection of soil nutrients or heavy metals via model inversion [20,21,22,23,24,25]. However, the spectroscopy method is costly and has high requirements in the detection environment. Soil moisture, light intensity, soil particle size, and other factors may interfere with the detection of the soil nutrient content [26,27,28]. In order to obtain quantitative results, the optimal model construction is a key link [29,30], and this process requires sufficient sample data. In addition, the prediction model lacks universality due to geographical differences, soil types, and other factors [30].
Electrochemical methods have the ability to test samples directly, quickly, and accurately [31]. Among them, capacitive coupled contactless conductivity detection (C4D) technology provides a new idea for the quantitative analysis of soil nutrients [32,33,34]. In recent years, the combination of a micro-channel as a carrier with electrochemical detection has become a popular detection method for researchers due to the high throughput, low sample volume, and high sensitivity of the micro-channel system [35]. C4D based on a micro-channel has been widely used in the early detection of diseases, drug testing, food additive testing, etc. [36,37,38]. For the past few years, our research team has concentrated on work in the detection of soil available nutrients using C4D combined with capillary electrophoresis and successfully developed a C4D device for soil available nutrients that supports the electrical signal detection of NO3, NH4+, H2PO4, and K+ in sample solutions [34]. The method has the advantages of being simple and low-cost with a low consumption of reagents and samples as well as a rapid detection ability. Meanwhile, it also has great potential for miniaturization and portability.
In addition, a method for using the soil nutrient detection signal obtained by the C4D device to carry out partition management of soil nutrients is the key to the implementation of variable fertilization. Partition management of soil nutrients is based on soil properties, spatial information, environmental factors that affect the nutrient distribution, and human factors. With the development of digital agriculture, GIS and data mining are now widely used in agricultural information technology. The method of dividing variable fertilization management units based on the spatial difference in soil nutrients has become a hot spot in modern soil nutrient management [39,40]. As an unsupervised learning method, using the classification results of a cluster analysis can more objectively reflect the distribution of the data itself. The cluster analysis has played an important role in soil evaluation and nutrient management in recent years [41,42,43]. Therefore, a cluster analysis can be used as an effective means for classification in delineating soil nutrient management zones.
In this study, a self-developed C4D device to detect the soil available nutrients was used. An experimental field located in Xuchang, Henan Province, China, was selected as the research object. By combining a detection signal spectrum analysis, geographic information system data, and a cluster analysis, a soil nutrient management system was developed. The system included the analysis of the ion electrophoresis signal and quantitatively inverted the available nutrient concentrations such as ammonia nitrogen, nitrate nitrogen, available potassium, and available phosphorus in the soil. By superimposing the nutrient results of the soil sampling points on the vector map, the spatial differences in nutrients could be visually displayed. The nutrient partition model was constructed using unsupervised learning to classify the farmland soil nutrient to obtain the soil nutrient zone and nutrient distribution map and provide a decision-making basis for variable fertilization. The study in this paper was the main research content of the 13th Five-Year National Key R & D Program “The Research of Agricultural Machinery Variable Operation Technology and Device”.

2. Materials and Methods

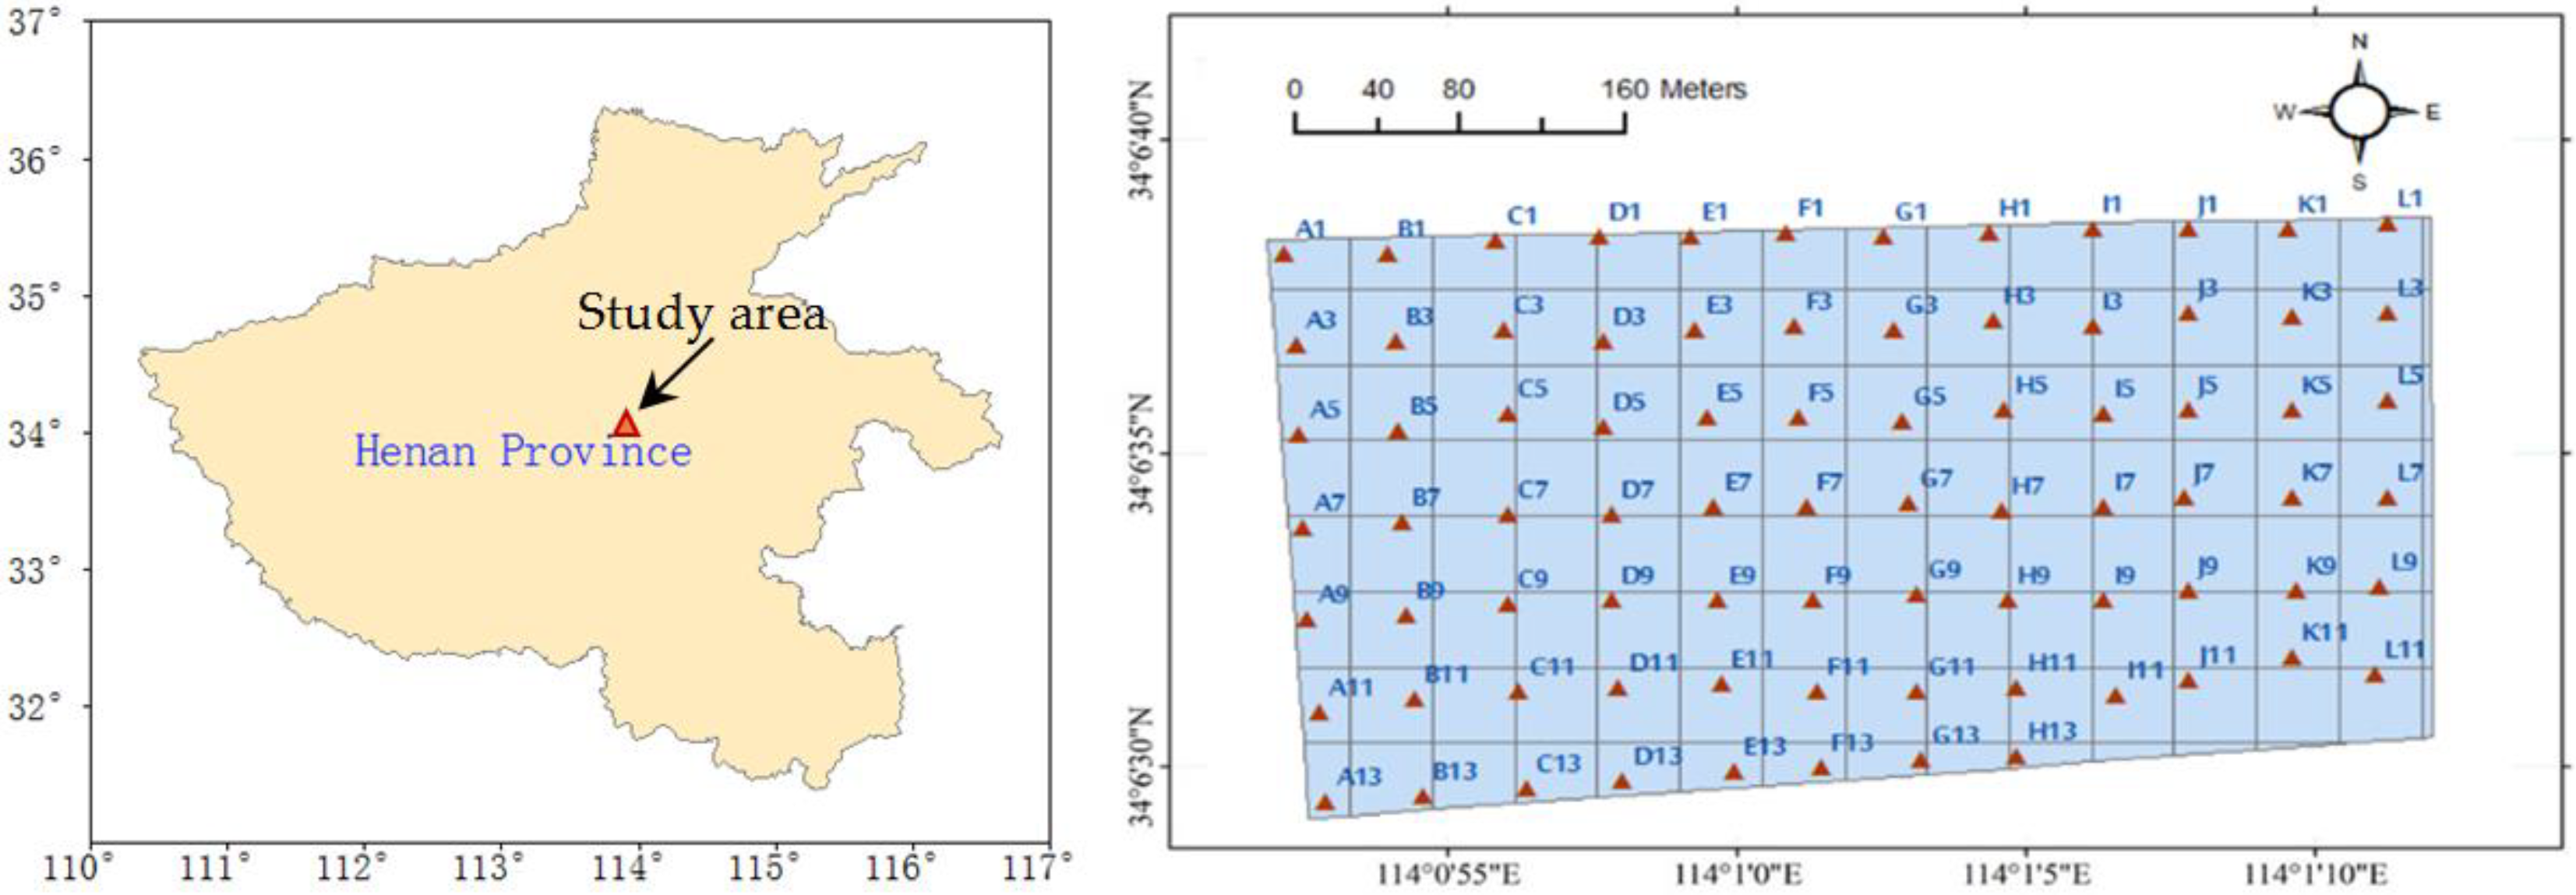
2.1. Overview of the Research Region

This study was conducted in Wanzhuang Village, Chencao Township, Jian’an District, Xuchang City, Henan Province, China. Xuchang City has a warm temperate sub-humid monsoon climate with abundant rainfall and sufficient light. The annual average temperature is about 15 °C, the sunshine totals 2280 h, the annual precipitation is about 700 mm, and the frost-free period is 217 days. The experimental site was located at 114°00′51.40″ E–114°01′13.00″ E longitude and 34°06′30.60″ N–34°06′38.88″ N latitude. The experimental area was about 280 mu, and the main crop was wheat and corn rotation.

2.2. Soil Sampling and Preprocessing

According to the characteristics of the experimental field and the frequency of the execution structure of the fertilization variable, the soil sampling was carried out after the wheat harvest in June 2019. The sampling points were arranged on a 40 m × 40 m grid with 91 designated sampling points. The sampling depth was 0–20 cm in the topsoil. The soil samples from each sample point were collected and mixed at five points. After the five-point soil samples were mixed, the four-point method was used to retain 1 kg of each sample. Each soil sample was numbered, and the GPS information for the sampling point was recorded. Finally, 80 valid soil samples were determined as shown in Figure 1. The collected soil samples were placed on the sample plate in a timely manner, spread into a thin layer, and then placed in a clean and tidy indoor ventilation area. After natural drying, the plant roots and gravel were removed and the samples were ground, sieved with a 1 mm aperture sieve, and stored in order to prepare them for the subsequent C4D detection.

2.3. Research Methods

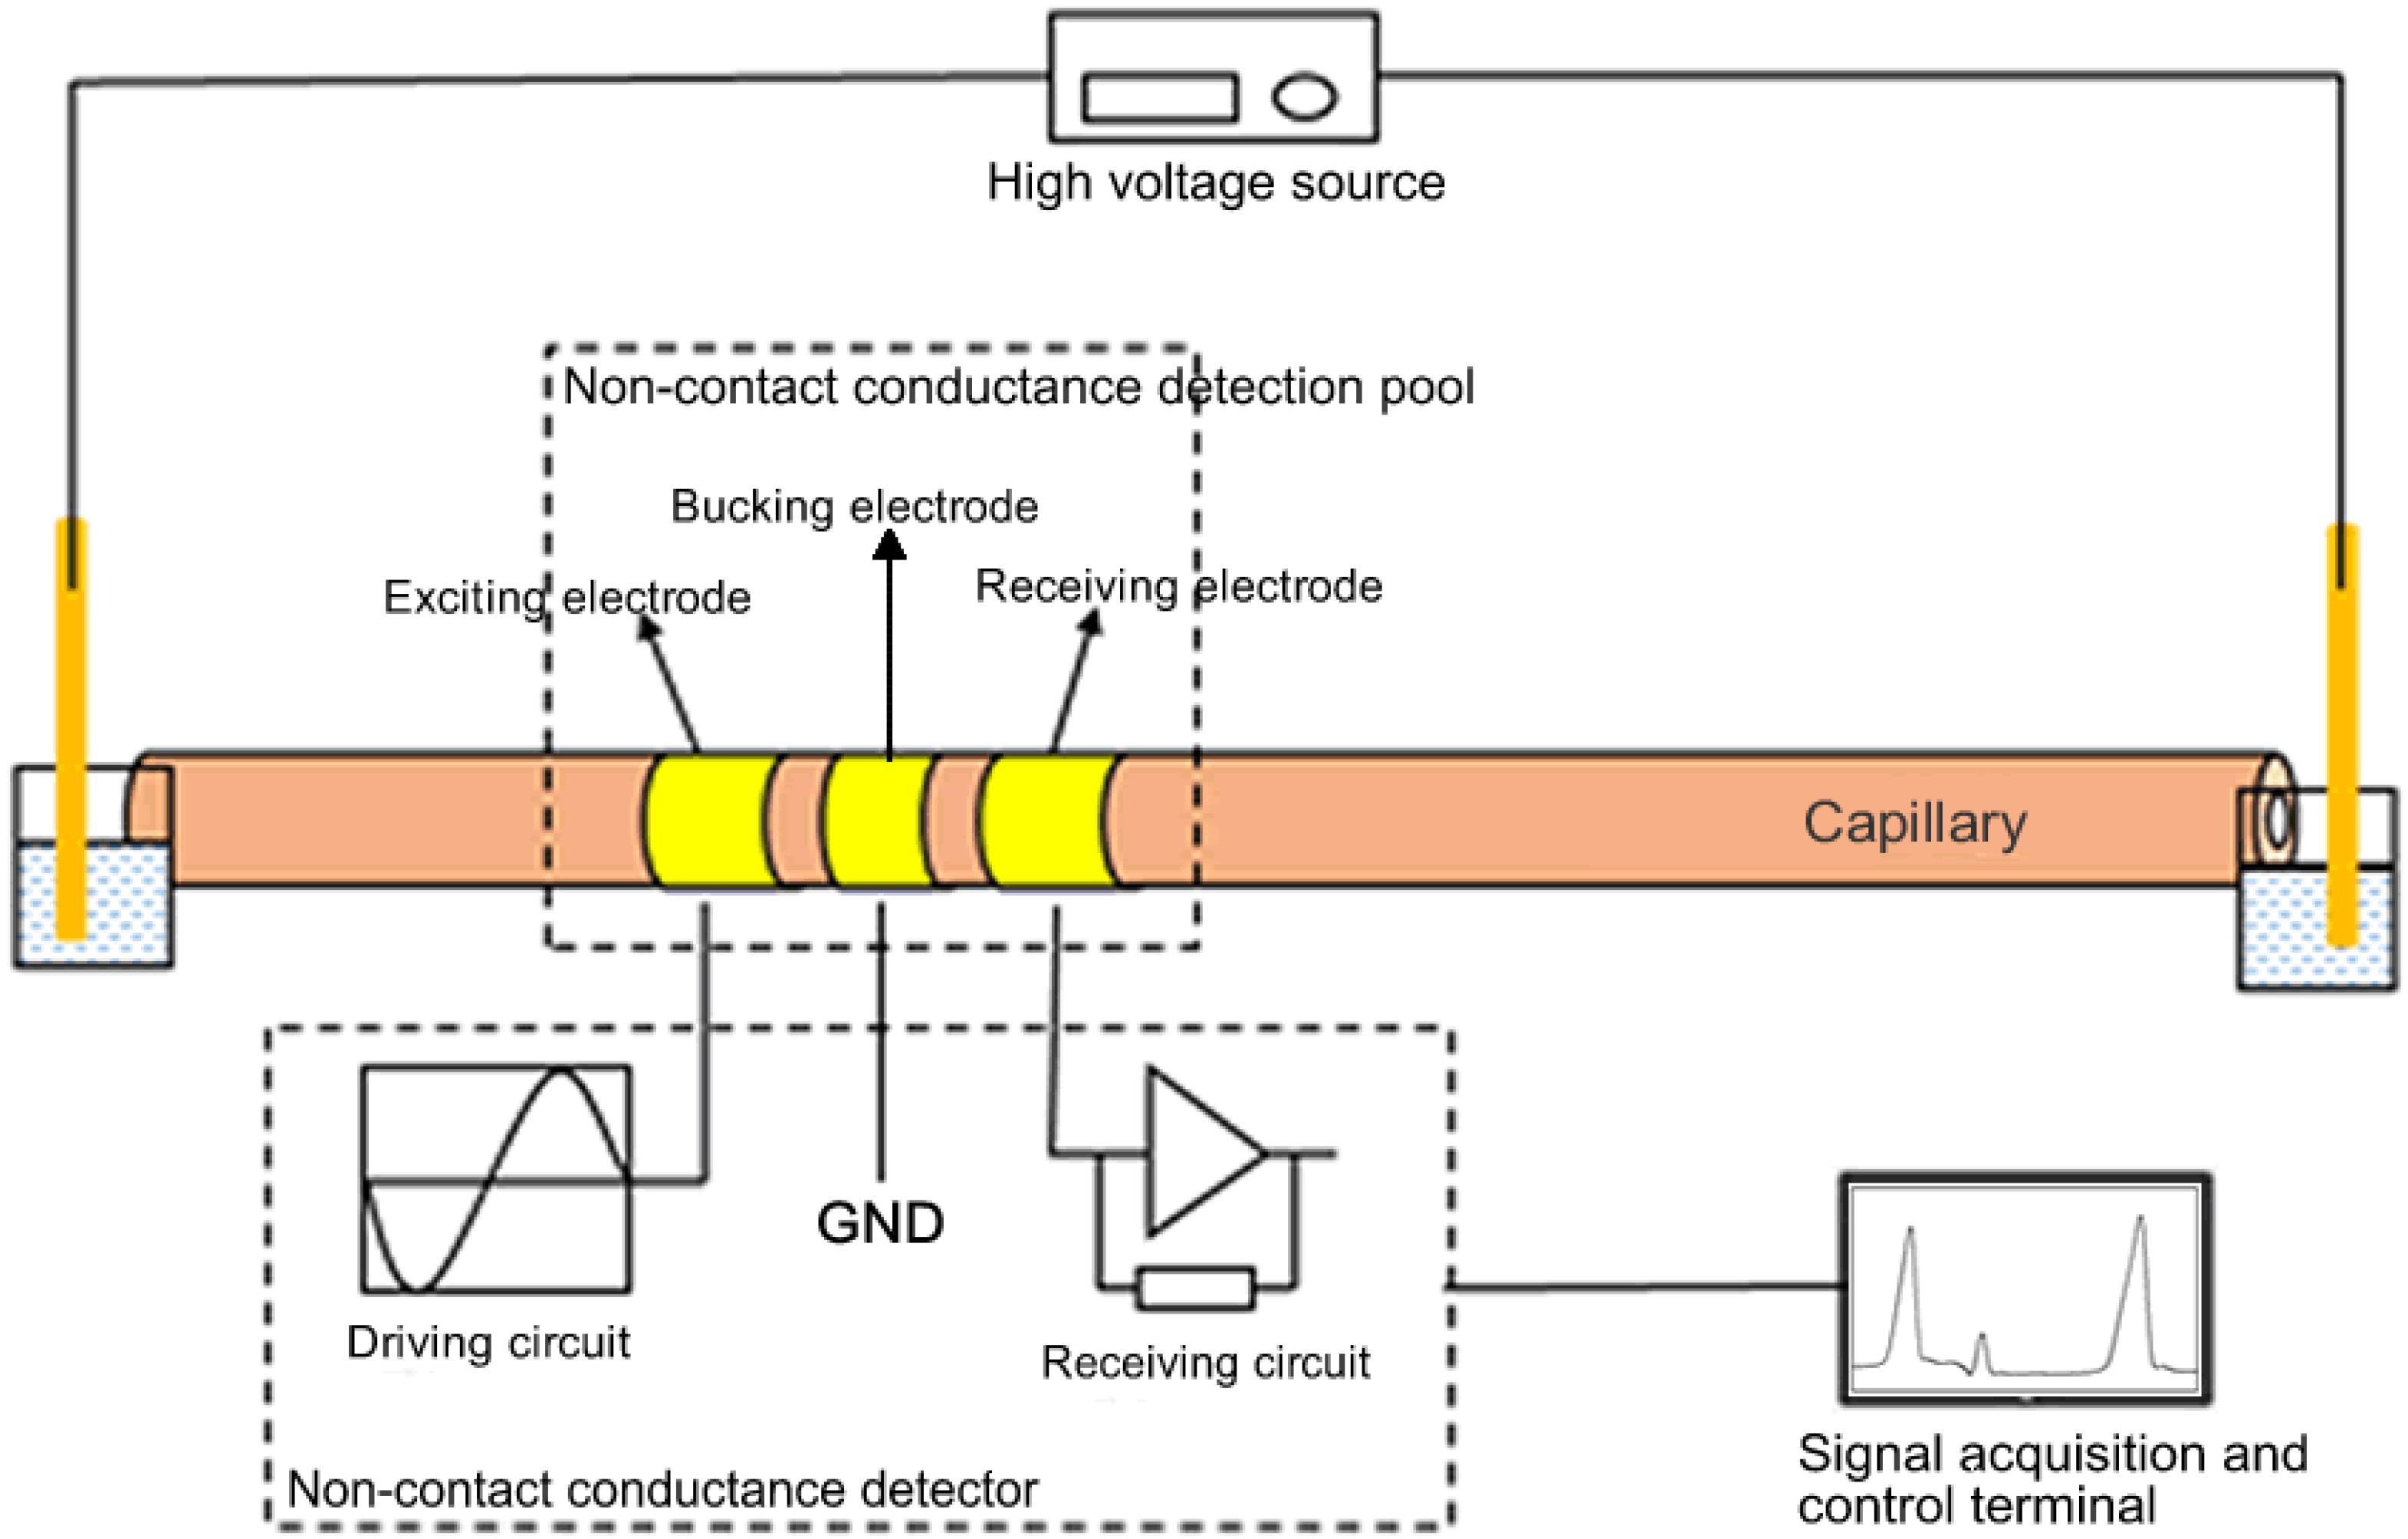
2.3.1. Capacitive Coupled Contactless Conductivity Detection of Soil Nutrients

Efficient nutrient detection is the primary requirement for generating an effective nutrient distribution map. We applied C4D technology to the detection of ionic nutrients in the soil and successfully developed a C4D device for effective nutrients in the soil [22]. The device uses capillary electrophoretic separation channels. The overall structure of the detection device is shown in Figure 2; the key modules include the C4D detector module, C4D cell module, high-voltage power supply module, signal acquisition and control terminal modules, etc. Different running liquids are filled in the capillary tubes according to the different ions to be measured. After the sample is injected, the nutrient ions in the capillary are separated in the running liquid under the action of the migration voltage.
The different ions in the capillary display different movement velocities under the combined action of electrophoresis and electro-osmotic flow, and the time to reach the capillary end detector is also different to distinguish and detect different types of nutrient ions.

2.3.2. Experimental Design and Detection Operations

(1) Instruments and reagents
The instruments used included an independently developed capillary electrophoresis pool and high-voltage power supply (CE-IIM-651A), a non-contact conductivity detector a fused silica capillary; a flame photometer; an analytical balance, a dKZ-2 reciprocating oscillation machine, and an ultrasonic cleaner.
The standard substances used include tris, ethylenediaminetetraacetic acid (EDTA, non-sodium salt), polyvinylpyrrolidone (PVP; average molecular weight M = 30,000), potassium nitrate, sodium hydroxide (analytically pure), glacial acetic acid, ammonium chloride (analytically pure); ultrapure water (Milli-Q ultrapure water system preparation).
The steps in the configurations of the solutions consisted of:
pTAE buffer mother liquor: weigh 3.03 g of tris and 0.18 g of EDTA into a 50 mL clean plastic bottle, add about 40 mL of ultrapure water, shake well to dissolve it fully, add 0.30 mL of glacial acetic acid into the above plastic bottle, dissolve it fully, and set the volume to the scale with ultrapure water;
Capillary electrophoresis cationic running solution: weigh 0.60 g of PVP into a clean plastic beaker, dissolve it with an appropriate amount of ultrapure water and transfer into a 100 mL volumetric flask. Then, add 2 mL of pTAE Buffer mother liquor into the above 100 mL volumetric flask and add ultrapure water to fix the volume to the scale;
Capillary anion running solution: transfer 150 μL of glacial acetic acid into a 100 mL volumetric flask containing 80 mL of ultrapure water and add ultrapure water to fix the volume to the scale.
(2) Preparation of soil water extract
The pretreated soil samples were weighed (3 g; accurate to 0.01 g) in a 200 mL triangular flask, and 30 mL of ultrapure water (soil-liquid ratio of 1:10) was added and sealed with a parafilm. After shaking for 30 min at 25 °C using a rotational speed of 180 r/min in a constant temperature water bath, the filtrate was filtered using quantitative filter paper, and the filtrate was pushed through a needle-type filter (0.45 μm/25 mm) using a disposable syringe for secondary filtration and placed into the sample tube. The water extraction method was used to effectively avoid the environmental pollution caused by the traditional chemical method with extracting agents.
(3) Instrument preparation
1)
Capillary channel: Wash both ends of the capillary tubes, platinum electrodes, etc., with ultrapure water. The solution storage bottle and detection cell were washed with running solution, and an appropriate amount of electrophoresis running solution was added to each of them. A special syringe was used to clean the inside of the capillary with ultrapure water and the electrophoresis running solution. After rinsing, the two ends of the capillary were completely immersed in the electrophoresis running solution in the detection cell and the storage bottle.
2)
Instrument hardware: make sure that the instrument components are wired correctly and keep the room temperature at 25 °C. Turn on the high-voltage power supply and detector in turn. For the first time, adjust the operating voltage of the high-voltage power supply, set +14 kV for cation detection, −14 kV for anion detection, 10 s injection time, 12 kV injection voltage, and zero the detector display.
3)
Acquisition software: confirm that the acquisition card has been connected to the computer. Run the data-acquisition software, confirm that the serial port communicates successfully, and set the experimental information and method.
(4) Detection and analysis operations
1)
Running baseline: according to the object to be measured, select the appropriate high-voltage parameters, start the high-voltage power supply, and at the same time run the acquisition program. At this time, the baseline will begin to appear in the acquisition software interface on the screen. When the baseline is running smoothly (generally running 4–5 min), turn off the high-voltage power supply and stop the acquisition program, and the data will be saved automatically. If the baseline is unstable, eliminate the cause and run the baseline test again.
2)
Sample injection: remove the liquid storage bottle and replace it with an injection bottle containing 1 mL of the soil water extract to be tested. Select the injection and start the injection high-voltage power supply. After the injection voltage returns to 0, remove the sample bottle and replace it with the liquid storage bottle.
3)
Measurement and spectrum recording: Select the appropriate high-voltage parameters, turn on the high-voltage power supply and run the acquisition program again, and the acquisition program will begin recording the electrophoretic signal spectrogram. After the target ion electrophoresis peak appears, turn off the high-voltage power supply and stop the acquisition program, and the data will be saved automatically.
4)
Spiking injection: add 0.05 mL of the standard solution of the target ion (concentration of 200 mg/L) to a sample injection bottle containing 1 mL of soil water extract, repeat steps (2) and (3), and perform the secondary electrical injection and spectrum recording operation. It will take about 20 min to complete the detection process for a soil sample.

2.3.3. Quantitative Calculation of Soil Nutrient Content

The electrophoretic signal intensity detected by the detector could be inverted to obtain the soil ion concentration. Using the standard addition method [44], the effective soil nutrient content was calculated using the change in the peak area of the ion electrophoresis peaks before and after the spiking injection. We set the volume of the solution before spiking as V1 (mL), the volume of the solution after spiking as V2 (mL), the electrophoretic peak area before spiking as S1, the electrophoretic peak area after spiking as S2, the original concentration of the standard solution as C0 mg/L, the ion concentration of the soil water extract as Ct mg/L, the corresponding electrophoretic peak area as S1, the concentration of target ion contained in solution after standard addition as V 1 C t + ( V 2 V 1 ) C 0 V 2 mg/L, and the corresponding electrophoretic peak area as S2; then the ion concentration Ct of the soil water extract was calculated using Equation (1) as follows:
C t = S 1 S 2 × ( V 2 V 1 ) C 0 V 2 1 S 1 S 2 V 1 V 2
The ion concentration C (mg/kg) in the soil sample to be measured could be obtained by converting via the ion concentration in the soil water extract. We set the ion concentration in the soil water extract as Ct (mg/L), weighed Y g soil sample for soil extraction, and added ultrapure water as Z (mL); then the ion concentration C in the soil sample was calculated using Equation (2) as follows:
C = C t × Z × 10 3 Y × 10 3

2.3.4. Cluster Analysis for Soil Nutrient Classification

Based on the results of the soil nutrient calculation, a cluster analysis was used to realize the classification of the soil nutrient grade, which provided a decision-making basis for soil nutrient partition management. A cluster analysis is an unsupervised learning method that can automatically classify a batch of samples according to their degree of affinity in nature without prior knowledge. Hierarchical clustering methods, which are widely used around the world, were adopted in this experiment. The basic idea of hierarchical clustering methods is to regard n samples as a class and then determine the distance between the samples and the distance between the classes. First, due to each sample being a class, the distance between each class is equal to the distance between each sample. Then, two classes with the smallest distance are selected and merged into a new class to calculate the distance between the new class and the other classes. Thus, the two nearest classes are merged so that one class is reduced each time until all the samples are in one class. A hierarchical clustering analysis need not use the classification criteria and the number of categories, but can perform the classification objectively using the data itself. In this study, the soil nutrient concentration was usually a one-dimensional numerical variable after quantification. The shortest Euclidean distance was used as the distance-measurement method.

3. Results

3.1. Soil Nutrient Partition-Management System Based on Capacitive Coupled Contactless Conductivity Detection

The current experiments to detect NO3, NH4+, H2PO4, and K+ were carried out by using the C4D of soil available nutrients. With an aim to analyze and process the ion electrophoretic signal and nutrient zone and conduct data management, the Delphi programming language, the MySql database management system, and the MapX map control were used to develop a soil nutrient management system to match the detection device that was developed. The system functions included soil sample information management, electrophoresis analysis, quantitative calculation, nutrient result view, cluster analysis, and nutrient distribution map generation. The key steps are described in detail below using K+ as an example.

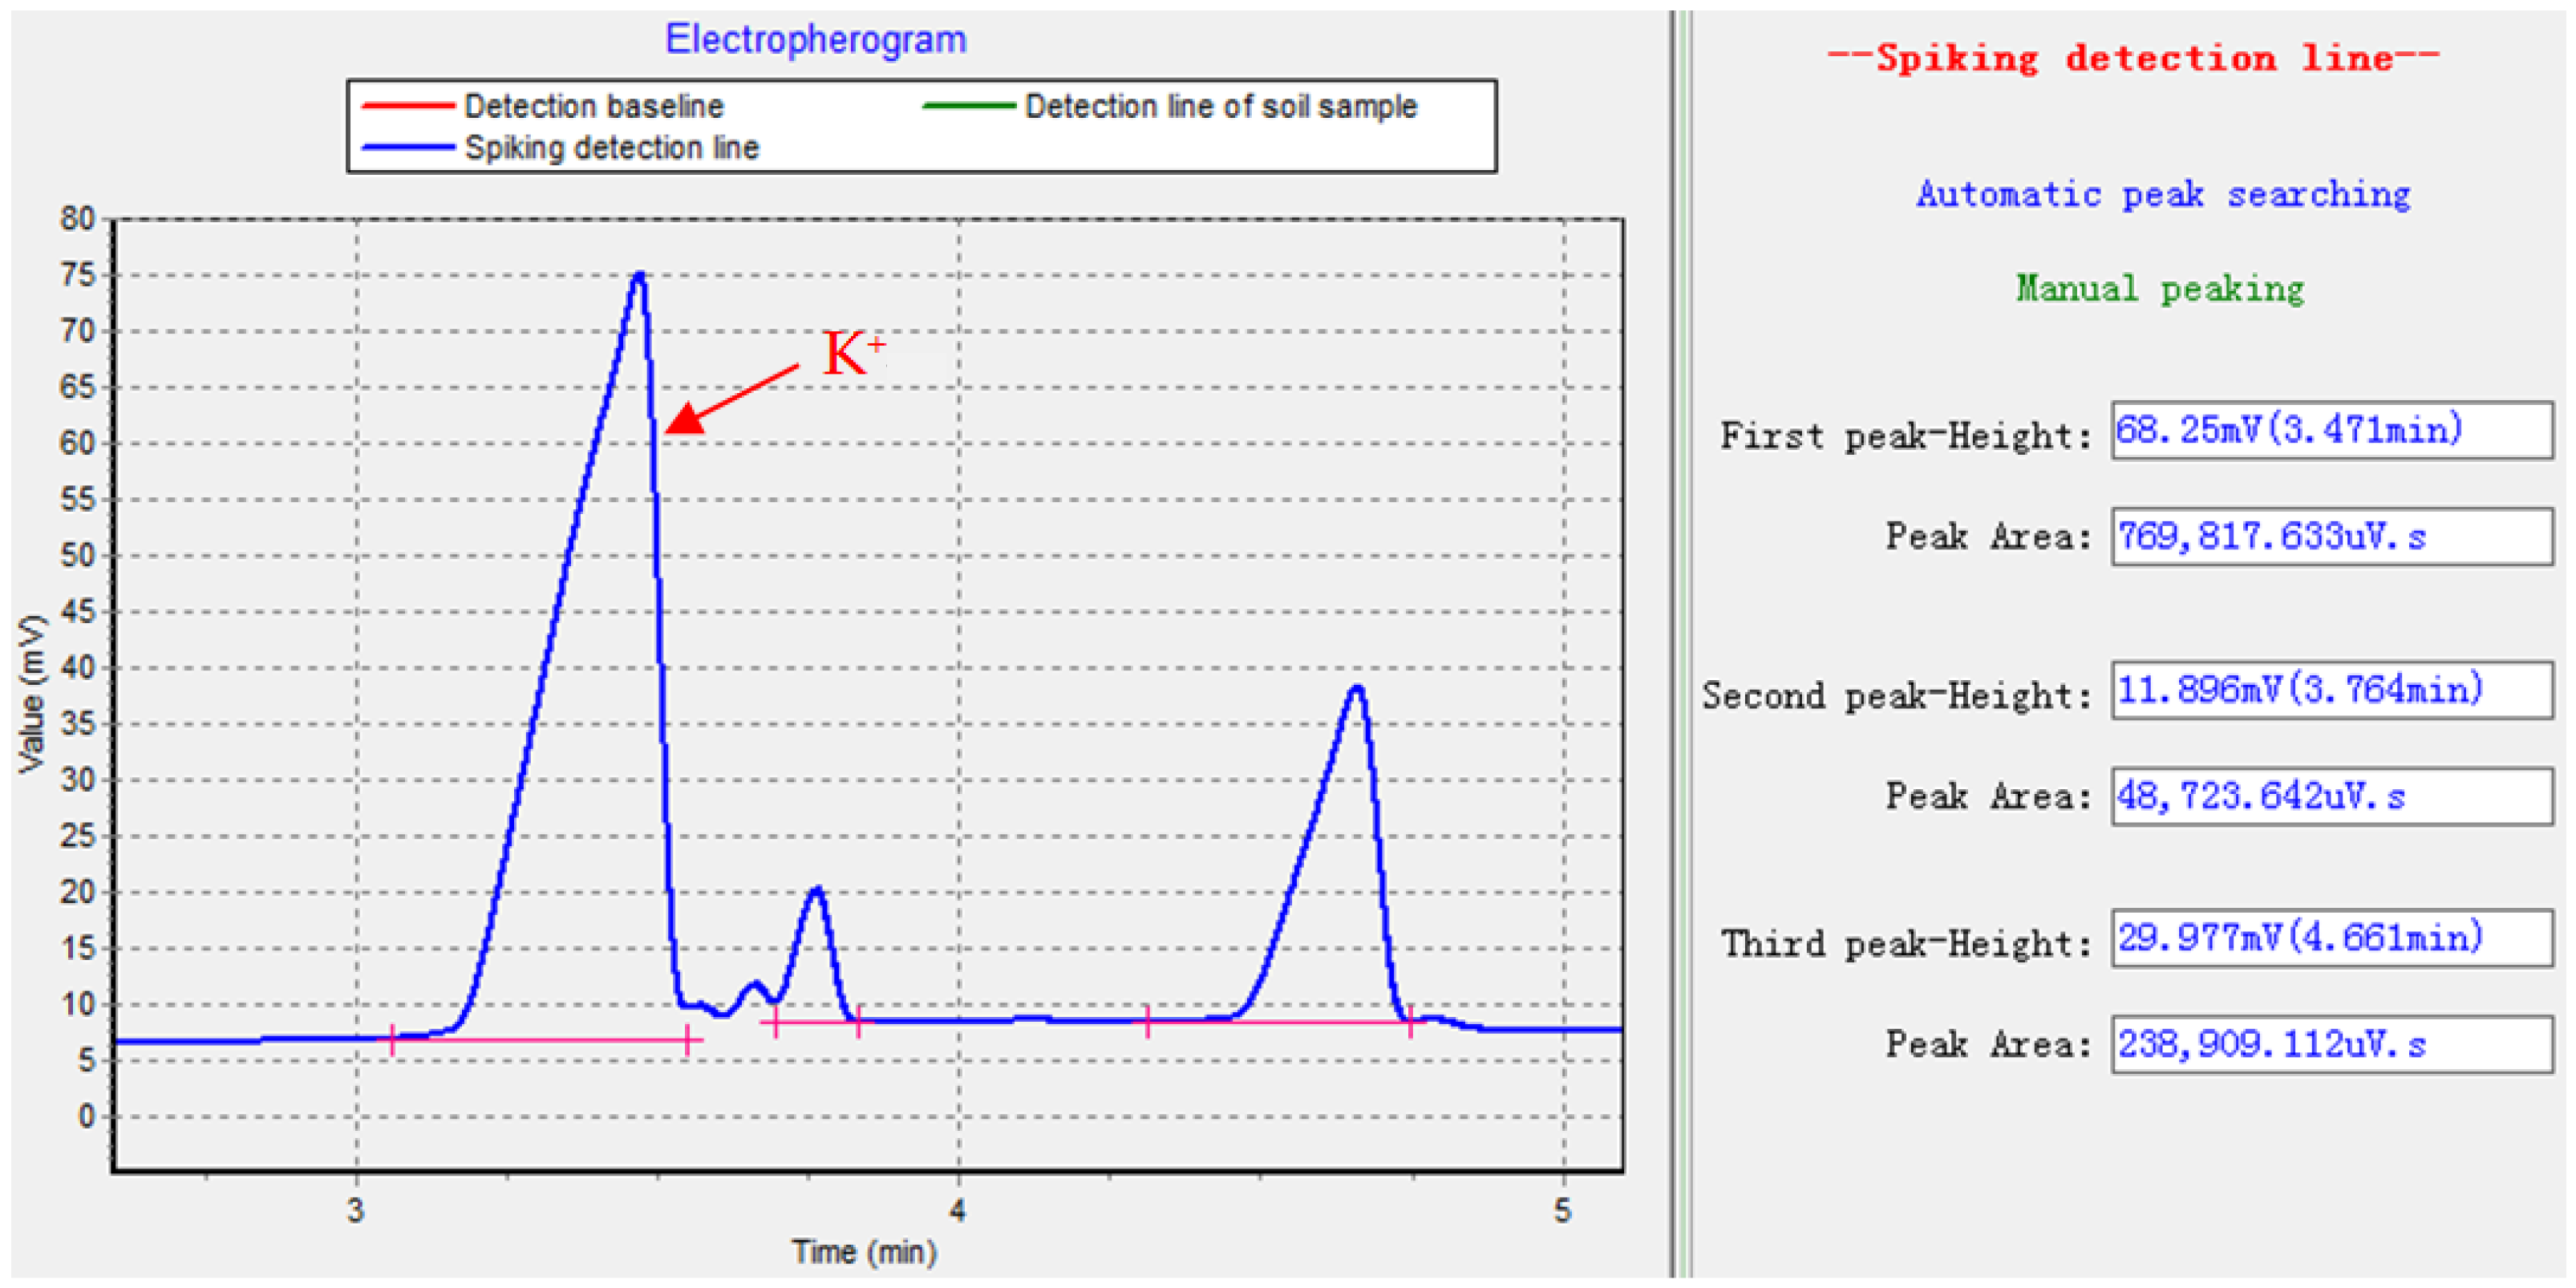
3.2. Detection of Electrophoresis Lines

We opened the interface of the [Electrophoresis Analysis] in the soil nutrient management software and then loaded the Detection baseline, the detection line of the soil sample to be tested (Detection line of soil sample), and the detection line after adding the standard reagent (Spiking detection line) data collected after the operation described in Section 2.3.2. The ion electrical signal time series was displayed in a visual chart as shown in Figure 3; the X-axis is the running time and the Y-axis is the electrical signal value. The baseline spectrum is shown in the red line in Figure 3. If the baseline was flat, it indicated that the equipment was running stably and the capillary had no ions. The sample injection spectrum is shown in the green curve in Figure 3 with three significant positive ion peaks from 3 min to 5 min. The spiking injection spectrum is shown in the blue curve in Figure 3. After adding the standard reagent, the peak height and peak width of the first peak increased significantly. After repeated tests, the first peak was the peak of K+.

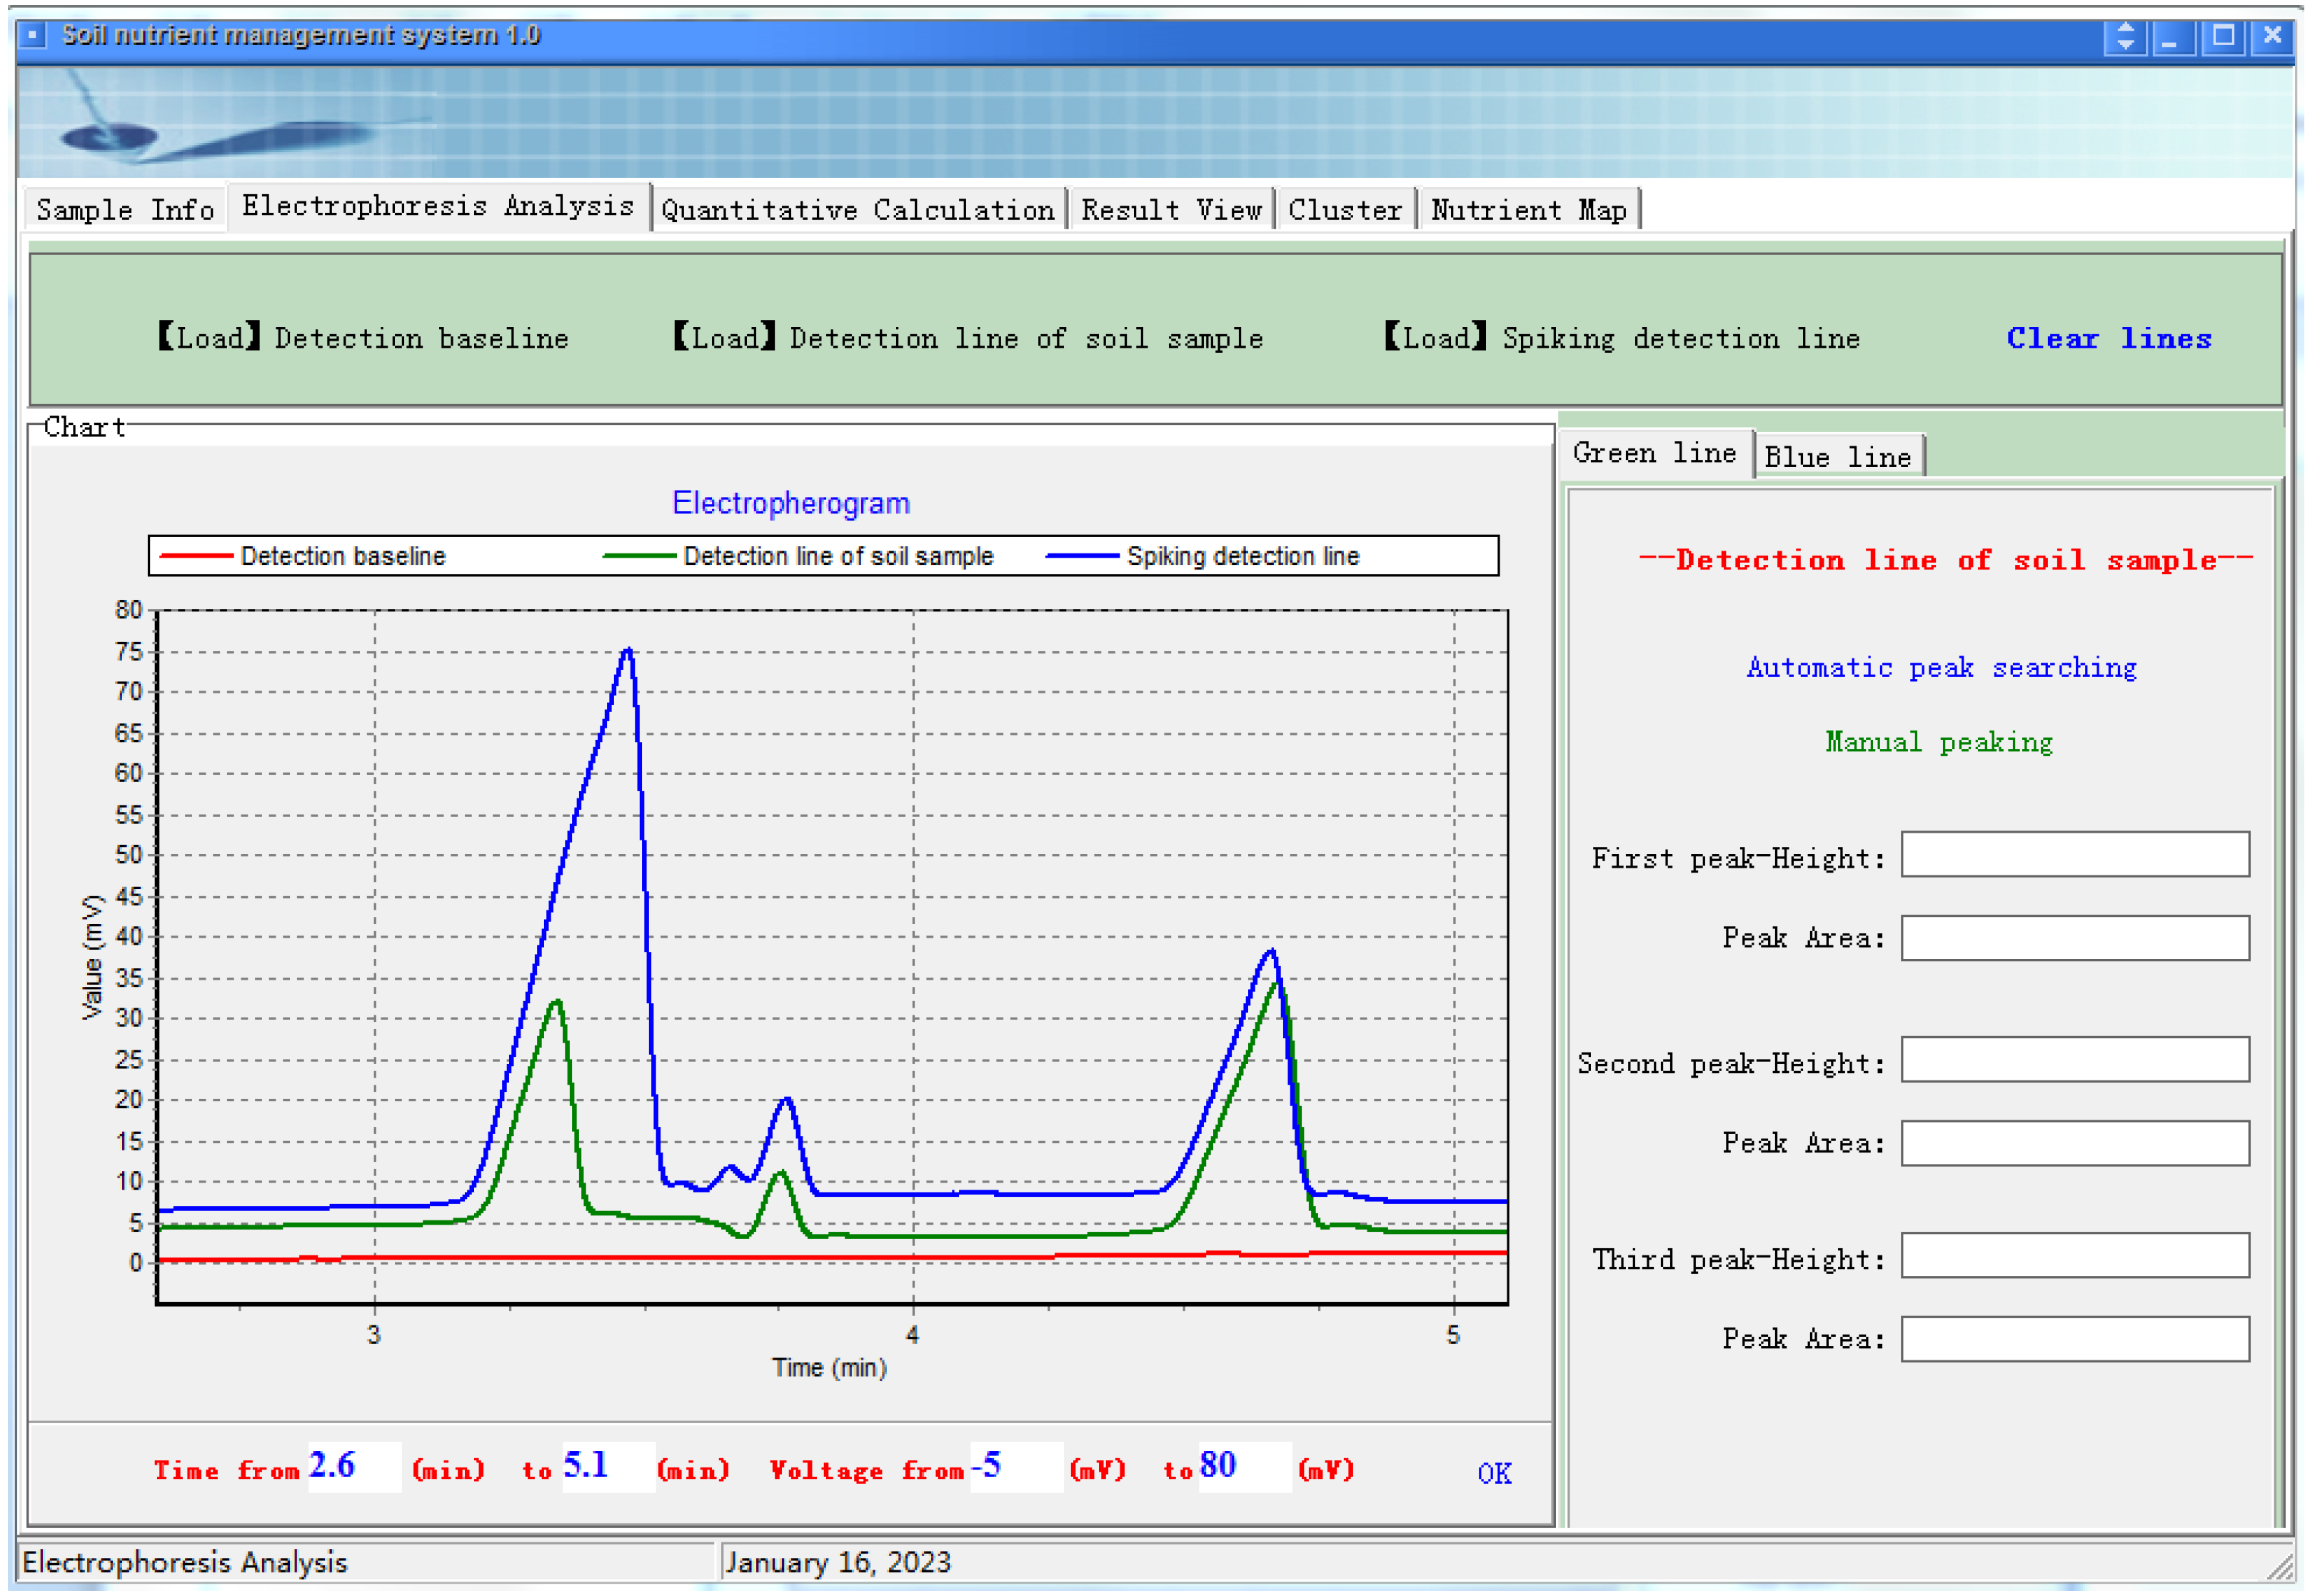
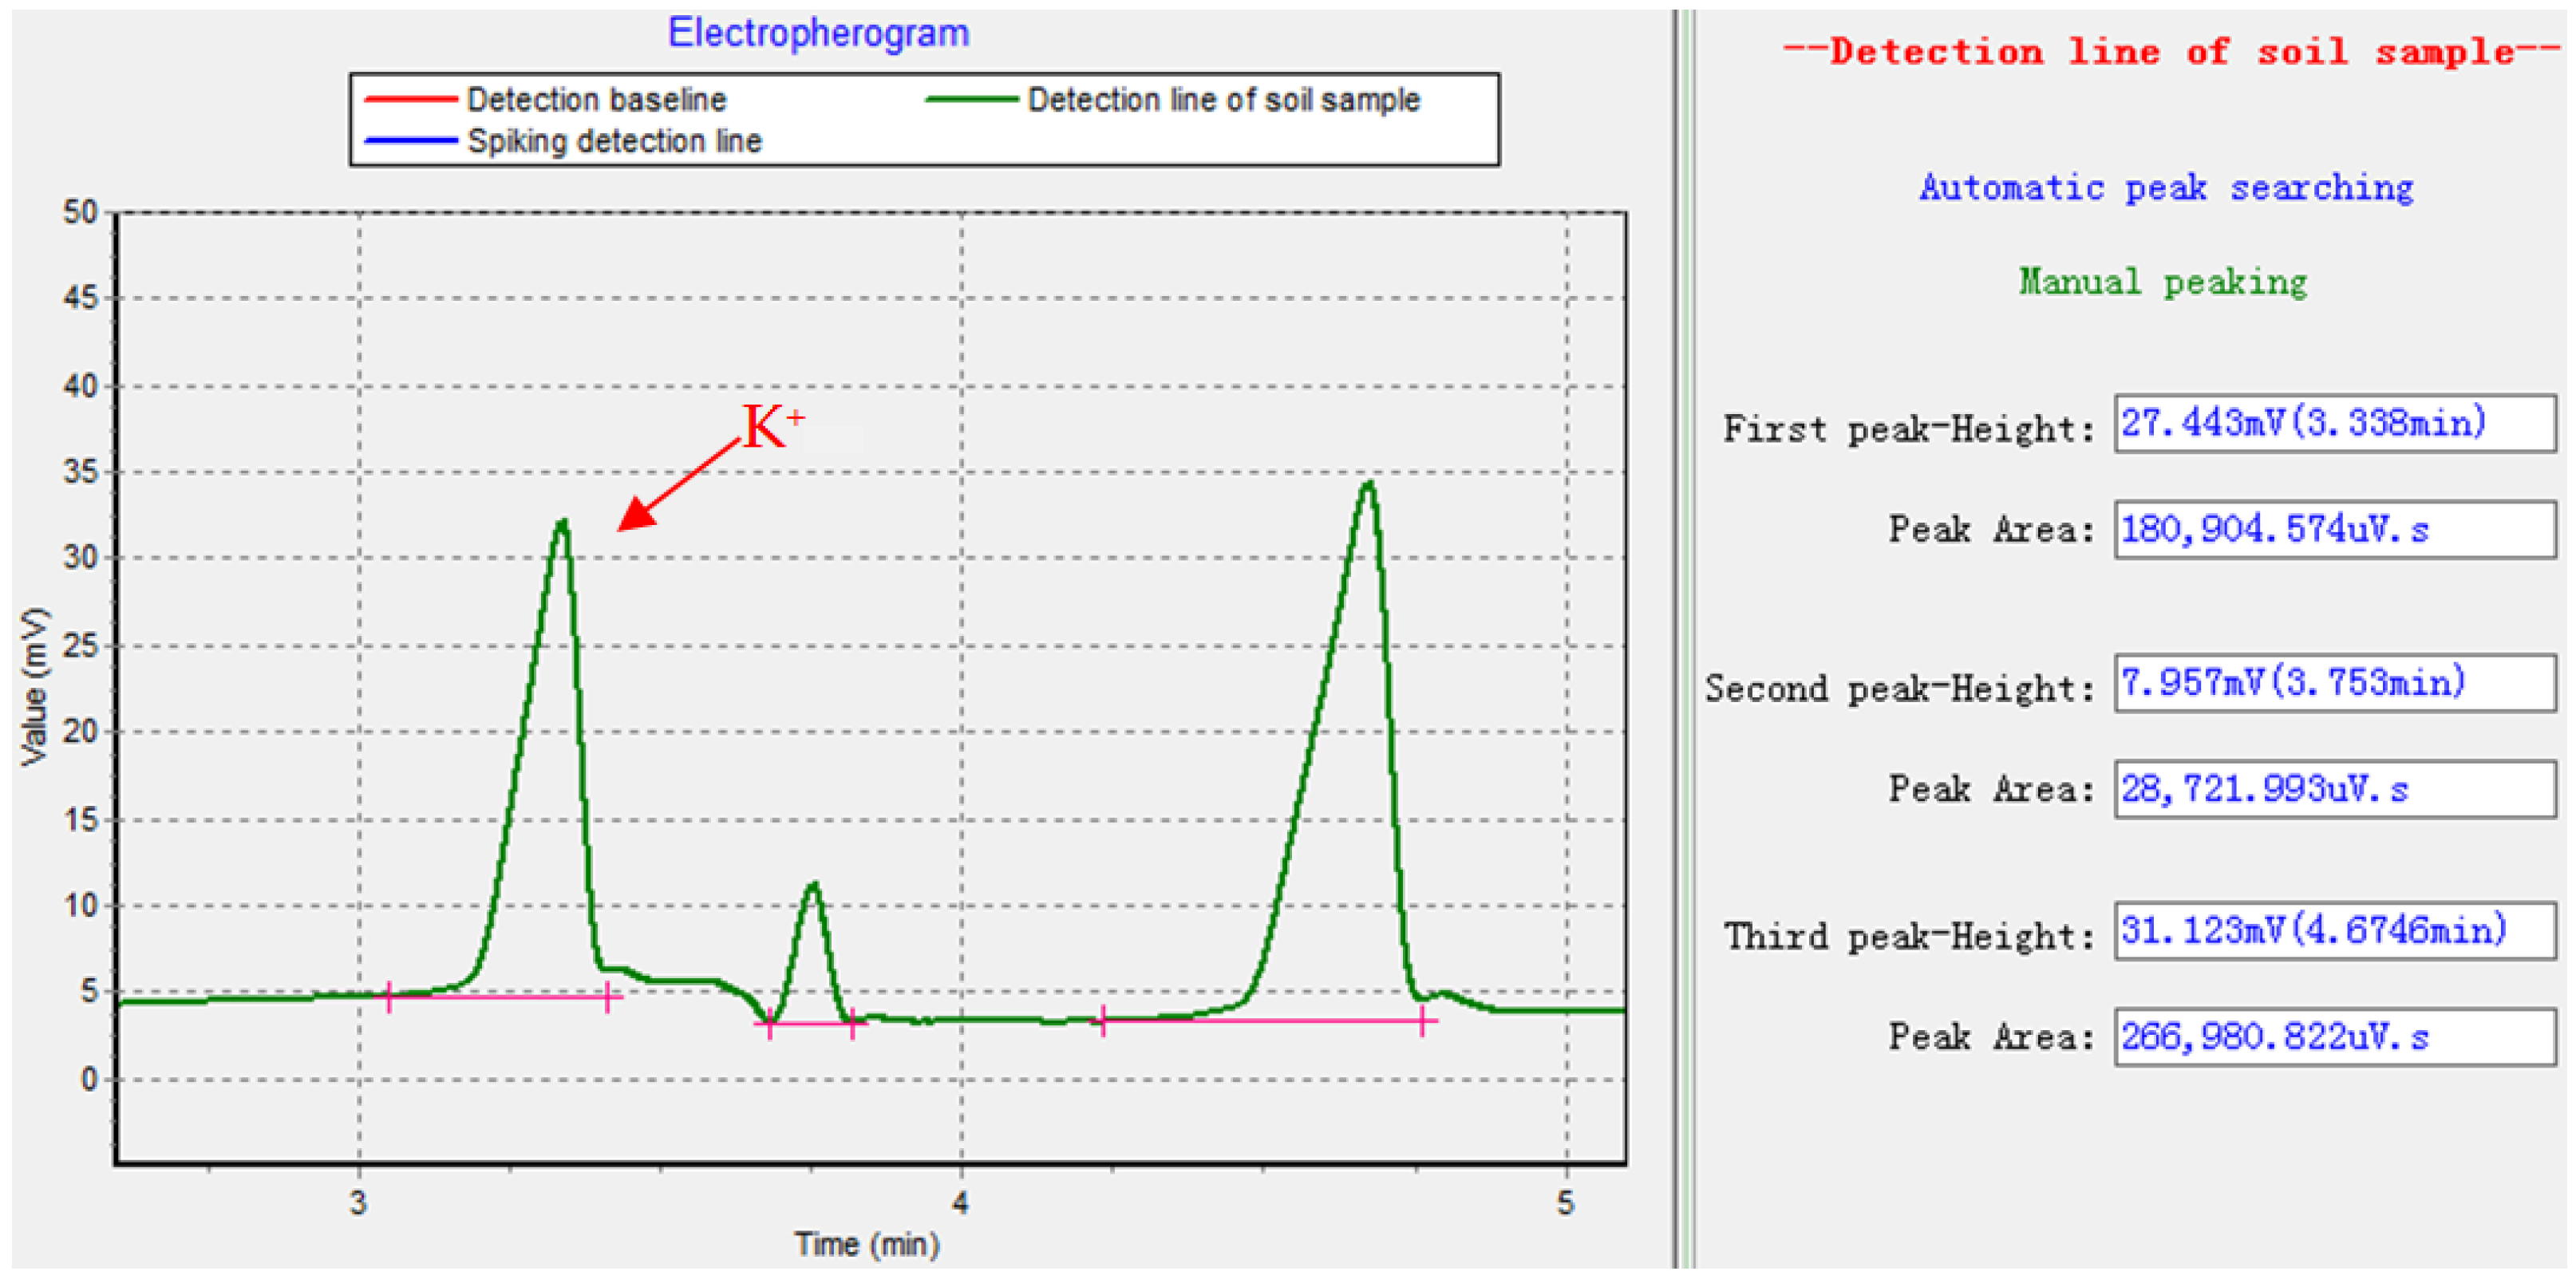
3.3. Electrophoresis Analysis

The calculation of the soil available nutrient concentration required the peak area of ion electrophoresis peaks before and after spiking, so the automatic peak finding and peak area calculation were vital to the quantitative calculation of the nutrient concentration. Currently, there is no recognized peak-finding algorithm for all cases. For the spectrum to be analyzed, the peak time and the number of peaks were relatively stable, so the first-order derivative method was used to find the peaks, and the integration method was used to calculate the peak area. At the same time, the peak-area computing was also realized by taking the peaks manually if the automatic peak finding was not ideal. As shown in Figure 4 and Figure 5, by using automatic peak finding, the peak area of the K+ (the first peak in the detection line of the soil sample) of soil sample B1 was 180,904 uV.s. After the spiking injection of the K+, the K+ peak increased significantly, the peak width became wider, and the peak area increased to 769,817 uV.s.

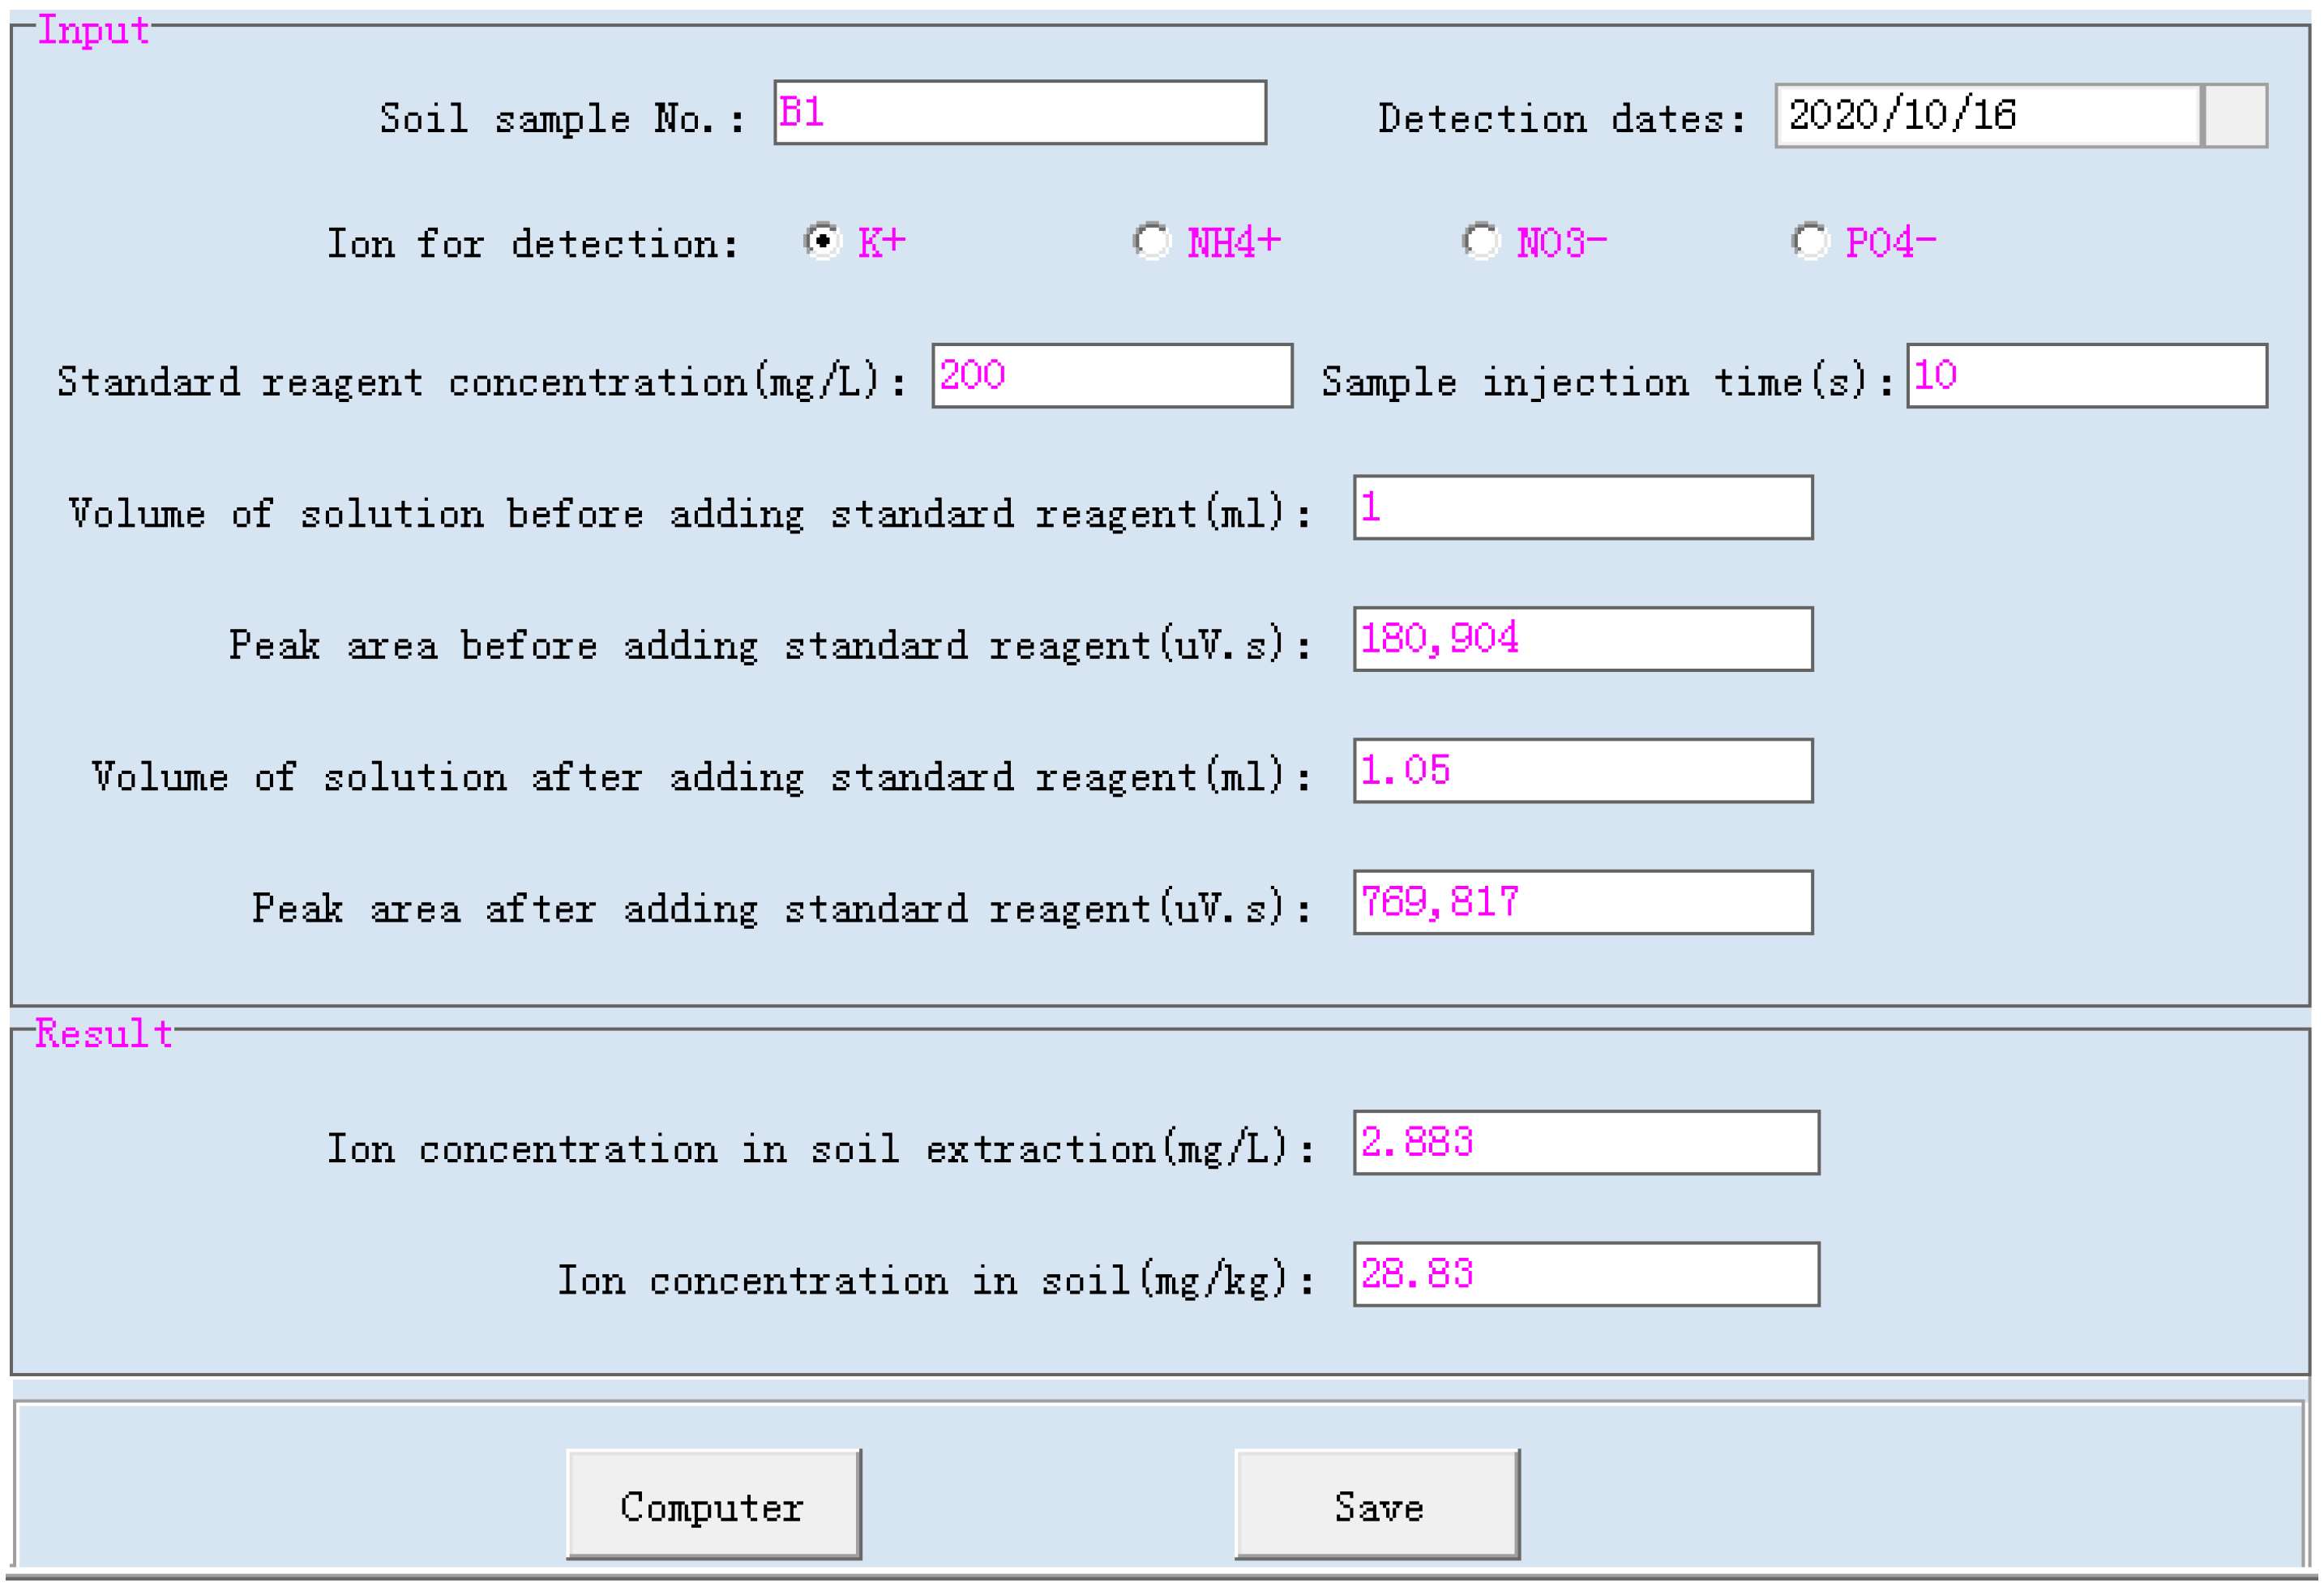
3.4. Quantitative Calculation

The peak area and the volume of the solution before/after adding the standard reagent and the concentration of the standard sample were entered into the interface of [Quantitative Calculation]. The ion concentration in the soil water extract could be automatically calculated. The ion concentration in the soil could be computed according to the soil/liquid ratio of the soil water extract. The experimental parameters and calculation results of soil sample B1 are shown in Figure 6.

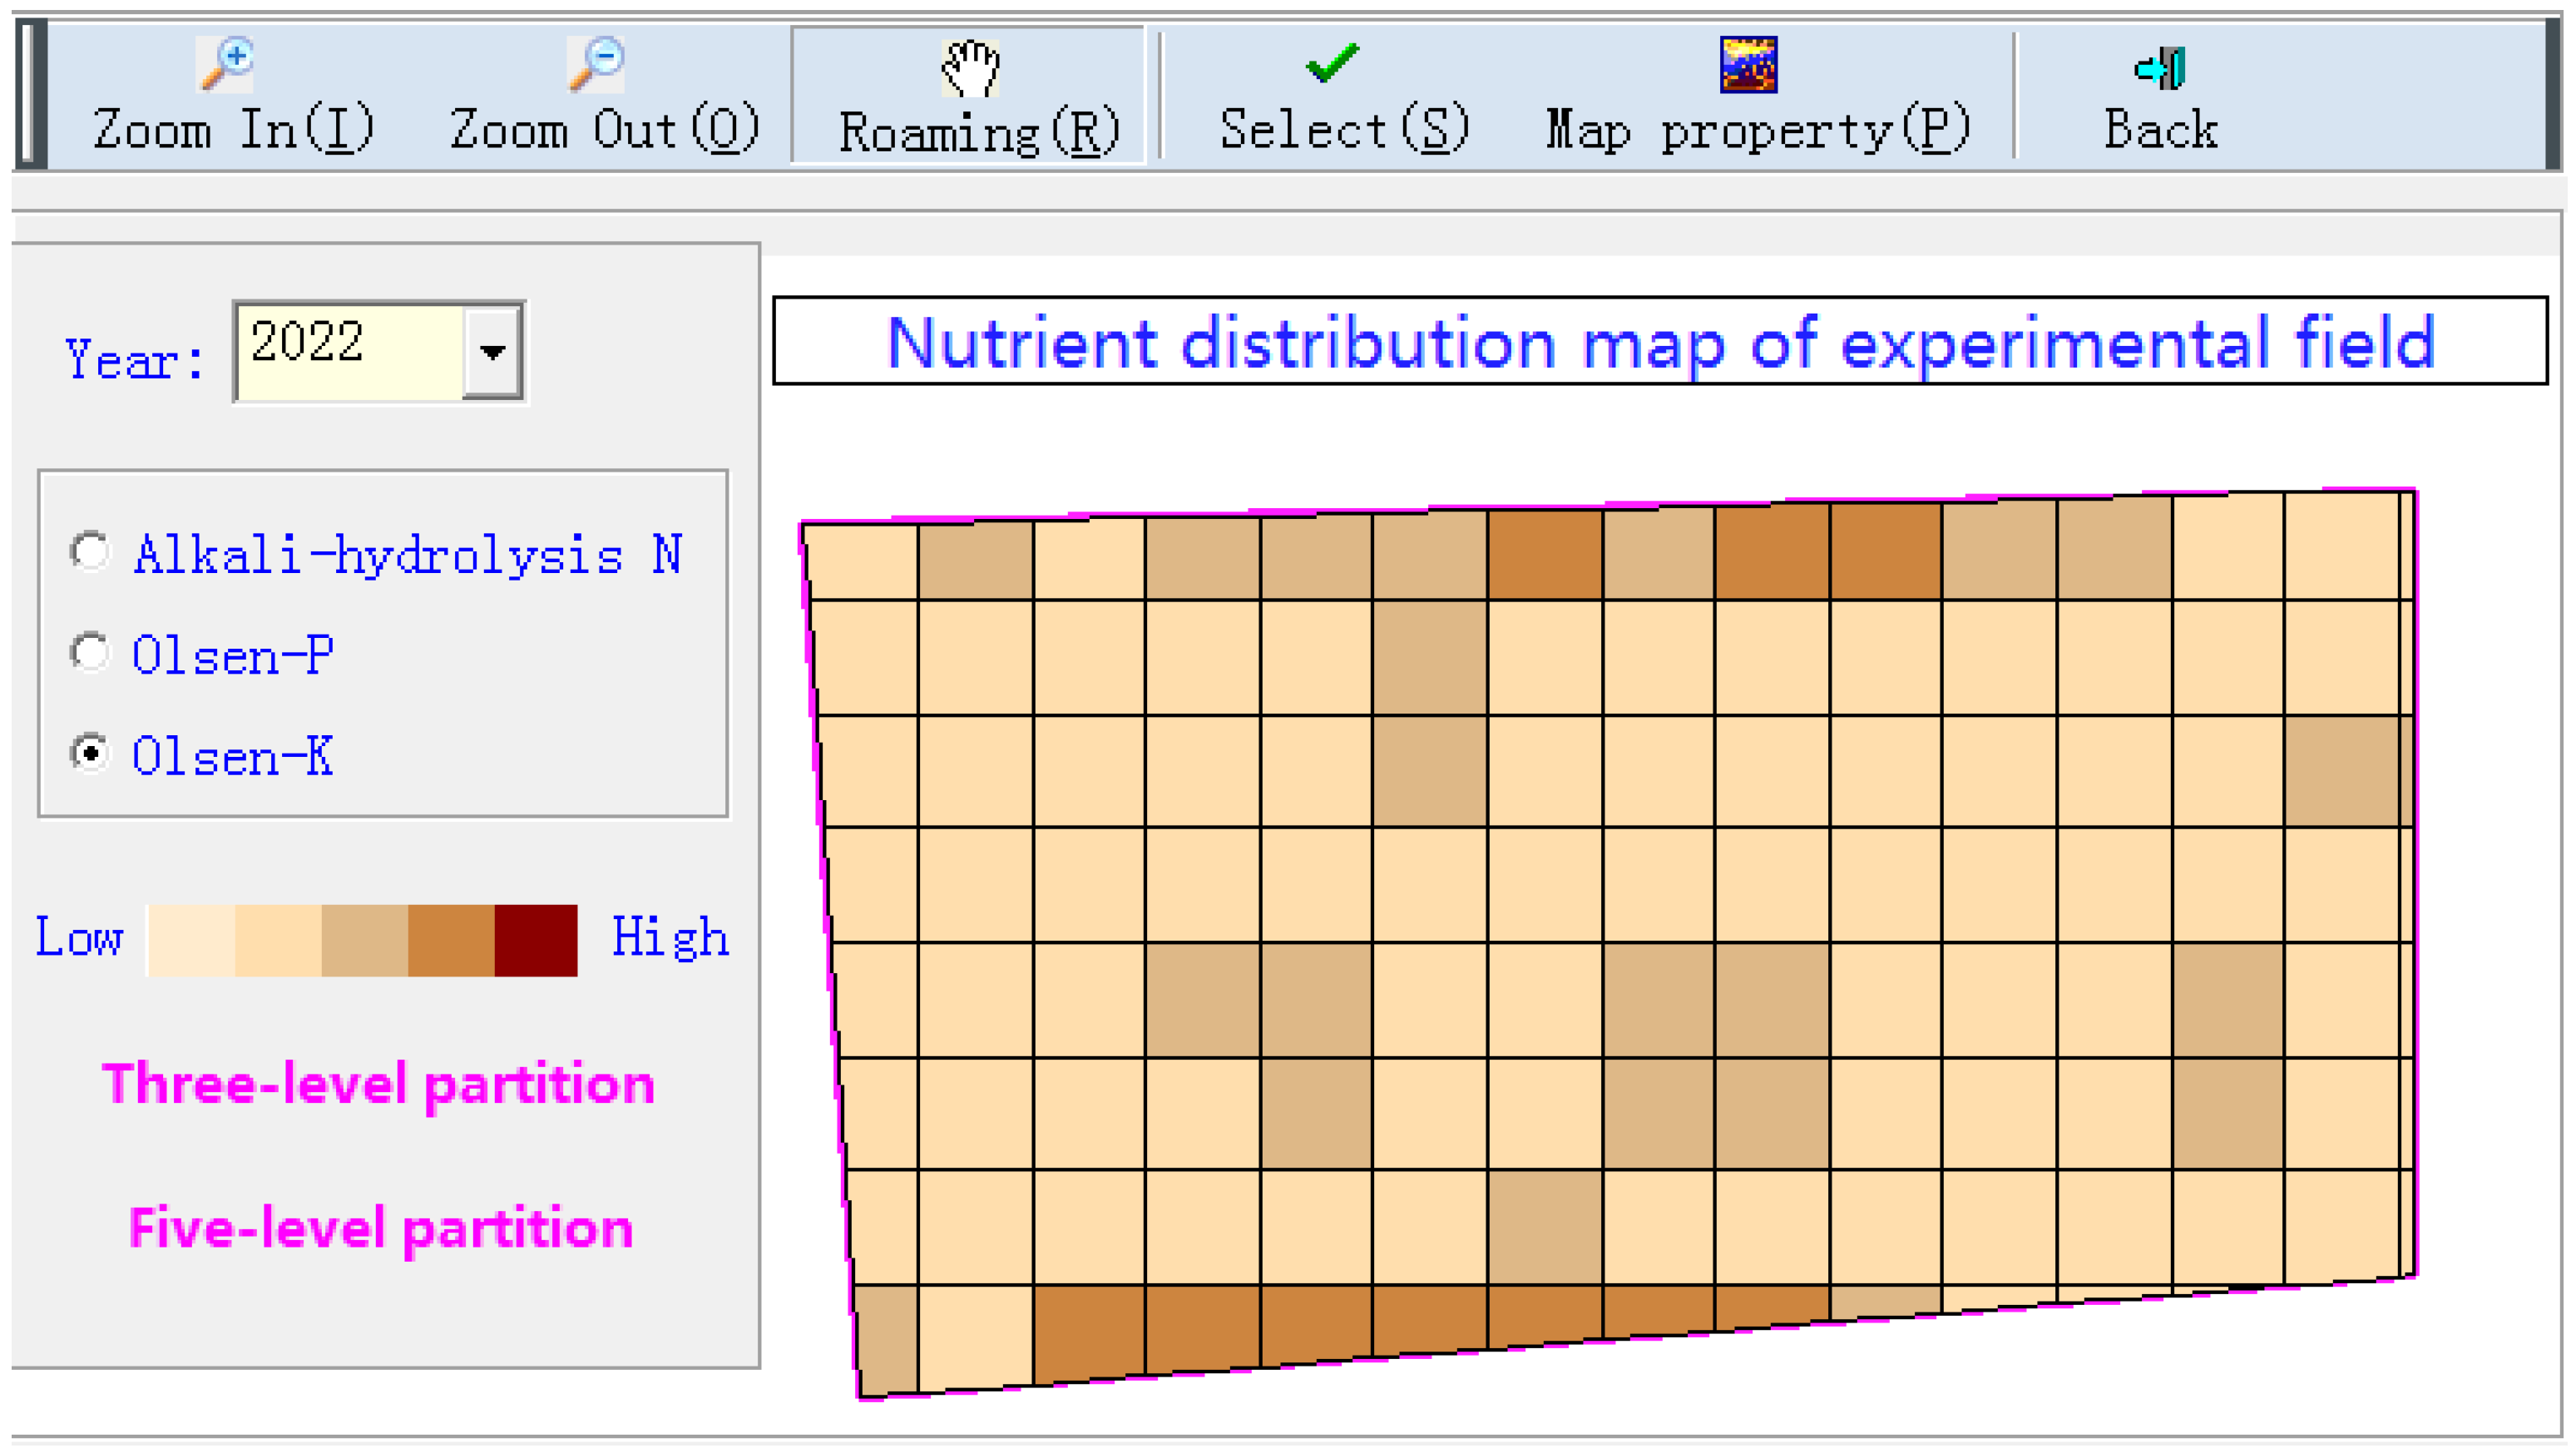
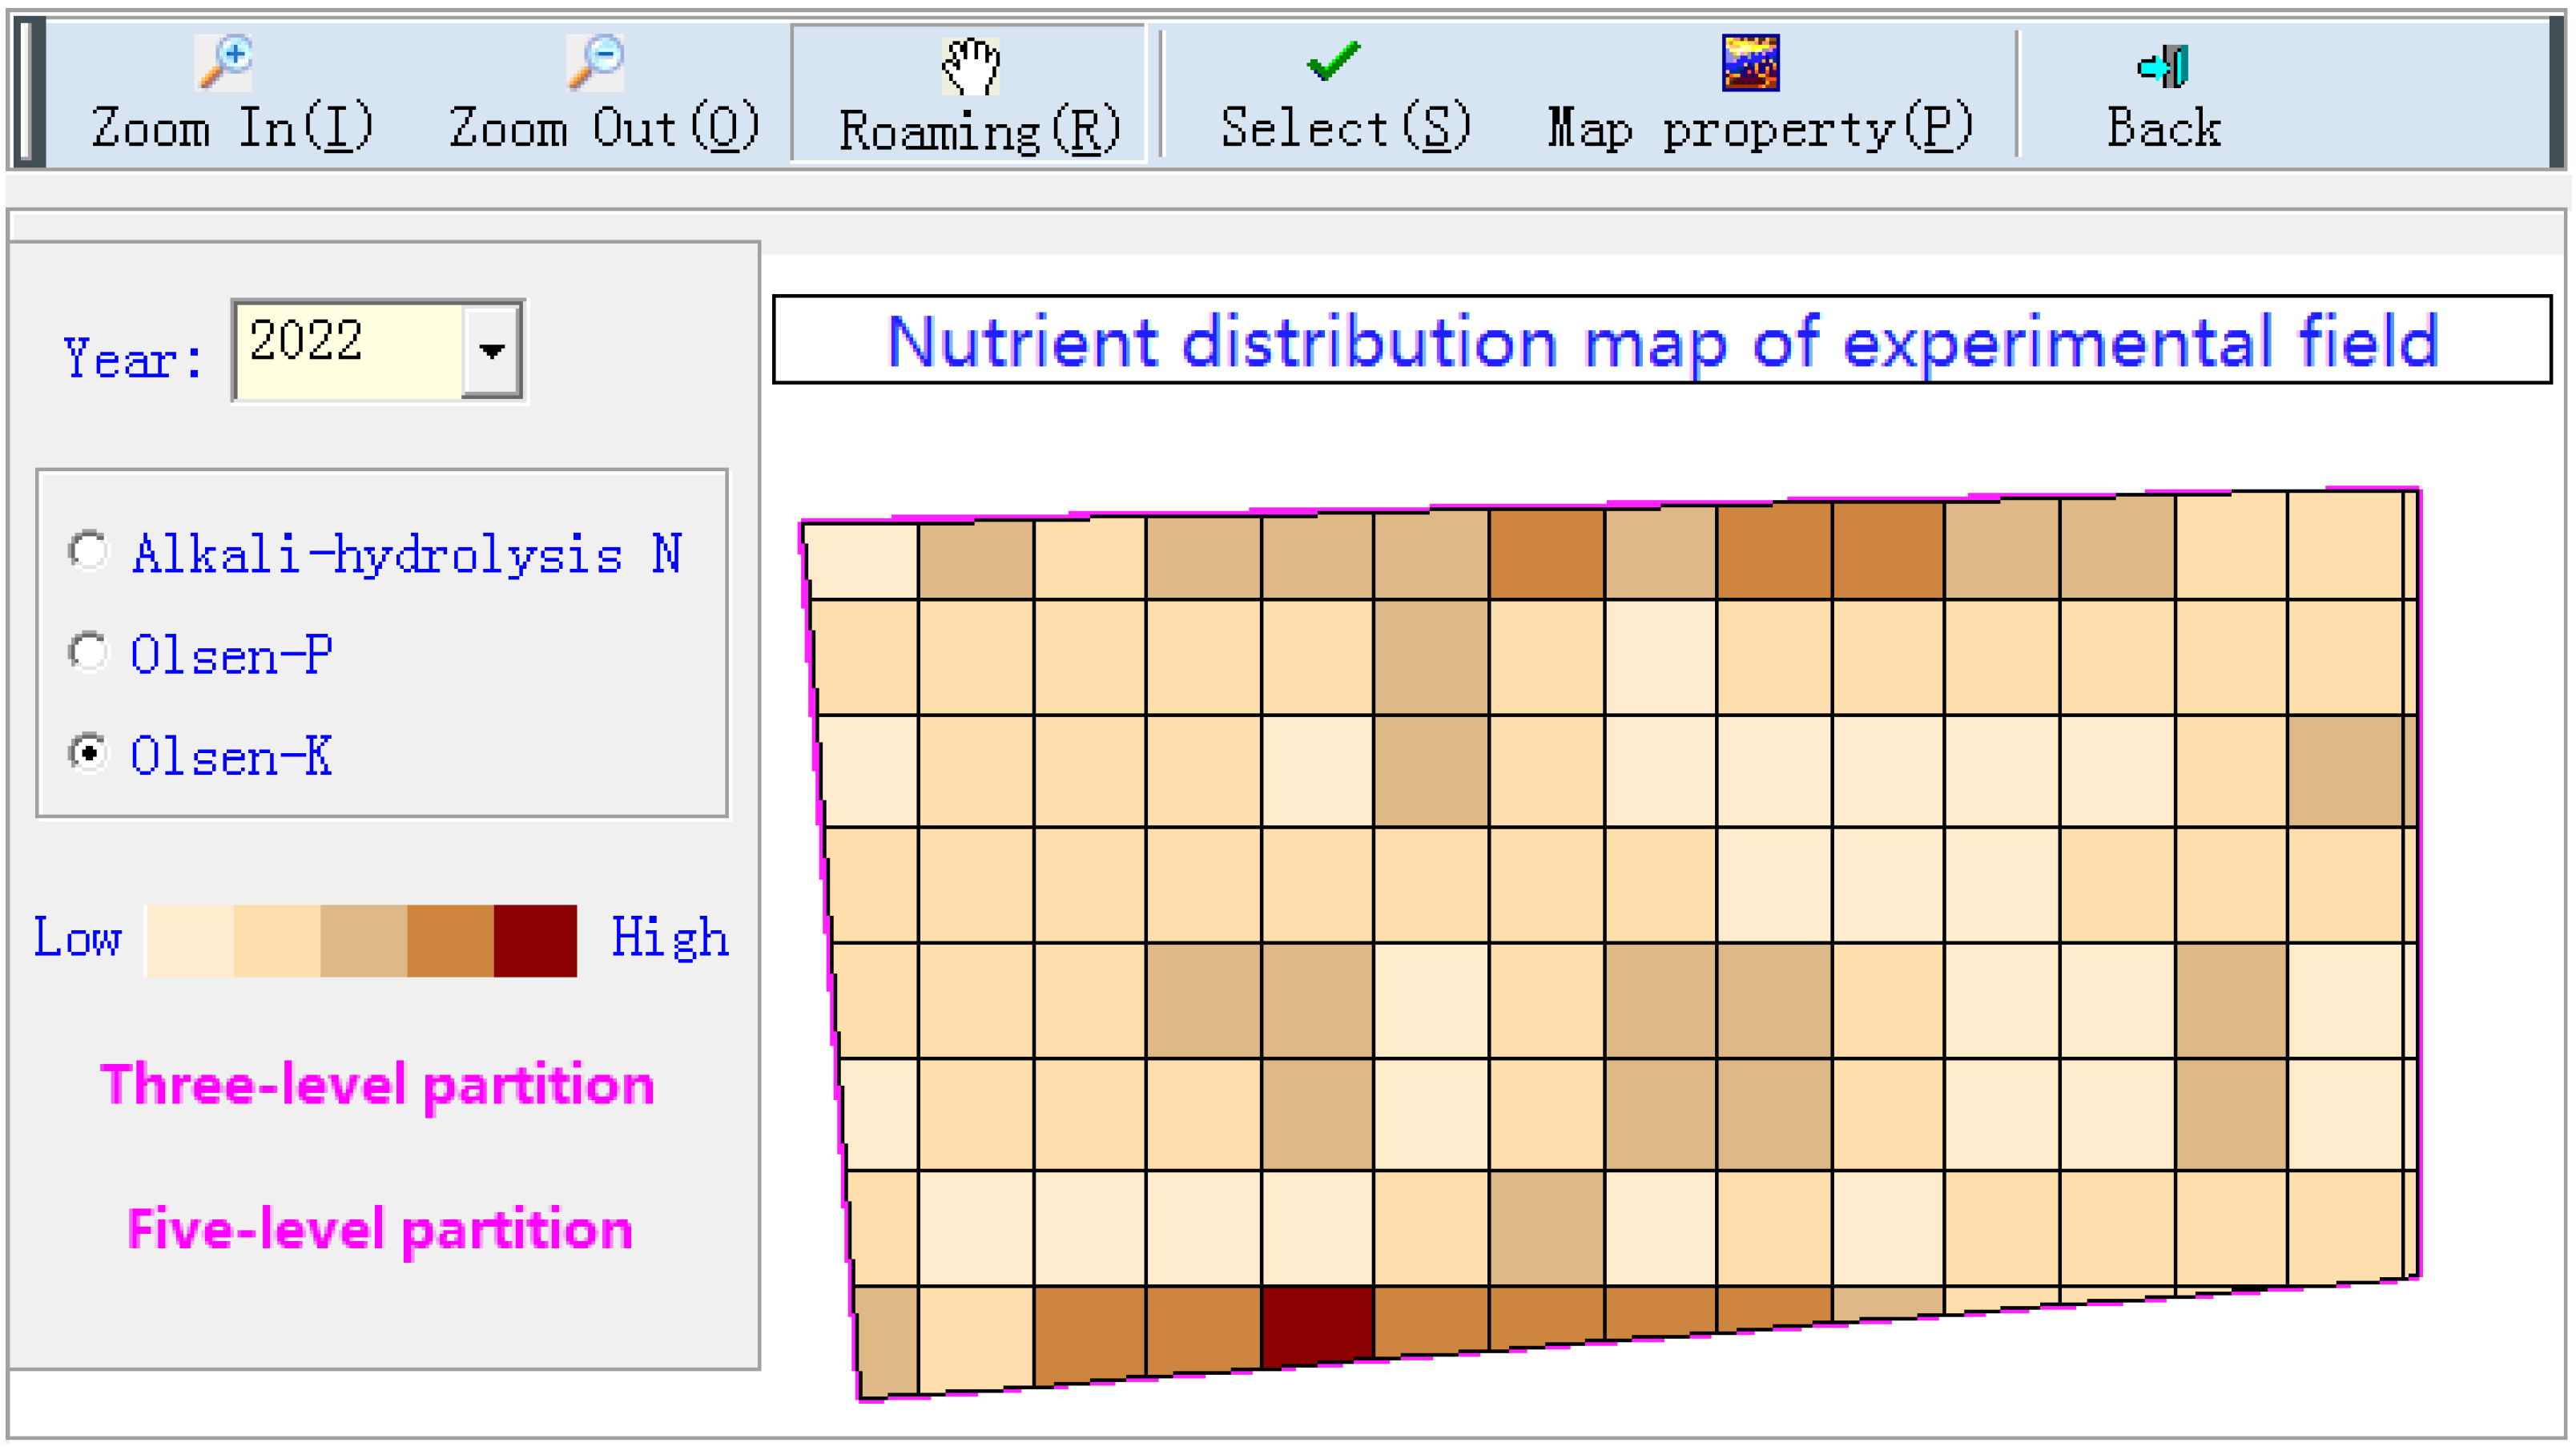
3.5. Cluster Analysis and Nutrient Distribution Map Generation

The results of 80 soil samples were interpolated using the nearest-neighbor method to ensure that each grid of the experimental field had corresponding nutrient data. The hierarchical clustering method was used to divide the grid cells into different levels according to the number of levels expected by the user. Taking three and five classes as examples, a statistical table of the number of grids that corresponded to each nutrient partition is provided in Table 1. In the three-level partition, the grading range of the available potassium was ≤17.8, 17.9–32, and ≥32.1; in the five-level partition, the grading range of the available potassium was ≤11.6, 11.7–17.8, 17.9–32, 32.1–61, and ≥61.1.
The results of the clustering analysis were displayed in the software module [Nutrient Map]. The distribution maps of the soil available potassium (Olsen-K) with the three-level and five-level partitions are shown in Figure 7 and Figure 8, which can provide a basis for decision making in variable fertilization.

4. Discussion

In order to verify the accuracy of the C4D for soil available nutrients, we used the C4D method and the national standard flame photometer method simultaneously to determine the available potassium, and some soil samples were randomly selected. The comparison results are shown in Table 2. It can be seen in the table that when the available potassium was very low, the relative deviation of the result was large, which might have been affected by the flame photometer range, but it did not affect the nutrient partition. The relative deviation of 64.7% of the samples was less than 10%, and the relative deviation of 82.4% of samples was less than 20%, so the test results obtained by the two methods were in good agreement. Thus, the C4D method was feasible and usable for the determination of soil available nutrients.

5. Conclusions

In this study, soil sample testing, data analysis, and nutrient partitioning were carried out based on an independently developed C4D method. The relevant conclusions were as follows.
(1)
The module for electrophoretic analysis and quantitative calculation realized the operation of the data input, display, automatic peak finding, peak area calculation, nutrient concentration calculation, and data storage for the time series of ion electrical signals.
(2)
The comparison experiment to determine the available potassium using the C4D method and the national standard flame photometer method showed that the detection results obtained via the two methods were in good agreement. The C4D of soil available nutrients, which had the advantages of a low cost, low pollution, a low sample volume, a high sensitivity, and a high timeliness, can be used as a practical method for the detection of soil available nutrients.
(3)
On the basis of constructing a 40 m × 40 m grid vector diagram of the experimental field, the nutrient-detection results for the soil samples were superimposed. The cluster analysis method in the data mining was applied to the soil nutrient grade in the system. The system could generate soil nutrient distribution maps according to the user’s desired number of classifications and could visually display the spatial differences in nutrients. This work proved to achieve the purposes of soil nutrient zone management and to provide a basis for decision making in variable fertilization.
In the future, a more accurate detection system will be developed that can be used when the content of available potassium is very low. The management system for soil nutrients proposed in this paper will help to measure and manage the nutrients in soil on a more precise scale and guide fertilization operations more effectively. This will be beneficial to reducing fertilizer application.

Author Contributions

Conceptualization, Y.W., R.W. and X.C.; methodology, Y.W., J.Z. and X.C.; software, Y.W.; validation, J.Z.; formal analysis, H.G.; investigation, R.W. and H.G.; resources, H.G.; data curation, Y.W.; writing—original draft preparation, Y.W.; writing—review and editing, X.C.; visualization, Y.W.; supervision, J.Z.; project administration, R.W.; funding acquisition, X.C. All authors have read and agreed to the published version of the manuscript.

Funding

This research was funded by the National Key Research and Development Program of China (Nos. 2017YFD0700501 and 2021YFD2000204), the University Natural Science Research Project of Anhui Province (No. 2022AH050083), the Science and Technology Mission Program of Anhui Province (No. S2022t06010123) and the Science and Technology Major Project of Anhui Province (No. 202003a06020016).

Institutional Review Board Statement

Not applicable.

Data Availability Statement

All data from the current study are available from the corresponding author upon reasonable request.

Conflicts of Interest

The authors declare no conflict of interest.

References

  1. Vitousek, P.M.; Naylor, R.; Crews, T.; David, M.B.; Drinkwater, L.E.; Holland, E.; Johnes, P.J.; Katzenberger, J.; Martinelli, L.A.; Matson, P.A.; et al. Nutrient Imbalances in Agricultural Development. Science 2009, 324, 1519–1520. [Google Scholar] [CrossRef] [PubMed]
  2. Wang, Z.; Huang, L.; Yin, L.; Wang, Z.; Zheng, D. Evaluation of Sustainable and Analysis of Influencing Factors for Agriculture Sector: Evidence From Jiangsu Province, China. Front. Environ. Sci. 2022, 10, 836002. [Google Scholar] [CrossRef]
  3. Laurett, R.; Paço, A.; Mainardes, E.W. Mainardes, Sustainable Development in Agriculture and its Antecedents, Barriers and Consequences—An Exploratory Study. Sustain. Prod. Consum. 2021, 27, 298–311. [Google Scholar] [CrossRef]
  4. Zhao, L.; Fan, M.; Zhang, B.; He, Y.; Jin, J.; Liu, G. A preliminary determination of the plot-scale fertilization tolerance of an Entisol in southwest China. J. Soil Water Conserv. 2021, 76, 369–386. [Google Scholar] [CrossRef]
  5. Li, S.; Lei, Y.; Zhang, Y.; Liu, J.; Shi, X.; Jia, H.; Wang, C.; Chen, F.; Chu, Q. Rational trade-offs between yield increase and fertilizer inputs are essential for sustainable intensification: A case study in wheat-maize cropping systems in China. Sci. Total Environ. 2019, 679, 328–336. [Google Scholar] [CrossRef]
  6. Liu, X.; Guo, C.; He, S.; Zhu, H.; Li, J.; Yu, Z.; Qi, Y.; He, J.; Zhang, J.; Müller, C. Divergent gross nitrogen transformation paths in the topsoil and subsoil between abandoned and agricultural cultivation land in irrigated areas. Sci. Total Environ. 2020, 716, 137148. [Google Scholar] [CrossRef]
  7. Fu, Q.; Wang, Z.; Jiang, Q. Delineating soil nutrient management zones based on fuzzy clustering optimized by PSO. Math. Comput. Model. 2010, 51, 1299–1305. [Google Scholar] [CrossRef]
  8. Kumar, H.; Srivastava, P.; Lamba, J.; Ortiz, B.V.; Way, T.R.; Sangha, L.; Takhellambam, B.S.; Morata, G.; Molinari, R. Within-field variability in nutrients for site-specific agricutural management in irrigated cornfield. J. ASABE 2022, 65, 865–880. [Google Scholar] [CrossRef]
  9. Peralta, N.R.; Costa, J.L. Delineation of management zones with soil apparent electrical conductivity to improve nutrient management. Comput. Electron. Agric. 2013, 99, 218–226. [Google Scholar] [CrossRef] [Green Version]
  10. Rietra, R.; Heinen, M.; Oenema, O. A Review of Crop Husbandry and Soil Management Practices Using Meta-Analysis Studies: Towards Soil-Improving Cropping Systems. Land 2022, 11, 255. [Google Scholar] [CrossRef]
  11. Arunrat, N.; Kongsurakan, P.; Sereenonchai, S.; Hatano, R. Soil Organic Carbon in Sandy Paddy Fields of Northeast Thailand: A Review. Agronomy 2020, 10, 1061. [Google Scholar] [CrossRef]
  12. Arunrat, N.; Sereenonchai, S.; Chaowiwat, W.; Wang, C.; Hatano, R. Carbon, Nitrogen and Water Footprints of Organic Rice and Conventional Rice Production over 4 Years of Cultivation: A Case Study in the Lower North of Thailand. Agronomy 2022, 12, 380. [Google Scholar] [CrossRef]
  13. Masrie, M.; Rosli, A.Z.M.; Sam, R.; Janin, Z.; Nordin, M.K. Integrated optical sensor for NPK Nutrient of Soil detection. In Proceedings of the 2018 IEEE 5th International Conference on Smart Instrumentation, Measurement and Application (ICSIMA 2018), Songkhla, Thailand, 28–30 November 2018; IEEE: New York, NY, USA, 2018. [Google Scholar]
  14. He, Y.; Liu, X.; Lv, Y.; Liu, F.; Peng, J.; Shen, T.; Zhao, Y.; Tang, Y.; Luo, S. Quantitative Analysis of Nutrient Elements in Soil Using Single and Double-Pulse Laser-Induced Breakdown Spectroscopy. Sensors 2018, 18, 1526. [Google Scholar] [CrossRef] [PubMed] [Green Version]
  15. Karabegov, M.A. Flame photometers. Basic parameters and metrological support. Meas. Tech. 2011, 54, 735–742. [Google Scholar] [CrossRef]
  16. Brondi, A.M.; Daniel, J.S.P.; de Castro, V.X.M.; Bertoli, A.C.; Garcia, J.S.; Trevisan, M.G. Quantification of Humic and Fulvic Acids, Macro- and MicroNutrients and C/N Ratio in Organic Fertilizers. Commun. Soil Sci. Plant Anal. 2016, 47, 2506–2513. [Google Scholar] [CrossRef]
  17. Guo, C.H.; Li, H.; Fang, F.; Ji, Y.; Xing, Y.; Fan, Y.; Liu, Y. Study on Distribution of Phosphorus Fractions and Adsorption-Desorption Characteristics in Surface Sediments of the Yellow River by Molybdenum Antimony Spectrophotometry. Spectrosc. Spectr. Anal. 2018, 38, 218–223. [Google Scholar] [CrossRef]
  18. Gianello, C.; Bremner, J. Comparison of chemical methods of assessing potentially available organic nitrogen in soil. Commun. Soil Sci. Plant Anal. 1986, 17, 215–236. [Google Scholar] [CrossRef]
  19. Cordovil, C.; Coutinho, J.; Goss, M.; Cabral, F. Comparison of chemical methods of assessing potentially available organic nitrogen from organic residues applied to a sandy soil. Commun. Soil Sci. Plant Anal. 2007, 38, 989–1006. [Google Scholar] [CrossRef] [Green Version]
  20. Akhtar, M.; Jabbar, A.; Mehmood, S.; Ahmed, N.; Ahmed, R.; Baig, M. Magnetic field enhanced detection of heavy metals in soil using laser induced breakdown spectroscopy. Spectrochim. Acta Part B At. Spectrosc. 2018, 148, 143–151. [Google Scholar] [CrossRef]
  21. Omenetto, N.; de Loos-Vollebregt, G. Part B: Atomic spectroscopy-Including spectrochimica acta reviews. Spectrochim. Acta Part B At. Spectrosc. 2007, 62, 3. [Google Scholar] [CrossRef]
  22. Shi, T.; Chen, Y.; Liu, Y.; Wu, G. Visible and near-infrared reflectance spectroscopy-An alternative for monitoring soil contamination by heavy metals. J. Hazard. Mater. 2014, 265, 166–176. [Google Scholar] [CrossRef] [PubMed]
  23. Qiao, Y.D.; Zhang, S. Near-infrared spectroscopy technology for soil nutrients detection based on LS-SVM. In Computer and Computing Technologies in Agriculture V, PT I; Springer: Berlin/Heidelberg, Germany, 2012; Volume 368, pp. 325–335. [Google Scholar]
  24. Gao, H.; Li, H.; Lin, C.; Alvarez, P.J.; Masiello, C.A.; Zhu, D.; Kong, A.; Qu, X. Molecular signature of soil organic matter under different land uses in the Lake Chaohu Basin. Eco-Environ. Health 2022, 1, 212–218. [Google Scholar] [CrossRef]
  25. Wen, M.; Ma, Z.; Gingerich, D.B.; Zhao, X.; Zhao, D. Heavy metals in agricultural soil in China: A systematic review and meta-analysis. Eco-Environ. Health 2022, 1, 219–228. [Google Scholar] [CrossRef]
  26. Li, X.Y.; Fan, P.; Hou, G.; Lu, M.; Wang, Q.; Liu, Y. Rapid Detection of Soil Nutrients Based on Visible and Near Infrared Spectroscopy. Spectrosc. Spectr. Anal. 2017, 37, 3562–3566. [Google Scholar] [CrossRef]
  27. Sinfield, J.V.; Fagerman, D.; Colic, O. Evaluation of sensing technologies for on-the-go detection of macro-nutrients in cultivated soils. Comput. Electron. Agric. 2010, 70, 1–18. [Google Scholar] [CrossRef]
  28. Han, P.-C.; Yang, K.; Jiao, L.-Z.; Li, H.-C. Rapid quantitative analysis of potassium in soil based on direct-focused laser ablation-laser induced breakdown spectroscopy. Front. Chem. 2022, 10, 967158. [Google Scholar] [CrossRef]
  29. Xu, D.; Chen, S.; Viscarra Rossel, R.A.; Biswas, A.; Li, S.; Zhou, Y.; Shi, Z. X-ray fluorescence and visible near infrared sensor fusion for predicting soil chromium content. Geoderma 2019, 352, 61–69. [Google Scholar] [CrossRef]
  30. Liu, S.; Shen, H.; Chen, S.; Zhao, X.; Biswas, A.; Jia, X.; Shi, Z.; Fang, J. Estimating forest soil organic carbon content using vis-NIR spectroscopy: Implications for large-scale soil carbon spectroscopic assessment. Geoderma 2019, 348, 37–44. [Google Scholar] [CrossRef]
  31. Ali, A.; Dong, L.; Dhau, J.; Khosla, A.; Kaushik, A. Perspective-Electrochemical Sensors for Soil Quality Assessment. J. Electrochem. Soc. 2020, 167. [Google Scholar] [CrossRef]
  32. Elbashir, A.A.; Elgorashe, R.E.E.; Alnajjar, A.O.; Aboul-Enein, H.Y. Application of Capillary Electrophoresis with Capacitively Coupled Contactless Conductivity Detection (CE-(CD)-D-4): 2017–2020. Crit. Rev. Anal. Chem. 2022, 52, 535–543. [Google Scholar] [CrossRef]
  33. Elbashir, A.A.; Aboul-Enein, H.Y. Recent advances in applications of capillary electrophoresis with capacitively coupled contactless conductivity detection (CE-C4D): An update. Biomed. Chromatogr. 2012, 26, 990–1000. [Google Scholar] [CrossRef] [PubMed]
  34. Zhang, J.; Wang, R.; Jin, Z.; Guo, H.; Liu, Y.; Chang, Y.; Chen, J.; Li, M.; Chen, X. Development of On-Site Rapid Detection Device for Soil Macronutrients Based on Capillary Electrophoresis and Capacitively Coupled Contactless Conductivity Detection (C4D) Method. Chemosensors 2022, 10, 84. [Google Scholar] [CrossRef]
  35. Wei, Y.-C.; Lin, C.-H.; Wang, Y.-N.; Fu, L.-M. Capillary electrophoresis electrochemical (CE-EC) detection on a novel thread-based microfluidic device with 3D sensing electrodes. In Proceedings of the 6th IEEE International Conference on Nano/Molecular Medicine and Engineering (IEEE-NANOMED 2012), Bangkok, Thailand, 4–7 November 2012; IEEE: New York, NY, USA, 2012; pp. 101–105. [Google Scholar]
  36. Yesiloz, G.; Boybay, M.S.; Ren, C.L. Label-free high-throughput detection and content sensing of individual droplets in microfluidic systems. Lab A Chip 2015, 15, 4008–4019. [Google Scholar] [CrossRef]
  37. Wyżkiewicz, I.; Górniak, N.; Jakubowska, M.; Brzózka, Z.; Dybko, A. Hybrid microstructures for capillary electrophoresis with micro-channel in photosensitive layer. In Proceedings of the SPIE Photonics Applications in Astronomy, Communications, Industry, and High-Energy Physics Experiments 2007, Pts 1 And 2, Wilga, Poland, 21–27 May 2007; SPIE-INT SOC Optical Engineering: Bellingham, WA, USA, 2007; p. 69371Q. [Google Scholar]
  38. Hauser, P.C.; Kubáň, P. Capacitively coupled contactless conductivity detection for analytical techniques—Developments from 2018 to 2020. J. Chromatogr. A 2020, 1632, 461616. [Google Scholar] [CrossRef]
  39. Mazur, P.; Gozdowski, D.; Wójcik-Gront, E. Soil Electrical Conductivity and Satellite-Derived Vegetation Indices for Evaluation of Phosphorus, Potassium and Magnesium Content, pH, and Delineation of Within-Field Management Zones. Agriculture 2022, 12, 883. [Google Scholar] [CrossRef]
  40. Schwalbert, R.A.; Amado, T.J.C.; Reimche, G.B.; Gebert, F. Fine-tuning of wheat (Triticum aestivum, L.) variable nitrogen rate by combining crop sensing and management zones approaches in southern Brazil. Precis. Agric. 2019, 20, 56–77. [Google Scholar] [CrossRef]
  41. Butler, B.M.; Palarea-Albaladejo, J.; Shepherd, K.D.; Nyambura, K.M.; Towett, E.K.; Sila, A.M.; Hillier, S. Mineral-nutrient relationships in African soils assessed using cluster analysis of X-ray powder diffraction patterns and compositional methods. Geoderma 2020, 375, 114474. [Google Scholar] [CrossRef]
  42. Zhang, Q.; Bostic, J.T.; Sabo, R.D. Regional patterns and drivers of total nitrogen trends in the Chesapeake Bay watershed: Insights from machine learning approaches and management implications. Water Res. 2022, 218, 118443. [Google Scholar] [CrossRef]
  43. Metwally, M.S.; Shaddad, S.M.; Liu, M.; Yao, R.-J.; Abdo, A.I.; Li, P.; Jiao, J.; Chen, X. Soil Properties Spatial Variability and Delineation of Site-Specific Management Zones Based on Soil Fertility Using Fuzzy Clustering in a Hilly Field in Jianyang, Sichuan, China. Sustainability 2019, 11, 7084. [Google Scholar] [CrossRef] [Green Version]
  44. Burns, D.T.; Walker, M.J. Origins of the method of standard additions and of the use of an internal standard in quantitative instrumental chemical analyses. Anal. Bioanal. Chem. 2019, 411, 2749–2753. [Google Scholar] [CrossRef]
Figure 1. Distribution of soil sampling points.
Agriculture 13 00313 g001
Figure 2. Structure of capacitive coupled contactless conductivity detection device.
Agriculture 13 00313 g002
Figure 3. Electrophoretic peak for K+ of Xuchang soil sample B1.
Agriculture 13 00313 g003
Figure 4. Peak height and peak area of the electropherogram for soil sample B1.
Agriculture 13 00313 g004
Figure 5. Peak height and peak area of the electropherogram for soil sample B1 after adding standard reagent.
Agriculture 13 00313 g005
Figure 6. Quantitative calculation of ion concentration in soil.
Agriculture 13 00313 g006
Figure 7. Distribution map of soil available potassium in the three-level partition.
Agriculture 13 00313 g007
Figure 8. Distribution map of soil available potassium in the five-level partition.
Agriculture 13 00313 g008
Table 1. Statistics on clustering partition of available potassium.
Three-Level PartitionFive-Level Partition
Available potassium gradeLowMiddleHighLowLess lowMiddleLess highHigh
Grid numbers in the zone86231029572391
Table 2. Comparison of detection results between the C4D method and flame photometer method.
Sample NumberC4D Method
(mg/kg)
Flame Photometer Method (mg/kg)Relative Deviation (%)
A98.6572%
D313.8953.3%
F513.9954.4%
G59.9101%
J910.211−7.3%
C712.613−3%
K714.915−0.7%
H1114.716−8.1%
D120.421−2.9%
E122.826−12.3%
F1124.928−11.1%
J131.132−2.8%
B128.834−15.3%
C1340.741−0.73%
H148.151−5.7%
F1357.562−7.3%
D131211191.7%
Disclaimer/Publisher’s Note: The statements, opinions and data contained in all publications are solely those of the individual author(s) and contributor(s) and not of MDPI and/or the editor(s). MDPI and/or the editor(s) disclaim responsibility for any injury to people or property resulting from any ideas, methods, instructions or products referred to in the content.

