
Development of a Real-Time Tractor Model for Gear Shift Performance Verification
 and
and
Abstract
:1. Introduction
- A real-time plant model ensuring real-time responsiveness and high precision of the actual tractor to be developed was developed to verify control algorithms in the tractor development process.
- In order to evaluate the shifting performance of control algorithms accurately, detailed modeling of shifting-related components was developed and validated from the test results.
- The entire plant model was validated through driving simulation to confirm the real-time simulation capability and suitability for verifying control algorithms.
2. Materials and Methods
2.1. Target Tractor
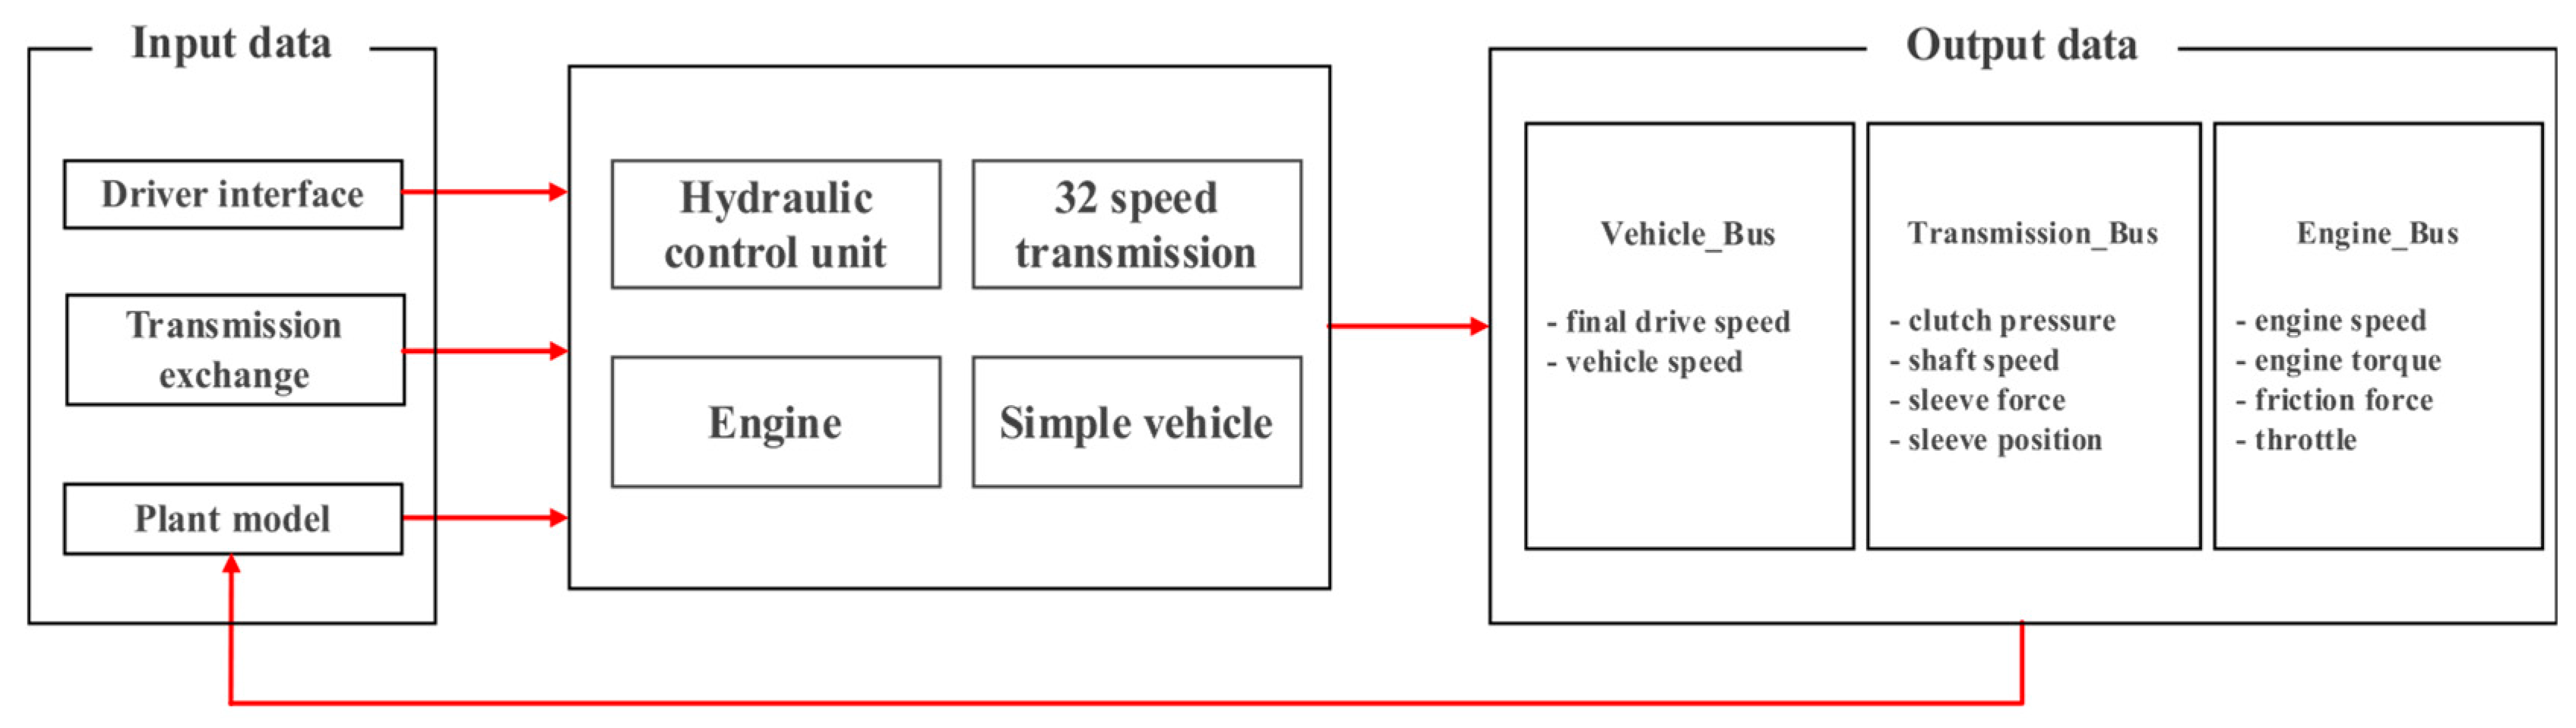
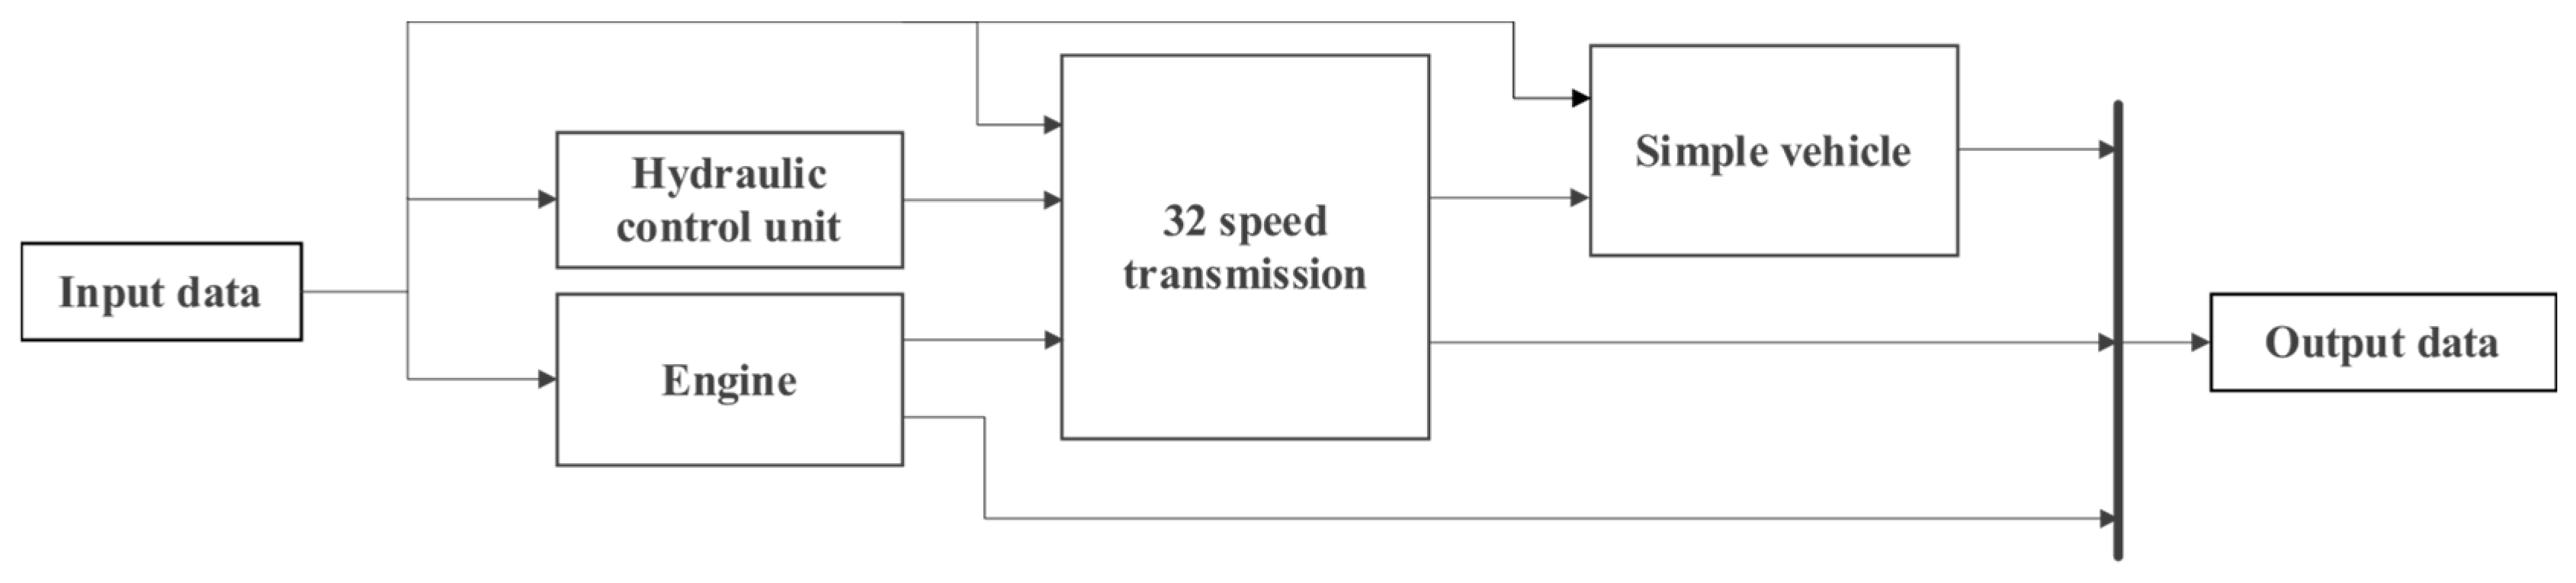
2.2. Model Outline
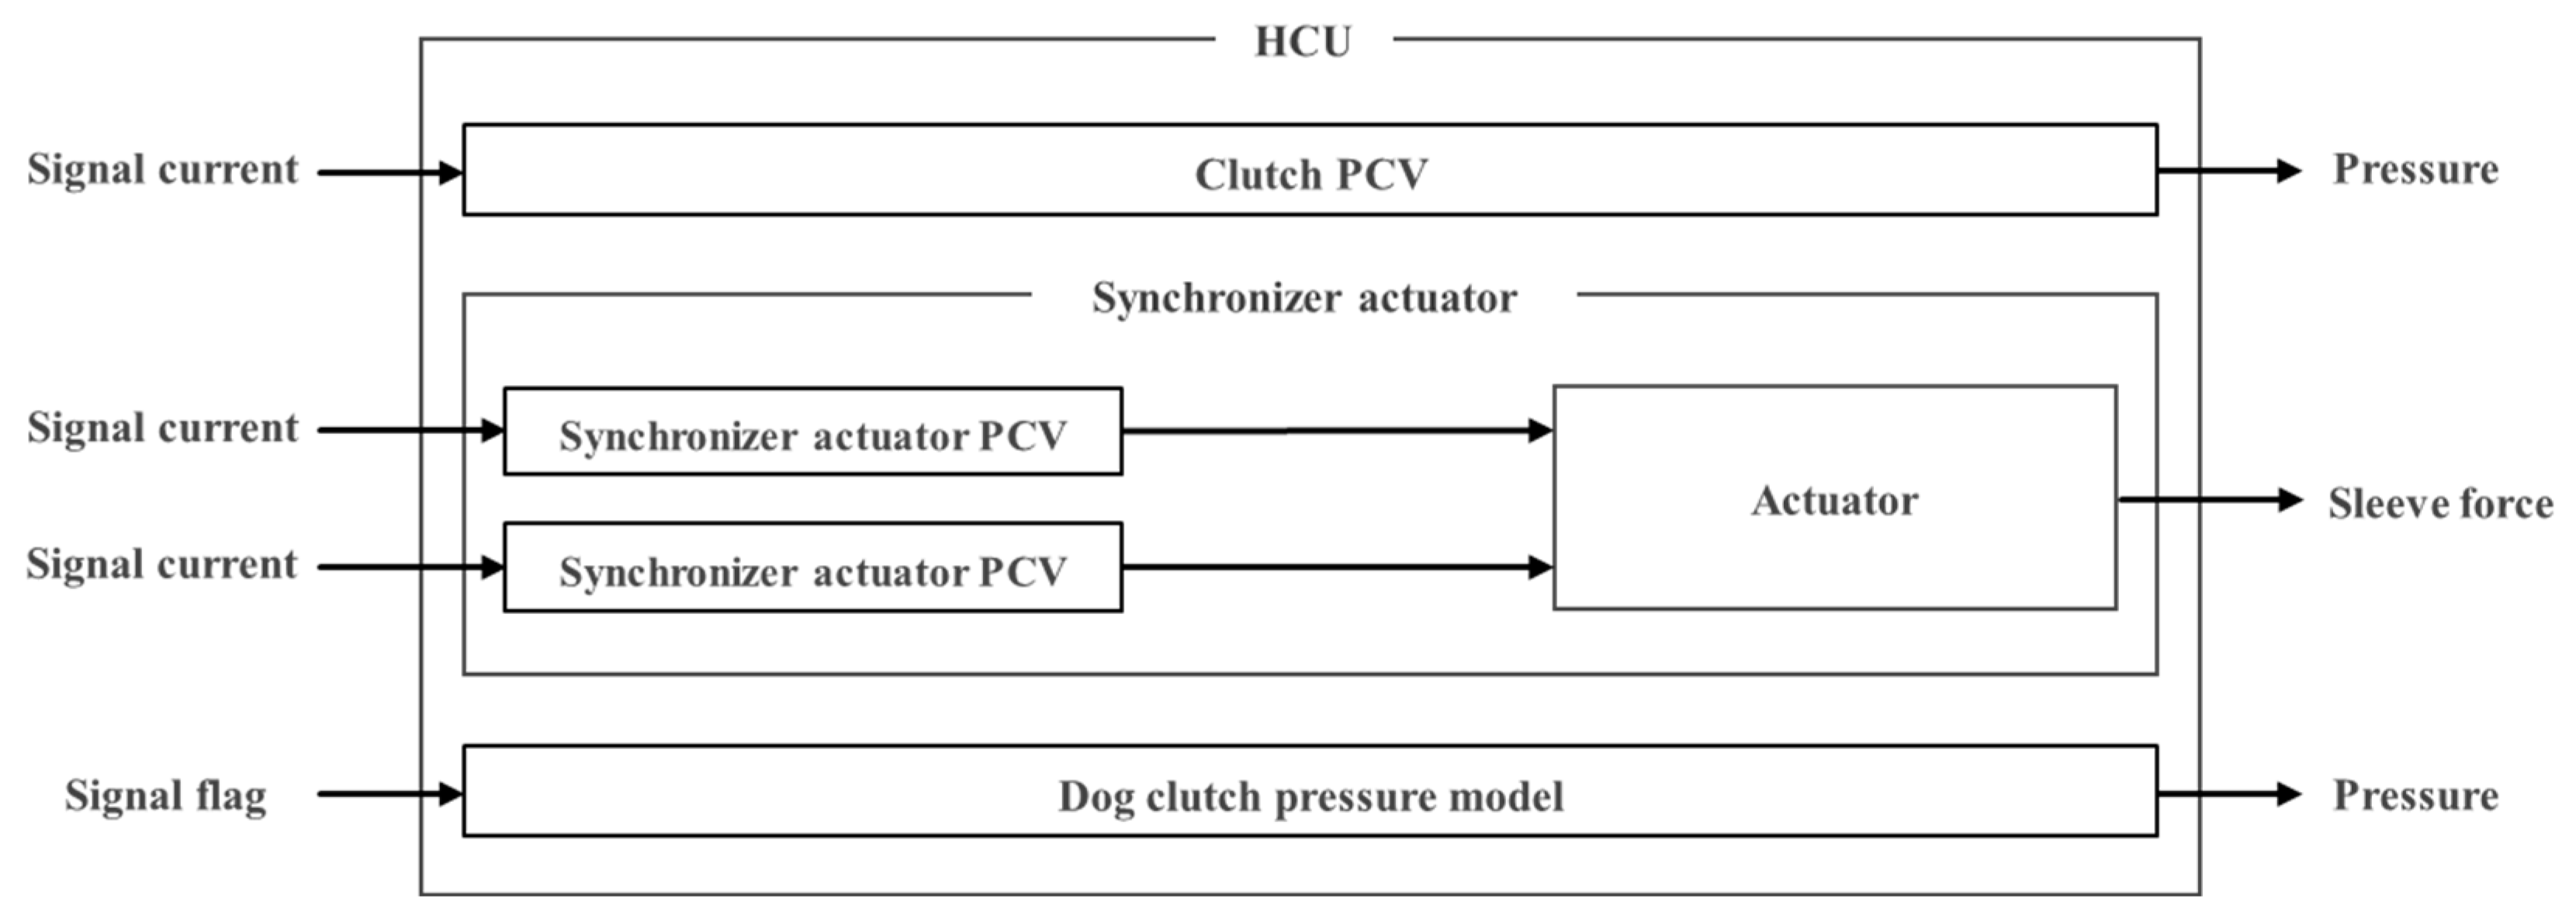
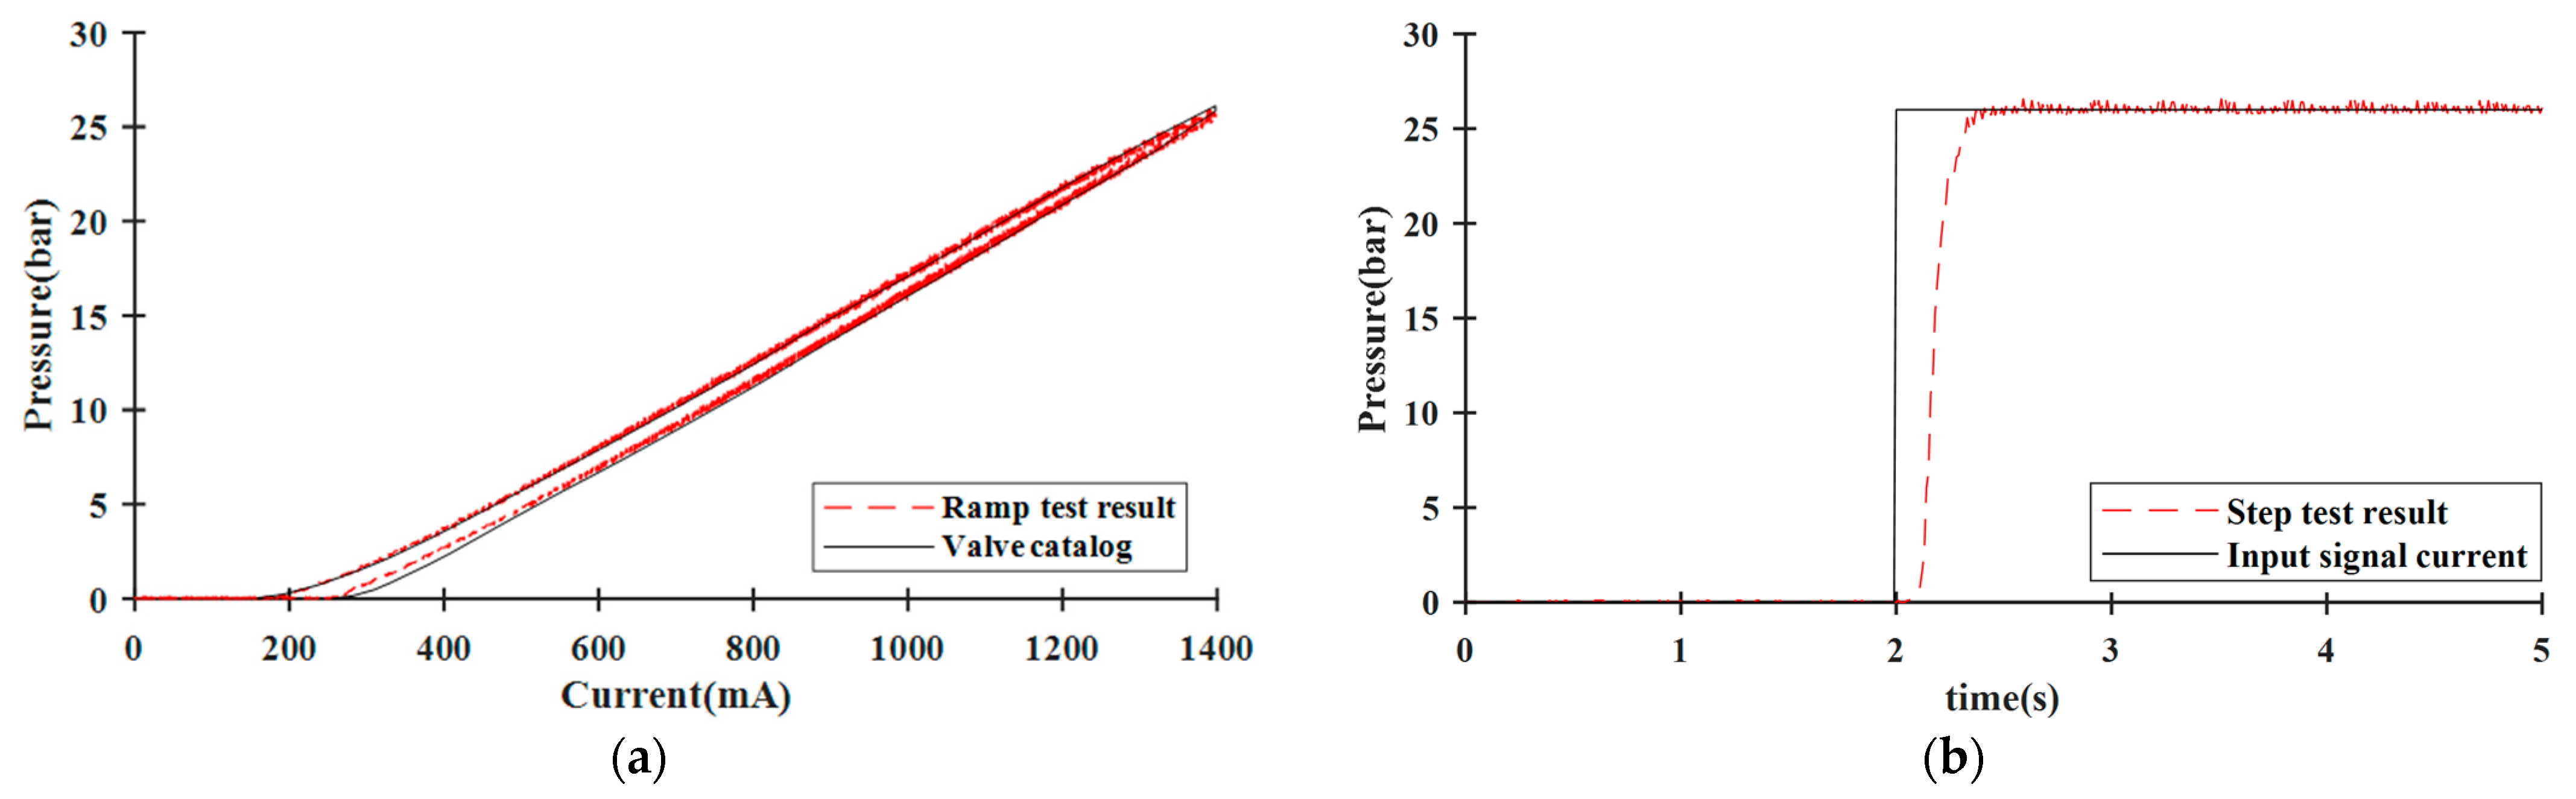
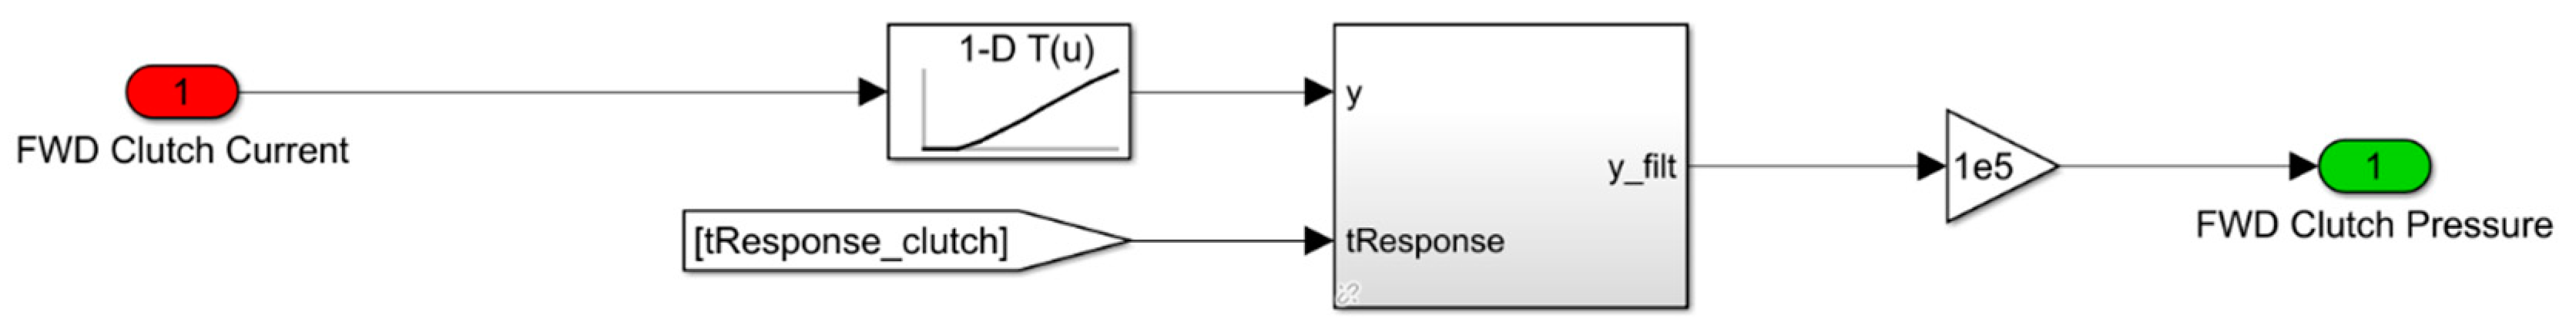
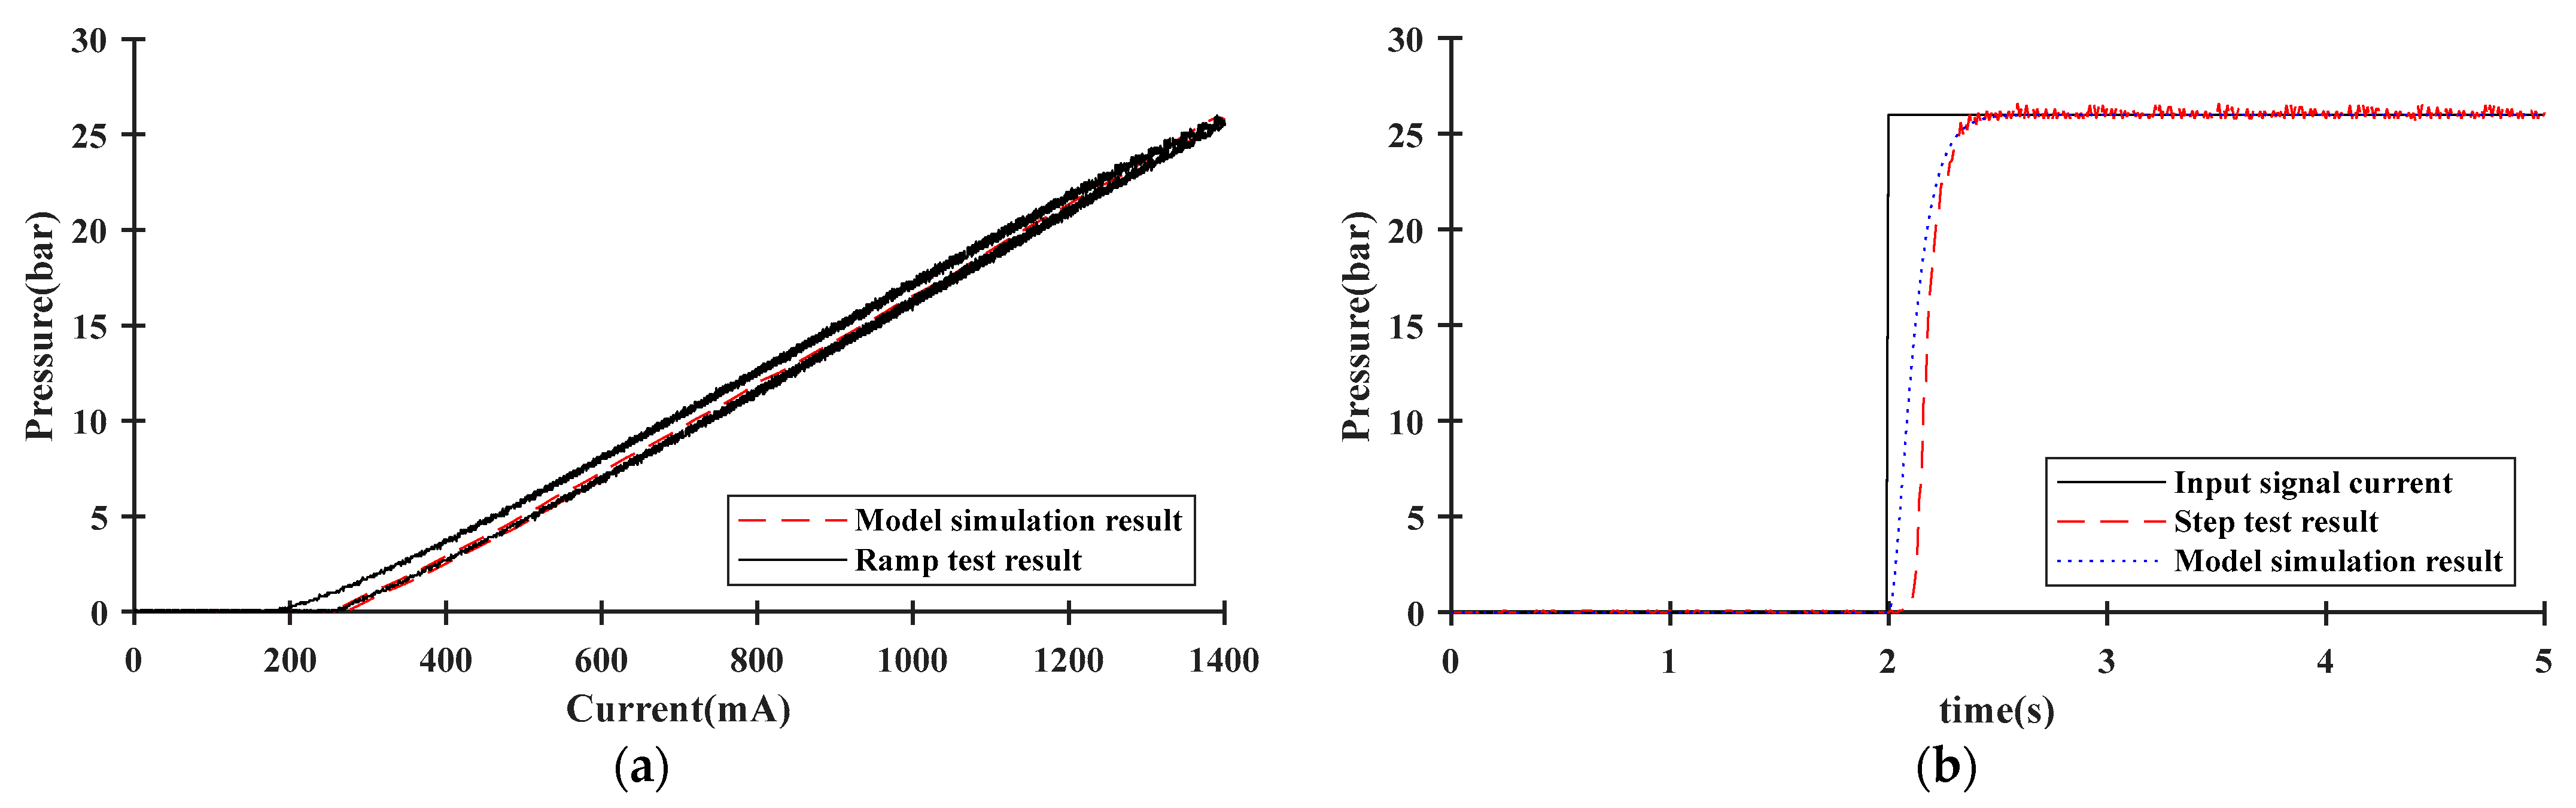
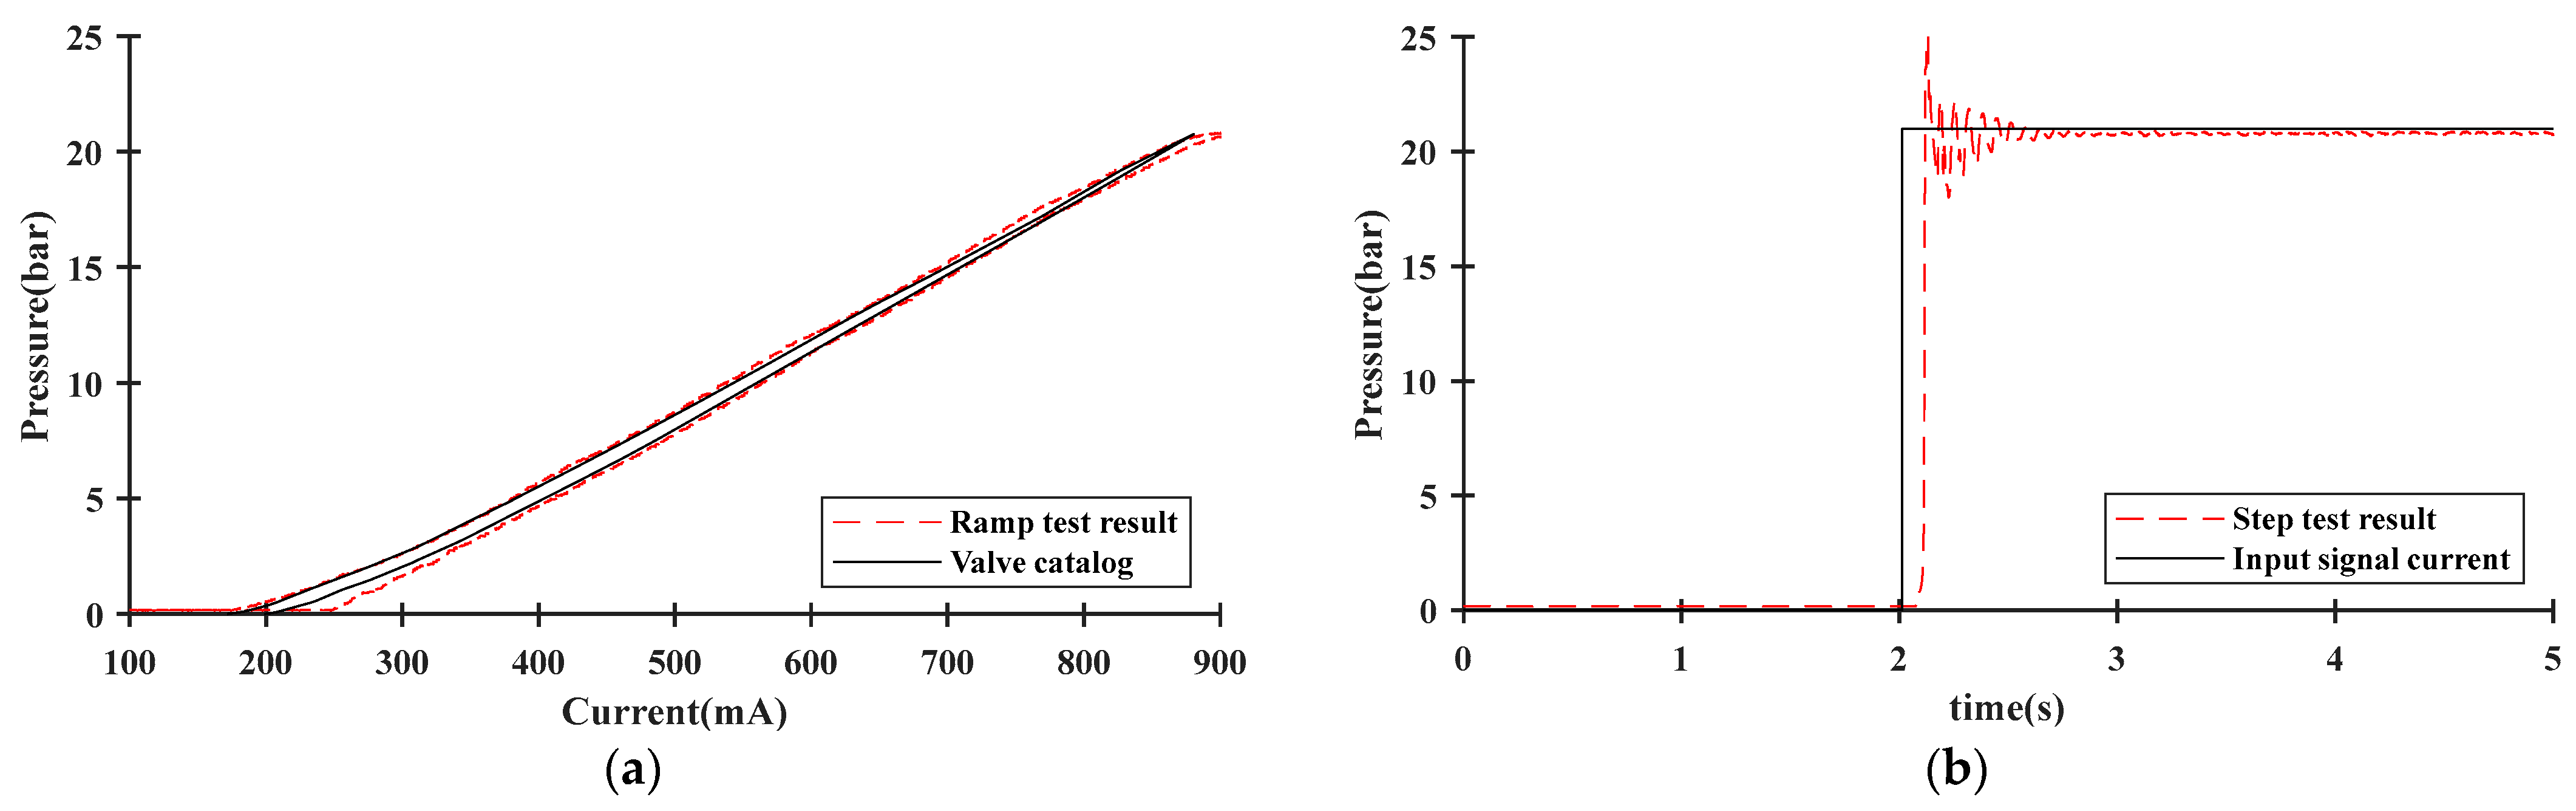
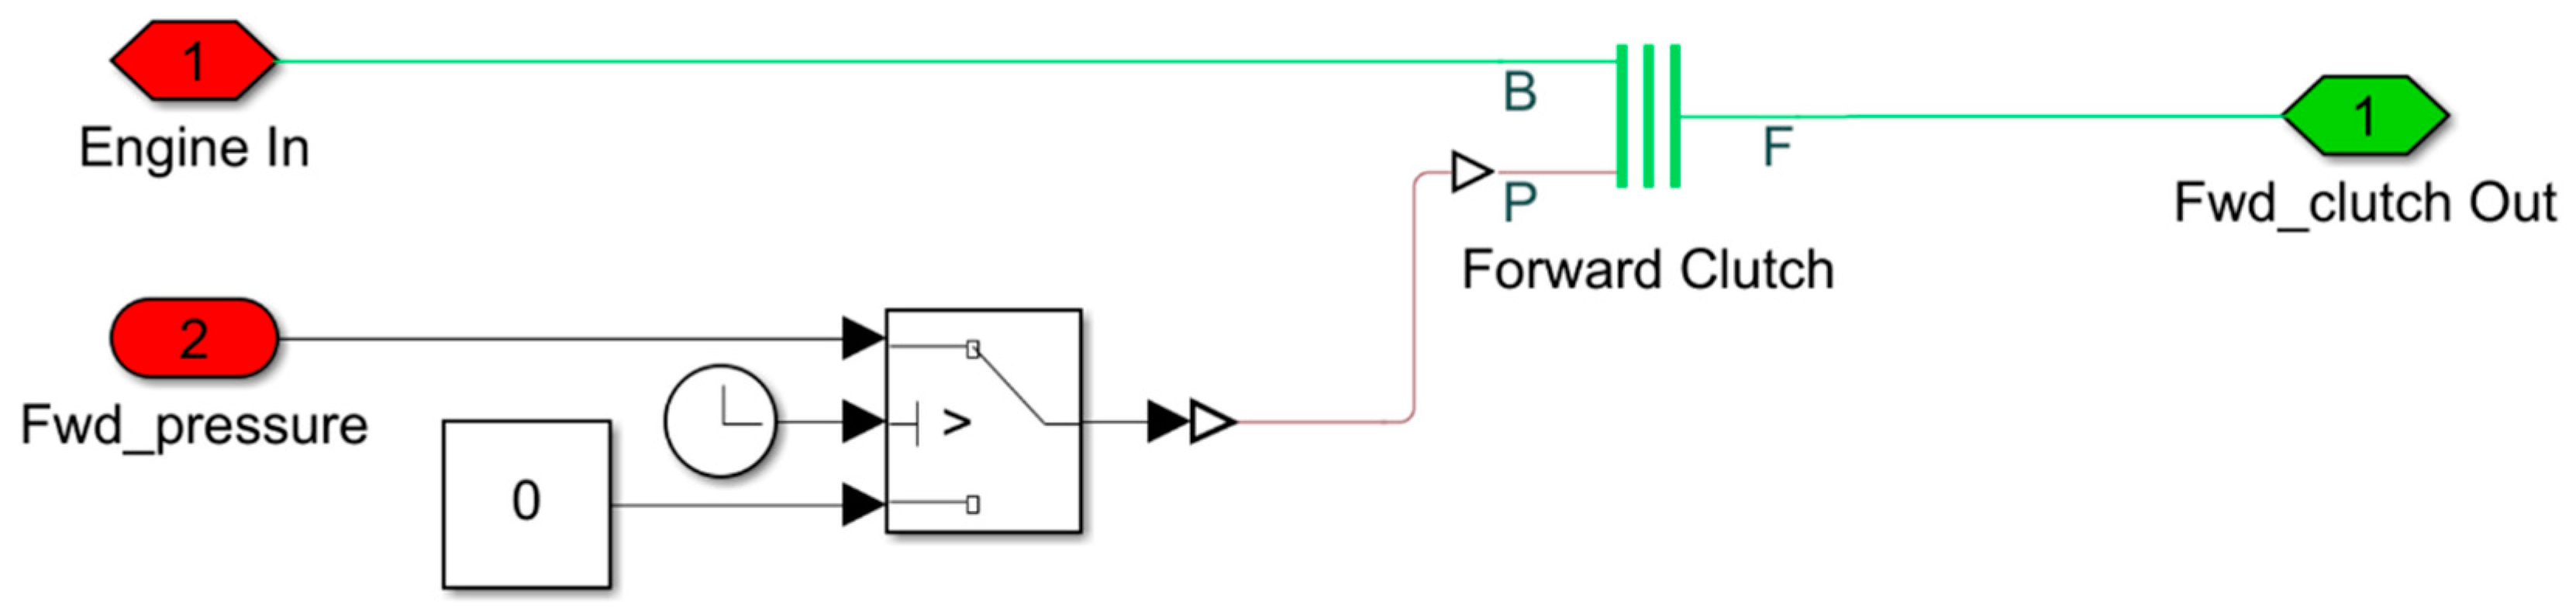
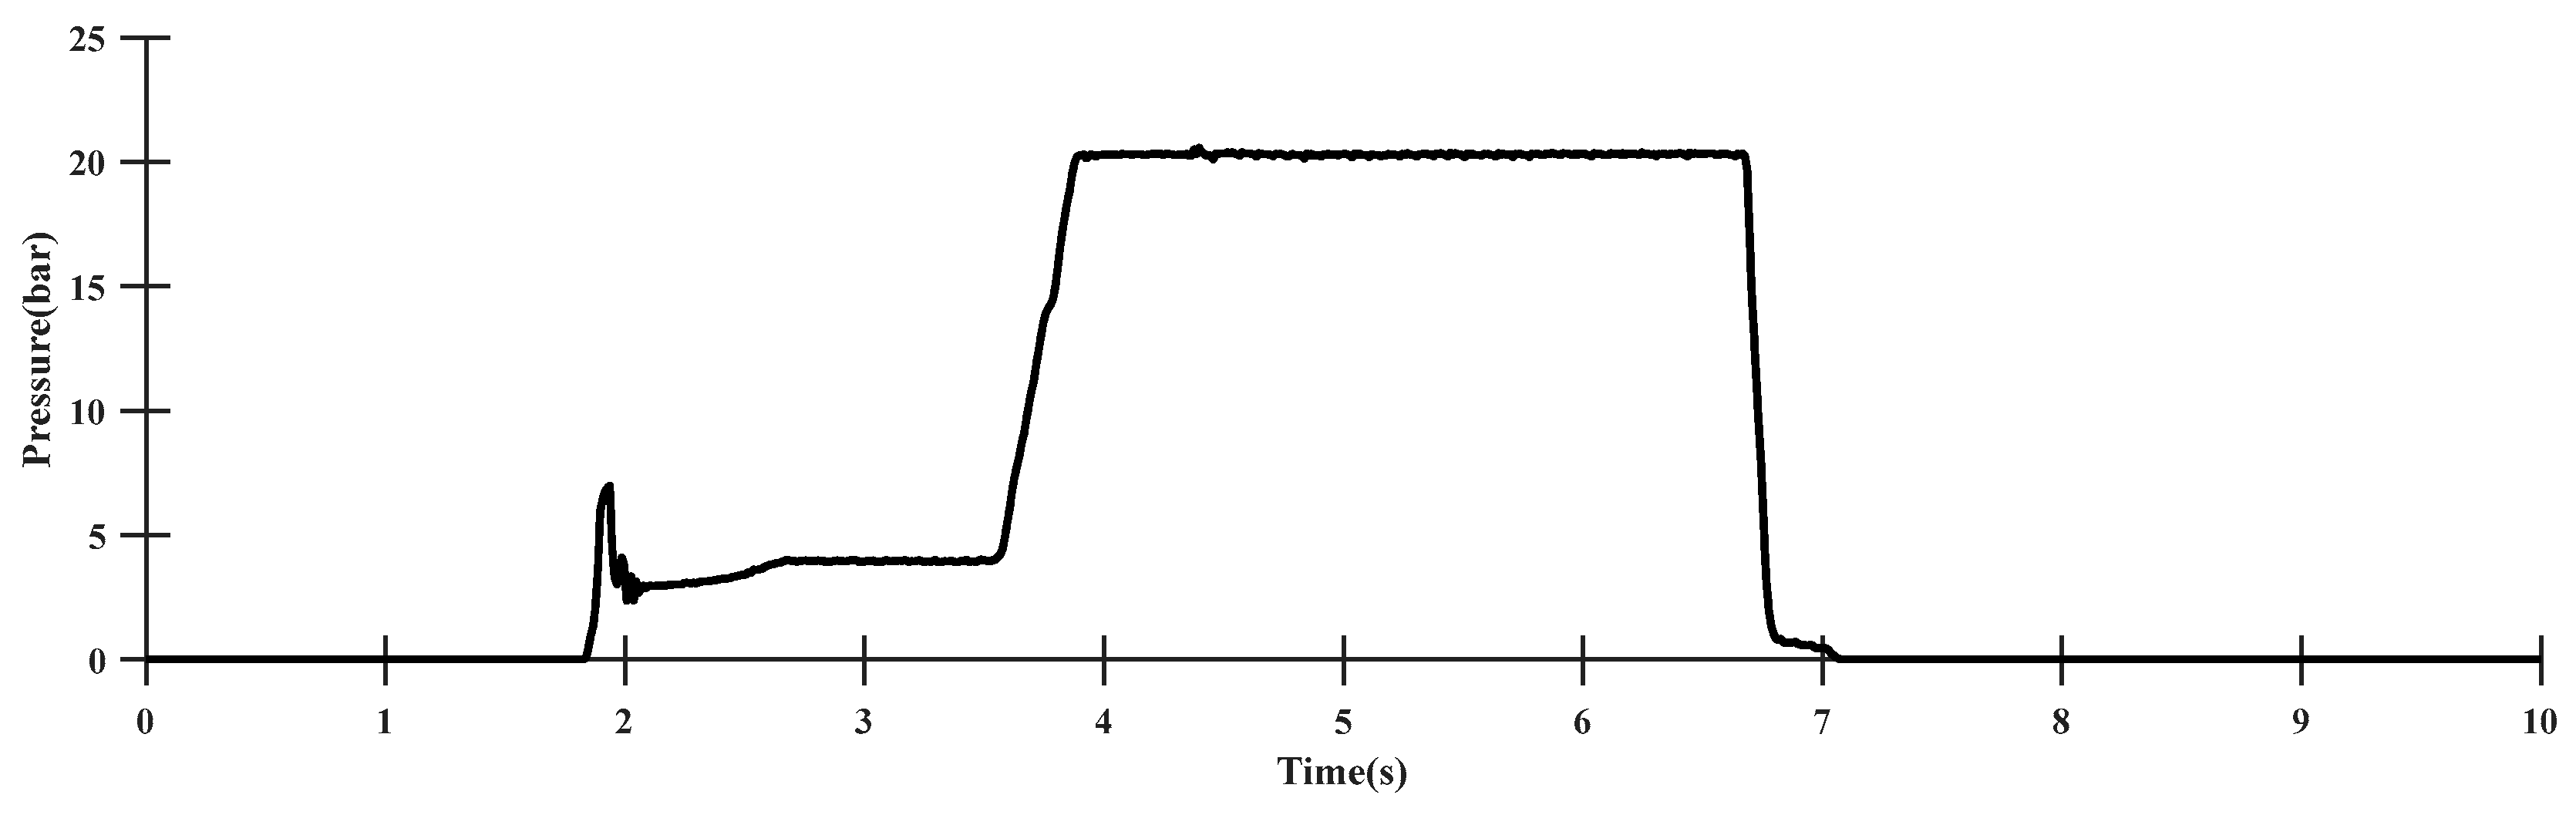
2.3. HCU Modeling
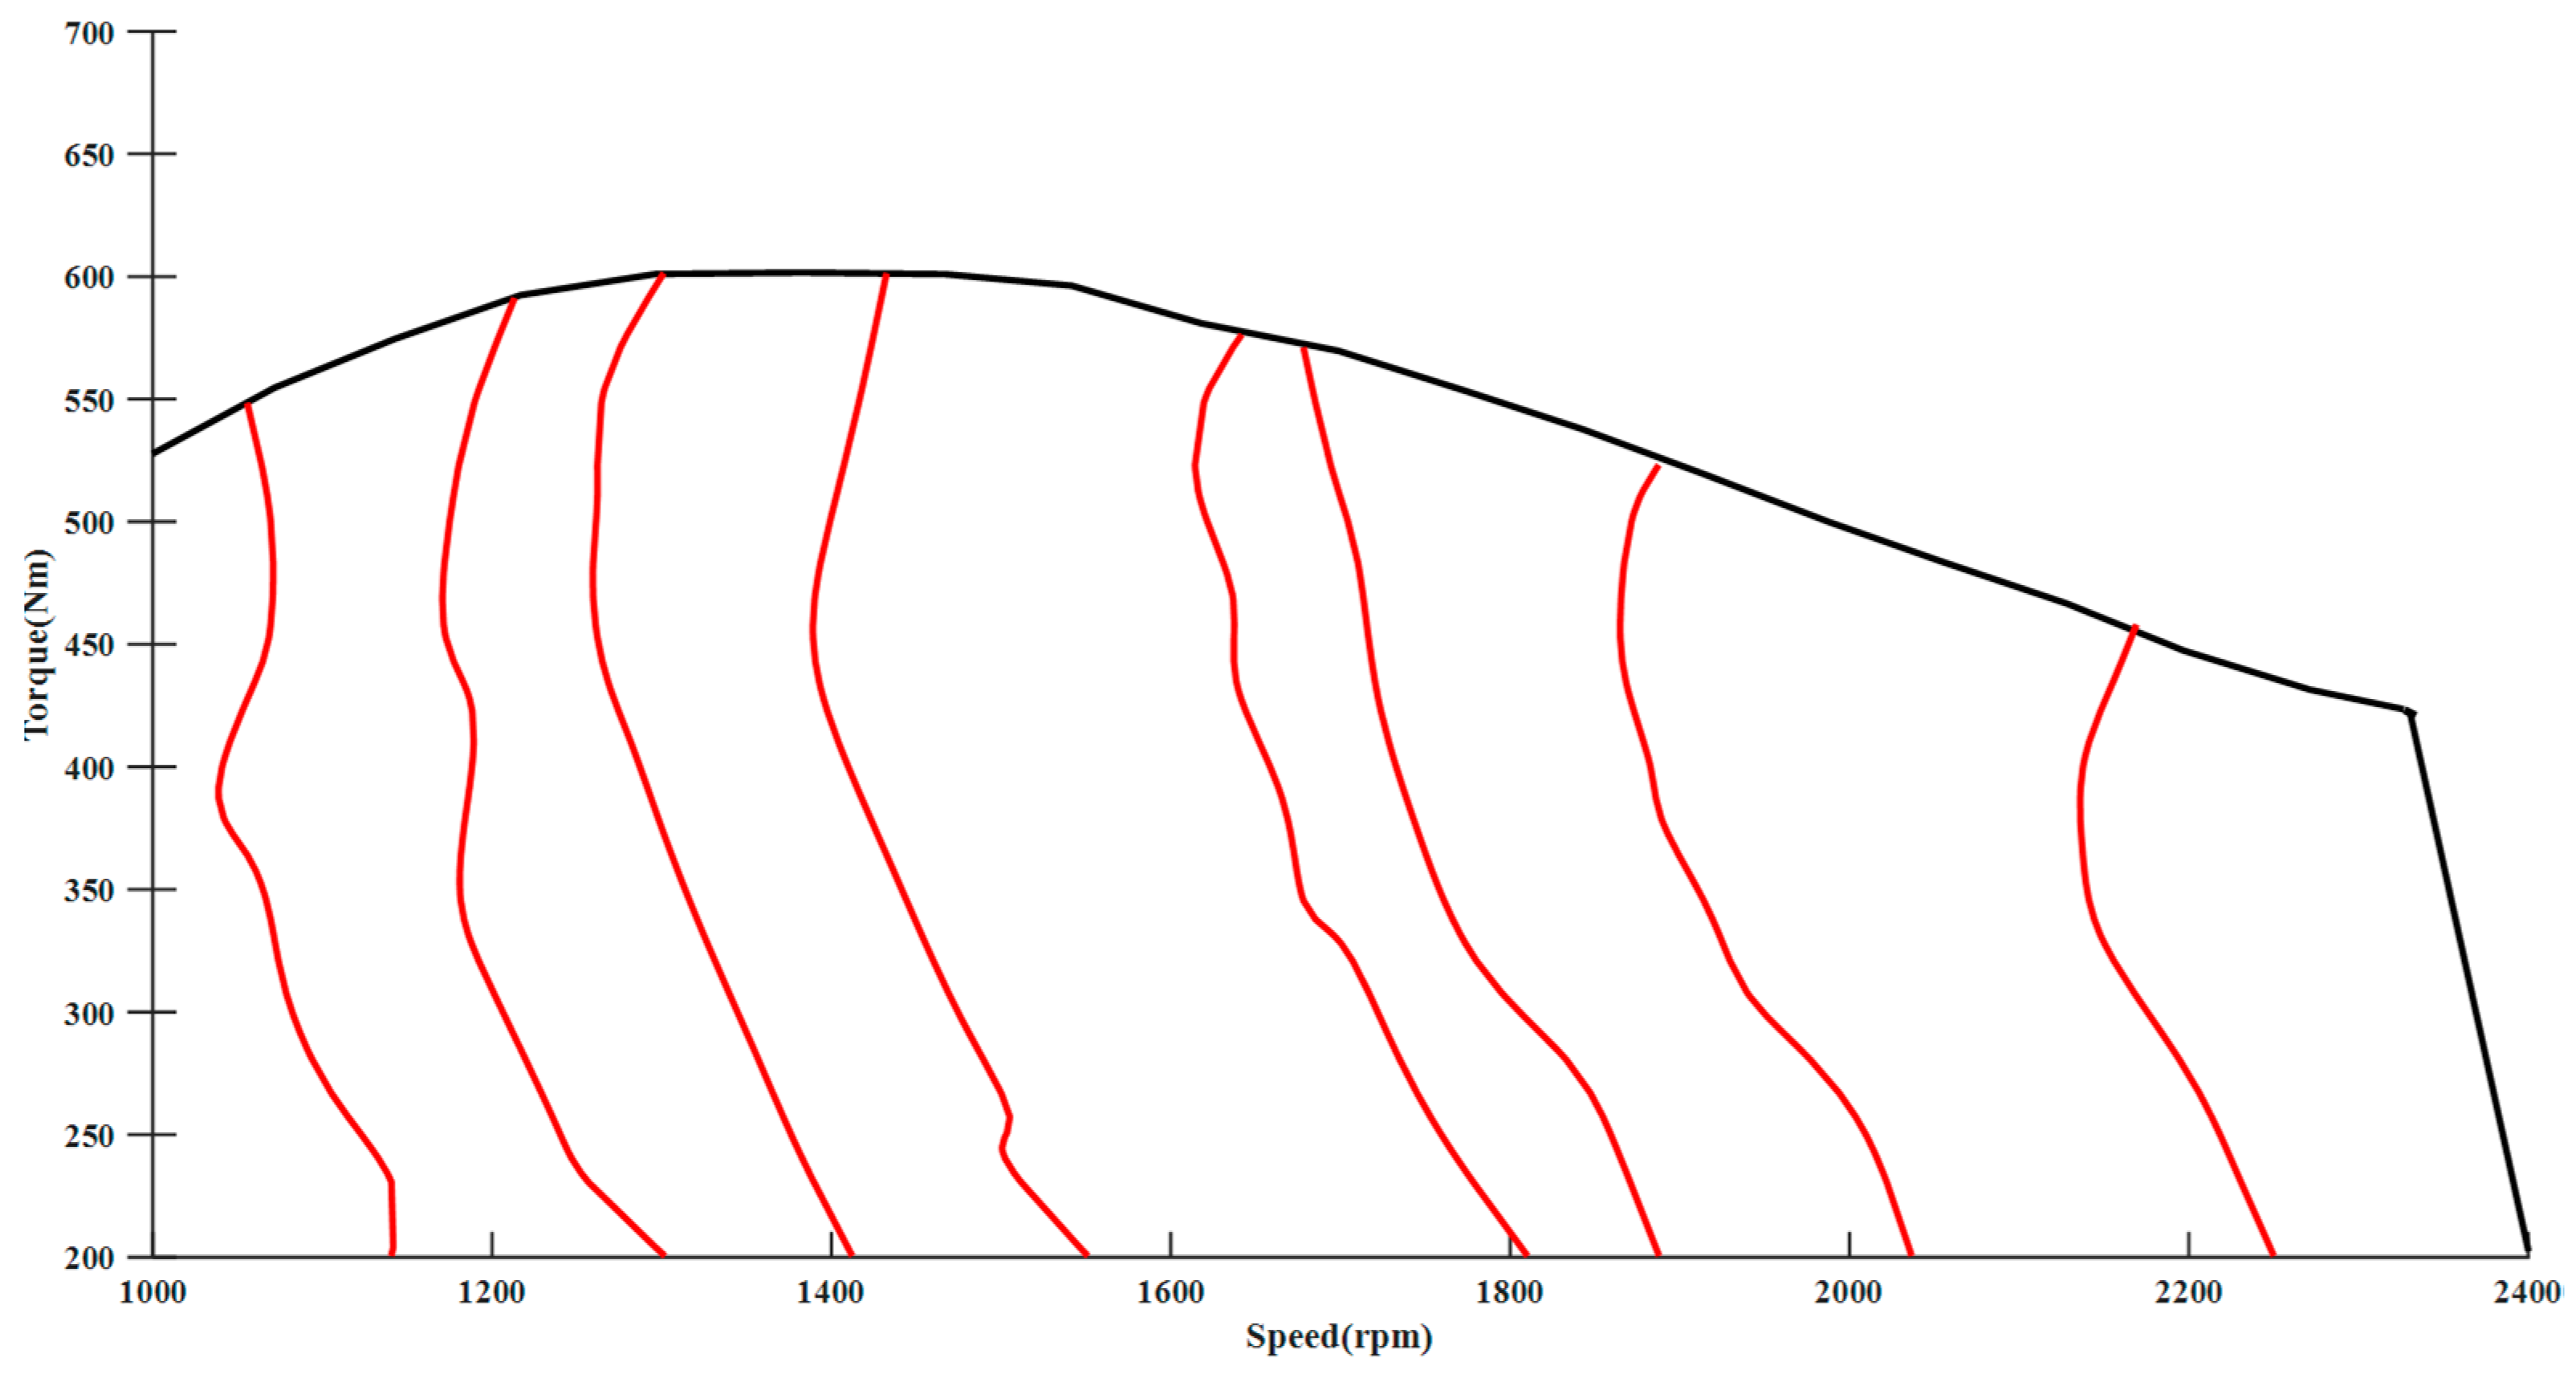
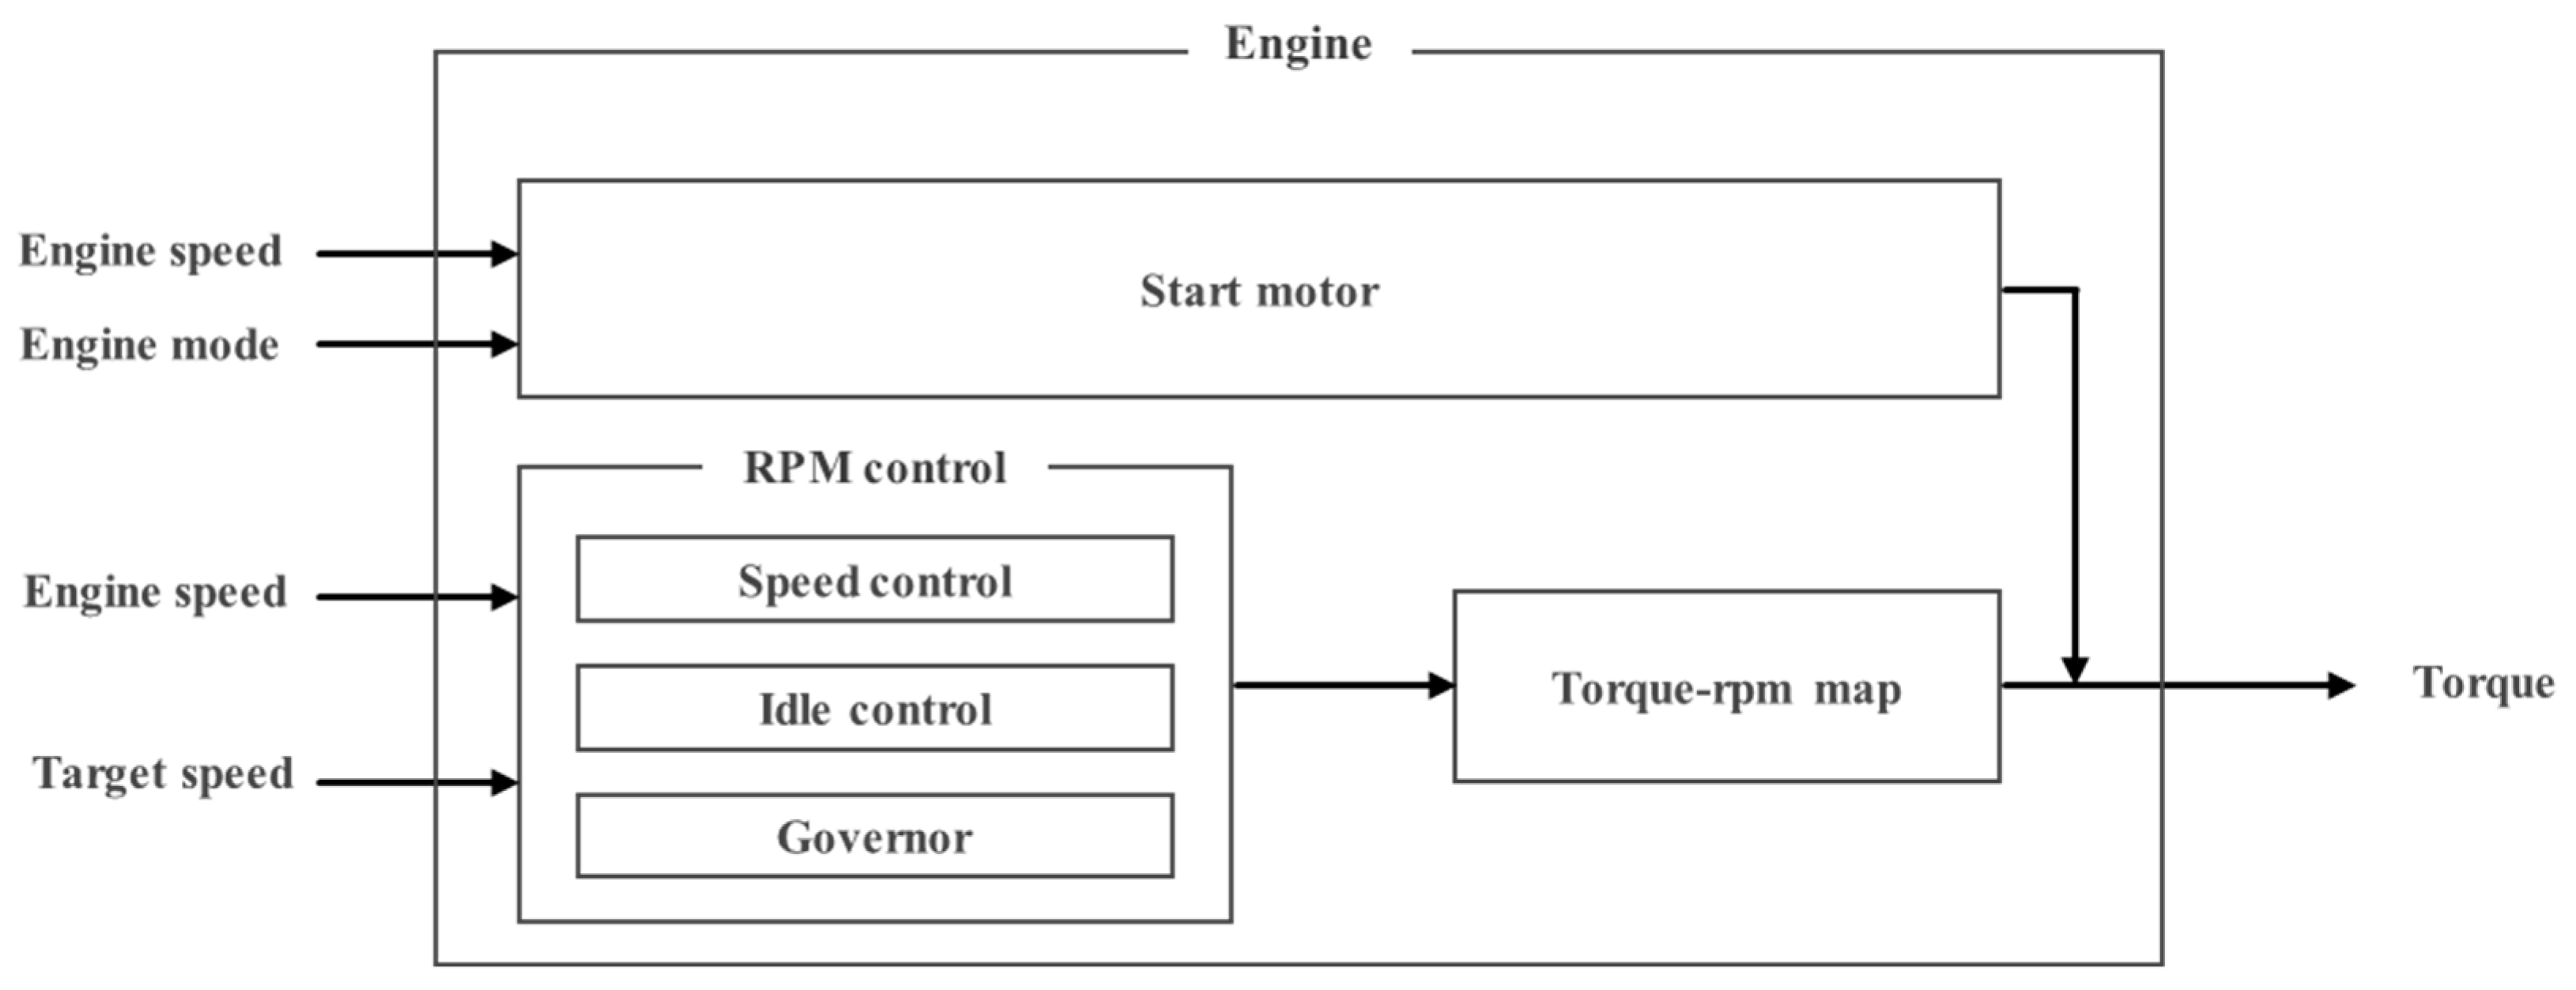
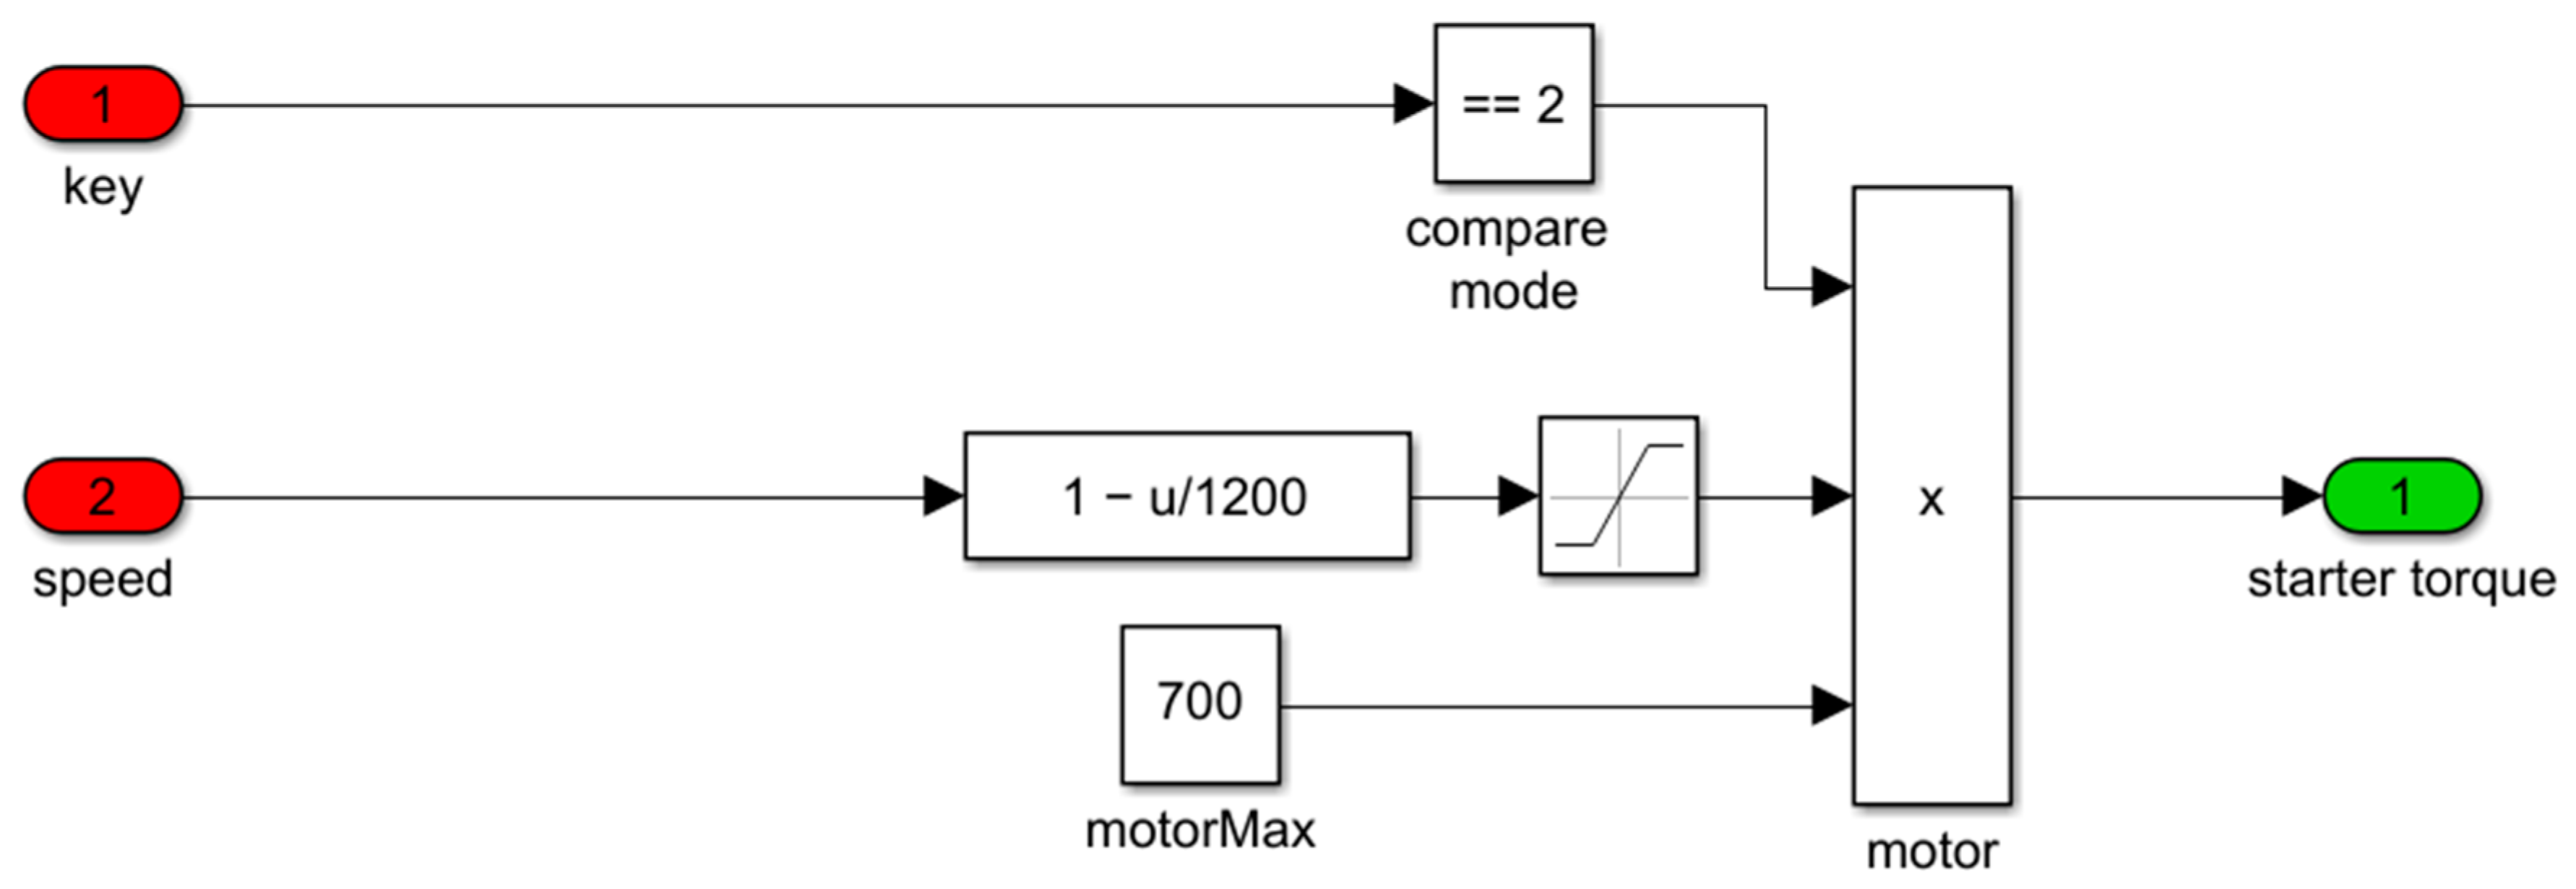
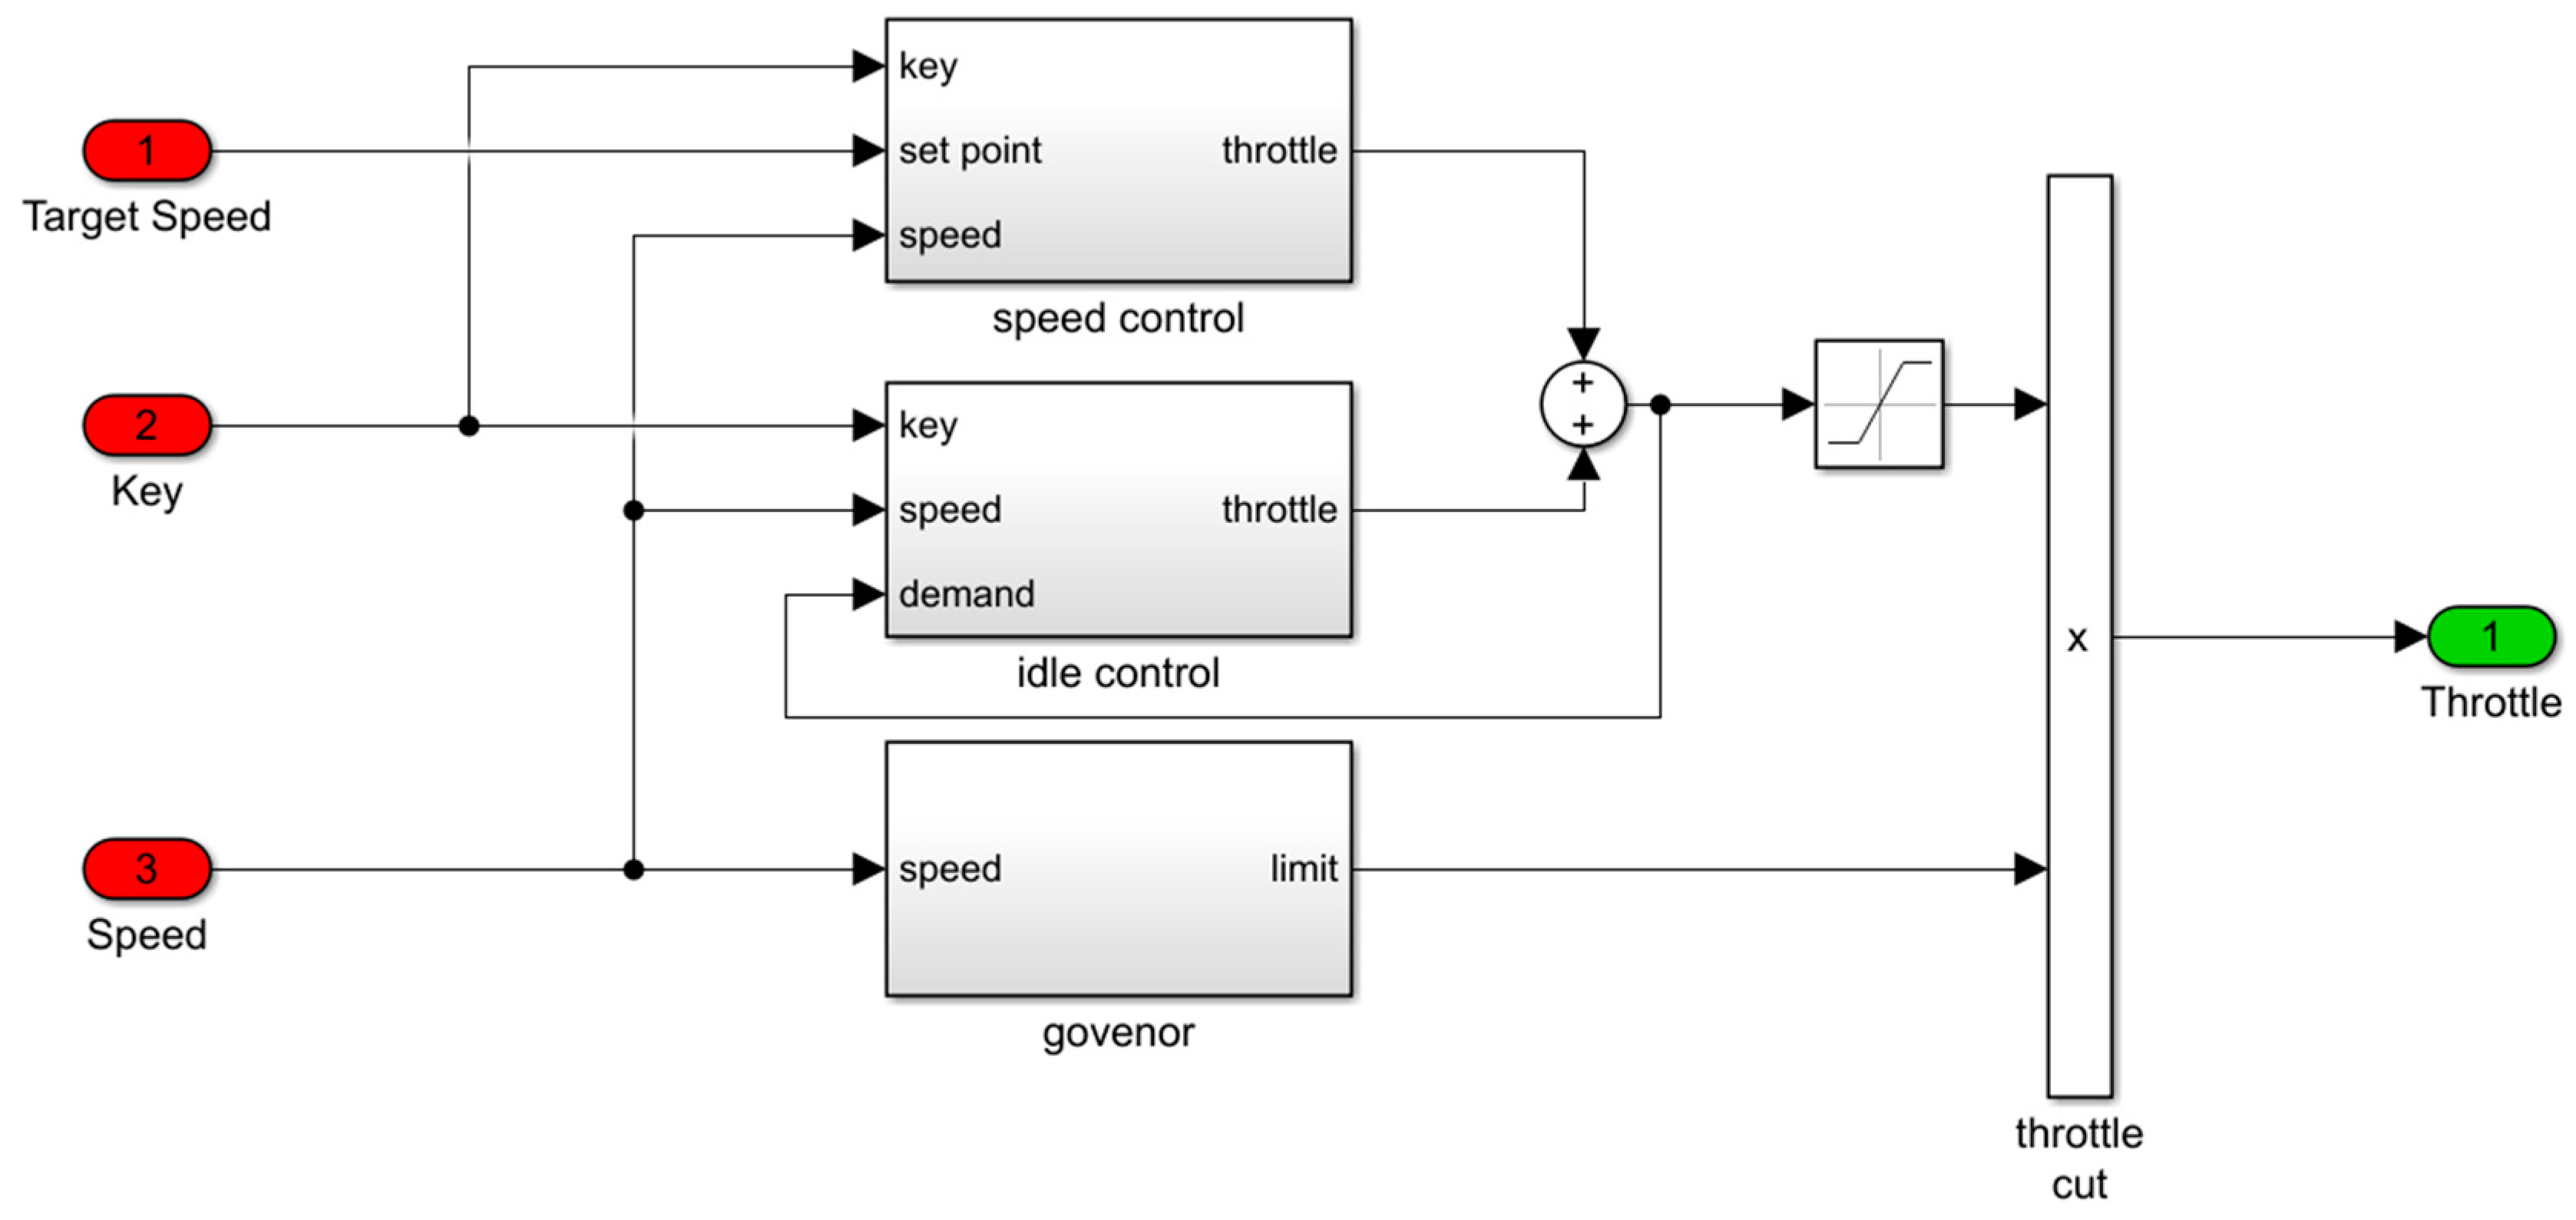
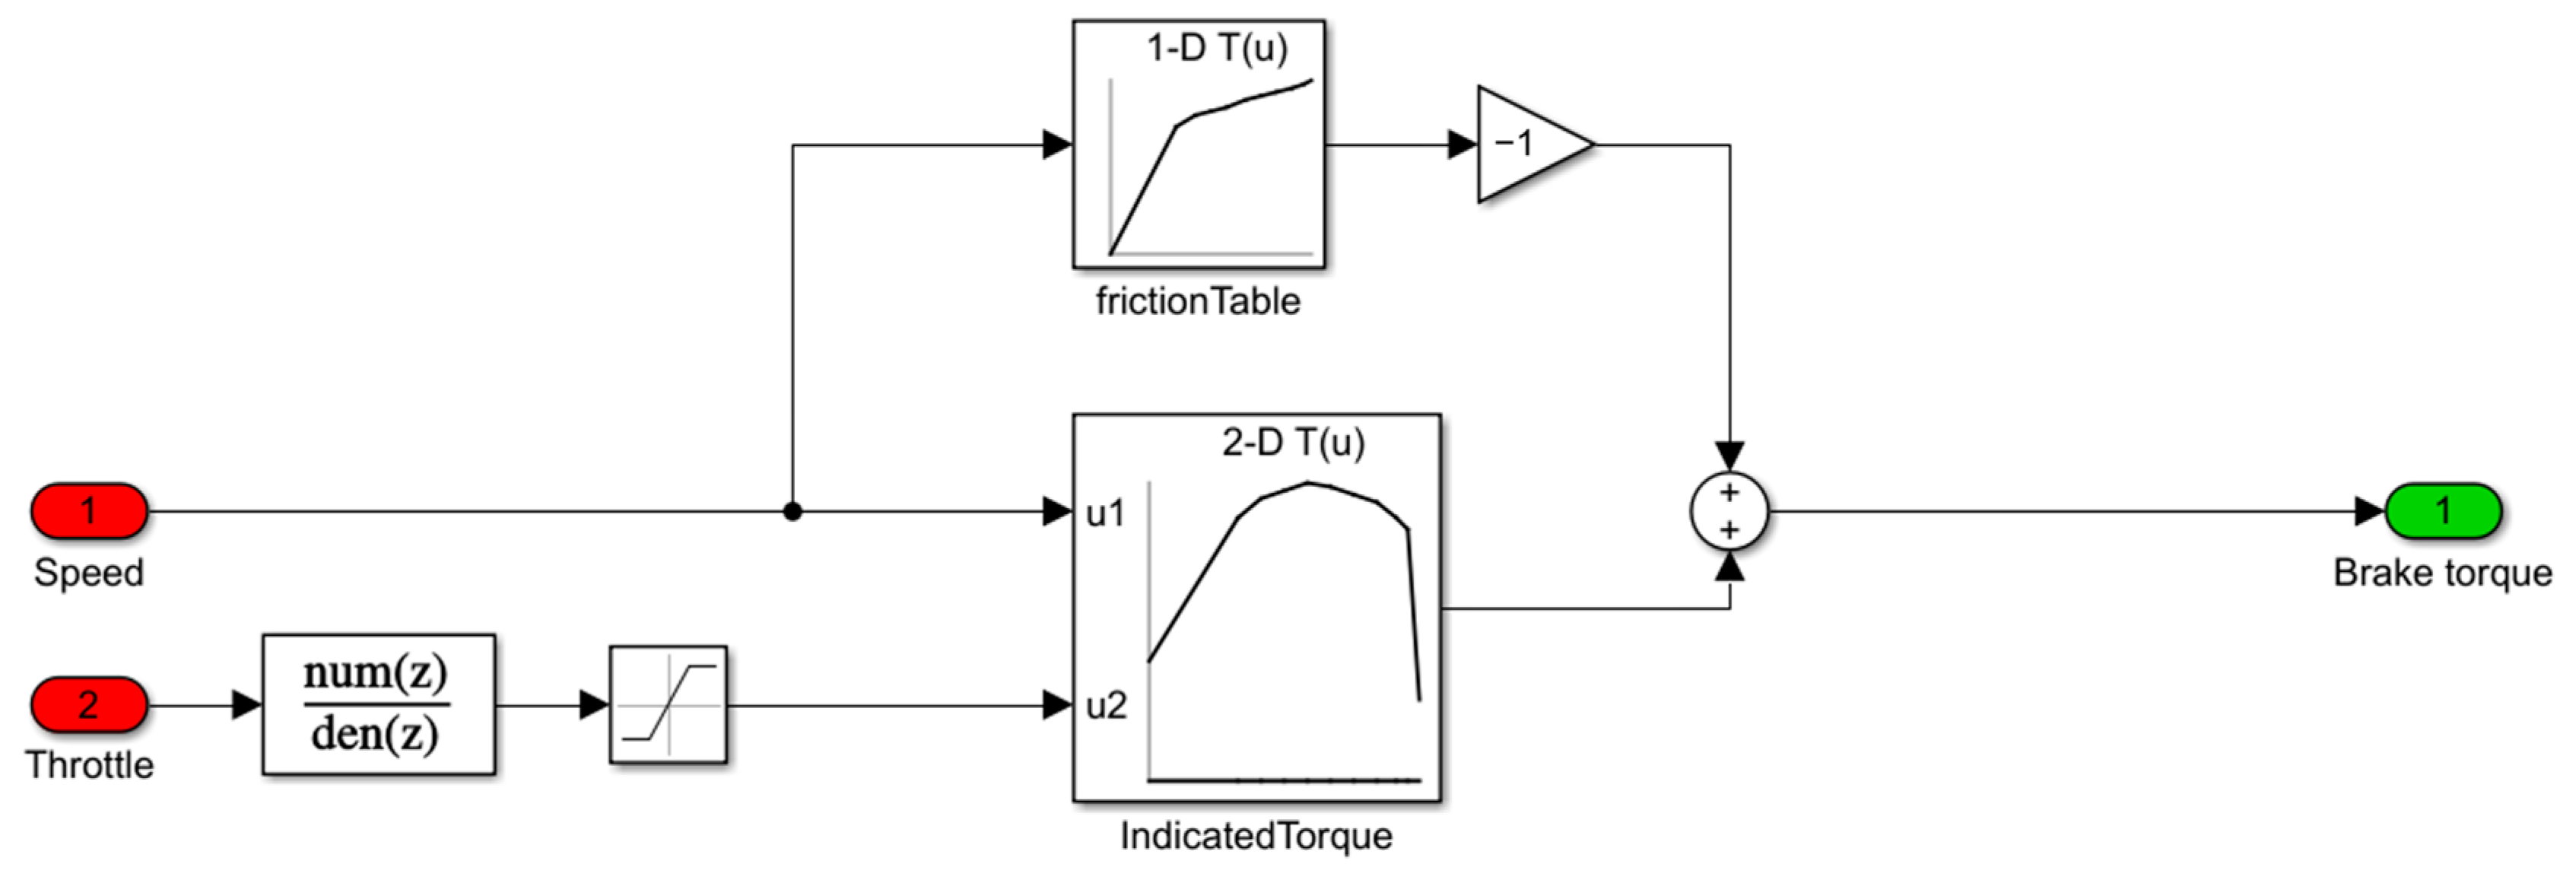
2.4. Engine Modeling
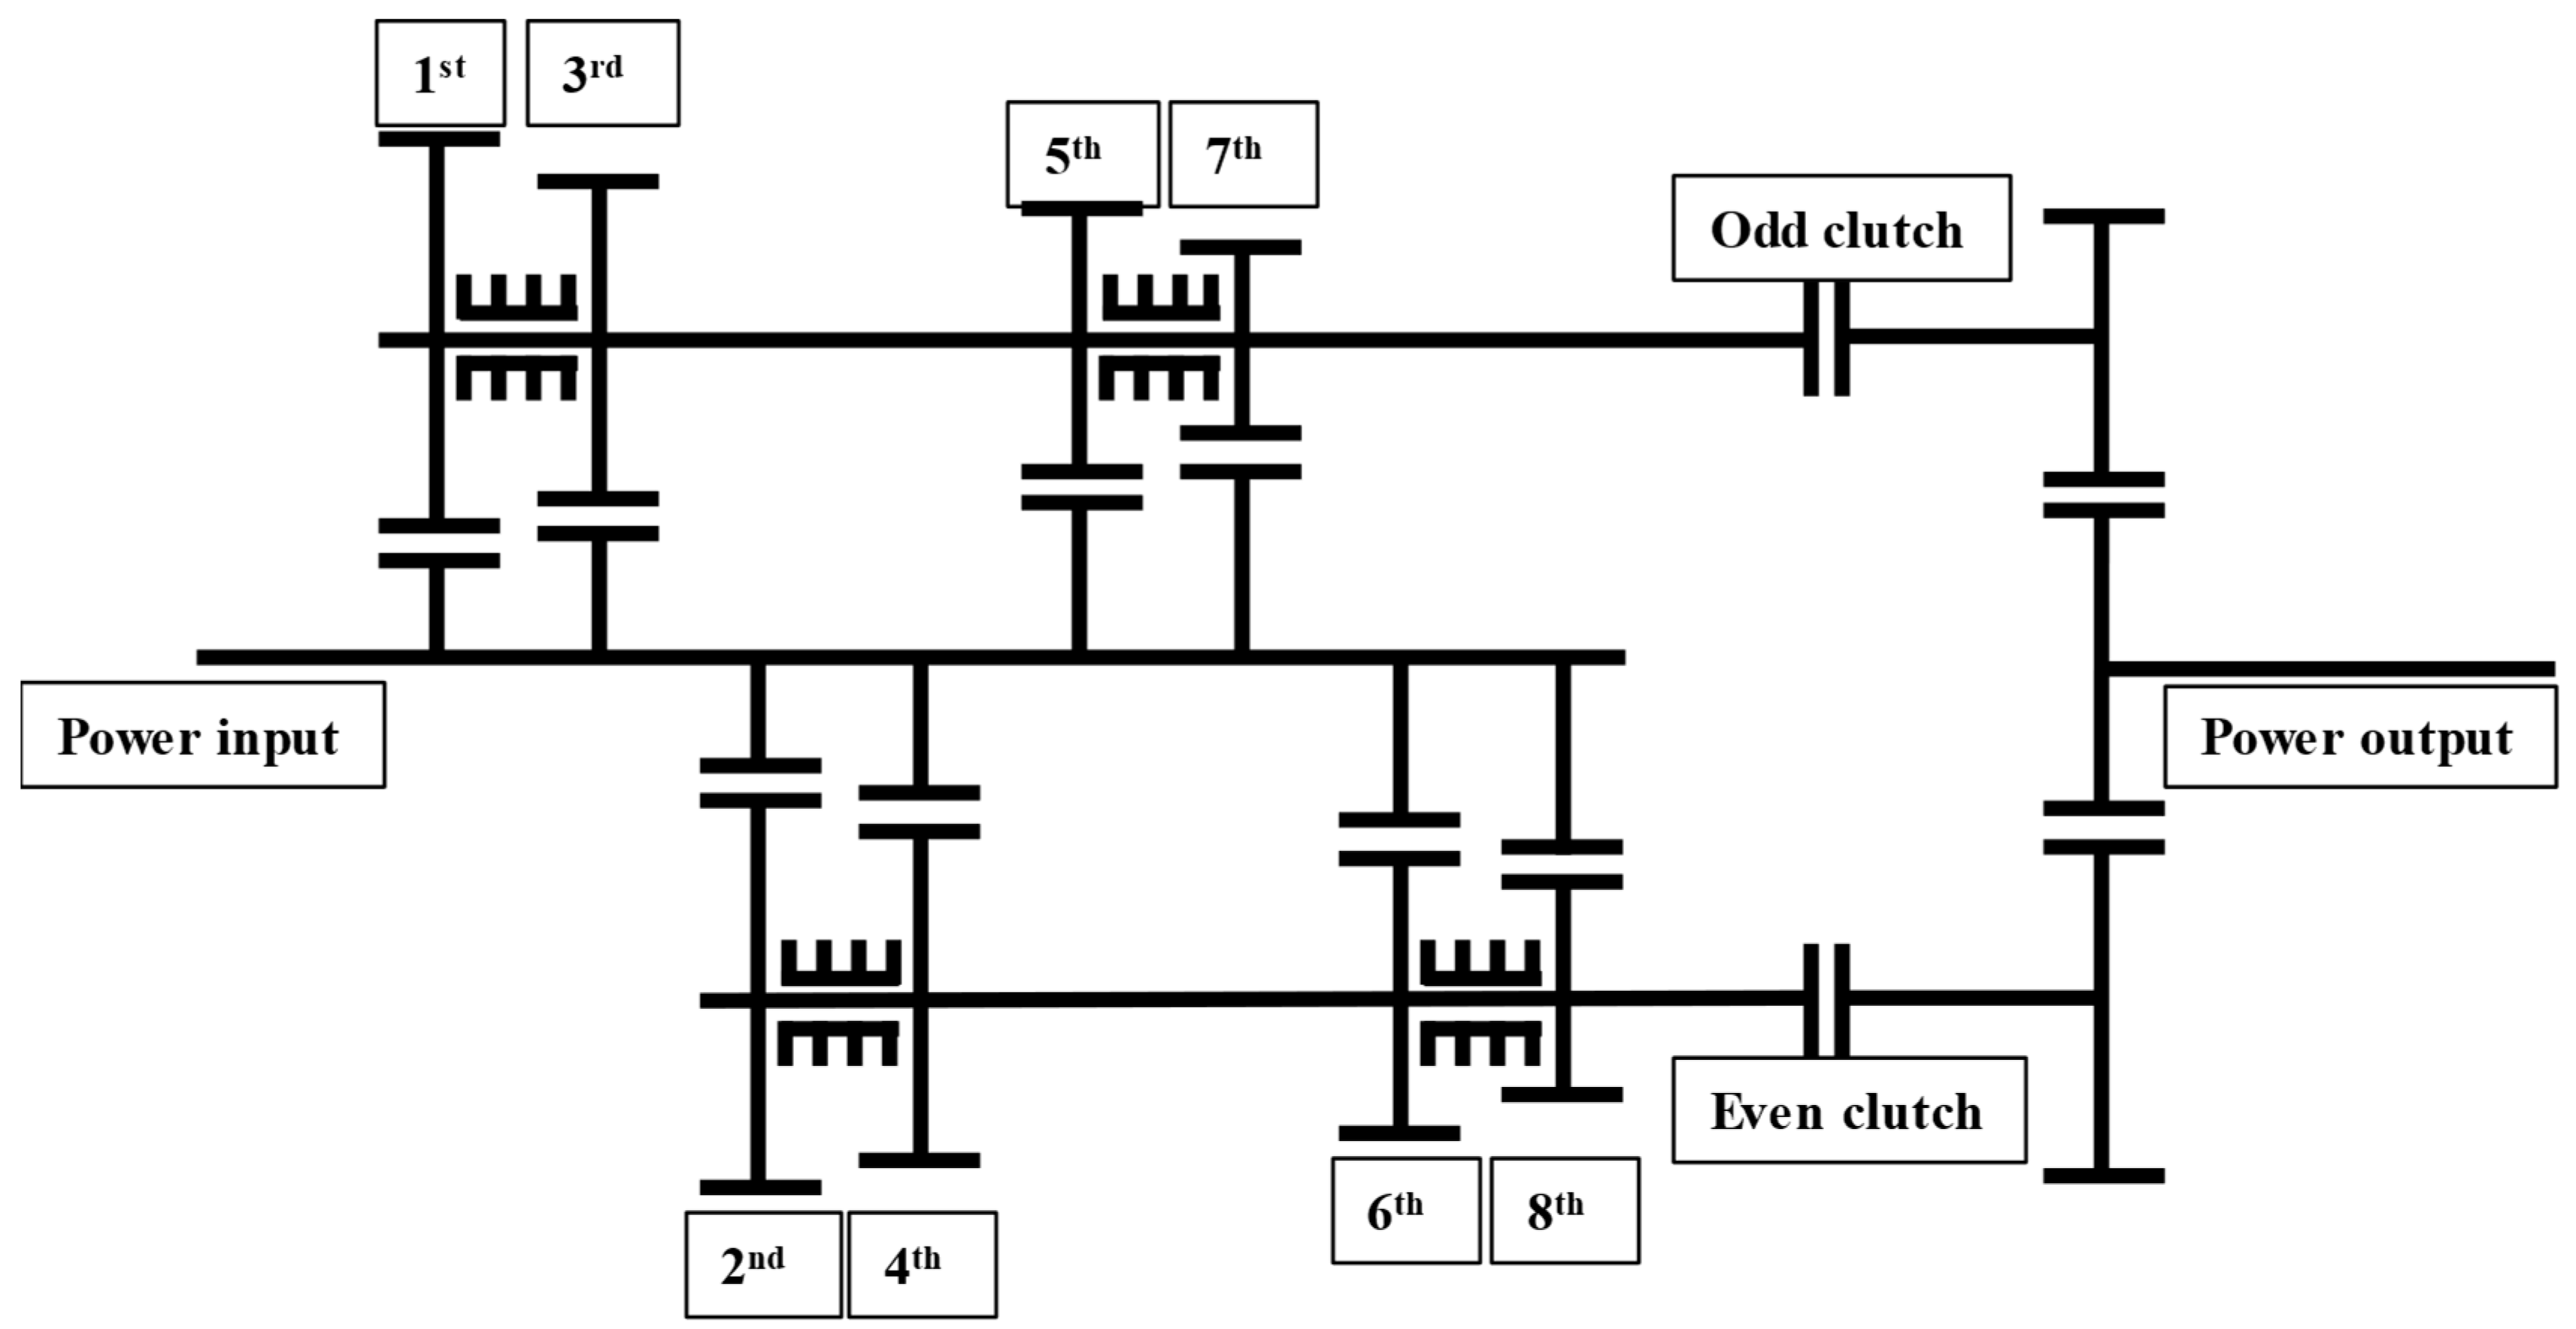
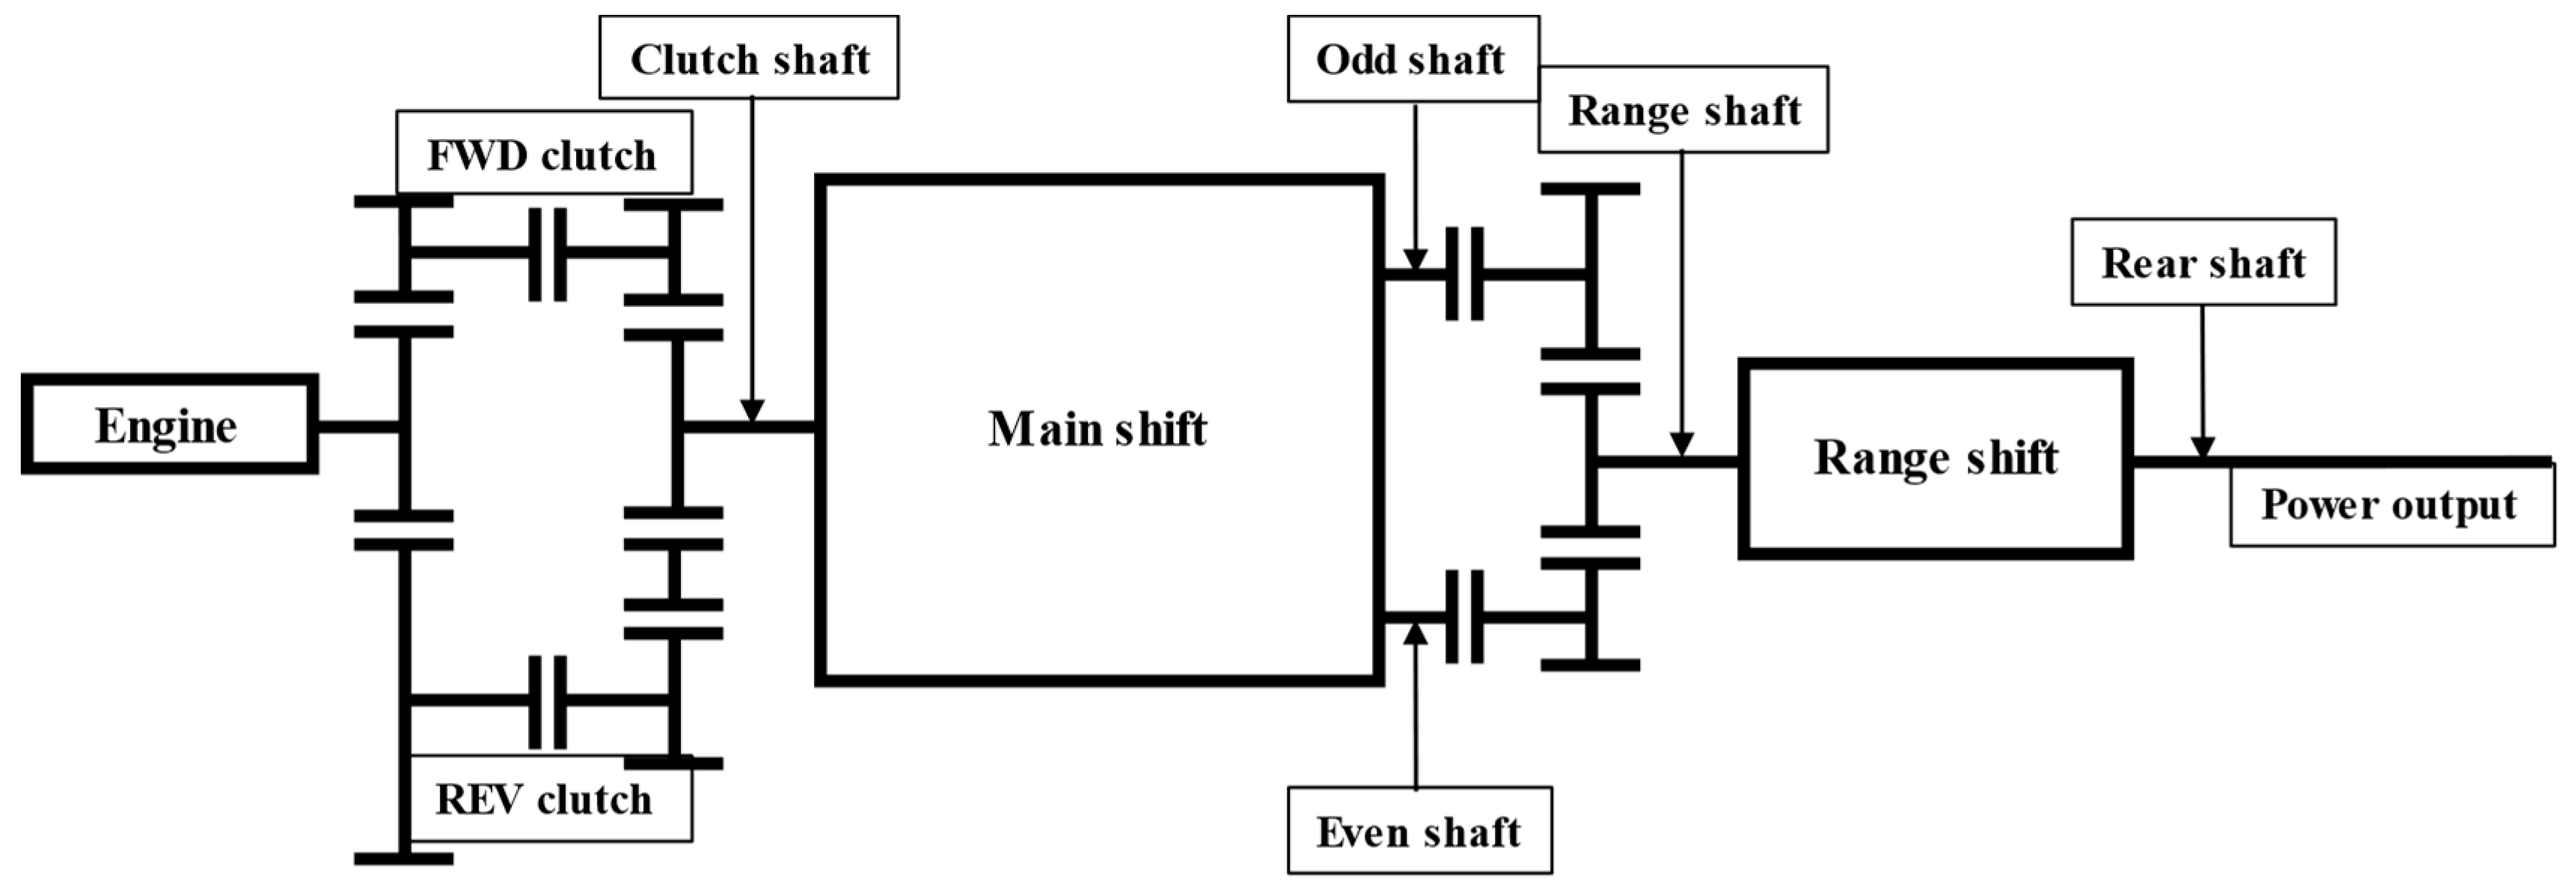
2.5. 32-Speed Transmission Modeling
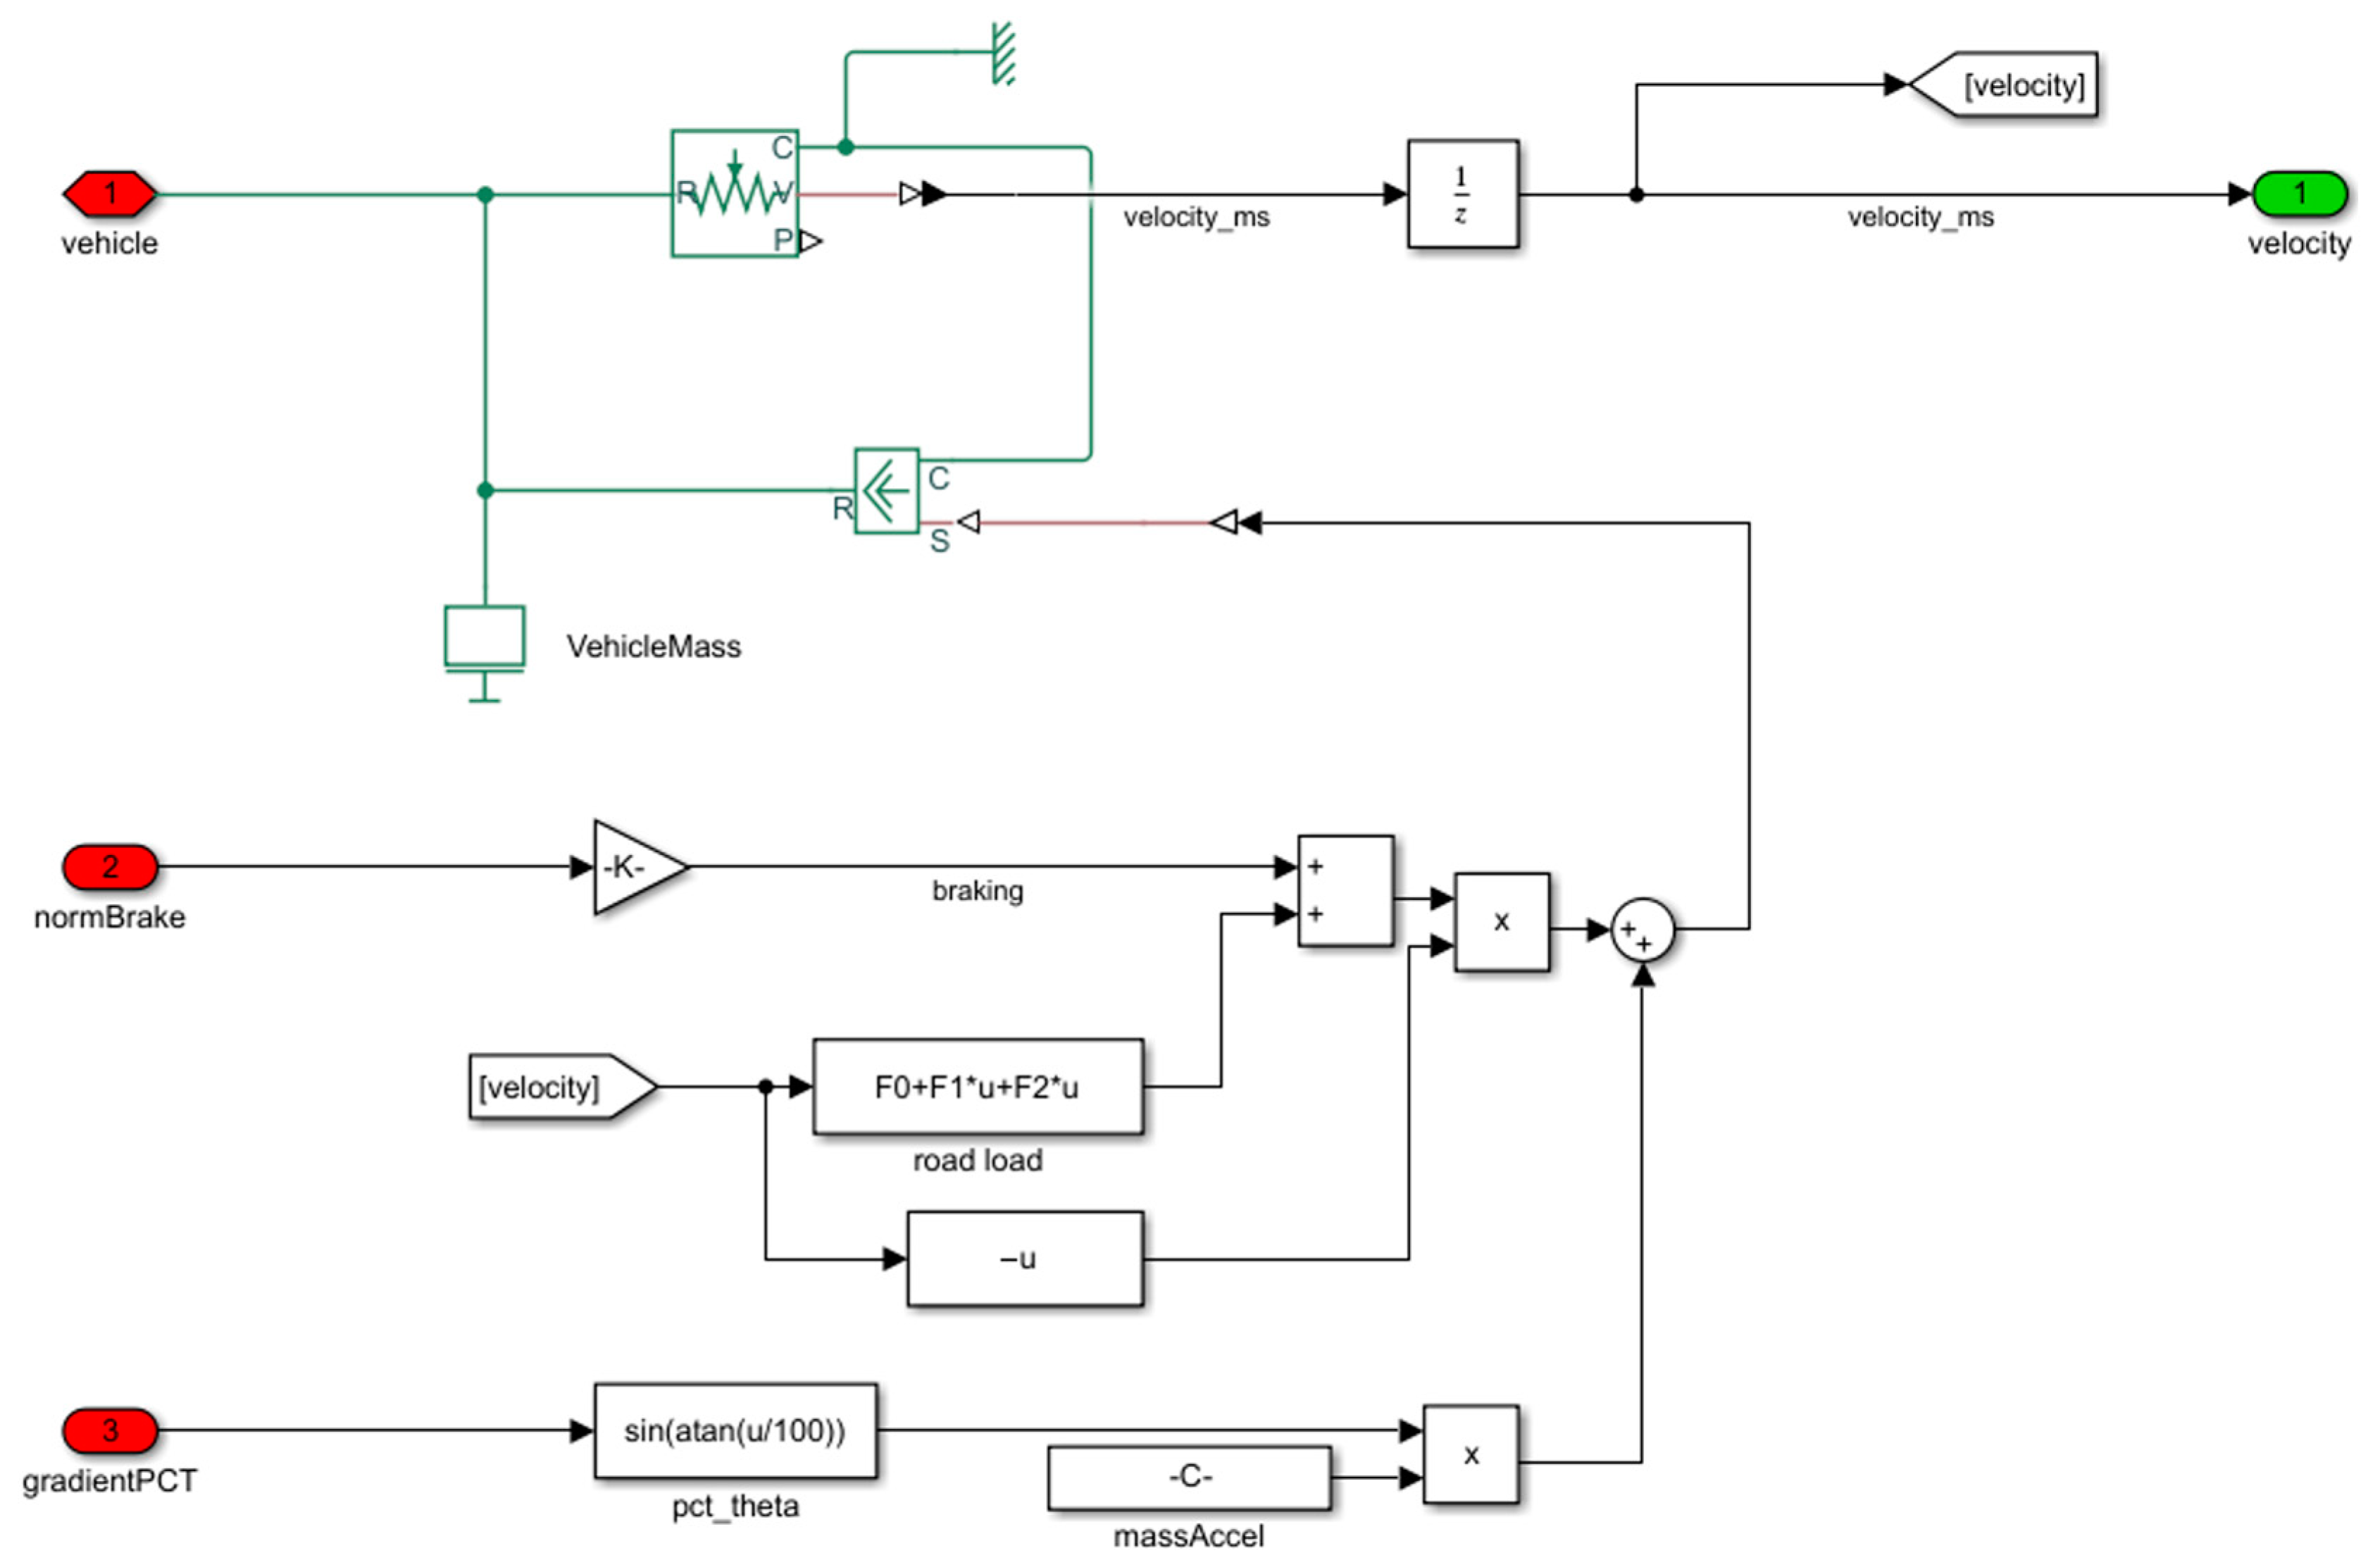
2.6. Simple Vehicle Modeling
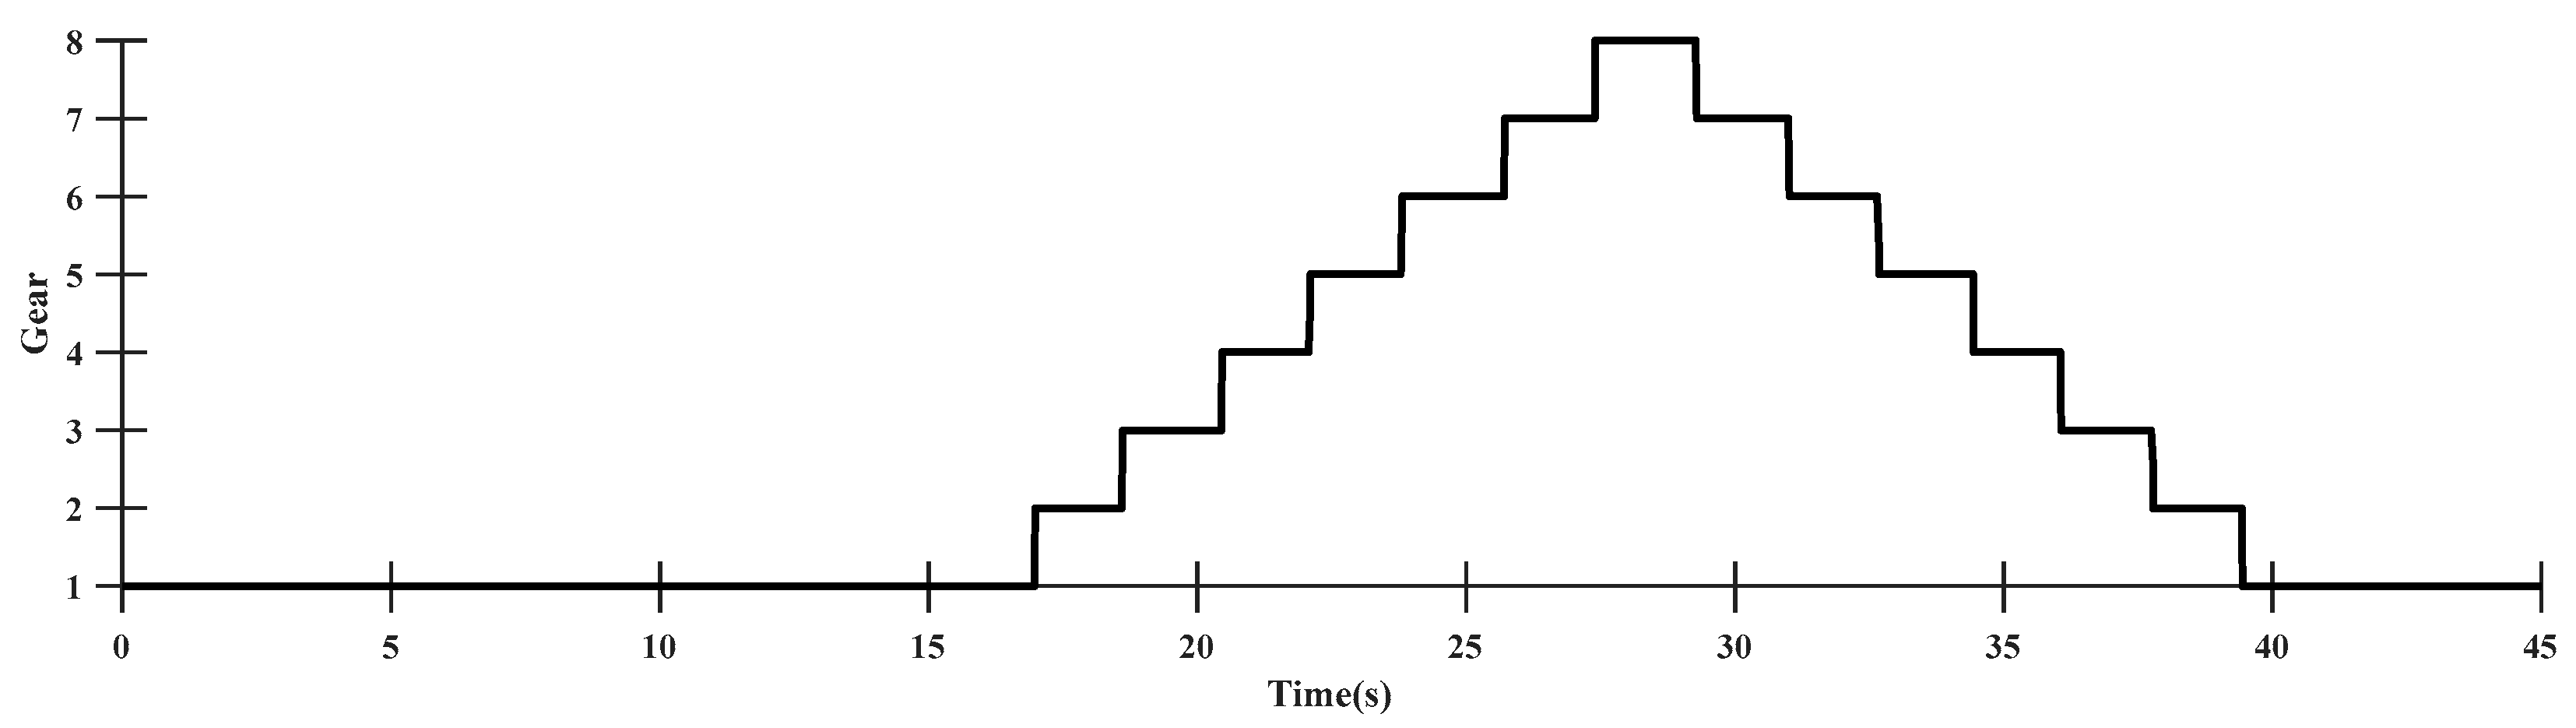
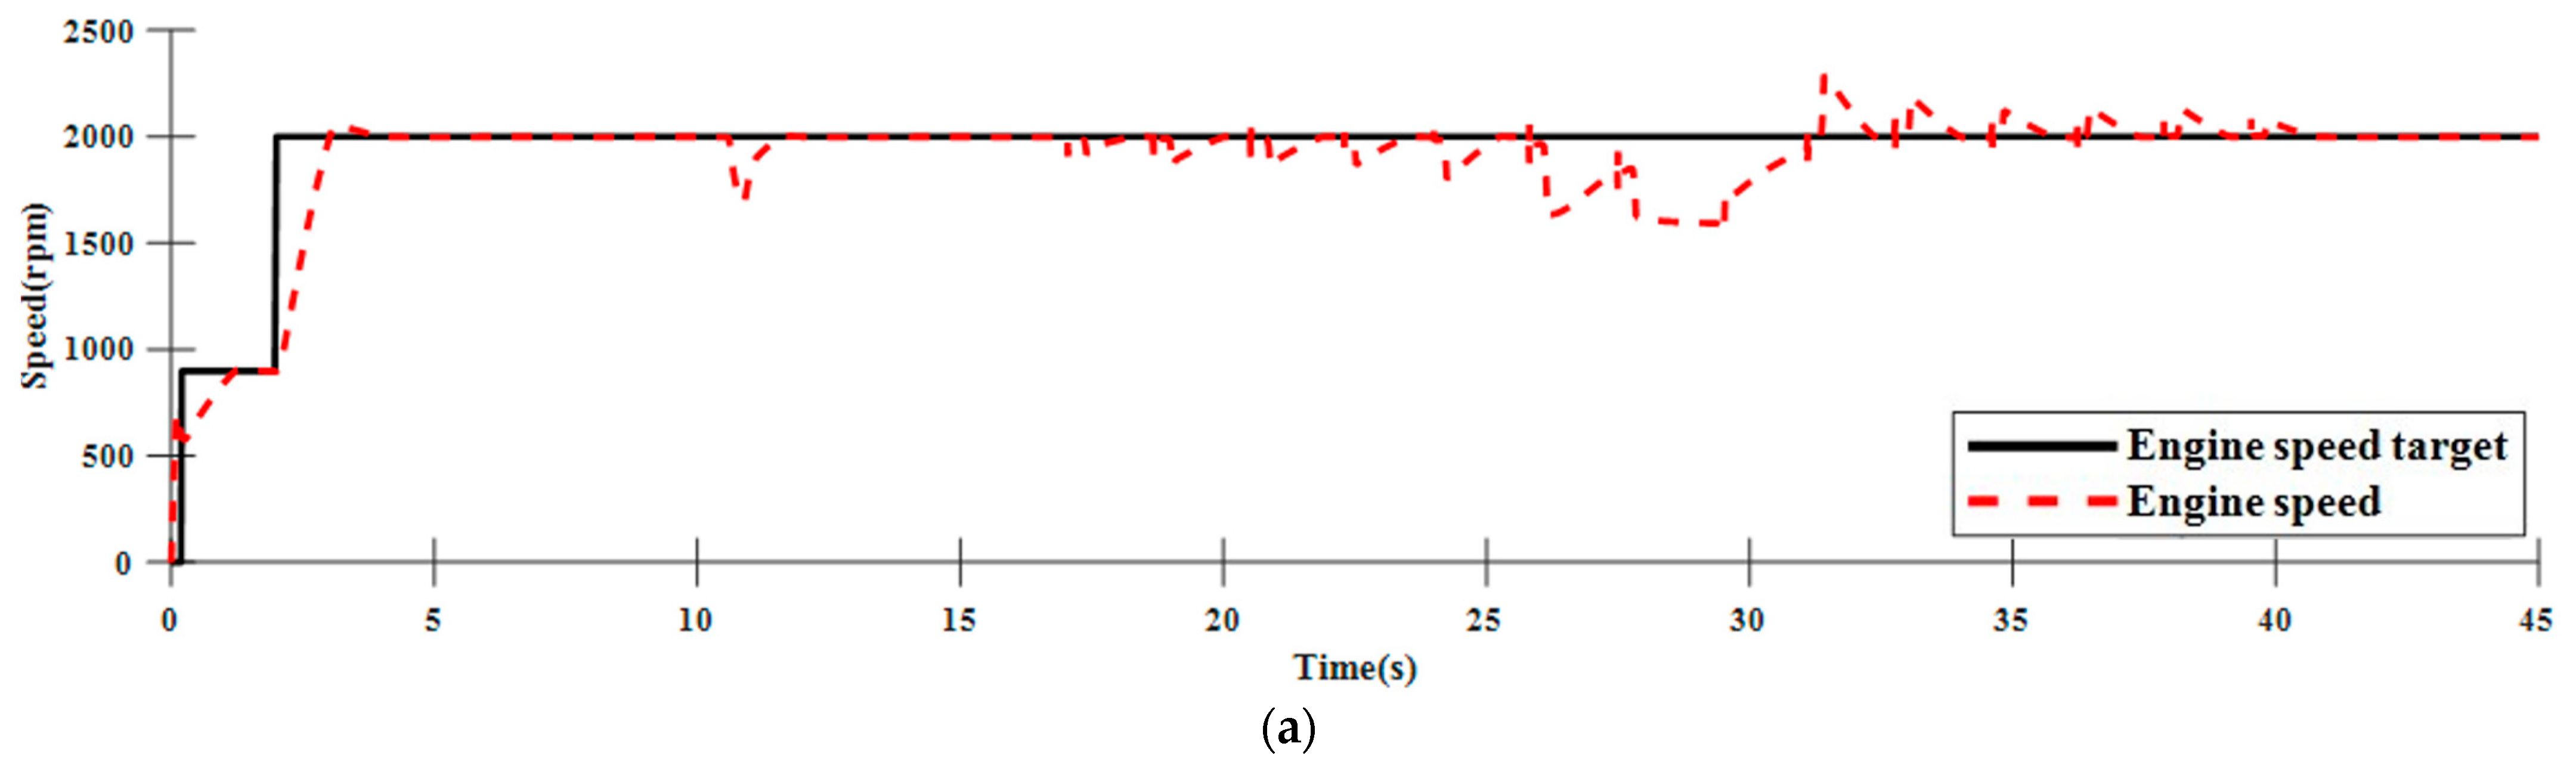
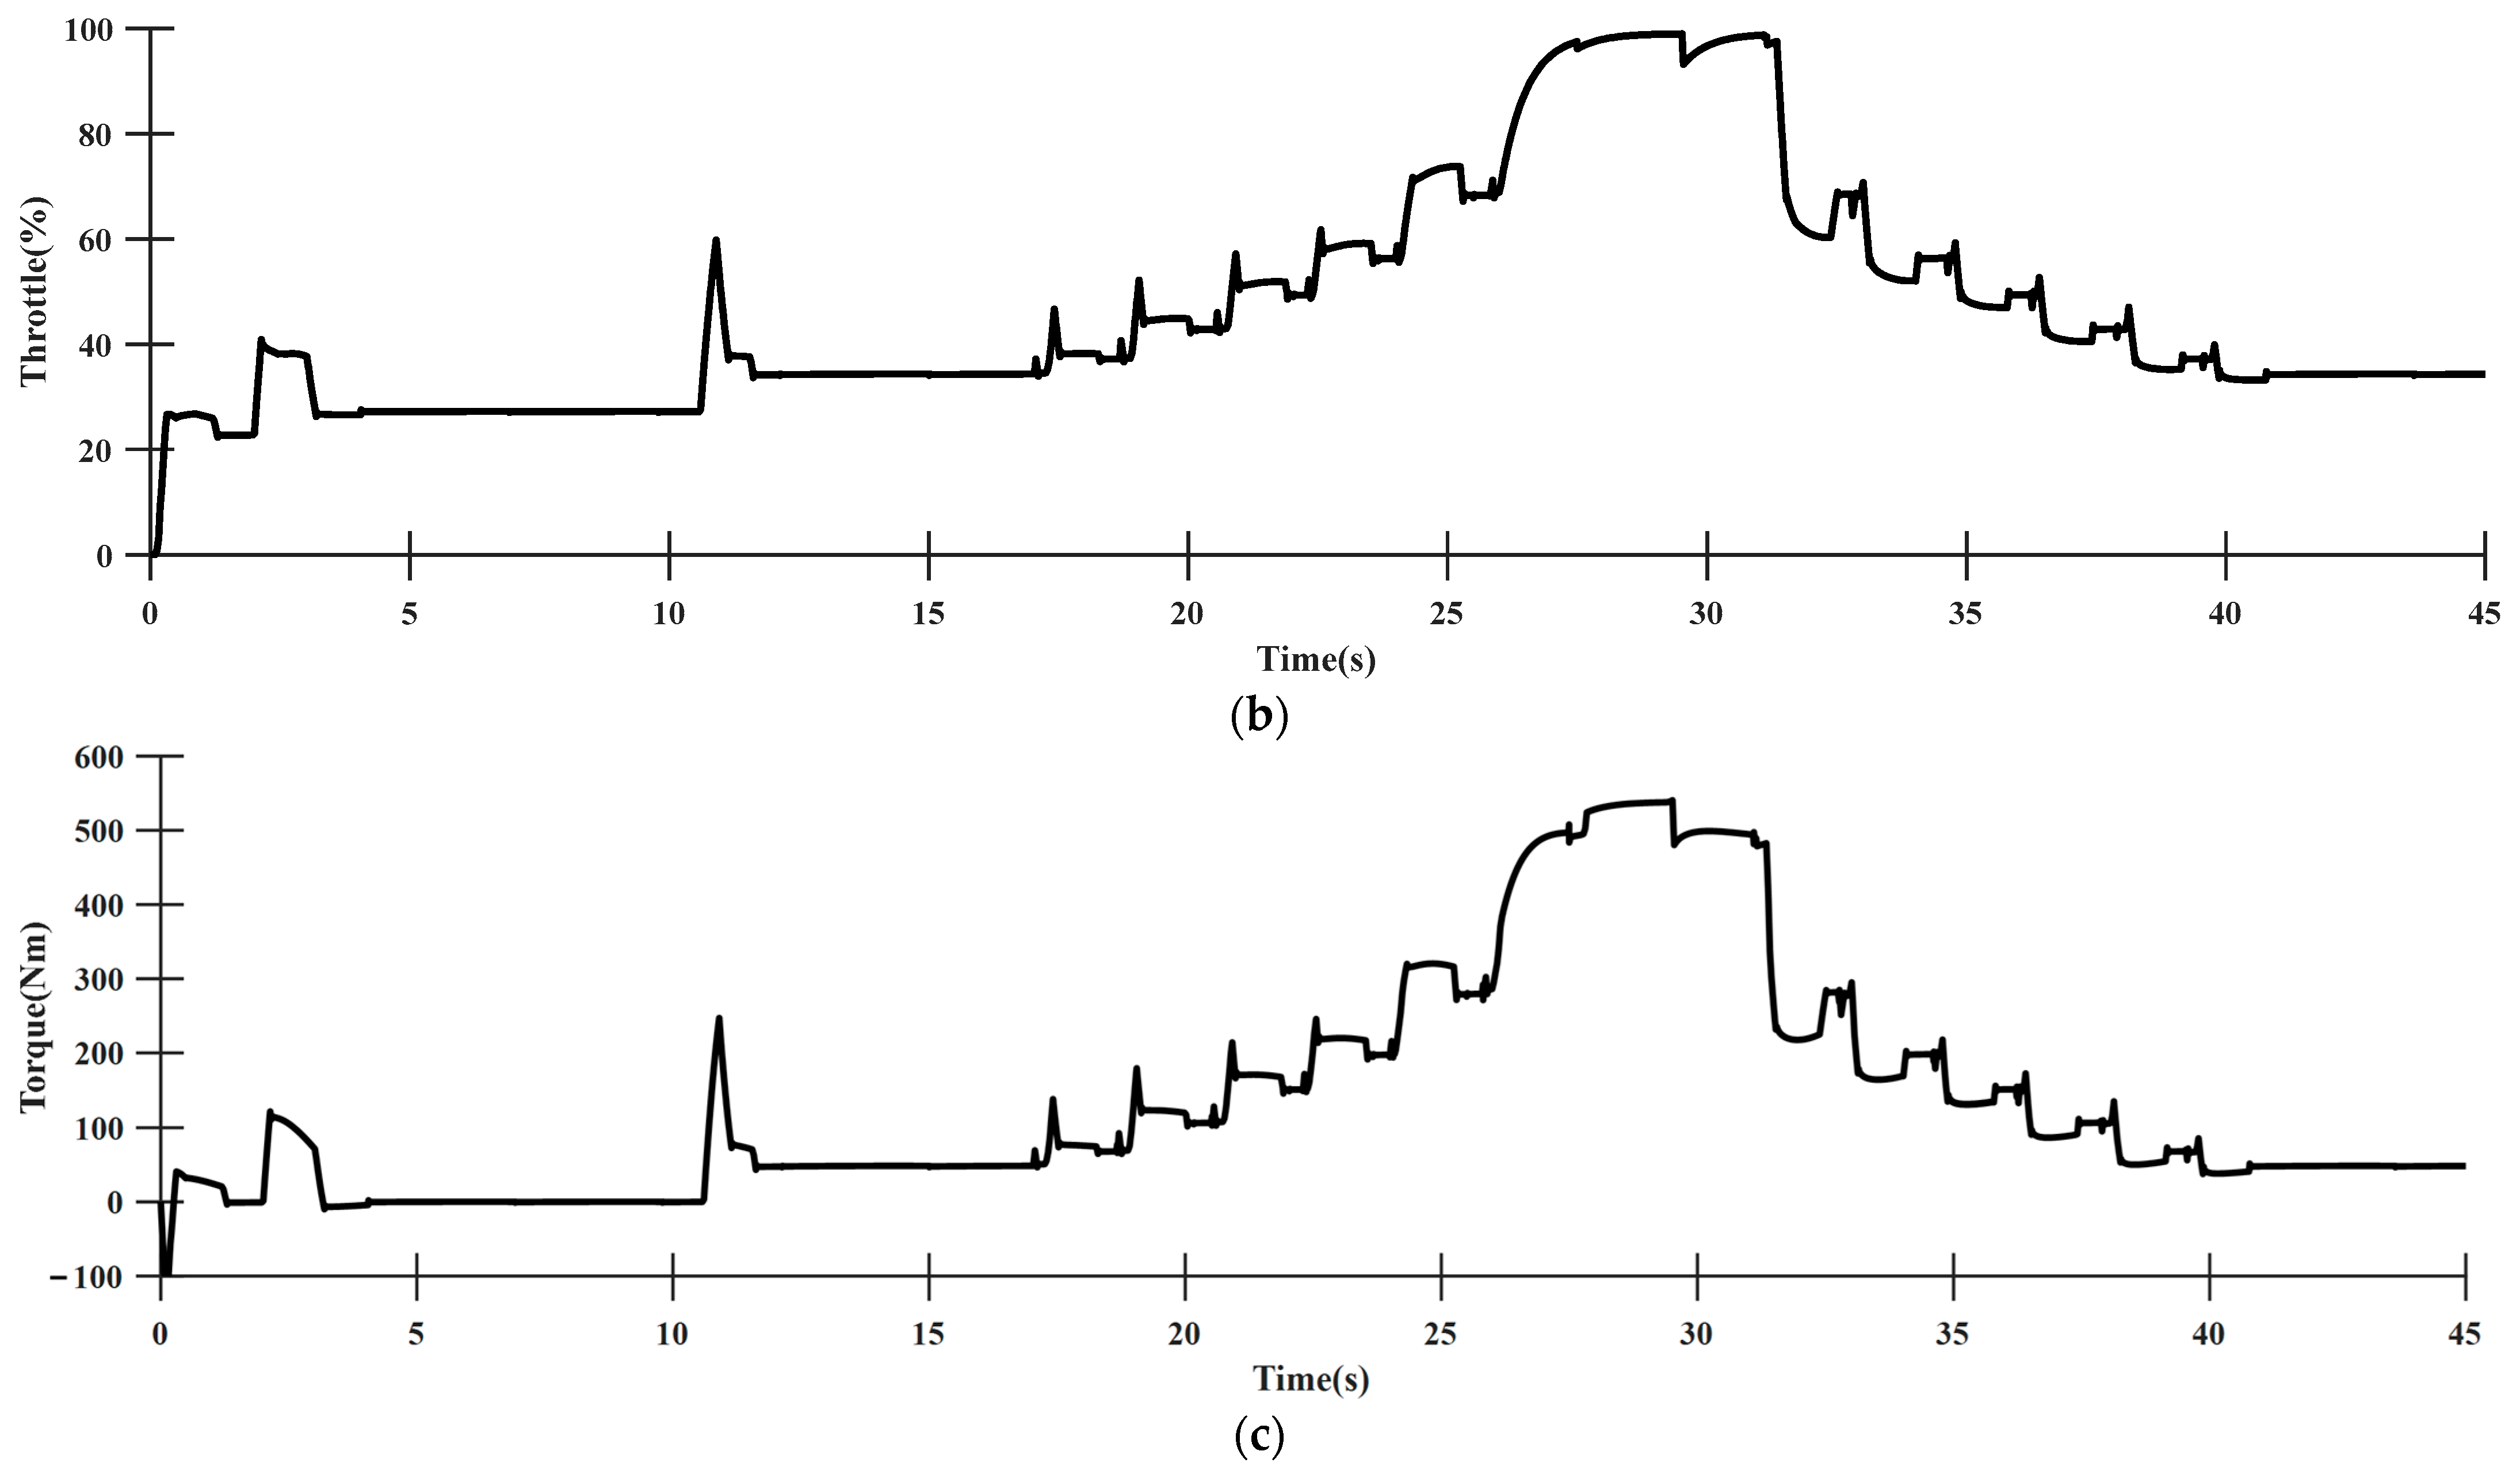
2.7. Plant Model Verification
3. Results and Discussion
4. Conclusions
Author Contributions
Funding
Institutional Review Board Statement
Data Availability Statement
Conflicts of Interest
References
- Cheng, Z.; Lu, Z. Research on the PID control of the ESP system of tractor based on improved AFSA and improved SA. Comput. Electron. Agric. 2018, 148, 142–147. [Google Scholar] [CrossRef]
- Mao, Y.; Wu, Y.; Yan, X.; Liu, M.; Xu, L. Simulation and experimental research of electric tractor drive system based on Modelica. PLoS ONE 2022, 17, e0276231. [Google Scholar] [CrossRef]
- Yiwei, W.; Xianghai, Y.; Zhili, Z. Architecture modeling and test of tractor power shift transmission. IEEE Access 2020, 9, 3517–3525. [Google Scholar] [CrossRef]
- Li, B.; Sun, D.; Hu, M.; Liu, J. Automatic starting control of tractor with a novel power-shift transmission. Mech. Mach. Theory 2019, 131, 75–91. [Google Scholar] [CrossRef]
- Baek, S.Y.; Jung, Y.J.; Ayub, S.M.A.; Nam, K.C.; Kim, T.B.; Choi, C.H.; Kim, Y.-J. Development of simulation model for electric all-wheel-drive tractor. In Proceedings of the 2019 ASABE Annual International Meeting, Boston, MA, USA, 7–10 July 2019; American Society of Agricultural and Biological Engineers: St. Joseph, MI, USA, 2019; p. 1. [Google Scholar]
- Kumar, S.; Tewari, V.K.; Bharti, C.K.; Ranjan, A. Modeling, simulation and experimental validation of flow rate of electro-hydraulic hitch control valve of agricultural tractor. Flow Meas. Instrum. 2021, 82, 102070. [Google Scholar] [CrossRef]
- Jeon, C.W.; Kim, H.J.; Yun, C.; Han, X.; Kim, J.H. Design and validation testing of a complete paddy field-coverage path planner for a fully autonomous tillage tractor. Biosyst. Eng. 2021, 208, 79–97. [Google Scholar] [CrossRef]
- Watanabe, M.; Sakai, K. Identifying tractor overturning scenarios using a driving simulator with a motion system. Biosyst. Eng. 2021, 210, 261–270. [Google Scholar] [CrossRef]
- Mocera, F. A model-based design approach for a parallel hybrid electric tractor energy management strategy using hardware in the loop technique. Vehicles 2020, 3, 1–19. [Google Scholar] [CrossRef]
- Bélanger, J.; Venne, P.; Paquin, J.N. The what, where and why of real-time simulation. Planet Rt 2010, 1, 25–29. [Google Scholar]
- Ruan, S.; Ma, Y.; Yang, N.; Xiang, C.; Li, X. Real-time energy-saving control for HEVs in car-following scenario with a double explicit MPC approach. Energy 2022, 247, 123265. [Google Scholar] [CrossRef]
- Tamás, G.; Fodorean, D. Model in the loop simulation of an electric propulsion system using virtual reality. In Proceedings of the 2017 52nd International Universities Power Engineering Conference (UPEC), Heraklion, Greece, 28–31 August 2017. [Google Scholar]
- Moten, S.; Celiberti, F.; Grottoli, M.; van der Heide, A.; Lemmens, Y. X-in-the-loop advanced driving simulation platform for the design, development, testing and validation of ADAS. In 2018 IEEE Intelligent Vehicles Symposium (IV); IEEE: Piscataway, NJ, USA, 2018. [Google Scholar]
- Abdelrahman, A.S.; Algarny, K.S.; Youssef, M.Z. A novel platform for powertrain modeling of electric cars with experimental validation using real-time hardware in the loop (HIL): A case study of GM second generation Chevrolet volt. IEEE Trans. Power Electron. 2018, 33, 9762–9771. [Google Scholar] [CrossRef]
- Aksjonov, A.; Ricciardi, V.; Augsburg, K.; Vodovozov, V.; Petlenkov, E. Hardware-in-the-loop test of an open-loop fuzzy control method for decoupled electrohydraulic antilock braking system. IEEE Trans. Fuzzy Syst. 2020, 29, 965–975. [Google Scholar] [CrossRef]
- Parra, A.; Rodriguez, A.J.; Zubizarreta, A.; Perez, J. Validation of a real-time capable multibody vehicle dynamics formulation for automotive testing frameworks based on simulation. IEEE Access 2020, 8, 213253–213265. [Google Scholar] [CrossRef]
- Moreno, I.J.; Ouardani, D.; Chaparro-Arce, D.; Cardenas, A. Real-Time Hardware-in-the-Loop Emulation of Path Tracking in Low-Cost Agricultural Robots. Vehicles 2023, 5, 894–913. [Google Scholar] [CrossRef]
- Liu, Y.; Huang, B.; Yang, Y.; Lei, Z.; Zhang, Y.; Chen, Z. Hierarchical speed planning and energy management for autonomous plug-in hybrid electric vehicle in vehicle-following environment. Energy 2022, 260, 125212. [Google Scholar] [CrossRef]
- Yang, B.; Guo, L.; Ye, J. Real-time simulation of electric vehicle powertrain: Hardware-in-the-loop (HIL) testbed for cyber-physical security. In Proceedings of the 2020 IEEE Transportation Electrification Conference & Expo (ITEC), Chicago, IL, USA, 23–26 June 2020; IEEE: Piscataway, NJ, USA, 2020; pp. 63–68. [Google Scholar]
- Shen, W.; Zhang, Q.; Chen, Z.; Mao, W.; Li, Y. Testing and analysis of automotive gearshift performance based on gear shift analysis. Eng. Rep. 2021, 3, e12324. [Google Scholar] [CrossRef]
- Wu, P.; Qiang, P.; Pan, T.; Zang, H. Multi-objective optimization of gear ratios of a seamless three-speed automated manual transmission for electric vehicles considering shift performance. Energies 2022, 15, 4149. [Google Scholar] [CrossRef]
- He, B.; Chen, Y.; Wei, Q.; Wang, C.; Wei, C.; Li, X. Performance Comparison of Pure Electric Vehicles with Two-Speed Transmission and Adaptive Gear Shifting Strategy Design. Energies 2023, 16, 3007. [Google Scholar] [CrossRef]
- Park, J.; Choi, S. Gear shifting based on MIMO model predictive control for convenient adjustment of shifting performance. IEEE Trans. Veh. Technol. 2021, 71, 233–249. [Google Scholar] [CrossRef]
- Schmiedt, M.; He, P.; Rinderknecht, S. Target state optimization: Drivability improvement for vehicles with dual clutch transmissions. Appl. Sci. 2022, 12, 10283. [Google Scholar] [CrossRef]
- Huang, W.; Zhang, J.; Huang, J.; Yin, C.; Wang, L. Optimal speed regulation control of the hybrid dual clutch transmission shift process. World Electr. Veh. J. 2020, 11, 11. [Google Scholar] [CrossRef]
- Milindar, S.D.; Prasanna, S.; Baskar, P. Comprehensive review on dual clutch transmission. Int. J. Veh. Perform. 2022, 8, 74–108. [Google Scholar] [CrossRef]
- Li, A.; Qin, D. Adaptive model predictive control of dual clutch transmission shift based on dynamic friction coefficient estimation. Mech. Mach. Theory 2022, 173, 104804. [Google Scholar] [CrossRef]
- Guo, J.; Zhang, Y. Adaptive Starting Control Strategy for Hybrid Electric Vehicles Equipped with a Wet Dual-Clutch Transmission. Actuators 2023, 12, 123. [Google Scholar] [CrossRef]
- Song, X.; Liu, J.; Smedley, D. Simulation study of dual clutch transmission for medium duty truck applications. SAE Int. J. Commer. Veh. 2005, 114, 264–270. [Google Scholar]
- Galvagno, E.; Velardocchia, M.; Vigliani, A. Dynamic and kinematic model of a dual clutch transmission. Mech. Mach. Theory 2011, 46, 794–805. [Google Scholar] [CrossRef]


| Item | Specification |
|---|---|
| Model | DCT type tractor |
| Power | 105 kW |
| Rated engine speed | 2300 RPM |
| Max engine torque | 600 Nm |
| Mass | 5000 kg |
| Rear wheel radius | 0.835 m |
| Speed | 0~40 km/h |
| Input Signal | Description |
|---|---|
| Norm brake | Brake torque by brake pedal |
| Gradient | Gradient of the ground |
| Upshift | Driver pressing the upshift button |
| Downshift | Driver pressing the downshift button |
| Oil temperature | Oil temperature of hydraulic system |
| System pressure | System pressure of the hydraulic system |
| Input Signal | Description |
|---|---|
| Sync1 current | Synchronizer pressure control valve (PCV) 1 control current |
| Sync2 current | Synchronizer PCV 2 control current |
| Sync3 current | Synchronizer PCV 3 control current |
| Sync4 current | Synchronizer PCV 4 control current |
| Sync5 current | Synchronizer PCV 5 control current |
| Sync6 current | Synchronizer PCV 6 control current |
| Sync7 current | Synchronizer PCV 7 control current |
| Sync8 current | Synchronizer PCV 8 control current |
| Creep | Creep shift dog clutch control signal |
| Low | Low shift dog clutch control signal |
| Middle | Middle shift dog clutch control signal |
| High | High shift dog clutch control signal |
| FWD clutch current | Forward clutch PCV control current |
| REV clutch current | Reverse clutch PCV control current |
| Odd clutch current | Odd clutch PCV control current |
| Even clutch current | Even clutch PCV control current |
| Key | Engine key mode |
| Target speed | Engine target speed |
| Output Signal | Description |
|---|---|
| Engine throttle | Throttle output from the engine model |
| Engine speed | Speed output from the engine model |
| Engine torque | Torque output from the engine model |
| Friction torque | Engine friction torque output from the engine model |
| Clutch pressure | Clutch pressure output from the Hydraulic control unit (HCU) model |
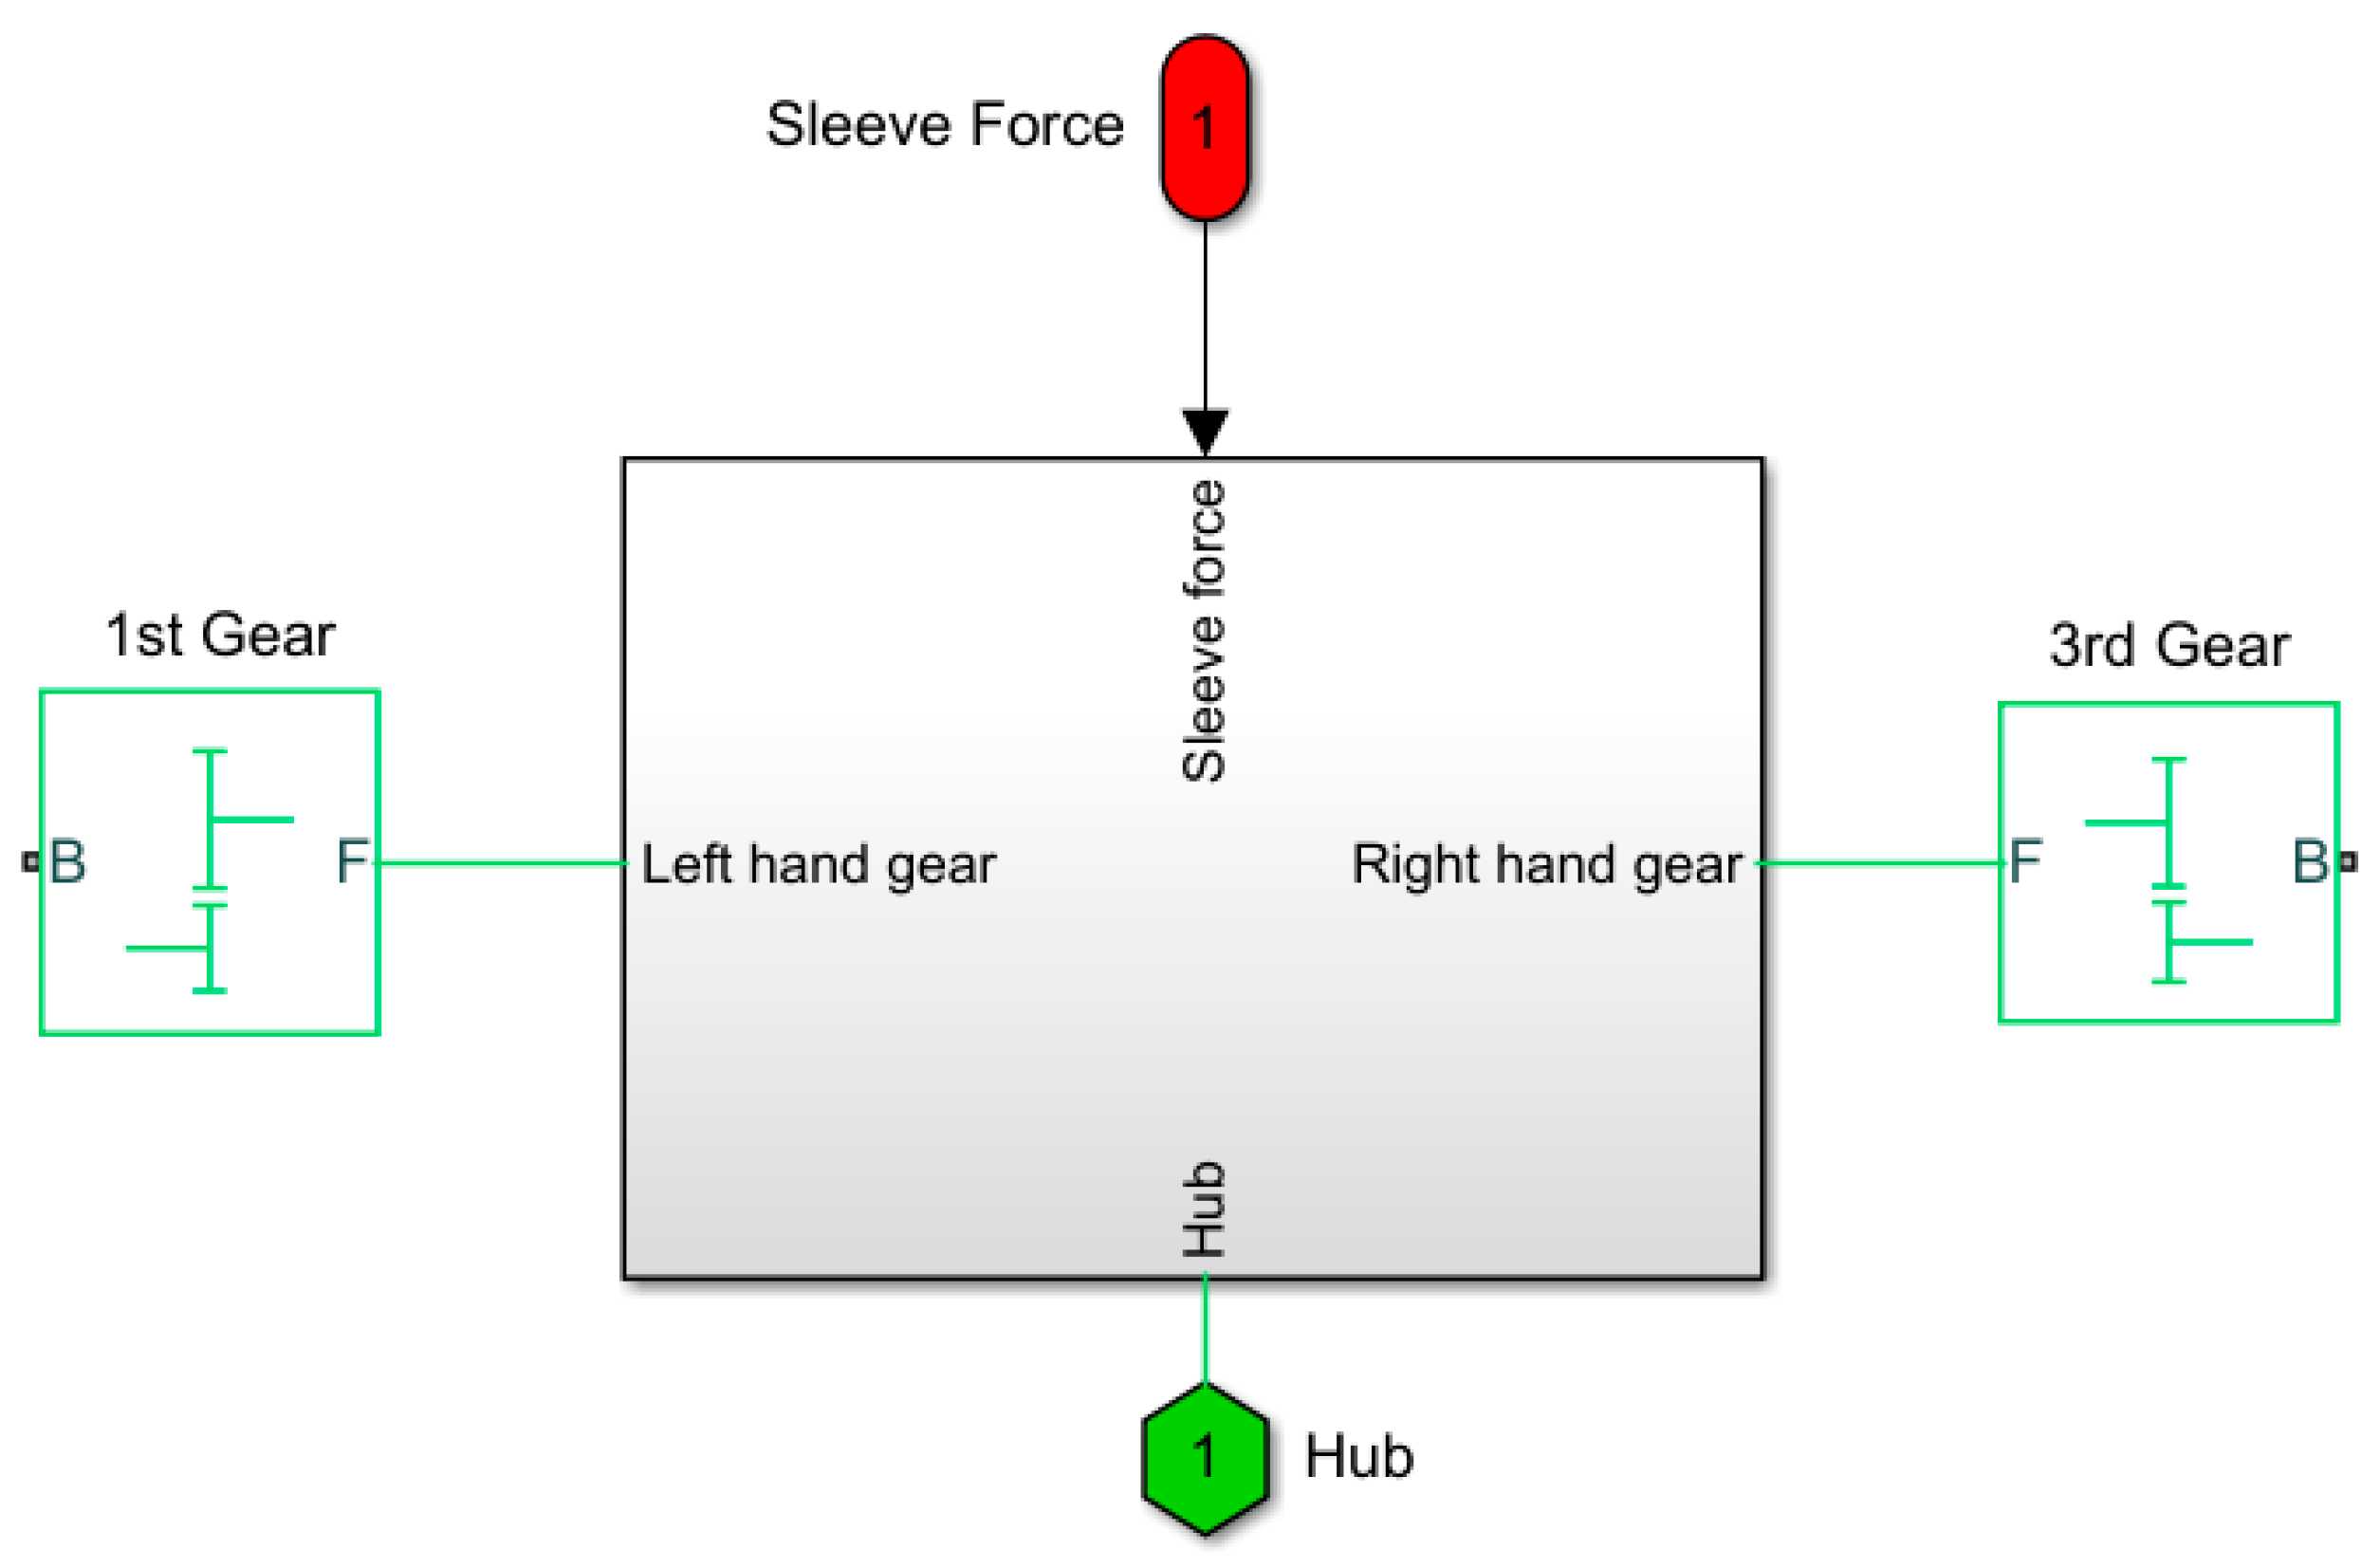
| Sleeve force | Synchronizer actuator sleeve force output from the HCU model |
| Sleeve position | Synchronizer actuator sleeve position output from the 32-speed transmission model |
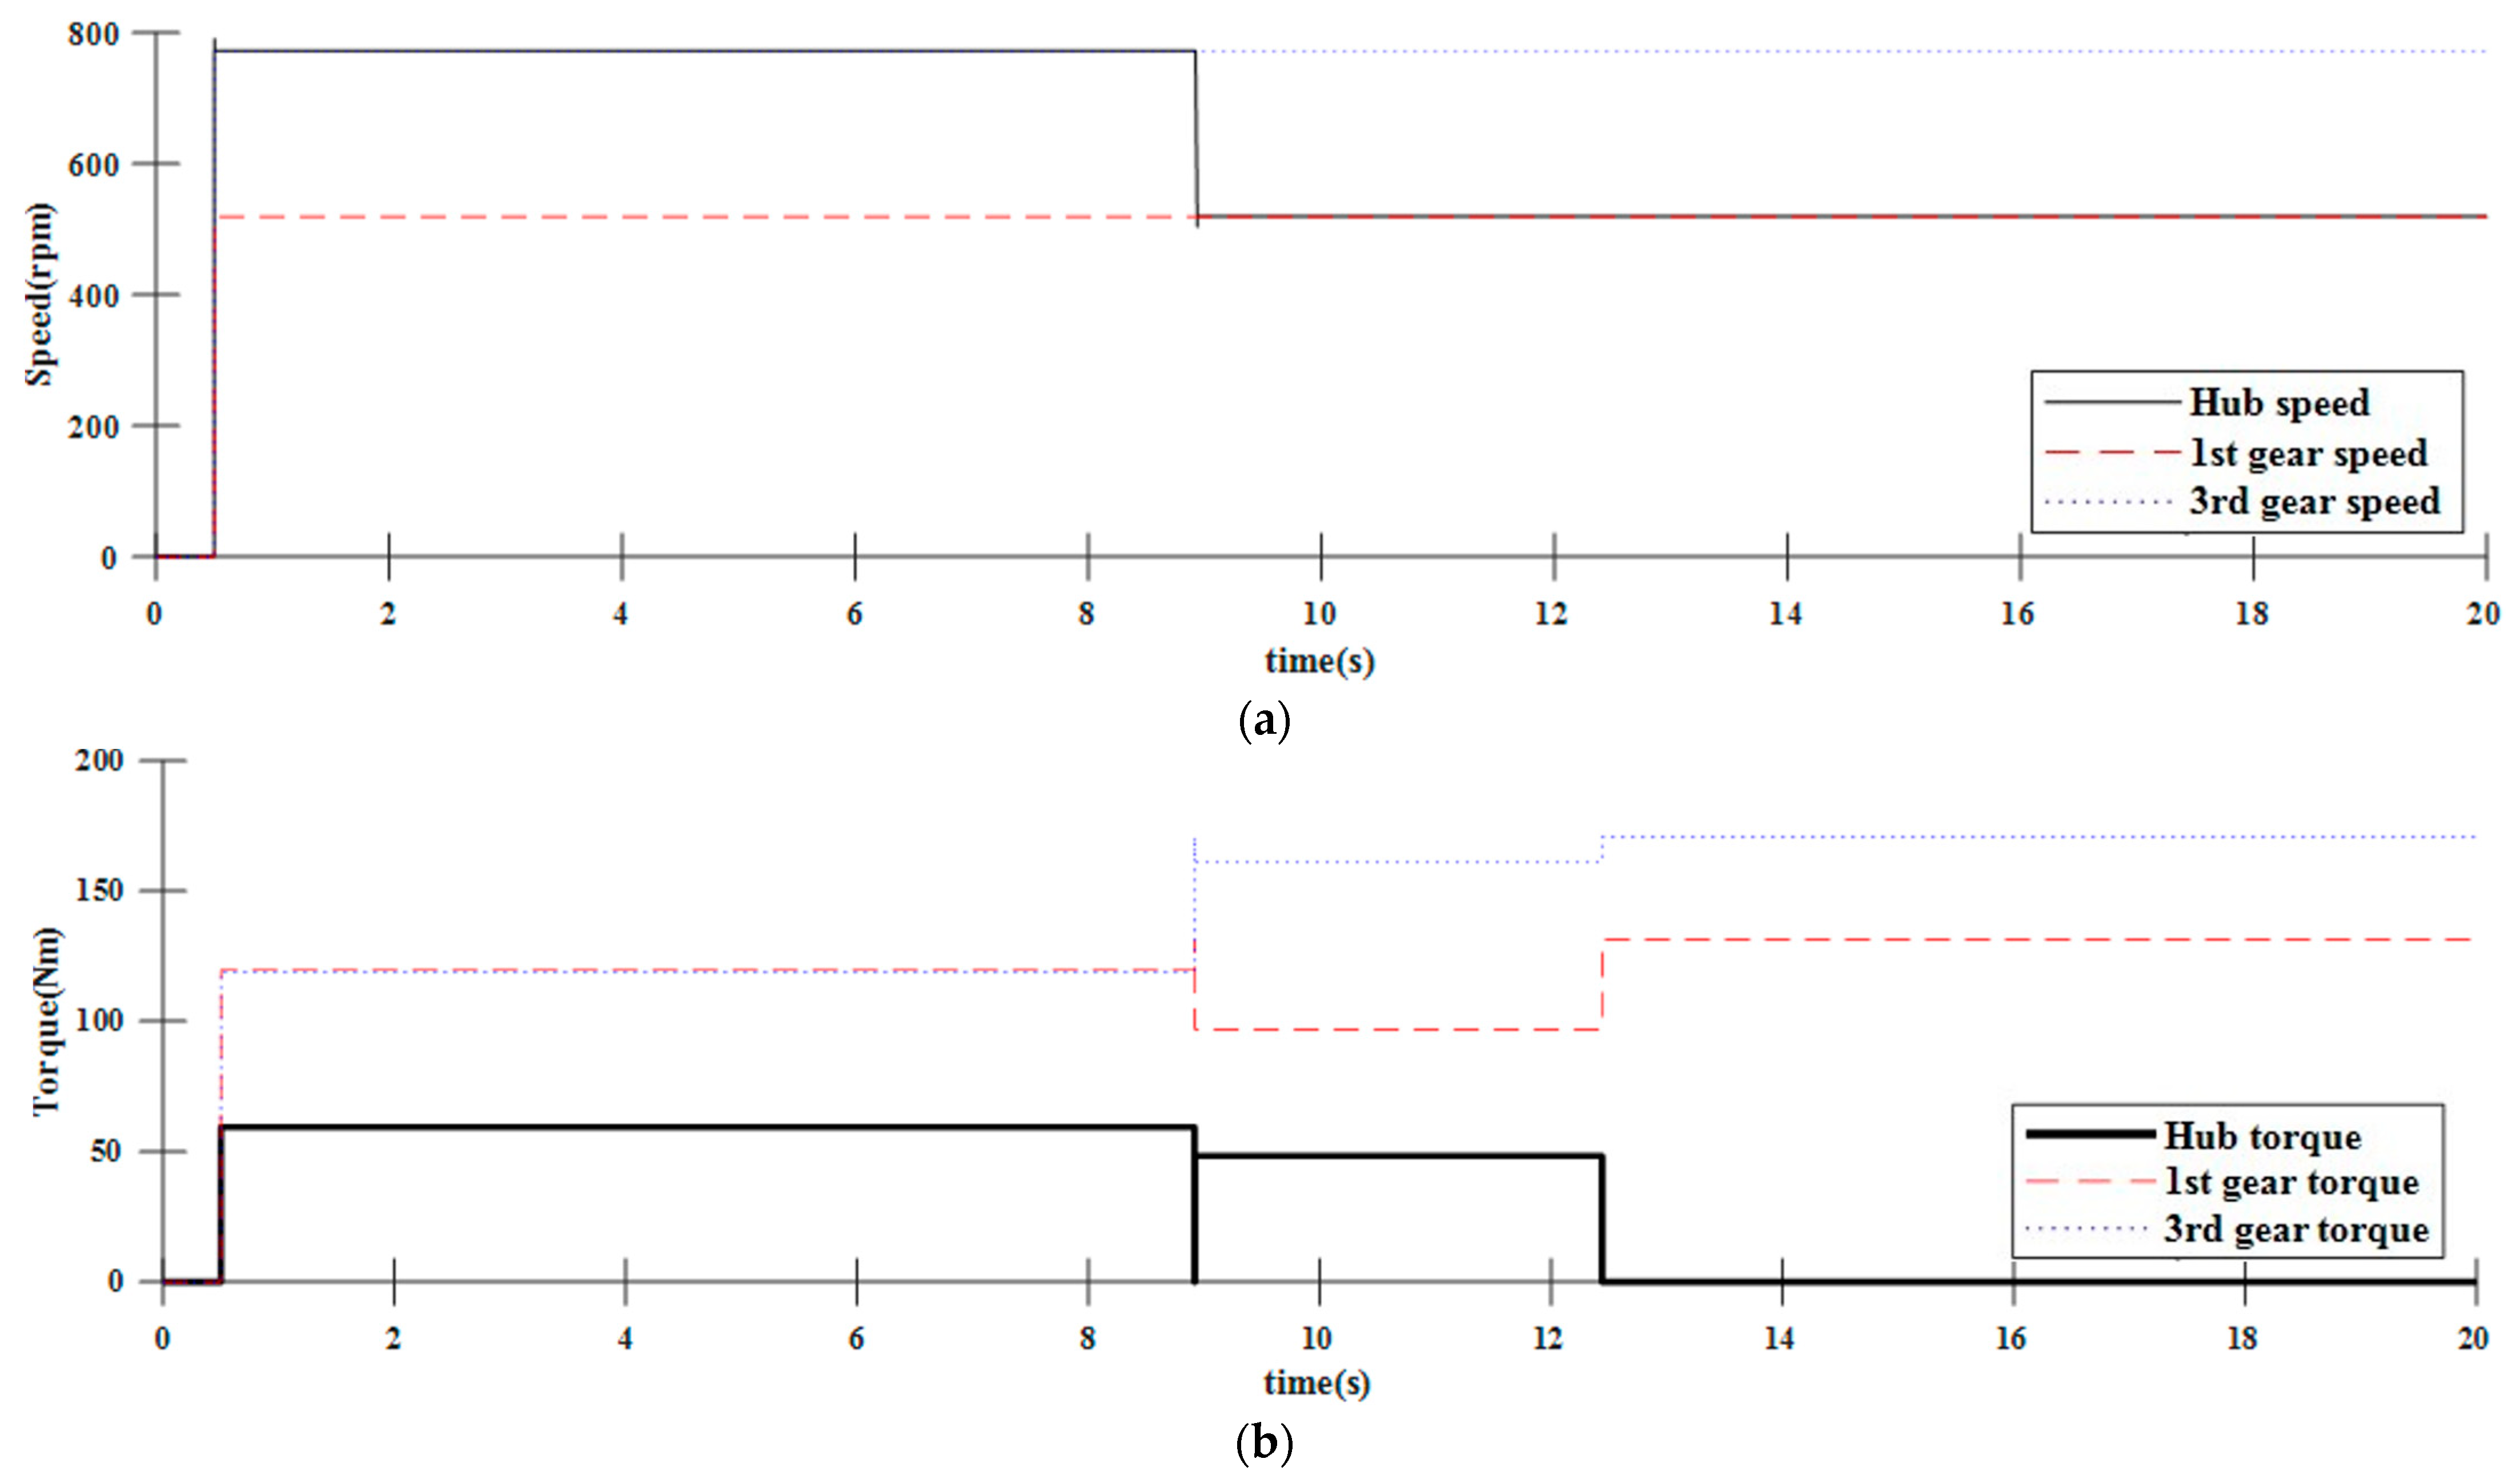
| Shaft speed | Shaft speed output from the 32-speed transmission model |
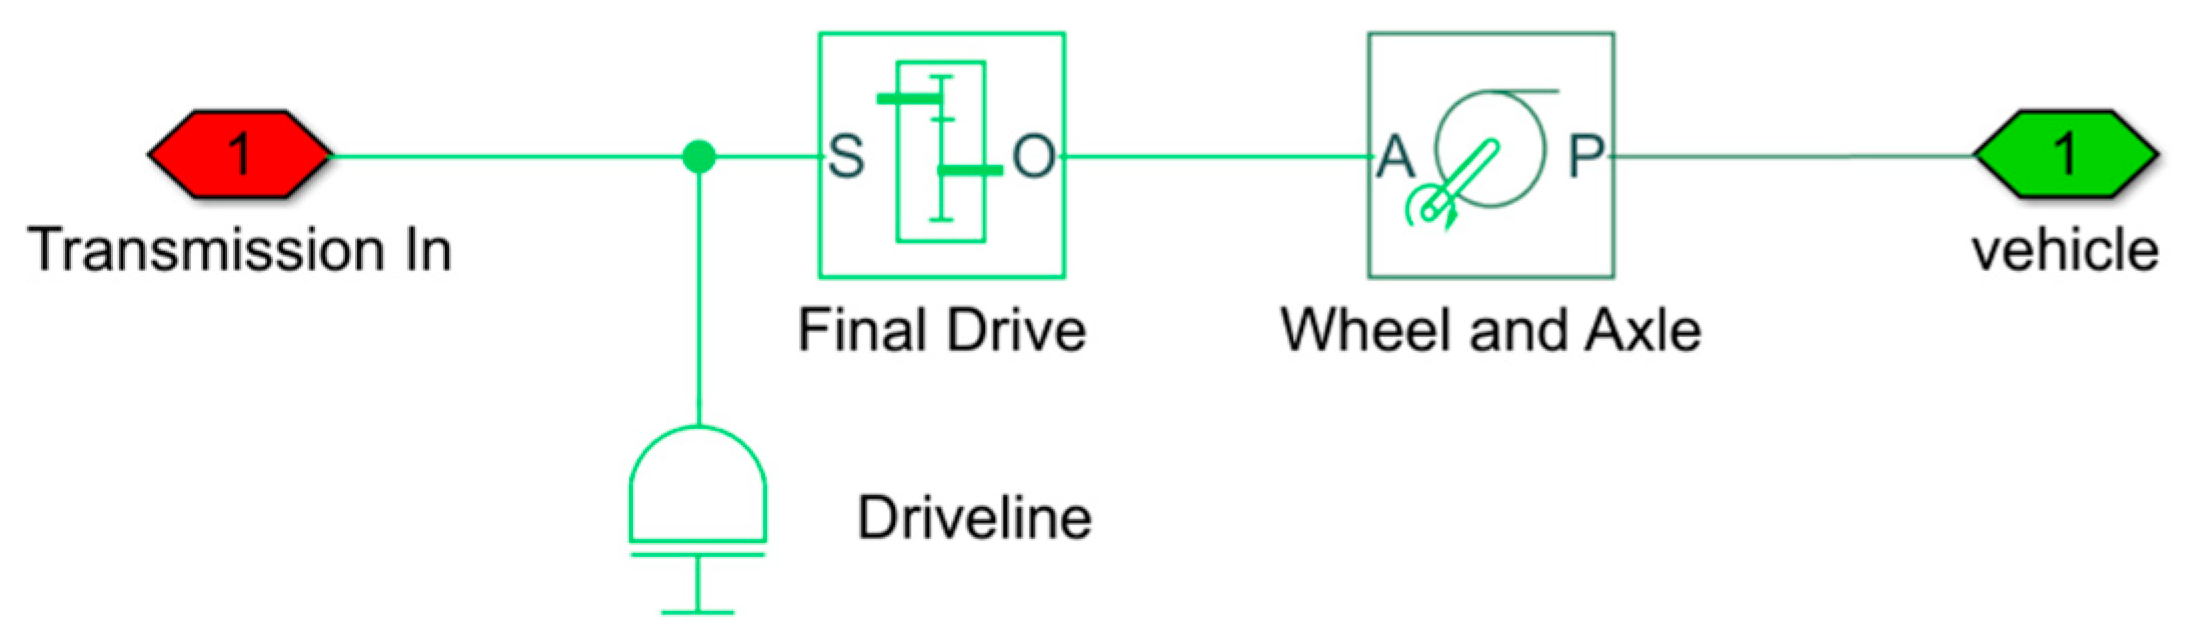
| Vehicle speed | Vehicle speed output from the simple vehicle model |
| Final drive speed | Final drive speed output from the simple vehicle model |
| ●: Engaged | 1 | 2 | 3 | 4 | 5 | 6 | 7 | 8 | 9 | 10 | 11 | 12 | 13 | 14 | 15 | 16 |
|---|---|---|---|---|---|---|---|---|---|---|---|---|---|---|---|---|
| Sync 1/3 | ● | ● | ● | ● | ||||||||||||
| Sync 2/4 | ● | ● | ● | ● | ||||||||||||
| Sync 5/7 | ● | ● | ● | ● | ||||||||||||
| Sync 6/8 | ● | ● | ● | ● | ||||||||||||
| Odd clutch | ● | ● | ● | ● | ● | ● | ● | ● | ||||||||
| Even clutch | ● | ● | ● | ● | ● | ● | ● | ● | ||||||||
| Range creep | ● | ● | ● | ● | ● | ● | ● | ● | ||||||||
| Range low | ● | ● | ● | ● | ● | ● | ● | ● | ||||||||
| Range middle | ||||||||||||||||
| Range high | ||||||||||||||||
| 17 | 18 | 19 | 20 | 21 | 22 | 23 | 24 | 25 | 26 | 27 | 28 | 29 | 30 | 31 | 32 | |
| Sync 1/3 | ● | ● | ● | ● | ||||||||||||
| Sync 2/4 | ● | ● | ● | ● | ||||||||||||
| Sync 5/7 | ● | ● | ● | ● | ||||||||||||
| Sync 6/8 | ● | ● | ● | ● | ||||||||||||
| Odd clutch | ● | ● | ● | ● | ● | ● | ● | ● | ||||||||
| Even clutch | ● | ● | ● | ● | ● | ● | ● | ● | ||||||||
| Range creep | ||||||||||||||||
| Range low | ||||||||||||||||
| Range middle | ● | ● | ● | ● | ● | ● | ● | ● | ||||||||
| Range high | ● | ● | ● | ● | ● | ● | ● | ● |
| Number of Disks | Outer Diameter (mm) | Inner Diameter (mm) | Area (mm2) | Static Friction Coefficient | Kinetic Friction Coefficient | |
|---|---|---|---|---|---|---|
| FWD/REV clutch | 8 | 175 | 120 | 0.0126 | 0.1 | 0.15 |
| Odd/Even clutch | 10 | 178 | 118 | 0.0186 |
| Step Information | Value |
|---|---|
| Solver | Fixed step discrete |
| Start time | 0 s |
| Stop time | 45 s |
| Average step size | 1.00 × 10⁻³ |
| Total steps | 45,000 |
| Run time | 30.53 s |
Disclaimer/Publisher’s Note: The statements, opinions and data contained in all publications are solely those of the individual author(s) and contributor(s) and not of MDPI and/or the editor(s). MDPI and/or the editor(s) disclaim responsibility for any injury to people or property resulting from any ideas, methods, instructions or products referred to in the content. |
© 2023 by the authors. Licensee MDPI, Basel, Switzerland. This article is an open access article distributed under the terms and conditions of the Creative Commons Attribution (CC BY) license (https://creativecommons.org/licenses/by/4.0/).
Share and Cite
Han, G.; Ahn, D.-V.; Kwon, D.; Kim, H.-S.; Park, Y.-J.; Lee, J.W. Development of a Real-Time Tractor Model for Gear Shift Performance Verification. Agriculture 2023, 13, 2133. https://doi.org/10.3390/agriculture13112133
Han G, Ahn D-V, Kwon D, Kim H-S, Park Y-J, Lee JW. Development of a Real-Time Tractor Model for Gear Shift Performance Verification. Agriculture. 2023; 13(11):2133. https://doi.org/10.3390/agriculture13112133
Chicago/Turabian StyleHan, Gyuha, Da-Vin Ahn, Doyeop Kwon, Heung-Sub Kim, Young-Jun Park, and Jin Woong Lee. 2023. "Development of a Real-Time Tractor Model for Gear Shift Performance Verification" Agriculture 13, no. 11: 2133. https://doi.org/10.3390/agriculture13112133