Article

Diversity and Traits of Multiple Biotic Stressors Elicit Differential Defense Responses in Legumes

1
Department of Entomology, Washington State University, Pullman, WA 99164, USA
2
Department of Plant Pathology, Washington State University, Pullman, WA 99164, USA
*
Author to whom correspondence should be addressed.
Agriculture 2023, 13(11), 2093; https://doi.org/10.3390/agriculture13112093
Submission received: 24 September 2023 / Revised: 27 October 2023 / Accepted: 1 November 2023 / Published: 3 November 2023
(This article belongs to the Special Issue Plant Virus Diseases: Update and Perspectives)

Abstract

:
In agroecosystems, plants frequently confront multiple biotic stressors, including herbivores and pathogens. The nature of these interactions plays a crucial role in mediating the activation of plant defense mechanisms. However, induction of plant chemical defenses has been more well studied than the induction of physical defenses. Here, we assessed the physical and chemical defense responses of pea (Pisum sativum) plants after exposure to three stressors: a vector herbivore (pea aphid, Acrythosiphon pisum), a non-vector herbivore (pea leaf weevil, Sitona lineatus), and a virus (Pea enation mosaic virus, PEMV). We used various histochemical staining techniques show that viruliferous A. pisum (transmitting PEMV) strongly induced callose deposition (aniline blue staining) and antioxidant-mediated defenses (DAB and NBT staining) in peas, primarily through accumulating reactive oxygen species (ROS). High-throughput phenotyping showed that viruliferous aphids reduced plant photosynthetic efficiency, but plants infected with PEMV had increased cell death (trypan blue staining). However, herbivory by aphids and weevils did not strongly induce defenses in peas, even though weevil feeding significantly reduced pea leaf area. These results show that not all herbivores induce strong defensive responses, and plant responses to vector species depends on their virus infection status. More broadly, our results indicate that variable stressors differentially regulate various plant responses through intricate chemical and physical defense pathways.

1. Introduction

Plants use diverse chemical and physical defenses to counter stress from herbivores and pathogens [1,2,3,4]. Concurrent exposure to multiple stressors can influence plant responses, based on the stressors involved, the attack order, and environmental context [5,6,7]. For example, when plants experience herbivory, anti-herbivore chemical defense pathways are often induced due to production of hormones such as jasmonic acid and ethylene, while pathogen infections activate anti-pathogen mediated defenses by inducing hormones such as salicylic acid and abscisic acid [7]. However, activation of one hormonal pathway can hinder the other, known as “hormonal cross-talk” [5,8]. While many studies have assessed plant hormonal cross-talk in response to biotic stressors, far fewer studies examine the induction of non-hormonal or physical defenses.
Apart from chemical defenses mediated by phytohormone pathways, plants challenged by herbivores and pathogens often induce physical defenses, such as callose deposition [9,10]. Callose, a β-1,3-glucan polysaccharide with β-1,6-branches, is synthesized as a part of the cell wall, and plays a key role in physical defense against biotic stressors [11]. For example, the permeability of cell walls can be regulated through callose deposition to prevent the entry of attackers such as phloem-feeding insects; plants can thus increase callose deposition at locations where pest feeding is occurring [12]. Similarly, infection by phloem-limited pathogens, including vector-borne viruses, also enhances callose deposition as a physical barrier to future feeding from the vector insect [13]. Plants produce other non-hormonal defenses to counter biotic stress, including antioxidant mediated defenses that neutralize reactive oxygen species as well as cell death that can limit the proliferation of pathogens within plant tissue [14,15,16]. ROS generation in plants is triggered by various biotic and abiotic stressors. ROS (e.g., H2O2, O2•−, etc.) are produced permanently in various cellular compartments including chloroplasts, mitochondria, peroxisomes, etc. Overproduction of ROS causes oxidative stress, leading to photooxidative damage to various cellular components, and ultimately, cell death [17]. Hence, plants have evolved various ROS-detoxifying mechanisms including various antioxidant enzymes (e.g., superoxide dismutases, catalases, peroxidases, etc.) to harmlessly neutralize damage caused by ROS overproduction [13].
In addition to inducing plant physical and chemical defenses, biotic stressors affect many plant traits that can be visualized using techniques such as high-throughput phenotyping, which uses various automated cameras to monitor plant phenotypes [18,19]. For example, red–green–blue cameras in a high-throughout phenotyping system allow rapid acquisition of high-resolution images to assess plant leaf area. Florescent cameras can measure chlorophyll fluorescence, an indicator of photosynthetic efficiency, which can be altered by both herbivores and pathogens [20,21]. High-throughput phenotyping may thus be a complement to more traditional analyses of plant chemical defense, such as gene expression studies or hormone analysis.
PEMV is transmitted by aphids in non-persistent manner, and damage to pea plants and other legumes due to the vector A. pisum is mostly caused by their ability to transmit viruses such as PEMV, Pea streak virus, and Bean leafroll virus [22,23]. Pea aphids acquire PEMV and other viruses from perennial legume hosts and agricultural weeds and move into commercial crop plant fields when these unmanaged hosts dry out during the summer, during which virus transmission to crops can occur [22]. Sitona lineatus adults also typically overwinter on weedy legume hosts outside of pea fields, and adult weevils migrate into crop fields in late spring, typically arriving before the first generation of pea aphid adults [24]. Pea leaf weevil adults feed on pea leaves before laying eggs, and after these eggs hatch, S. lineatus larvae burrow into the soil to feed on roots and eventually pupate before emerging as adults in the middle of the summer [24]. These second-generation adults often occur on plants that may already be under attack from pea aphids and PEMV [25]. Due to these life cycles of pea aphids and pea leaf weevils, first-generation pea leaf weevil adults can often arrive on pea plants prior to pea aphids, while second-generation pea leaf weevil adults often arrive on plants already infested by aphids. Our prior work has shown that the diversity of these biotic stressors on legume plants, and the order in which they arrive on host plants, can differentially alter plant hormonal responses and crop yield [7].
Here, we assessed the responses of a legume host (dry pea, Pisum sativum) to biotic stress by assessing interactions with a vector piercing-sucking insect (pea aphid, Acrythosiphon pisum), a non-vector chewing insect (pea leaf weevil, Sitona lineatus), and an aphid-borne virus (Pea-enation mosaic virus, PEMV). Recent studies show that the type of stressors, and their order of attack on plants, can alter the regulation of phytohormone-mediated defense and nutritional status [7]. However, the effects of biotic stress on legume physical defenses and other phenotypic traits remain largely unknown. We used experiments and various analyses to assess effects of various biotic stressors on physical and chemical defenses such as callose deposition or antioxidant-mediated defense, and traits including leaf area and chlorophyll fluorescence. Our study shows that the diversity of stressors present on a plant can alter both chemical and physical defenses that are mediated through complex species interactions within crop systems.

2. Materials and Methods

2.1. Study Systems and Experimental Conditions

The Palouse region of eastern Washington and northern Idaho, United States of America (USA), is a large producer of cool-season grain legumes including peas (P. sativum), garbanzo beans (Cicer arietinum), and lentils (Lens culinaris) [26]. In this region, where most agricultural fields do not use irrigation, legume crops are threatened by several herbivores and pathogens, including the chewing herbivore pea leaf weevil S. lineatus, the vector aphid A. pisum, and the viral pathogen Pea enation mosaic virus (PEMV) [7,25]. In addition to the dominant legume crops grown in the region (pea, lentil, garbanzo beans), PEMV infects alternative legume crops and weeds like alfalfa (Medicago sativa), yellow sweet clover (Melilotus officinalis), white sweet clover (Melilotus albus), wild white clover (Trifolium repens), common vetch (Vicia sativa), hairy vetch (Vicia villosa), and broad bean (Vicia faba) [22].
In this study, to assess how various attacking organisms affect the physical defense and other traits of pea plants, assays were conducted to assess interactions between pea aphid, pea leaf weevil, and PEMV on spring pea. First-generation adult pea leaf weevils were collected from nearby pea fields under cultivation, or from wild patches of weedy hairy vetch (V. villosa), two or three days before the experiments began; these adults were stored in plastic buckets in a 4 °C incubator until experiments began. Colonies of PEMV-infectious and non-viruliferous pea aphids were initially established from field-collected adults [25] and were maintained on pea plants in a greenhouse (21–24 °C during light, 16–18 °C during dark, 16:8 h light:dark).
The prevalence of PEMV in both colonies was confirmed via reverse-transcription PCR using PEMV-CP-specific primers (Table 1) designed from conserved regions of CP from multiple isolates of PEMV [25,27]. We collected adult aphids from both colonies in microfuge tubes, froze them in liquid nitrogen, and stored samples at −80 °C until use. Aphid tissue was ground in sterile conditions with a micro-pestle and liquid nitrogen. We completed RNA extraction using Promega SV total RNA isolation kits (Promega, Madison, WI, USA). cDNA was synthesized from 1 μg of total RNA using Bio-Rad iScript cDNA synthesis kits, and PCR was carried out using DreamTaq Green PCR Master Mix (Thermo Fisher Scientific, Inc., Waltham, MA, USA) and PEMV primers for the coat protein (see Table 1). We sampled 100 aphids from each colony every 2 months since 2019; over 90% of aphids in the PEMV colony were viruliferous, and 0% in the non-viruliferous colony had PEMV. While not every aphid in the PEMV colony was viruliferous, the high prevalence of PEMV ensured the virus was present in treatments where many aphids were added to plants, while the lack of PEMV in the non-viruliferous colony ensured sham aphids did not transmit PEMV.

2.2. Experimental Setup

Fully grown 2-week-old pea plants (cv. Banner) were subjected to one of six treatments of biotic stress: (i) control (no treatment); (ii) non-viruliferous (sham) pea aphids; (iii) viruliferous (transmitting PEMV) pea aphids; (iv) two adult pea leaf weevils; (v) non-viruliferous pea aphids + two adult pea leaf weevils; and (vi) viruliferous pea aphids + two adult pea leaf weevils. For all of the treatments with pea leaf weevils, two adults were removed from the incubator before the experiments, and kept at 21–24 °C for 6 h before being placed on individual pea plants to feed for 48 h; after this period, they were removed by hand. For aphid treatments, both viruliferous and non-viruliferous adults of the same age (5 d old) were obtained from their respective colonies, and five individuals of a particular colony were placed on pea leaves inside mesh clip cages. To ensure uniformity and reliability of the samples, leaves for aphid treatments were caged from the stem at the same node on all experimental plants across all treatments. After 48 h of pea aphid infestation, the cages were removed, and all of the adult pea aphids (and any nymphs that were present due to reproduction) were gently displaced using a paint brush. A separate set of plants was used to collect leaves 3 d and 7 d after pea aphid or pea leaf weevil removal through destructive sampling. The treated leaves were removed and collected in 6-well cell culture plates (Southern Labware, Cumming, GA, USA). These samples were subsequently used for various staining procedures to measure pea plant physical defenses such as callose deposition, reactive oxygen species’ production, and cell death. Additionally, the pea plant leaves were analyzed using high-throughput phenotyping to measure average leaf area and chlorophyll fluorescence (a measure of photosynthetic efficiency). The experiment was performed in two separate blocks, and there were six biological replicates per treatment in each block at both time points.

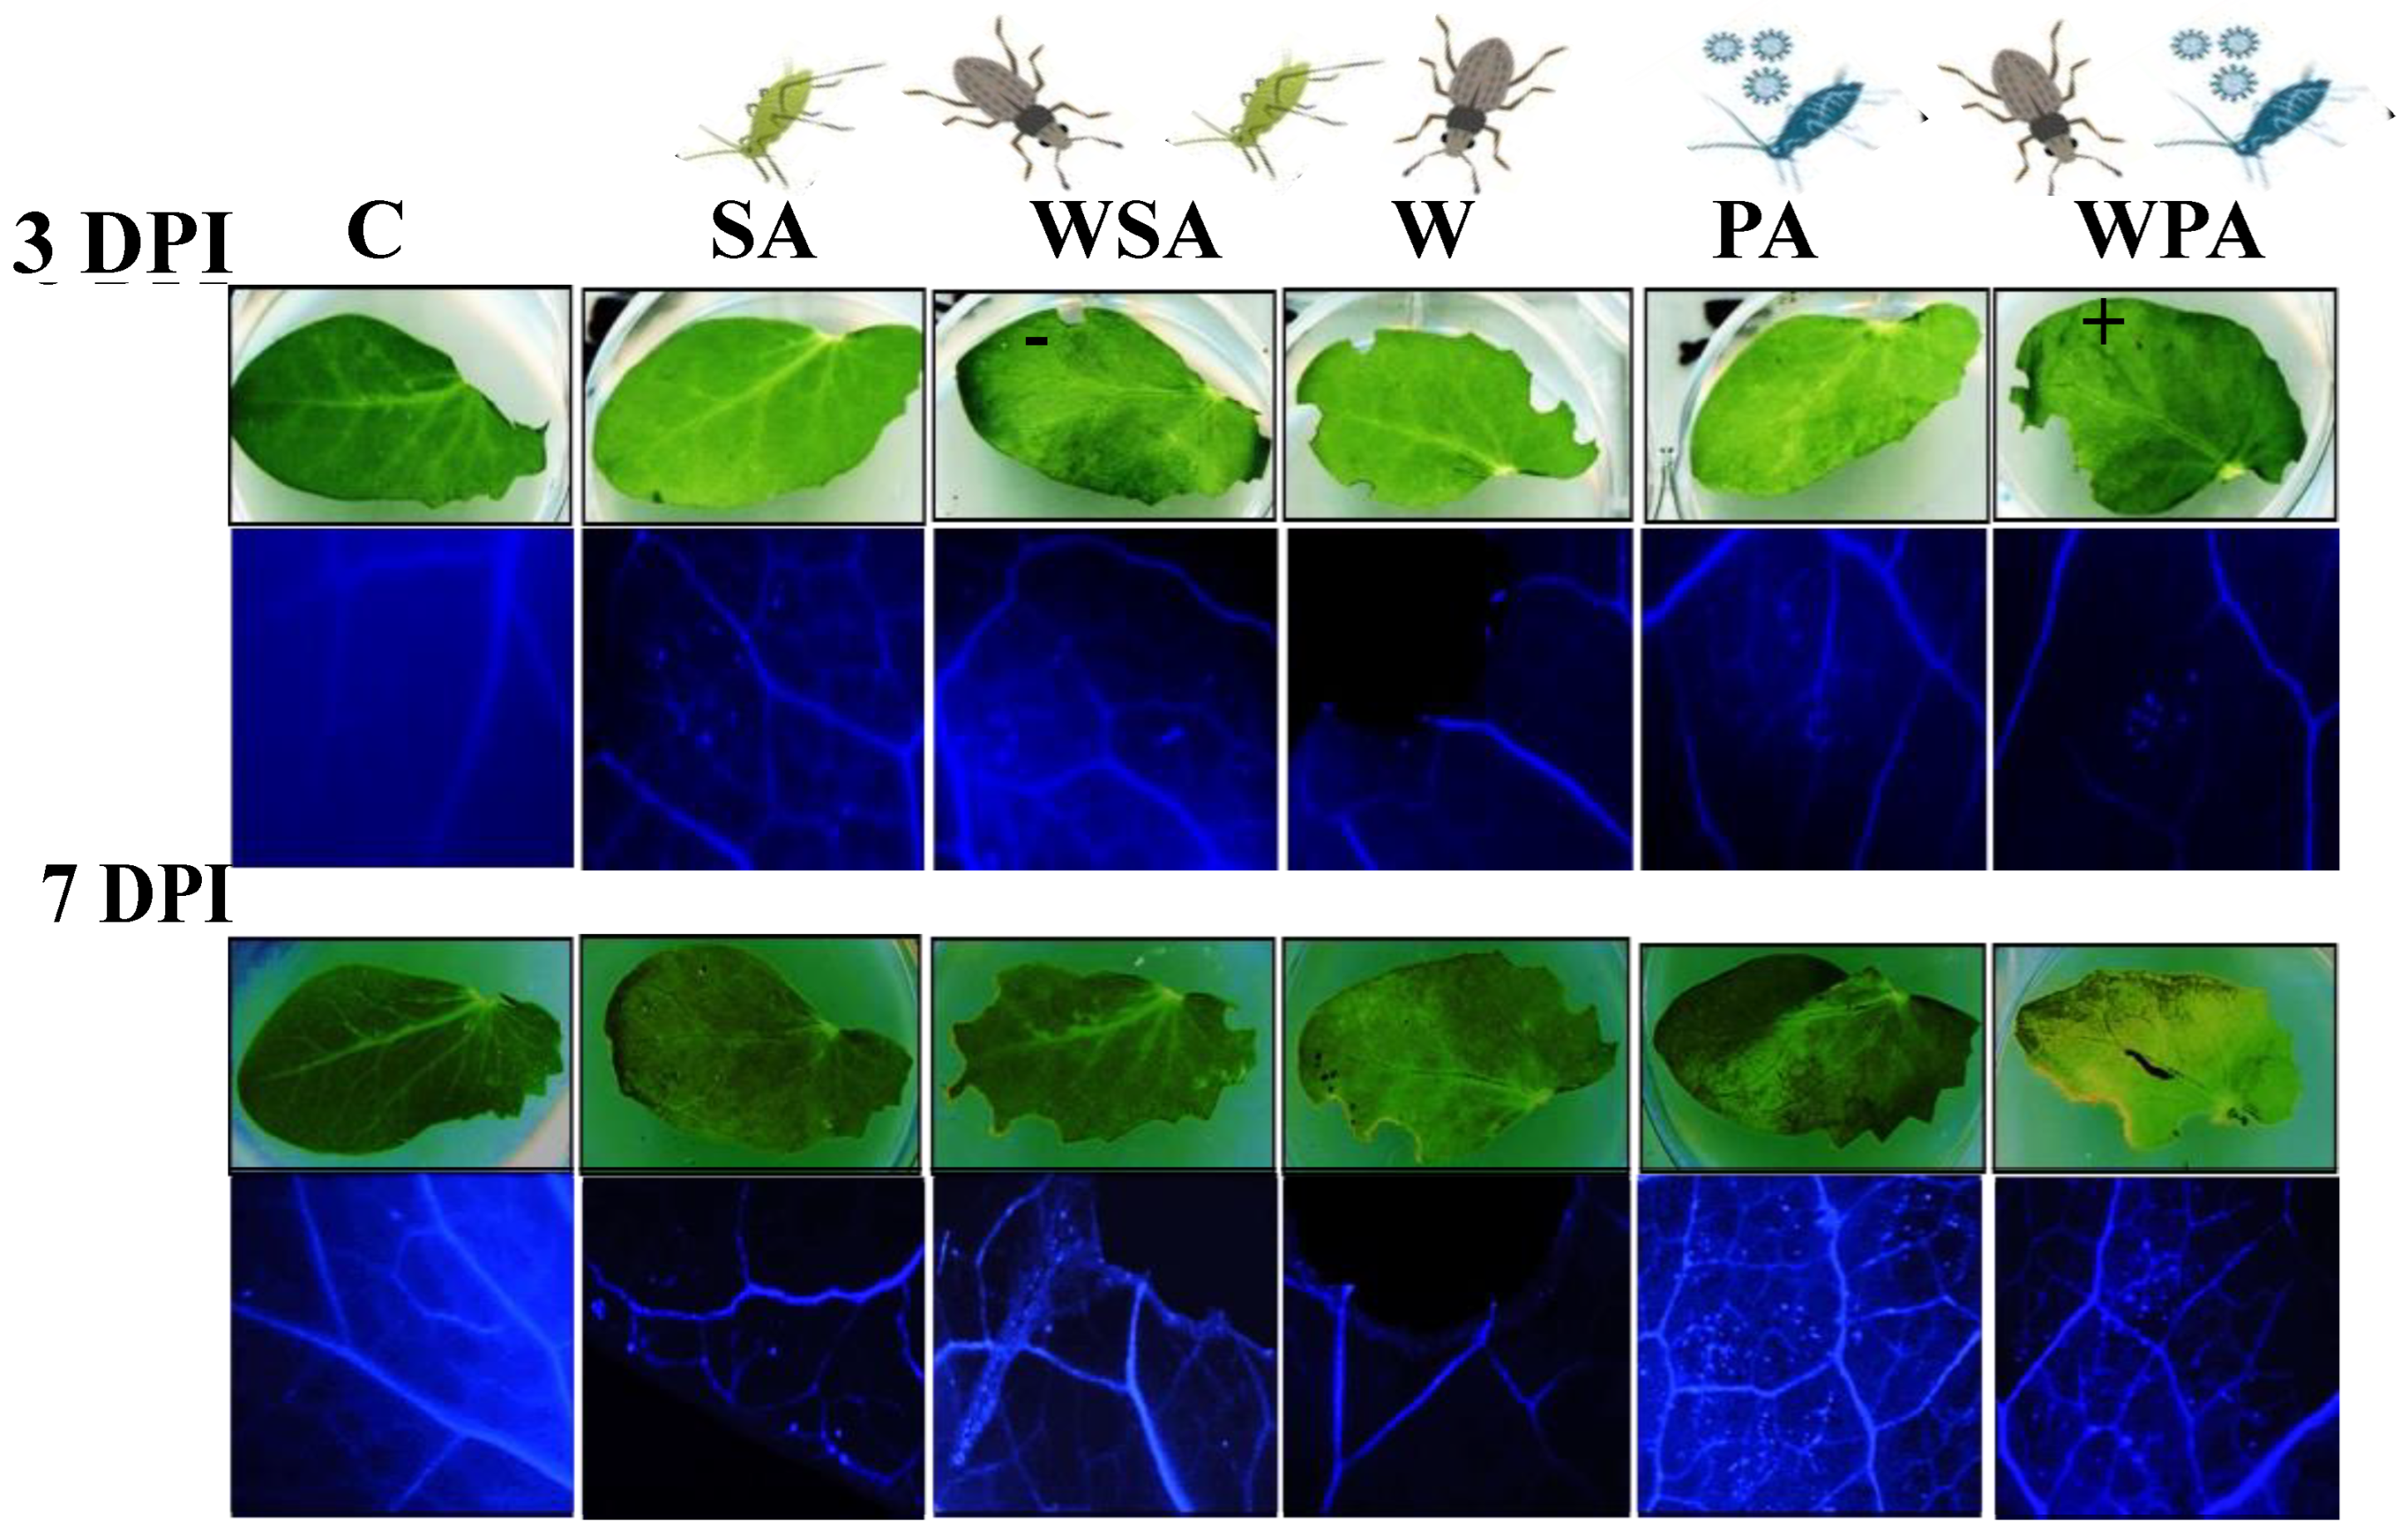
2.3. Detection of Callose Deposition

Detached pea leaves from the experiment were fixated in 6-well cell culture plates and destained overnight in a 1:3 acetic acid–ethanol solution until the leaves became transparent. If necessary, the saturated destaining solution was replaced. The fixated and destained pea leaves were washed thoroughly in 150 mM K2HPO4 for 30 min, followed by incubation in the staining solution (i.e., 150 mM K2HPO4 and 0.01% aniline blue for at least 2 h) [28]. To protect samples from light degradation, the 6-well cell culture plates were wrapped in aluminum foil during the incubation process. After incubation, the leaves were embedded in 50% glycerol before analysis to allow for a prolonged observation time and reduce disturbances caused by air bubbles. Callose depositions in the pea leaves were quantified using a fluorescence microscope (ZEISS SteREO Discovery V8, Carl Zeiss Microscopy, Jena, Germany) using a 4′,6-diamidino-2-phenylindole (DAPI) filter and a 300 ms exposure time. The optimal excitation and the emission maximum wavelengths for aniline blue are 370 nm and 509 nm, respectively. Zeiss AxioVision 3.0 software was used for analyses, and the images were acquired with a resolution of 1300 × 1030 pixels. The images were left untreated except for brightness adjustments, and were visualized under microscopy to detect callose depositions.

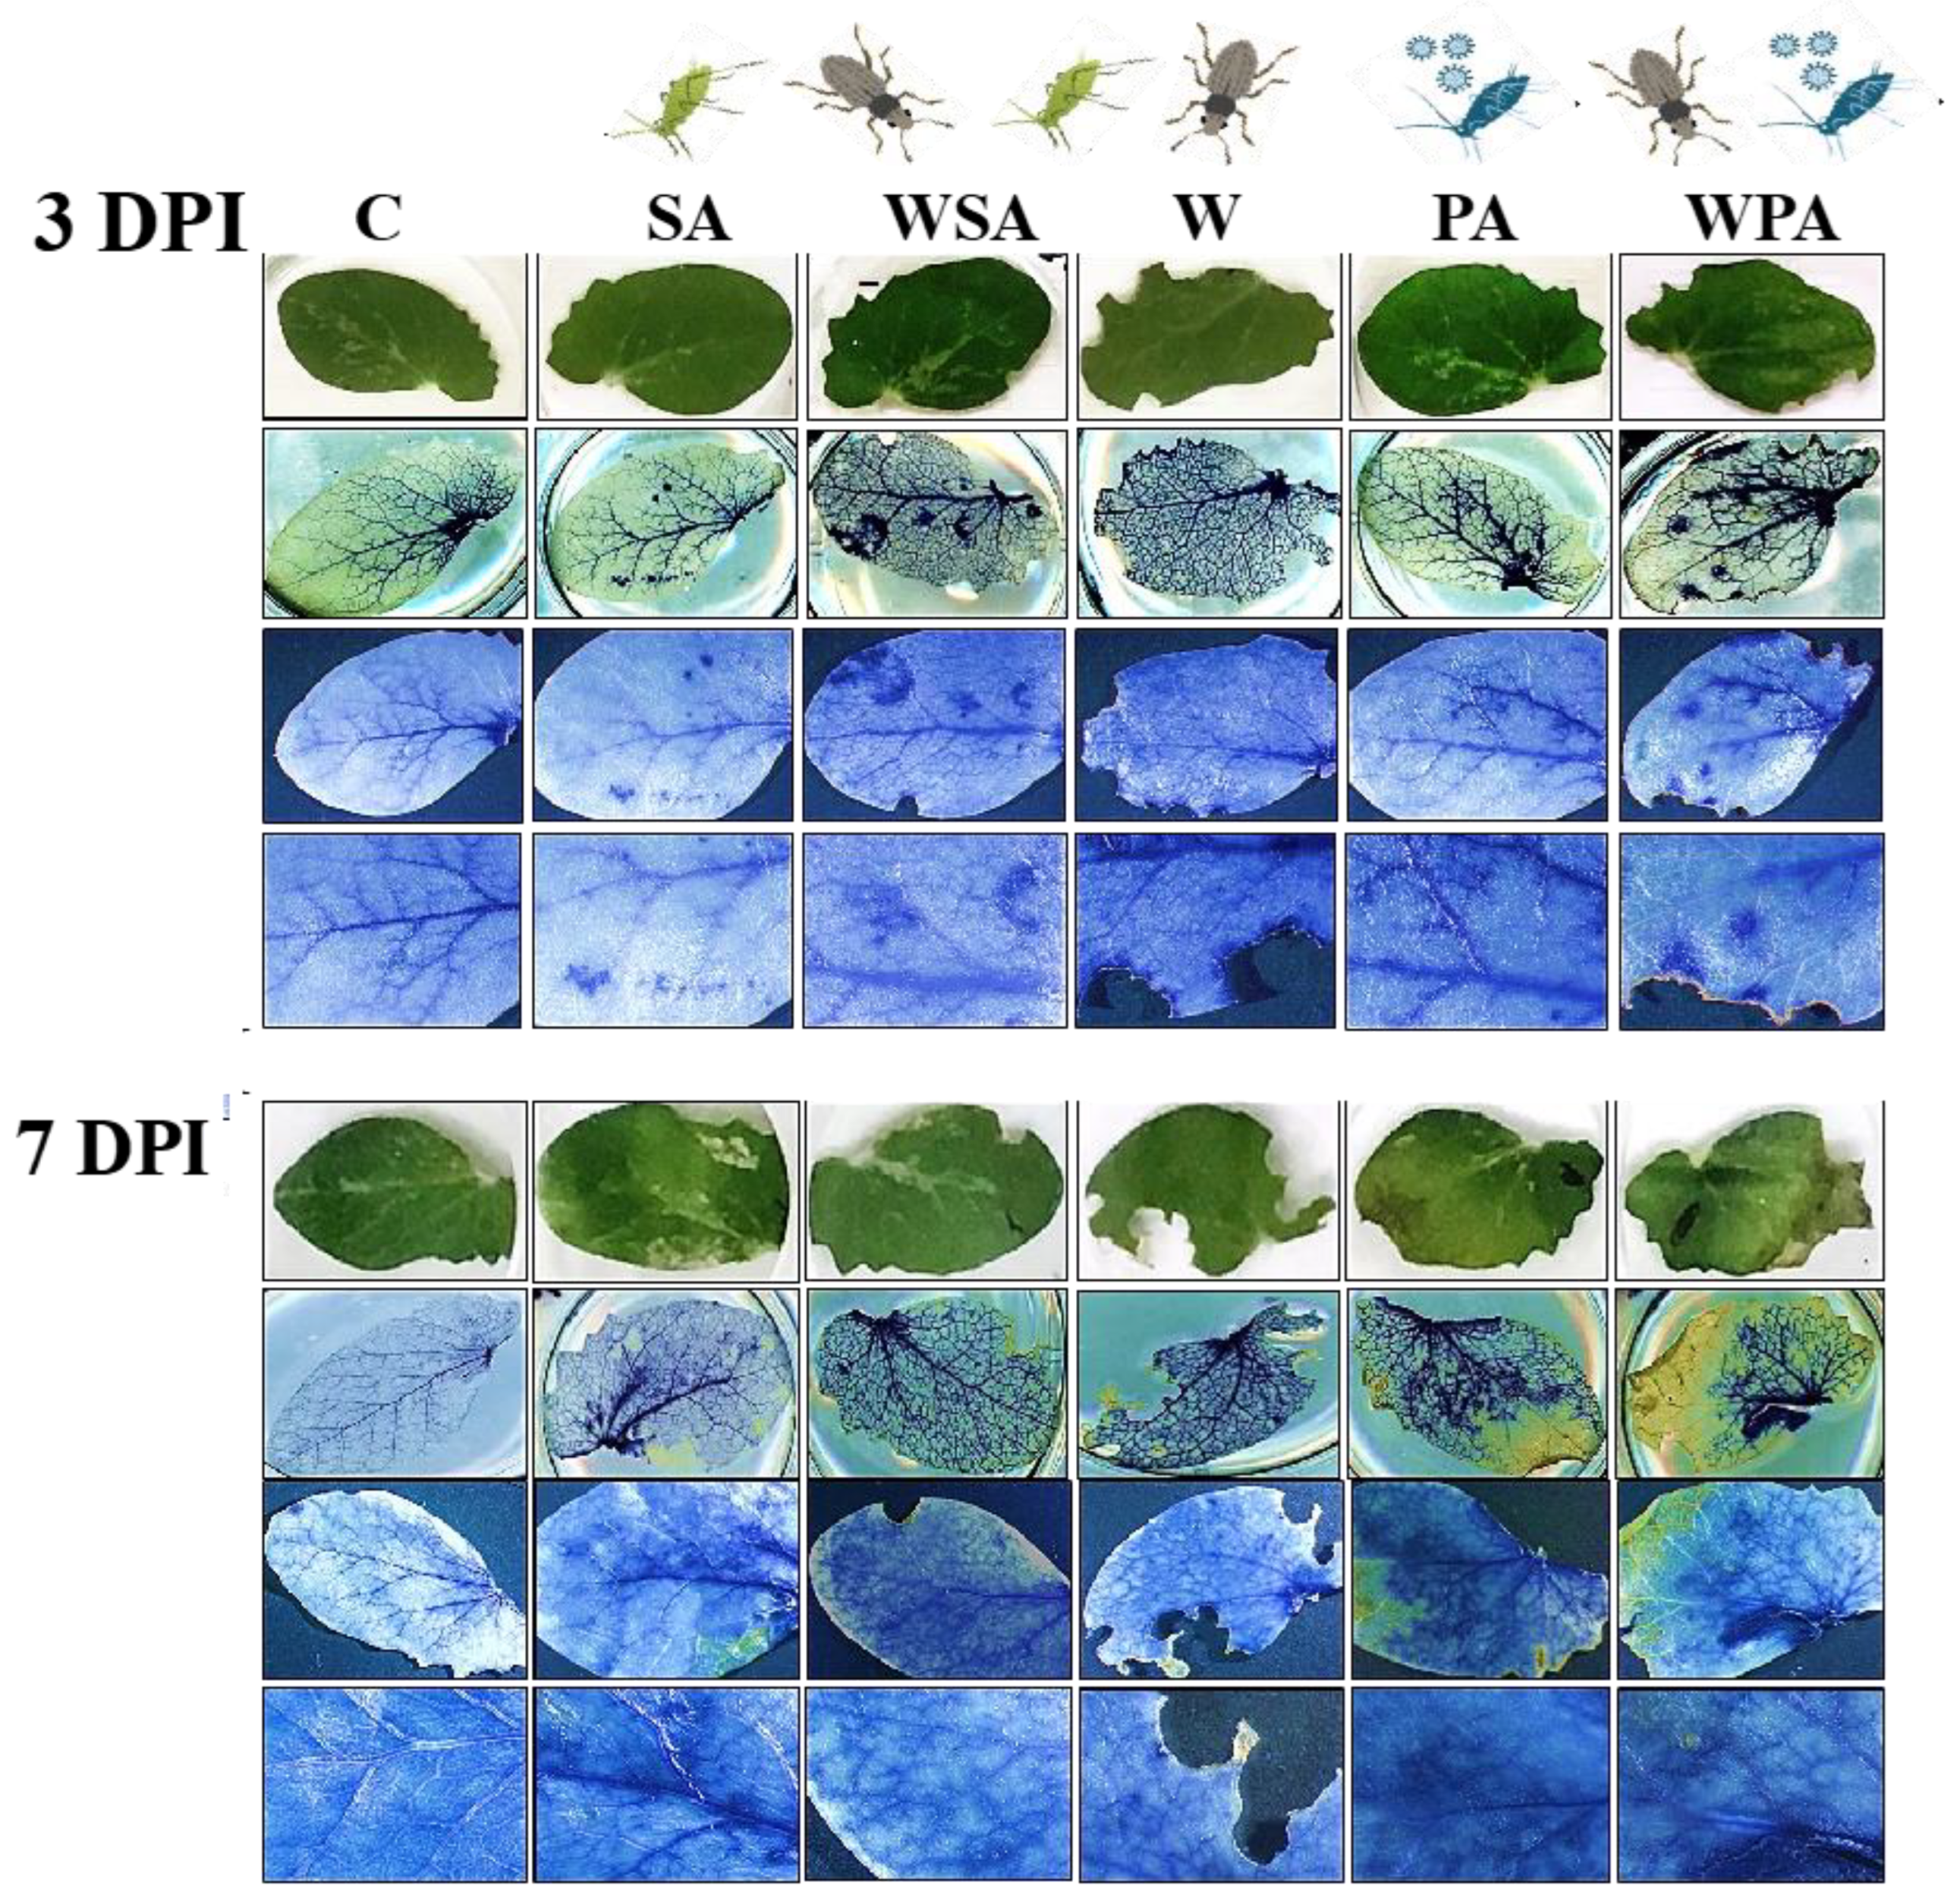
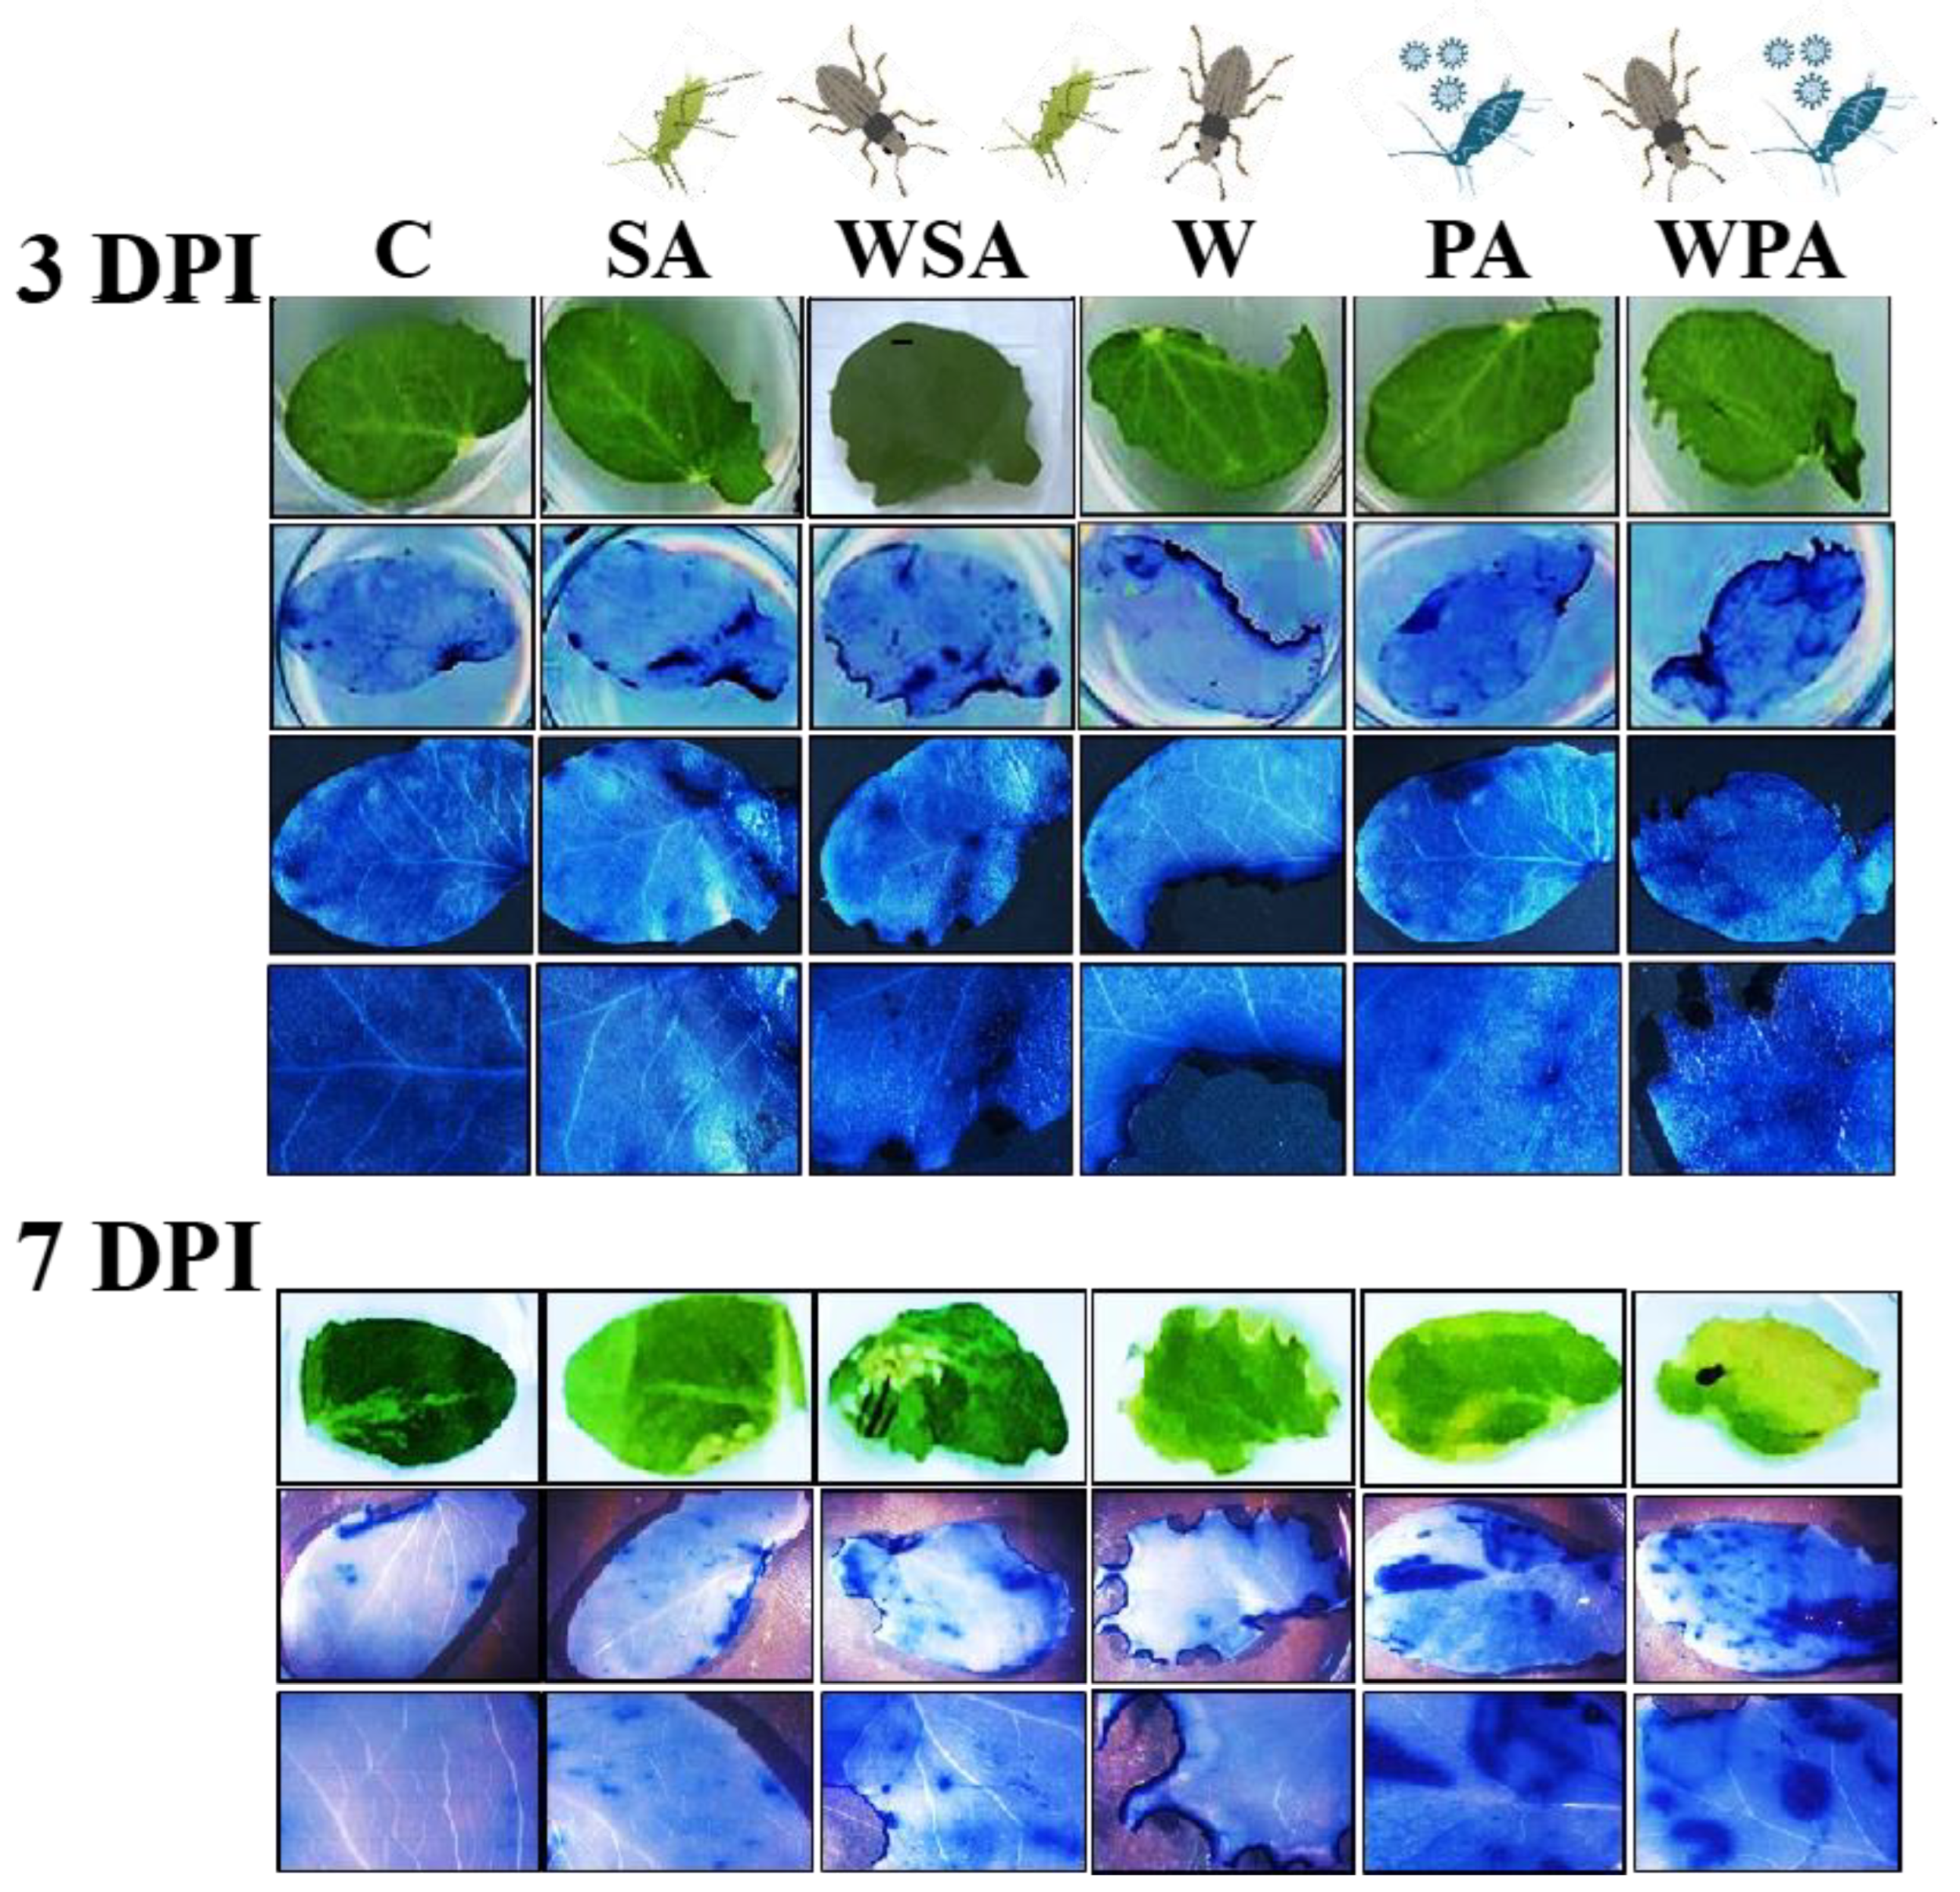
2.4. Detection of Reactive Oxygen Species

To detect the production of various reactive oxygen species components (e.g., H2O2, O2•−, etc.) in the pea leaf tissues, we used DAB (3,3′-Diaminobenzidine) staining to indicate H2O2 content, and NBT (nitro blue tetrazolium chloride) staining to indicate O2•− content [29]. For both analyses, pea leaf samples were immersed in a 1 mM DAB or NBT solution, respectively, prepared in 10 mM phosphate buffer (pH 7.8) at room temperature in the dark for 8 h to prevent light degradation. Once blue spots appeared, the non-specific pigments were removed from the leaves by boiling them in 75% ethanol for 5 min. Leaves were then photographed with a digital camera, and the intensity of the color in the NBT- or DAB-stained area was visually observed to qualitatively measure the extent of deposition of H2O2 or O2•− accumulation. Experiments were repeated two times, and the staining intensity was measured in 6 leaf samples for each repetition.

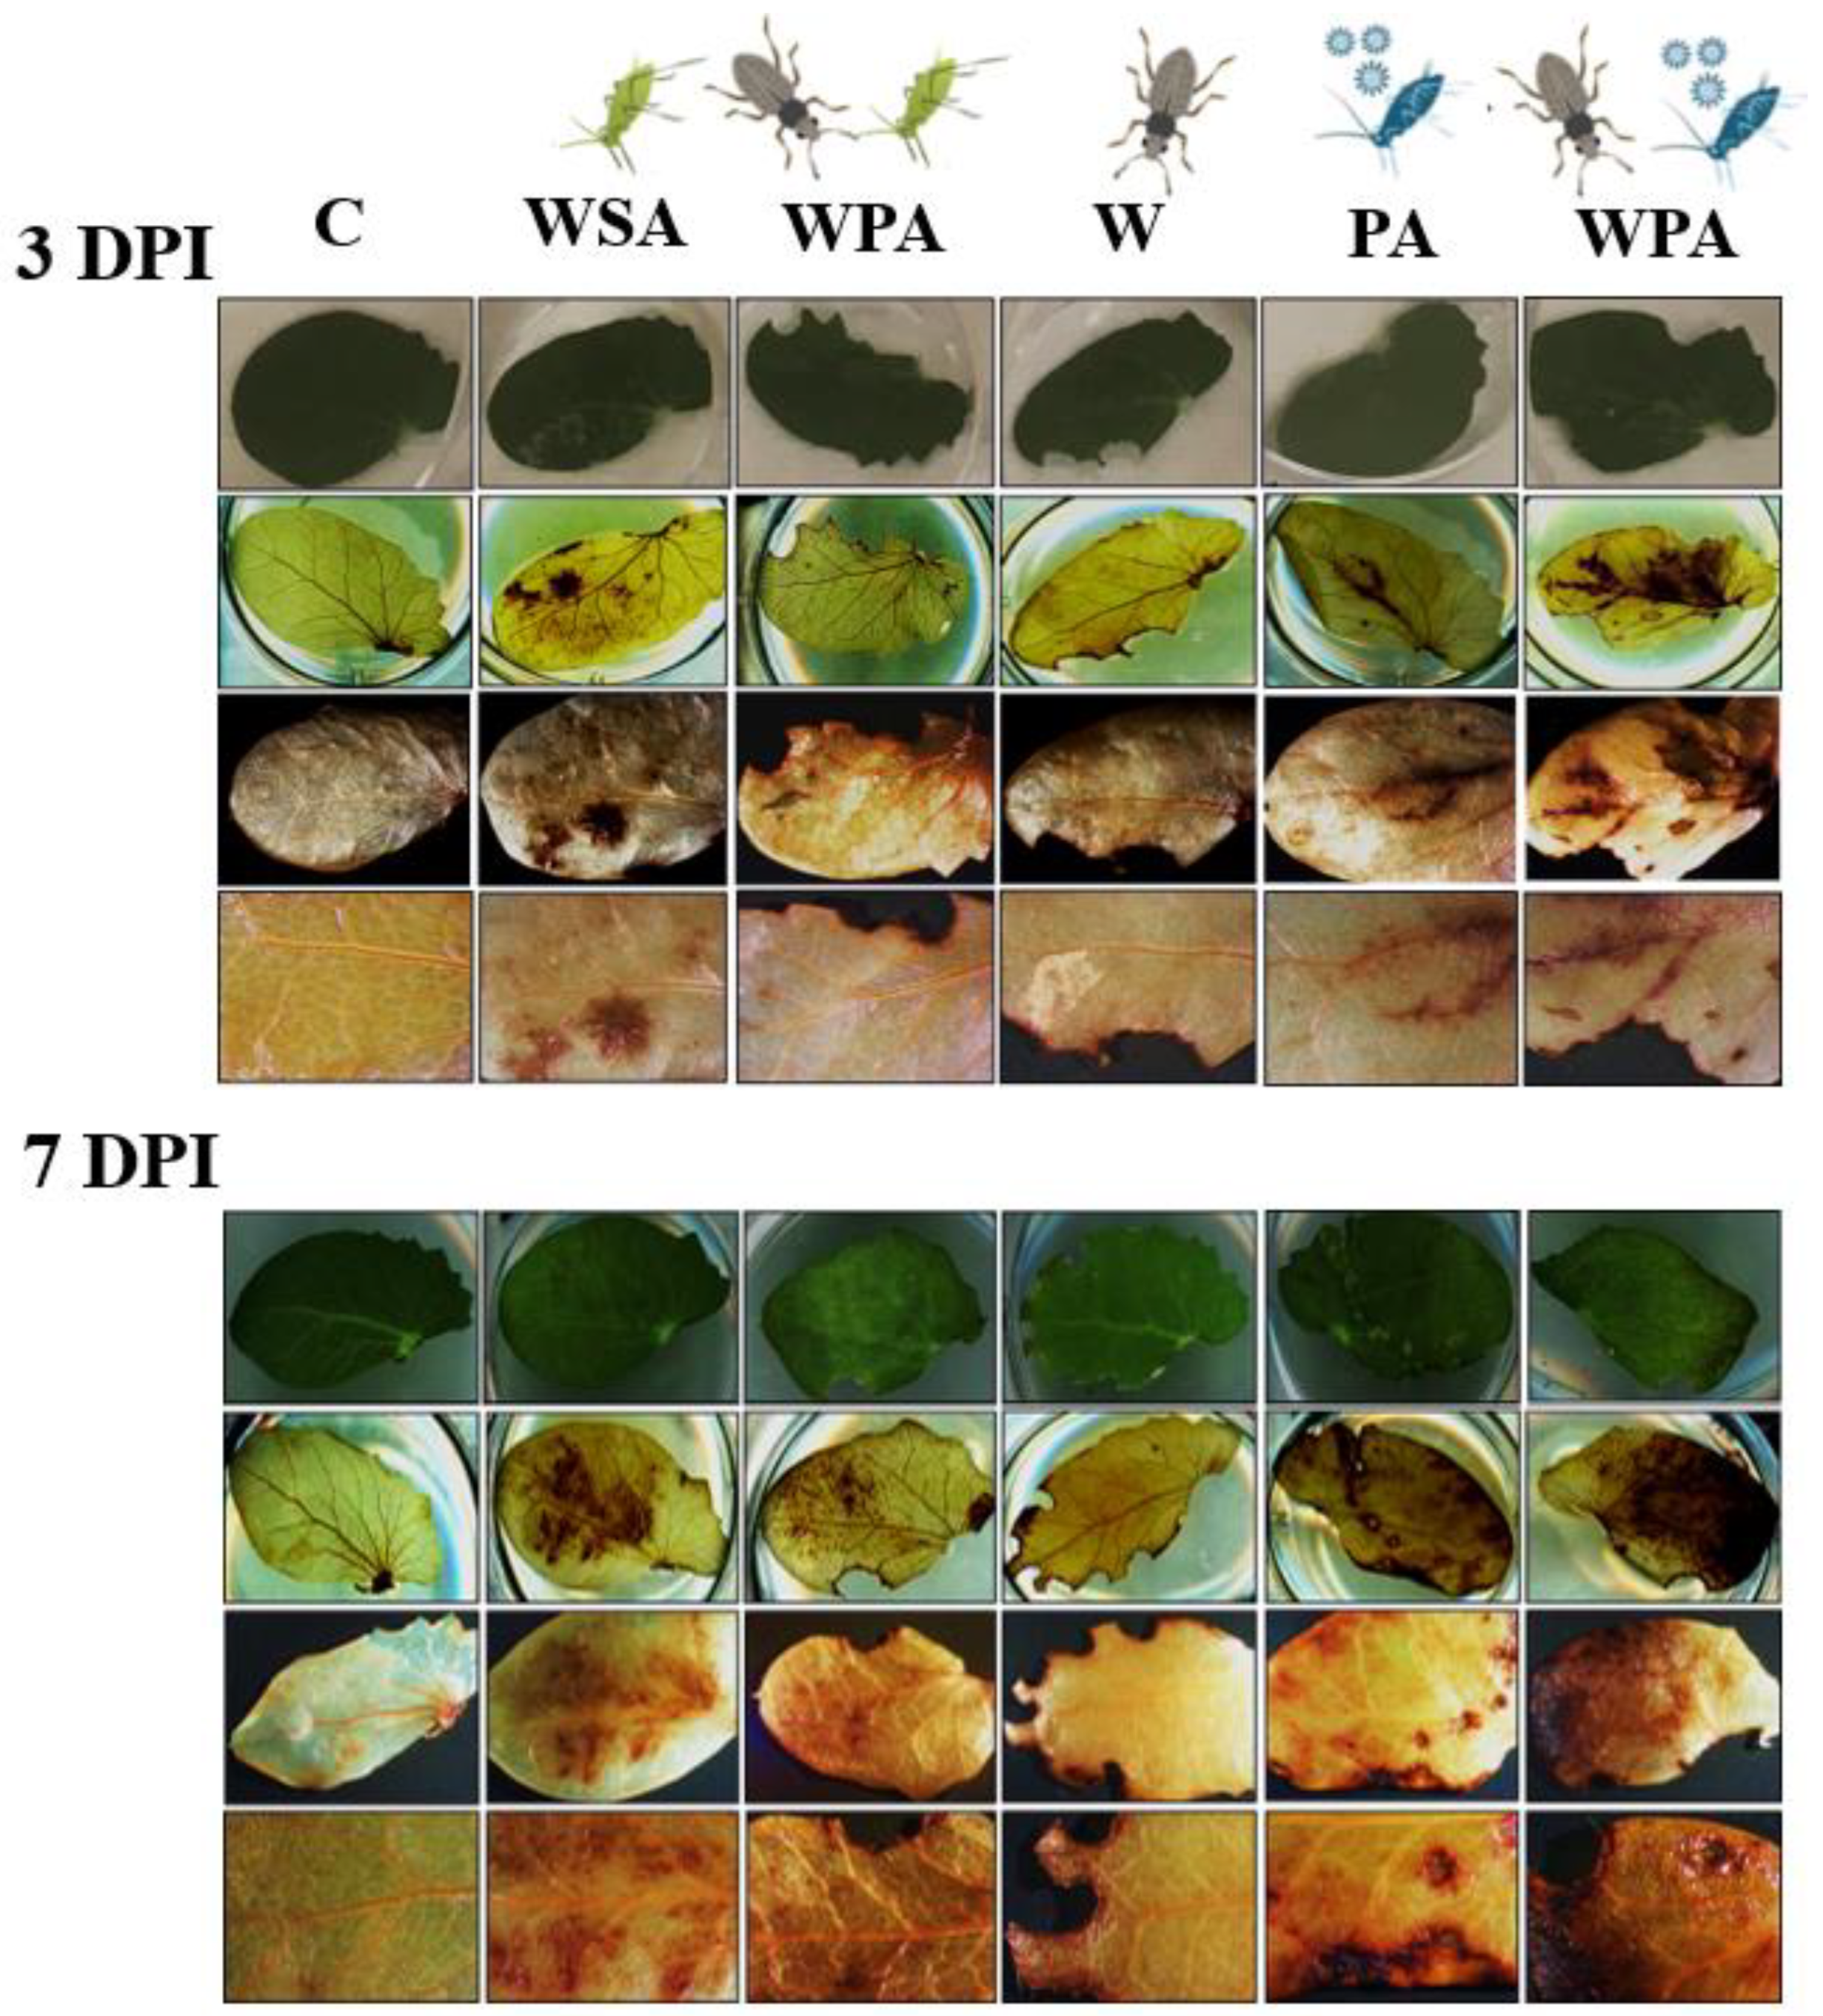
2.5. Detection of Cell Death in Peas

Dead cells resulting from the cell death due to various combinations of biotic stressors were visually detected using trypan blue staining, following the method described by Mason et al. [30]. Briefly, detached pea leaves were stained in a 6-well cell culture plate by adding staining solution containing 0.04% lactophenol-trypan blue solution (Sigma-Aldrich, St. Louis, MO, USA) dissolved in 10 mL of distilled water and diluted 1:1 with ethanol. The leaves were then boiled in the solution for 1 min before incubation in the staining solution for 5 to 10 min. Subsequently, the leaves were removed from the staining solution and placed in a 10 mL de-staining solution (3:1 85% ethanol:glacial acetic acid) for 2 h on an orbital shaker. After the initial de-staining process, the detached leaf samples were further de-stained overnight using a fresh de-staining solution. Samples were then examined under a microscope to detect cell death.

2.6. High-Throughput Phenotyping

Detached leaves from pea plants exposed to the various treatments were collected at 3 d or 7 d after the removal of pea aphids and/or pea leaf weevils. A separate set of plants was used for each time point to reduce possible sampling effects on plant responses. The leaf samples were then subjected to high-throughput phenotyping for measurement of average leaf area and chlorophyll fluorescence. High-throughput phenotyping was conducted in the PhenoCenter in the Department of Plant Pathology at Washington State University (Pullman, WA, USA) using LemnaTec High Throughput plant phenotyping scanalyzer (LemnaTec, Aachen, Germany). Both visible (red–green–blue) and fluorescent cameras were used to capture the images of the leaves. The raw images captured by the red–green–blue camera were used to calculate the average leaf area from 6 leaves per plant, while chlorophyll fluorescence data were derived from images using the fluorescent camera. We used an ANOVA to assess leaf area across the various treatments, and a comparison of chlorophyll fluorescence was performed qualitatively among all treatments at 3 and 7 d post pea aphid and/or pea leaf weevil removal.

3. Results

3.1. Differential Callose and Reactive Oxygen Species Responses of Pea Plants to Biotic Stressors

Viruliferous pea aphids induced a significant increase in callose in pea leaves collected 7 d after aphids were removed, regardless of the presence of pea leaf weevils, compared to the treatments with sham pea aphids or pea leaf weevils alone (Figure 1). However, these effects were not seen in pea leaves collected 3 d after viruliferous pea aphids were removed, suggesting that treatments took a week to manifest (Figure 1).
Similarly, accumulation of reactive oxygen species (e.g., H2O2) was highest in leaf samples collected 7 d after pea aphid removal in leaves infested with viruliferous pea aphids, and this effect was amplified on pea leaves with pea leaf weevils compared to plants only attacked by viruliferous pea aphids. However, leaves collected only 3 d after the removal of viruliferous pea aphids, and leaves collected at 3 and 7 d after the removal of non-viruliferous pea aphids, showed lower reactive oxygen species accumulation, irrespective of the presence of pea leaf weevils (Figure 2).
Solo herbivory by pea leaf weevils did not significantly affect callose deposition or reactive oxygen species accumulation compared to the control treatment (Figure 1 and Figure 2). All of the stressors induced super oxides (O2•−), but the greatest induction occurred in treatments with viruliferous pea aphids (with or without pea leaf weevil herbivory) compared to the control or sham pea aphid treatments (Figure 3). Moreover, the accumulation of super oxides increased over time after exposure to any of the biotic stressors (greater values at 7 d compared to 3 d post pea aphid or pea leaf weevil removal, Figure 3).

3.2. Effects of Biotic Stressors on Cell Death in Pea Plants

Similar to the deposition of callose and accumulation of reactive oxygen species, pea leaf samples collected 7 d after the removal of viruliferous pea aphids showed significantly higher levels of cell death compared to control or sham pea aphid treatments, regardless of the presence or absence of pea leaf weevil herbivory. However, effects of viruliferous pea aphids on cell death were not different from any other treatments at 3 d post removal. All other treatments besides viruliferous pea aphids exhibited relatively low levels of cell death induction that did not differ from control treatments (Figure 4). The extent of dead cells resulting from cell death was lower in all 3 d post addition samples (compared to 7 d post addition), with only pea leaf samples infested by viruliferous pea aphids in the presence of pea leaf weevils showing greater numbers of dead spots compared to other treatments (Figure 4).

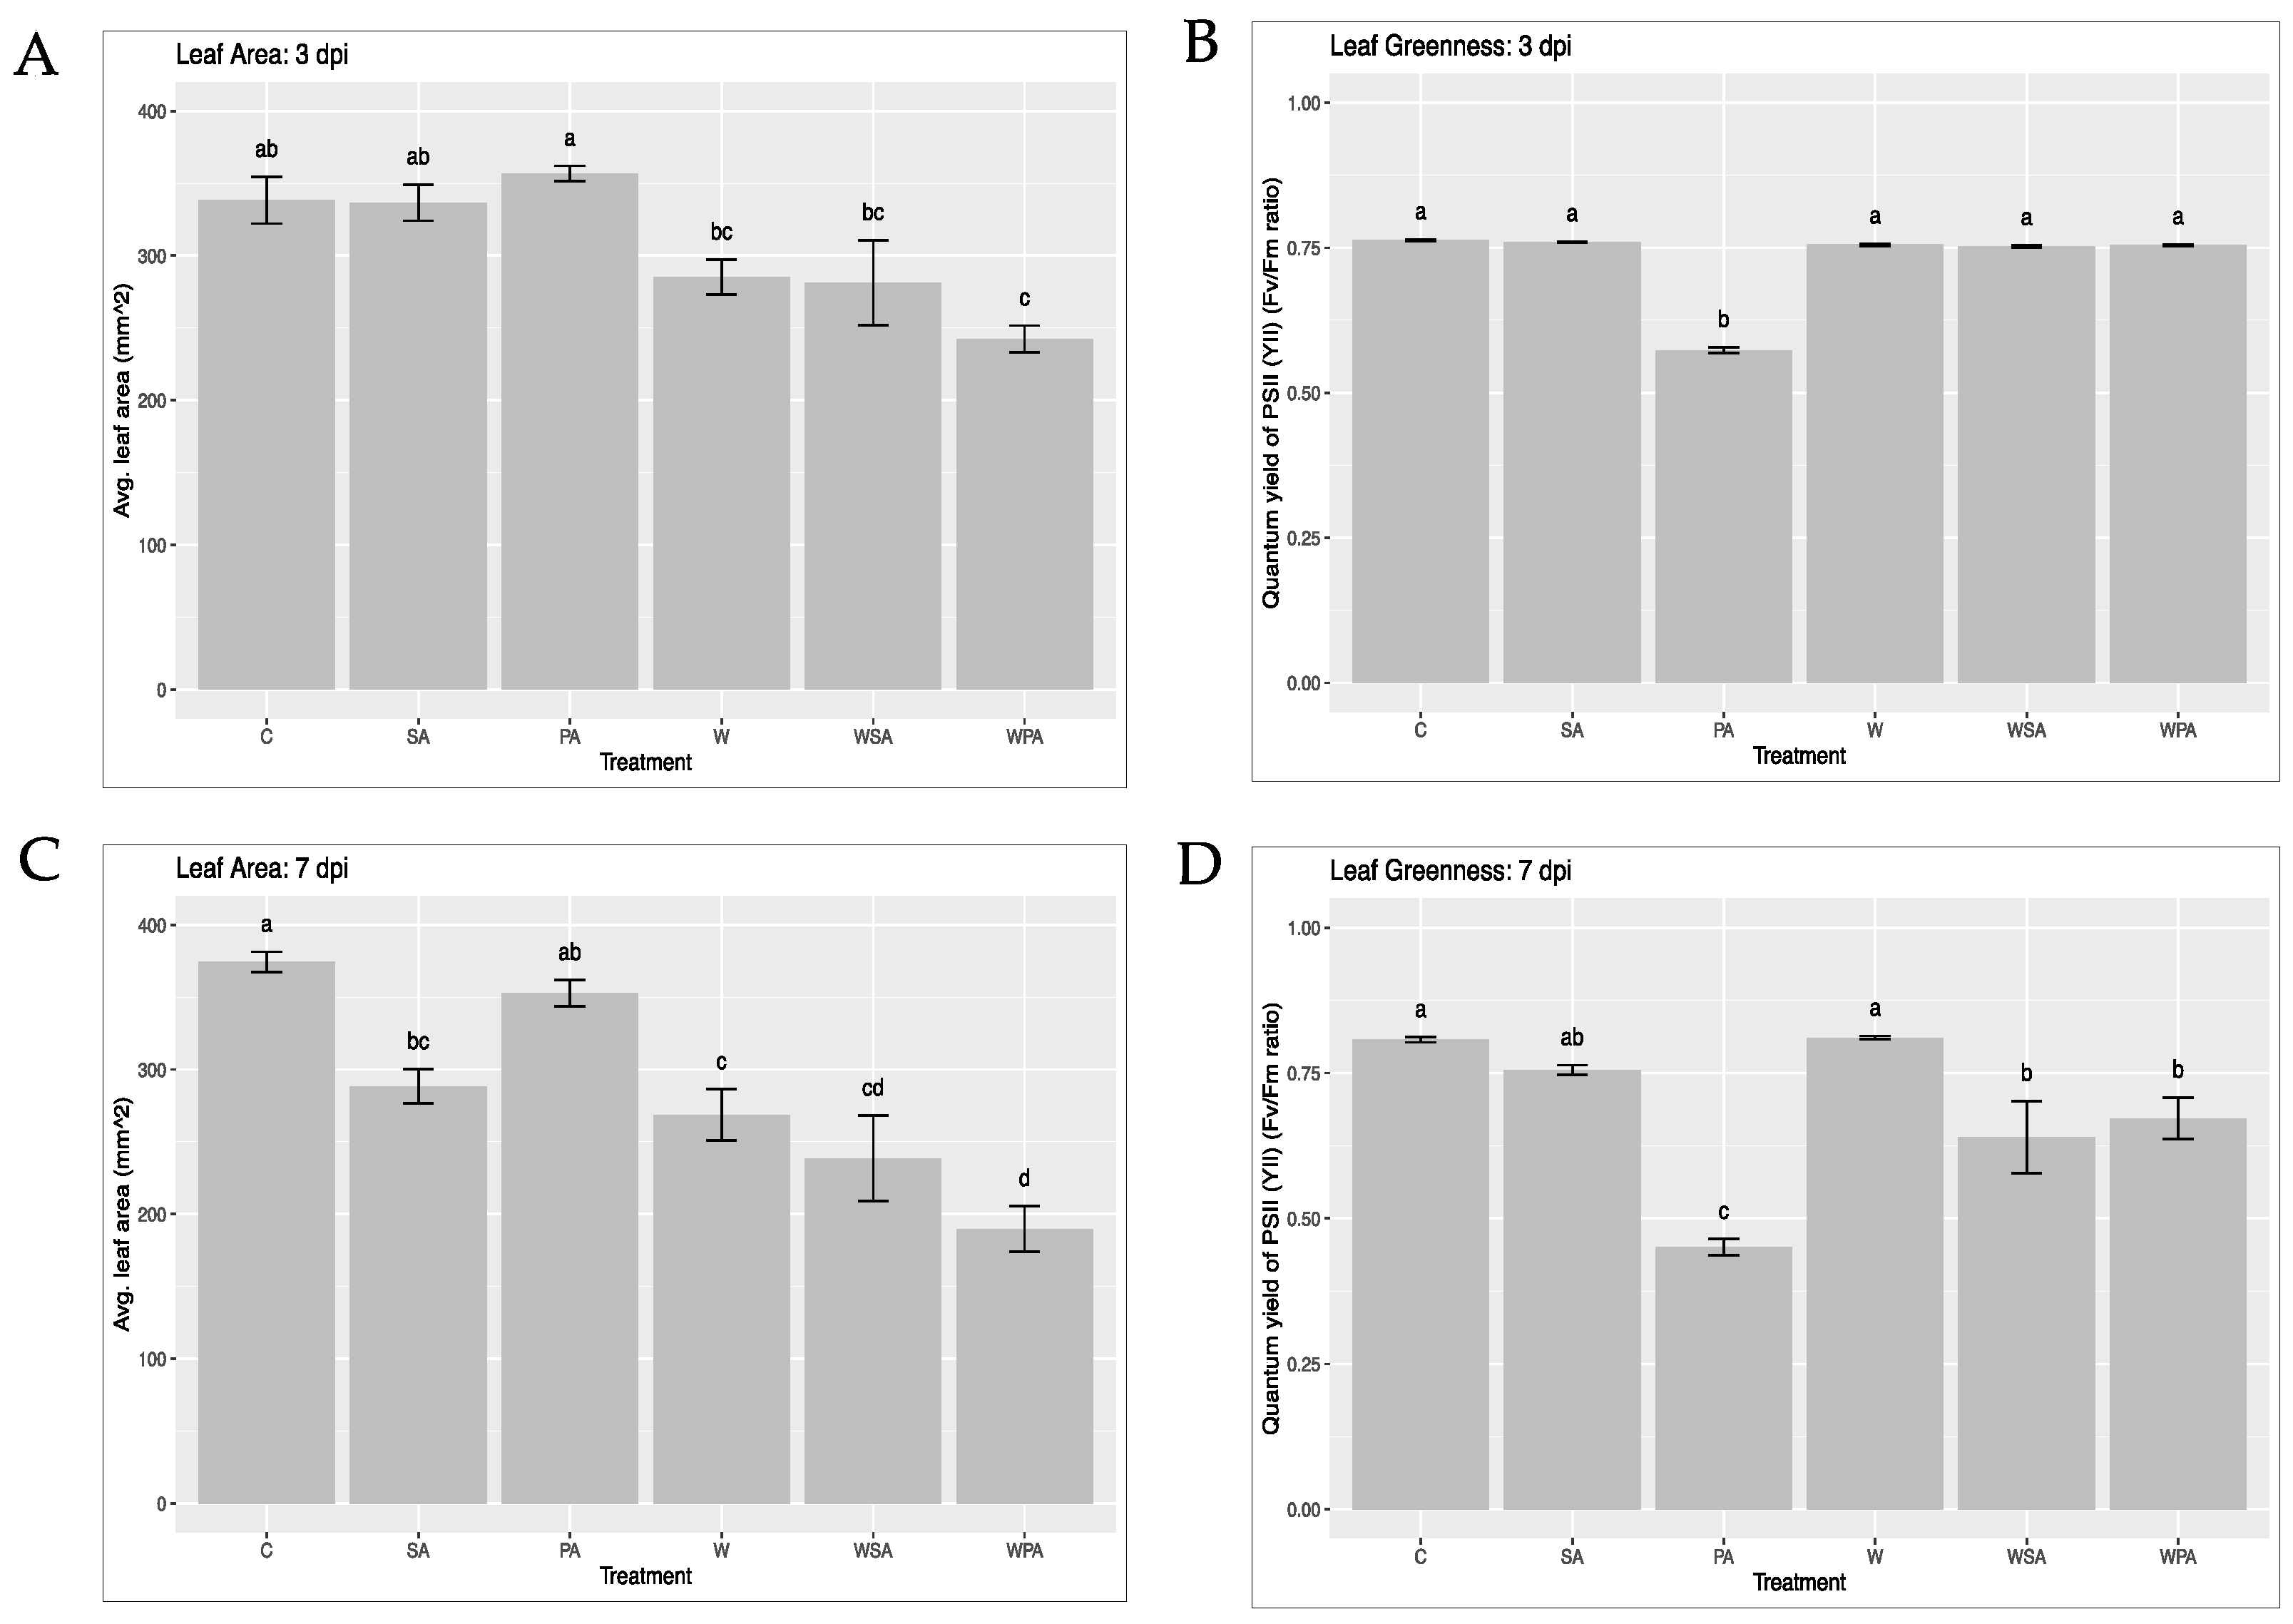
3.3. High-Throughput Phenotyping for Measuring Leaf Area and Chlorophyll Fluorescence

Using high-throughput phenotyping with red–green–blue and fluorescent imaging cameras, we observed a significant reduction in leaf area in detached pea leaf samples exposed to biotic stressors at both time points (3 and 7 d after pea aphid and/or pea leaf weevil removal). At 3 d post removal, treatments involving pea leaf weevil herbivory combined with viruliferous pea aphids had a significantly smaller leaf area compared to any of the other treatments such as sham pea aphids or controls (ANOVA, F5,30 = 7.53, P < 0.001, Figure 5A). Similarly, at 7 d post removal, all different treatments except for viruliferous pea aphids had a significant impact on average leaf area (ANOVA, F5,30 = 17.02, P < 0.001). The presence of pea leaf weevils, with or without pea aphid treatments (both sham and viruliferous pea aphids), caused substantial reductions in leaf area due to leaf defoliation (Figure 5C). Moreover, chlorophyll fluorescence decreased (indicating lower leaf greenness) in detached leaves collected 3 d after viruliferous pea aphids were removed compared to the other treatments. However, pea leaf weevil herbivory did not reduce greenness at 3 d post removal (ANOVA, F5,30 = 911.2, P < 0.001; Figure 5B). At 7 d post removal, treatments combining viruliferous pea aphids and pea leaf weevils had reduced chlorophyll fluorescence. The greatest effect was observed in leaves treated with viruliferous pea aphids, while treatments with pea leaf weevils showed more muted effects (ANOVA, F5,30 = 20.62, P < 0.001; Figure 5D).

4. Discussion

Understanding how interactions between plants and various biotic stressors affect plant chemical and physical defenses, as well as phenotypic traits such as leaf area and photosynthetic efficiency, is key to comprehending how herbivores and pathogens may affect plant productivity in agricultural and natural systems. Many prior studies show that the regulation of plant defense responses and plant phenotypic traits are influenced by the diversity and traits of the attacking stressors [7,31,32]. In this study, we build on this body of literature by demonstrating that the defense responses and phenotypic traits of pea plants are differentially regulated based on interactions with multiple antagonists, including a vector piercing-sucking insect herbivore, a chewing non-vector insect herbivore, and a vector-borne virus. Investigating how biotic stressors, either alone or in combination, simultaneously affect multiple aspects of plant physical defenses (e.g., callose deposition), chemical defenses (e.g., reactive oxygen species), and plant phenotypic traits, contributes to a more comprehensive understanding of the mechanistic details associated with these multitrophic interactions, rather than studying these responses in isolation.
Callose deposition is a typical plant defense produced in response to biotic stressors, with callose providing a physical barrier to minimize stress impacts on plant tissues [33]. Callose, a polysaccharide found in the plant cell wall, is synthesized by callose synthase enzymes in the form of β-1,3-glucan with β-1,6-branches [34]. Callose biosynthesis is crucial for various plant developmental processes and confers enhanced protection as a physical barrier against biotic stressors. H2O2 signaling in plants, however, has been found to be associated with regulation of callose deposition. Virus-induced callose deposition in plants requires H2O2-mediated transcriptional reprograming to restrict virus transmission [35]. For example, the expression of one of the key callose biosynthetic genes, GhCalS5, is upregulated in cotton plants following aphid infestation [36]. Besides phloem-feeding insects, elicitors present in the saliva or gut regurgitant of chewing insects (also known as herbivore-associated molecular patterns) induce diverse defensive responses including callose deposition [3,37,38,39]. Similarly, infection with Rice gall dwarf virus, which is transmitted by leafhoppers, induced callose deposition in rice plants [40]. In contrast, Potato virus Y infection suppressed callose deposition in susceptible host plants, presumably as a mechanism to allow increased feeding by aphid vectors [41]. We observed enhanced callose deposition in pea leaves infected with PEMV (Figure 1) at 7 dpi, which is consistent with many studies showing increased callose deposition following pathogen infection over time by enhancing expressions of some of the callose biosynthetic pathway genes [10,42]. However, pea aphid feeding and pea leaf weevil herbivory, alone or in combination, resulted in lower callose deposition in this study at both early and late time points (Figure 2). This suggests pea plants respond differently to herbivores than to pathogens, which may reflect the far greater impact that pathogens tend to have on plant growth than either herbivore, even when they are present together on plants. The chewing herbivore pea leaf weevils failed to exhibit any visually significant callose deposition, while piercing-sucking aphid vectors induce lower levels of callose deposition on pea sieve plates in order to prevent phloem’s flow and hinder their phloem feeding.
In addition to physical defense, plants respond to attack from biotic stressors by producing chemical defenses, which are often regulated by phytohormones [7]. Generation of various reactive oxygen species (e.g., H2O2, O2•−, etc.) in plants is activated by various biotic stressors including both pathogens and herbivores. However, reactive oxygen species play a vital role in inducing plant chemical defenses against biotic stressors, including pathogens and herbivorous insects [43,44]. Overproduction of ROS in various cell organelles including chloroplasts, mitochondria, and peroxisomes causes oxidative stress, leading to photooxidative damage to these cellular components, and ultimately, cell death. On the contrary, plants have evolved various ROS-detoxifying mechanisms to harmlessly neutralize overproduced ROS species [13]. For example, pine sawfly egg deposition induced reactive oxygen species’ accumulation and enhanced the activity of antioxidant-related defense enzyme catalase in pine needles to impede newly hatched sawfly larval herbivory [43]. Phloem-feeding insects (e.g., aphids) have also been found to enhance the accumulation of reactive oxygen species in the plants they infest [44]. In addition, reactive oxygen species’ accumulation plays a role in facilitating defense during compatible plant–virus interactions [45]. For example, vector-borne viruses can induce accumulation of reactive oxygen species (both H2O2 and O2•−) [46]. Here, we found that pea leaves infected with PEMV exhibited increased ROS accumulation, but the effect is more pronounced and distinctive in DAB staining (for detection of H2O2) particularly at the later time point (7 d post pea aphid removal) in combination with chewing pea leaf weevil herbivores that induced leaf defoliation. Although non-viruliferous pea aphids induced relatively lower levels of ROS deposition, pea leaf weevil herbivory alone did not show any visually detectable levels of ROS in damaged pea leaves (Figure 2). Reactive oxygen species are effective in combating biotic stressors by mediating oxidative damage to cells and through various non-oxidative pathways like cell death, and our study adds further evidence of how various biotic stressors can affect this key plant response [47,48,49].
Proliferation of pathogens, or damage from insects, can also lead to plants responding with cell death. Cell death is a type of hypersensitive response wherein plants induce rapid cell death within and around the affected area, sometimes manifested in the form of necrotic lesions, which can limit the proliferation of pathogens or further herbivore feeding. Conversely, necrosis is the result of cell death during disease development [50]. The induction of cell death thus serves as a rapid localized defense mechanism to prevent further damage from stress. Indeed, various studies have highlighted enhanced hypersensitive responses in infected leaves that are regulated by transcription factors or other crucial components of cell death [51,52,53]. For example, in pepper plants, both structural modifications and cell death are resistance responses to prevent infection from fungus, Colletotrichum gloeosporioides [54]. Similarly, cell death is a major plant defense mechanism against insect herbivory including phloem feeding (e.g., aphids). Cell death also interferes with the nutritional status of the host plant during plant–microbe interactions [55,56]. In our study, we observed the maximum cell death in pea plants infected with PEMV at the later time point, and the effect was further magnified in presence of pea leaf weevil herbivory. Both non-viruliferous pea aphids and weevil herbivory alone failed to exert any visually significant cell death induction detected through trypan blue staining (Figure 4).
Similar to the induction of physical and chemical defenses, the diversity and traits of biotic stressors play a key role in altering other plant phenotypic traits. High-throughput phenotyping has been used as an excellent tool to study viral infections and insect herbivory in plants [57,58]. Here, we used high-throughput phenotyping to demonstrate the negative effects of pea leaf weevil herbivory on leaf area (through leaf defoliation), although pea leaf weevils did not appear to strongly affect leaf greenness. In contrast, PEMV infection appeared to mainly reduce chlorophyll florescence without limiting leaf area, which is likely due to reduced photosynthetic efficiency by potentially interfering with photosynthetic machinery structures and functions at both early and late time points [59]. Other studies have similarly shown that virus infection can strongly impact photosynthetic efficiency by interacting with photosystem II regulation in plants [59,60]. By combining high-throughput phenotyping with other methods to explore plant chemical and physical defenses, our study provides a thorough view of how biotic stressors affect plant responses.
Our study of complex plant-mediated food web interactions involving a vector, a non-vector herbivore, and a plant pathogen highlights how these interactions can influence plant performance by differentially regulating various physical and chemical defense responses, as well as plant phenotypic traits. By inducing callose deposition, accumulation of reactive oxygen species, and cell death, plants restrict further damage by these attacking organisms. However, responses depend on the type of attacking organisms, indicating sensory mechanisms that plants use to distinguish the type of attack. Furthermore, changes in phenotypic traits help plants mitigate the effects of damage from biotic stressors. Our study highlights that interactions between plants, herbivores, and pathogens are highly complex, and factorial experiments that manipulate the diversity and order of attack of stressors are necessary to understand mechanistic details of such interactions. Further development of phenotyping facilities will allow for an even greater examination of such interactions in many other crop systems.

5. Conclusions

Our study shows how different biotic stressors, including herbivores and pathogens, can differentially affect plant physical and chemical defenses and phenotypic responses due to the fundamental differences in damage caused by insects (both piercing–sucking and chewing) and viruses. Piercing–sucking insects feed on phloem sap through their modified mouth part (also called the stylet), and sometimes serve as vectors by transmitting pathogens; chewing insects are mostly non-vectors, and damage plants through leaf defoliation of feeding on various other parts of the plant, including roots. Our study shows that plants respond in unique ways to chewing vs. piercing–sucking herbivores, and pathogens induce different pathways than herbivores. Moreover, we show that while chewing herbivores had strong effects on leaf area (due to severe leaf defoliation) but not photosynthetic efficiency, piercing–sucking herbivores and viruses tended to affect photosynthesis without altering leaf area (by interfering with the structures and functions of photosynthetic machinery). Assessing the traits and complexity of invading stressors and damage caused by them in any given plant system is necessary to understand the mechanistic factors that underlie plant responses to stress. More broadly, understanding the mechanisms that shape food web interactions involving plants, insects, and pathogens can aid in the development of sustainable and robust pest and pathogen management strategies.

Author Contributions

Conceptualization, S.B. and D.W.C.; Methodology, S.B., N.M., K.T. and D.W.C.; Software, L.O. and C.W.B.; Validation, S.B., K.T. and D.W.C.; Formal analysis, S.B., B.W.L., K.T., C.W.B. and D.W.C.; Investigation, S.B., K.T. and D.W.C.; Resources, S.B., K.T. and D.W.C.; Writing—original draft, S.B., K.T. and D.W.C.; Writing—review & editing, S.B., N.M., K.T., L.O. and D.W.C.; Visualization, S.B., N.M., K.T. and D.W.C.; Supervision, K.T. and D.W.C.; Project administration, S.B., K.T. and D.W.C.; Funding acquisition, D.W.C. All authors have read and agreed to the published version of the manuscript.

Funding

This research was supported by National Institute of Food and Agriculture # 2016-67011-24693 and National Institute of Food and Agriculture # 2017-67013-26537.

Institutional Review Board Statement

Not applicable.

Data Availability Statement

The data that support the findings of this study are available on request from the corresponding author.

Conflicts of Interest

The authors declare no conflict of interest.

References

  1. Pandey, P.; Ramegowda, V.; Senthil-Kumar, M. Shared and unique responses of plants to multiple individual stresses and stress combinations: Physiological and molecular mechanisms. Front. Plant Sci. 2015, 6, 723. [Google Scholar] [CrossRef]
  2. Miller, R.N.G.; Costa Alves, G.S.; Van Sluys, M.A. Plant immunity: Unravelling the complexity of plant responses to biotic stresses. Ann. Bot. 2017, 119, 681–687. [Google Scholar] [CrossRef]
  3. Basu, S.; Kushwaha, N.K.; Singh, A.K.; Sahu, P.P.; Kumar, R.V.; Chakraborty, S. Dynamics of a geminivirus-encoded pre-coat protein and host RNA-dependent RNA polymerase 1 in regulating symptom recovery in tobacco. J. Exp. Bot. 2018, 69, 2085–2102. [Google Scholar] [CrossRef]
  4. Basu, S.; Varsani, S.; Louis, J. Altering plant defenses: Herbivore-associated molecular patterns and effector arsenal of chewing herbivores. Mol. Plant-Microbe Interact. 2018, 31, 13–21. [Google Scholar] [CrossRef] [PubMed]
  5. Thaler, J.S.; Humphrey, P.T.; Whiteman, N.K. Evolution of jasmonate and salicylate signal crosstalk. Trends Plant Sci. 2012, 17, 260–270. [Google Scholar] [CrossRef] [PubMed]
  6. Nejat, N.; Mantri, N. Plant immune system: Crosstalk between responses to biotic and abiotic stresses the missing link in understanding plant defence. Curr. Issues Mol. Biol. 2017, 23, 1–16. [Google Scholar] [CrossRef] [PubMed]
  7. Basu, S.; Clark, R.E.; Bera, S.; Casteel, C.L.; Crowder, D.W. Responses of pea plants to multiple antagonists are mediated by order of attack and phytohormone crosstalk. Mol. Ecol. 2021, 30, 4939–4948. [Google Scholar] [CrossRef]
  8. Koornneef, A.; Pieterse, C.M.J. Cross talk in defense signaling. Plant Physiol. 2008, 146, 839–844. [Google Scholar] [CrossRef]
  9. Castro, B.; Citterico, M.; Kimura, S.; Stevens, D.M.; Wrzaczek, M.; Coaker, G. Stress-induced reactive oxygen species compartmentalization, perception and signaling. Nat. Plants 2021, 7, 403–412. [Google Scholar] [CrossRef]
  10. Wang, Y.; Li, X.; Fan, B.; Zhu, C.; Chen, Z. Regulation and function of defense-related callose deposition in plants. Int. J. Mol. Sci. 2021, 22, 2393. [Google Scholar] [CrossRef]
  11. Wang, B.; Andargie, M.; Fang, R. The function and biosynthesis of callose in high plants. Heliyon 2022, 8, e09248. [Google Scholar] [CrossRef] [PubMed]
  12. Hao, P.; Liu, C.; Wang, Y.; Chen, R.; Tang, M.; Du, B.; Zhu, L.; He, G. Herbivore-induced callose deposition on the sieve plates of rice: An important mechanism for host resistance. Plant Physiol. 2008, 146, 1810–1820. [Google Scholar] [CrossRef] [PubMed]
  13. Huang, W.; Reyes-Caldas, P.; Mann, M.; Seifbarghi, S.; Kahn, A.; Almeida, R.P.P.; Béven, L.; Heck, M.; Hogenhout, S.A.; Coaker, G. Bacterial vector-borne plant diseases: Unanswered questions and future directions. Mol. Plant 2020, 13, 1379–1393. [Google Scholar] [CrossRef] [PubMed]
  14. Petrov, V.; Hille, J.; Mueller-Roeber, B.; Gechev, T.S. ROS-mediated abiotic stress-induced programmed cell death in plants. Front. Plant Sci. 2015, 6, 69. [Google Scholar] [CrossRef] [PubMed]
  15. Burke, R.; Schwarze, J.; Sherwood, O.L.; Jnaid, Y.; McCabe, P.F.; Kacprzyk, J. Stressed to Death: The role of transcription factors in plant programmed cell death induced by abiotic and biotic stimuli. Front. Plant Sci. 2020, 11, 1235. [Google Scholar] [CrossRef]
  16. Kumudini, S.; Savita, V.P. Antioxidant-mediated defense in triggering resistance against biotic stress in plants. In Biocontrol Agents and Secondary Metabolites, 1st ed.; Woodhead Publishing: Sawston, UK, 2021; pp. 383–399. [Google Scholar]
  17. Marcec, M.J.; Gilroy, S.; Poovaiah, B.W.; Tanaka, K. Mutual interplay of Ca2+ and ROS signaling in plant immune response. Plant Sci. 2019, 283, 343–354. [Google Scholar] [CrossRef]
  18. Pérez-Bueno, M.L.; Pineda, M.; Barón, M. Phenotyping plant responses to biotic stress by chlorophyll fluorescence imaging. Front. Plant Sci. 2019, 10, 1135. [Google Scholar] [CrossRef]
  19. González Guzmán, M.; Cellini, F.; Fotopoulos, V.; Balestrini, R.; Arbona, V. New approaches to improve crop tolerance to biotic and abiotic stresses. Physiol. Plant. 2022, 174, e13547. [Google Scholar] [CrossRef]
  20. Rousseau, C.; Belin, E.; Bove, E.; Rousseau, D.; Fabre, F.; Berruyer, R.; Guillaumès, J.; Manceau, C.; Jacques, M.A.; Boureau, T. High throughput quantitative phenotyping of plant resistance using chlorophyll fluorescence image analysis. Plant Methods 2013, 9, 17. [Google Scholar] [CrossRef]
  21. Zhang, C.; Zhou, L.; Xiao, Q.; Bai, X.; Wu, B.; Wu, N.; Zhao, Y.; Wang, J.; Feng, L. End-to-end fusion of hyperspectral and chlorophyll fluorescence imaging to identify rice stresses. Plant Phenomics 2022, 2022, 9851096. [Google Scholar] [CrossRef]
  22. Clark, R.E.; Basu, S.; Eigenbrode, S.D.; Oeller, L.C.; Crowder, D.W. Risk assessment for non-crop hosts of pea enation mosaic virus and the aphid vector Acyrthosiphon pisum. Agric. For. Entomol. 2013, 25, 427–434. [Google Scholar] [CrossRef]
  23. Chisholm, P.J.; Sertsuvalkul, N.; Casteel, C.L.; Crowder, D.W. Reciprocal plant-mediated interactions between a virus and a non-vector herbivore. Ecology 2018, 99, 2139–2144. [Google Scholar] [CrossRef]
  24. Cárcamo, H.A.; Vankosky, M.A.; Wijerathna, A.; Olfert, O.O.; Meers, S.B.; Evenden, M.L. Progress toward integrated pest management of pea leaf weevil: A review. Ann. Entomol. Soc. Am. 2018, 111, 144–153. [Google Scholar] [CrossRef]
  25. Chisholm, P.J.; Eigenbrode, S.D.; Clark, R.E.; Basu, S.; Crowder, D.W. Plant-mediated interactions between a vector and a non-vector herbivore promote the spread of a plant virus. Proc. R. Soc. B Biol. Sci. 2019, 286, 20191383. [Google Scholar] [CrossRef] [PubMed]
  26. Black, A.E.; Strand, E.; Wright, R.G.; Scott, J.M.; Morgan, P.; Watson, C. Land use history at multiple scales: Implications for conservation planning. Landsc. Urban Plan. 1998, 43, 49–63. [Google Scholar] [CrossRef]
  27. National Library of Medicine, National Center for Biotechnology Information. Basic Local Alignment Search Tool (BLAST). 2023. Available online: https://blast.ncbi.nlm.nih.gov/Blast.cgi (accessed on 24 September 2023).
  28. Schenk, S.T.; Schikora, A. Staining of callose depositions in root and leaf tissues. Bio-Protocol 2015, 5, e1429. [Google Scholar] [CrossRef]
  29. Yang, C.Y.; Hong, C.P. The NADPH oxidase Rboh D is involved in primary hypoxia signalling and modulates expression of hypoxia-inducible genes under hypoxic stress. Environ. Exp. Bot. 2015, 115, 63–72. [Google Scholar] [CrossRef]
  30. Mason, G.A.; Lemus, T.; Queitsch, C. The mechanistic underpinnings of an ago1-mediated, environmentally dependent, and stochastic phenotype. Plant Physiol. 2016, 170, 2420–2431. [Google Scholar] [CrossRef]
  31. van Geem, M.; Gols, R.; Raaijmakers, C.E.; Harvey, J.A. Effects of population-related variation in plant primary and secondary metabolites on aboveground and belowground multitrophic interactions. Chemoecology 2016, 26, 219–233. [Google Scholar] [CrossRef]
  32. Shikano, I. Evolutionary ecology of multitrophic interactions between plants, insect herbivores and entomopathogens. J. Chem. Ecol. 2017, 43, 586–598. [Google Scholar] [CrossRef]
  33. Luna, E.; Pastor, V.; Robert, J.; Flors, V.; Mauch-Mani, B.; Ton, J. Callose deposition: A multifaceted plant defense response. Mol. Plant-Microbe Interact. 2011, 24, 183–193. [Google Scholar] [CrossRef] [PubMed]
  34. Chen, X.Y.; Kim, J.Y. Callose synthesis in higher plants. Plant Signal. Behav. 2009, 4, 489–492. [Google Scholar] [CrossRef] [PubMed]
  35. Sun, T.; Sun, X.; Li, F.; Ma, N.; Wang, M.; Chen, Y.; Liu, N.; Jin, Y.; Zhang, J.; Hou, C.; et al. H2O2 mediates transcriptome reprogramming during soybean mosaic virus-induced callose deposition in soybean. Crop J. 2022, 10, 262–272. [Google Scholar] [CrossRef]
  36. Mbiza, N.I.T.; Hu, Z.; Zhang, H.; Zhang, Y.; Luo, X.; Wang, Y.; Wang, Y.; Liu, T.; Li, J.; Wang, X.; et al. GhCalS5 is involved in cotton response to aphid attack through mediating callose formation. Front. Plant Sci. 2022, 13, 892630. [Google Scholar] [CrossRef]
  37. Erb, M.; Reymond, P. Molecular interactions between plants and insect herbivores. Annu. Rev. Plant Biol. 2019, 29, 527–557. [Google Scholar] [CrossRef]
  38. Ye, M.; Glauser, G.; Lou, Y.; Erb, M.; Hu, L. Molecular dissection of early defense signaling underlying volatile-mediated defense regulation and herbivore resistance in rice. Plant Cell 2019, 31, 687–698. [Google Scholar] [CrossRef]
  39. Li, J.; Liu, X.; Wang, Q.; Huangfu, J.; Schuman, M.C.; Lou, Y. A group d MAPK protects plants from autotoxicity by suppressing herbivore-induced defense signaling. Plant Physiol. 2019, 179, 1386–1401. [Google Scholar] [CrossRef]
  40. Yi, G.; Wu, W.; Wei, T. Delivery of Rice Gall Dwarf Virus into plant phloem by its leafhopper vectors activates callose deposition to enhance viral transmission. Front. Microbiol. 2021, 12, 662577. [Google Scholar] [CrossRef]
  41. Chowdhury, R.N.; Lasky, D.; Karki, H.; Zhang, Z.; Goyer, A.; Halterman, D.; Rakotondrafara, A.M. HCPro suppression of callose deposition contributes to strain-specific resistance against potato virus Y. Phytopathology 2020, 110, 164–173. [Google Scholar] [CrossRef]
  42. Ellinger, D.; Naumann, M.; Falter, C.; Zwikowics, C.; Jamrow, T.; Manisseri, C.; Somerville, S.C.; Voigt, C.A. Elevated early callose deposition results in complete penetration resistance to powdery mildew in Arabidopsis. Plant Physiol. 2013, 161, 1433–1444. [Google Scholar] [CrossRef]
  43. Bittner, N.; Hundacker, J.; Achotegui-Castells, A.; Anderbrant, O.; Hilker, M. Defense of Scots pine against sawfly eggs (Diprion pini) is primed by exposure to sawfly sex pheromones. Proc. Natl. Acad. Sci. USA 2019, 116, 24668–24675. [Google Scholar] [CrossRef] [PubMed]
  44. Goggin, F.L.; Fischer, H.D. Reactive oxygen species in plant interactions with aphids. Front. Plant Sci. 2022, 12, 811105. [Google Scholar] [CrossRef] [PubMed]
  45. Hernández, J.A.; Gullner, G.; Clemente-Moreno, M.J.; Künstler, A.; Juhász, C.; Díaz-Vivancos, P.; Király, L. Oxidative stress and antioxidative responses in plant–virus interactions. Physiol. Mol. Plant Pathol. 2016, 94, 134–148. [Google Scholar] [CrossRef]
  46. Guo, H.; Gu, L.; Liu, F.; Chen, F.; Ge, F.; Sun, Y. Aphid-borne viral spread Is enhanced by virus-induced accumulation of plant reactive oxygen species. Plant Physiol. 2019, 179, 143–155. [Google Scholar] [CrossRef]
  47. Wagner, D.; Przybyla, D.; op den Camp, R.; Kim, C.; Landgraf, F.; Lee, K.P.; Würsch, M.; Laloi, C.; Nater, M.; Hideg, E.; et al. The genetic basis of singlet oxygen–induced stress responses of Arabidopsis thaliana. Science 2004, 306, 1183–1185. [Google Scholar] [CrossRef]
  48. Van Breusegem, F.; Dat, J.F. Reactive oxygen species in plant cell death. Plant Physiol. 2006, 141, 384–390. [Google Scholar] [CrossRef]
  49. Paiva, C.N.; Bozza, M.T. Are reactive oxygen species always detrimental to pathogens? Antioxid. Redox Signal. 2014, 20, 1000–1037. [Google Scholar] [CrossRef]
  50. Balint-Kurti, P. The plant hypersensitive response: Concepts, control and consequences. Mol. Plant Pathol. 2019, 20, 1163–1178. [Google Scholar] [CrossRef]
  51. Wang, H.; Lin, J.; Chang, Y.; Jiang, C.Z. Comparative transcriptomic analysis reveals that ethylene/H2O2-mediated hypersensitive response and programmed cell death determine the compatible interaction of sand pear and Alternaria alternata. Front. Plant Sci. 2017, 8, 195. [Google Scholar] [CrossRef]
  52. Jeblick, T.; Leisen, T.; Steidele, C.E.; Albert, I.; Müller, J.; Kaiser, S.; Mahler, F.; Sommer, F.; Keller, S.; Hückelhoven, R.; et al. Botrytis hypersensitive response inducing protein 1 triggers noncanonical PTI to induce plant cell death. Plant Physiol. 2023, 191, 125–141. [Google Scholar] [CrossRef]
  53. Salguero-Linares, J.; Coll, N.S. Cell death as a defense strategy against pathogens in plants and animals. PLoS Pathog. 2023, 19, e1011253. [Google Scholar] [CrossRef] [PubMed]
  54. Kim, K.H.; Yoon, J.B.; Park, H.G.; Park, E.W.; Kim, Y.H. Structural modifications and programmed cell death of chili pepper fruit related to resistance responses to Colletotrichum gloeosporioides infection. Phytopathology 2004, 94, 1295–1304. [Google Scholar] [CrossRef] [PubMed]
  55. Goggin, F.L. Plant-aphid interactions: Molecular and ecological perspectives. Curr. Opin. Plant Biol. 2007, 10, 399–408. [Google Scholar] [CrossRef] [PubMed]
  56. Mur, L.A.; Kenton, P.; Lloyd, A.J.; Ougham, H.; Prats, E. The hypersensitive response; the centenary is upon us but how much do we know? J. Exp. Bot. 2007, 59, 501–520. [Google Scholar] [CrossRef] [PubMed]
  57. Goggin, F.L.; Lorence, A.; Topp, C.N. Applying high-throughput phenotyping to plant–insect interactions: Picturing more resistant crops. Curr. Opin. Insect Sci. 2015, 9, 69–76. [Google Scholar] [CrossRef] [PubMed]
  58. Wang, L.; Poque, S.; Valkonen, J.P.T. Phenotyping viral infection in sweet potato using a high-throughput chlorophyll fluorescence and thermal imaging platform. Plant Methods 2019, 15, 116. [Google Scholar] [CrossRef]
  59. Rahoutei, J.; García-Luque, I.; Barón, M. Inhibition of photosynthesis by viral infection: Effect on PSII structure and function. Physiol. Plant. 2000, 110, 286–292. [Google Scholar] [CrossRef]
  60. Farooq, T.; Liu, D.; Zhou, X.; Yang, Q. Tomato Yellow Leaf Curl China Virus impairs photosynthesis in the infected Nicotiana benthamiana with βC1 as an aggravating factor. Plant Pathol. J. 2019, 35, 521–529. [Google Scholar] [CrossRef]
Figure 1. Callose deposition visualized using aniline blue staining. Leaves were collected from 2-week-old peas at 3- and 7 days post infection (dpi) with various combinations of biotic stressors (C = control; SA = non-viruliferous [sham] pea aphid; PA = viruliferous pea aphid; W = weevil; WSA = weevil + sham aphid; WPA = weevil + viruliferous pea aphid). Callose spots (white) on a blue background were observed under microscopy following 0.01% aniline blue staining.
Agriculture 13 02093 g001
Figure 2. Detection of H2O2 with 3,3′-diaminobenzidine (DAB) staining. Leaves were collected from 2-week-old peas at 3 d and 7 d post infection (dpi) with various combinations of biotic stressors (C = control; SA = non-viruliferous [sham] pea aphid; PA = viruliferous pea aphid; W = weevil; WSA = weevil + sham aphid; WPA = weevil + viruliferous pea aphid). In the stained leaf tissues, H2O2 was visualized as reddish-brown coloration under microscopy.
Agriculture 13 02093 g002
Figure 3. Nitro blue tetrazolium chloride (NBT) staining for the detection of reactive oxygen species (O2•−) from detached pea leaves in response to various combinations of biotic stressors (C = control; SA = non-viruliferous [sham] pea aphid; PA = viruliferous pea aphid; W = weevil; WSA = weevil + sham aphid; WPA = weevil + viruliferous pea aphid) at early and late time points (3 dpi and 7 dpi).
Agriculture 13 02093 g003
Figure 4. Detecting dead cells generated from cell death visualized using trypan blue staining. Leaves were collected from 2-week-old peas at 3 d and 7 d post infection (dpi) with various combinations of biotic stressors (C = control; SA = non-viruliferous [sham] pea aphid; PA = viruliferous pea aphid; W = weevil; WSA = weevil + sham aphid; WPA = weevil + viruliferous pea aphid). Cell death was observed as blue patches under microscopy.
Agriculture 13 02093 g004
Figure 5. (A) High-throughput phenotyping (HTP) analysis of average leaf area from detached pea leaves 3 days post infection (dpi); (B) HTP analysis of chlorophyll fluorescence from detached pea leaves 3 dpi; (C) HTP analysis of average leaf area from detached pea leaves 7 dpi; (D) HTP analysis of chlorophyll fluorescence from detached pea leaves 7 dpi. These HTP analyses were all in response to various combinations of biotic stressors (C = control; SA = non-viruliferous [sham] pea aphid; PA = viruliferous pea aphid; W = weevil; WSA = weevil + sham aphid; WPA = weevil + viruliferous pea aphid). The analysis was performed using two different cameras (RGB and fluorescent). Bars not connected by the same letter indicate significant differences based on post hoc tests from the individual ANOVA models (Tukey’s HSD tests).
Agriculture 13 02093 g005
Table 1. Primer pair used in this study.
GenePrimer Sequences (5′-3′)Amplicon Size (bp)
PEMP CP Fp
PEMP CP Rp
GTGGTGGCACCCTCTATG
GTGTCCACATGGTAGGCTATG
290
Disclaimer/Publisher’s Note: The statements, opinions and data contained in all publications are solely those of the individual author(s) and contributor(s) and not of MDPI and/or the editor(s). MDPI and/or the editor(s) disclaim responsibility for any injury to people or property resulting from any ideas, methods, instructions or products referred to in the content.

