Article

Genetic Diversity of Black Amaranth (Amaranthus quitensis Kunth) Landraces of Ecuadorian Highlands: Association Genotypes—Color Morphotypes

by
Hipatia Delgado
and
Juan Pedro Martín
*
Departamento de Biotecnología-Biología Vegetal, Escuela Técnica Superior de Ingeniería Agronómica, Alimentaria y de Biosistemas, Universidad Politécnica de Madrid, Avda. Puerta de Hierro 2-4, 28040 Madrid, Spain
*
Author to whom correspondence should be addressed.
Agriculture 2023, 13(1), 34; https://doi.org/10.3390/agriculture13010034
Submission received: 23 November 2022 / Revised: 20 December 2022 / Accepted: 21 December 2022 / Published: 22 December 2022

Abstract

:
Black amaranth (Amarantus quitensis Kunth) is an ancestral crop of the Ecuadorian Andean region, where traditionally it is called ataco or sangorache. Nowadays, there is some information about the phenotypic diversity of black amaranth landraces, but there are no data about their genetic diversity. In this study, we evaluated the genetic diversity of 139 black amaranth accessions collected twice (1981–1986 and 2014–2015) in three representative Ecuadorian Andean provinces for this crop (Imbabura, Tungurahua, and Cañar) using nine simple sequence repeats (SSR) markers. We detected low genetic diversity levels; only a total of 36 alleles were amplified in 139 accessions, with a mean allelic richness of 4.0 per marker, observed heterozygosity of 0.014, expected heterozygosity of 0.134, and Shannon’s information index of 0.297. In addition, only 17 genotypes were found, with a predominant genotype (83.6%) and up to 12 accession-unique genotypes. Moreover, a certain genetic diversity decrease was observed over the last decades, especially in Tungurahua and Cañar, where today practically only the predominant genotype exists. The ataco germplasm is genetically structured into two well-defined genotype clusters and could constitute two different genetic lineages. Furthermore, a clear association of each genotype group with a different color morphotype defined in a previous agromorphological characterization was observed. The accessions of the majority group of genotypes showed purple pigmentation in stems, leaves, and inflorescences, whereas those of the other genotype group showed less intense pigmentation (pink stems, inflorescences, and green leaves). Molecular information obtained in this study may be useful for the suitable management and conservation of this underutilized genetic plant resource that is of great food and cultural significance for indigenous farming communities of the Ecuadorian highlands.

1. Introduction

The genus Amaranthus L. (Caryophyllales: Amaranthaceae Juss.) comprises about 70 species of C4 dicotyledonous annual plants with a worldwide distribution, although most species are found in temperate and tropical or subtropical regions [1,2]. Approximately 60 species are native to the Americas, and the rest originated from Asia, Africa, Europe, and Australia [1,3].
Amaranth has an origin of approximately 8000 years B.C. in Central and South America [4], and has been domesticated and cultivated for more than 4000 years in Mesoamerica and the Andes mountain region, from where it probably spread to other parts of the world [5,6]. A key domestication trait is the seed color, which changes from dark seeds in wild species to white seeds in most cultivated species [7,8]. Regarding the genome, the genus Amaranthus originally underwent a process of allotetraploidization, although today most species inherit their chromosomes as diploids (2 n = 4X = 32 or 34; [9]).
The major cultivated amaranth species are A. caudatus L., A. cruentus L., and A. hypochondriacus L., that together with A. hybridus L., A. quitensis Kunth, and A. powellii S. Wats. constitute the so-called complex Hybridus [2,10,11]. A. quitensis is only distributed in South America and has been considered a semi-cultivated species, being in an incipient state of domestication [1]. In the Ecuadorian Andean region, A. quitensis is traditionally called ataco, sangorache, or simply black amaranth, and plants are usually red or purple in color and produce black seeds [12].
Nowadays, amaranths are gaining importance in human and animal nutrition [13]. They have high levels of seed protein content with a balanced amino acid composition [14] so their nutritional properties have been considered a strategic crop for food security by the Food and Agriculture Organization of the United Nations (FAO) [15]. Amaranths also have low gluten content, making them suitable as cereal replacements for patients with celiac disease [16]. Additionally, amaranths have a relatively high tolerance to biotic and abiotic stresses, showing good adaptability to severe conditions and the absence of major diseases [14,17,18]. In the case of black amaranth, in addition to showing high and quality seed protein content (13–17% of dry weight) [19], the extraction of natural dyes has great agro-industrial potential since they can be used as food ingredients (in confectionery, preparation of beverages, ice creams, or jams) and in pharmacology, because they contain amaranthine, a betacyanin with a high antioxidant capacity [12,20].
The black amaranth is an ancestral crop that had great importance in the diet of the pre-Hispanic Andean populations, which used seeds and leaves for food [12], but amaranth cultivation rapidly declined after the Spanish conquest of the Americas [8]. Currently, ataco is cultivated on a small scale in the Ecuadorian highlands, but this underutilized crop has great social, cultural, and food importance for the native population [21,22]. Andean farmers use the leaves and inflorescences of ataco to make infusions as natural medicine. The inflorescence is also used to extract dyes that are used in the preparation of traditional beverages in many Andean provinces, such as “colada morada”, “horchata”, or “draque” [12,23]. Nowadays, black amaranth grain is also beginning to be used in traditional Ecuadorian gastronomy [24]. Furthermore, similar to other amaranth species, ataco is cultivated as an ornamental plant in home gardens and parks, because its inflorescence has showy coloration and varied shapes [12,25].
In the last decades, the landraces from traditional crops of Ecuadorian highlands seem to be suffering a process of genetic erosion due essentially to factors such as progressive abandonment of traditional agricultural landscapes due to rural population migration, reduction in agricultural production to few crops, changes in eating habits, low product prices, inadequate access routes, or unfavorable marketing policies [22,26]. Therefore, information on the biodiversity (phenotypic and genetic) present in landraces of underutilized crops is an essential prerequisite for the efficient management and conservation of these plant genetic resources [27,28,29]. On the other hand, the germplasm grown by local farmers could contain landraces with some interesting phenotypes or genotypes for future breeding programs [28].
Regarding the phenotypic diversity studies in black amaranth, Mazón et al. [30] carried out the agromorphological characterization of accessions collected throughout the inter-Andean corridor between 1981 and 1986 in order to select promising lines for future breeding programs. Subsequently, that information on morphological diversity was used to generate a core collection [31]. Recently, Delgado et al. [32] have characterized the phenotypic diversity of ataco landraces collected during 2014–2015 in three provinces of the Ecuadorian highlands that have a greater representation of this crop (Imbabura, Tungurahua, and Cañar), comparing it with the agromorphological diversity of accessions collected in the early 1980s in the same provinces.
On the other hand, there are no specific studies in order to evaluate the genetic diversity in landraces of black amaranth. However, there is substantial research in which different types of molecular markers have been used to genetically characterize the germplasm of grain amaranth species and their wild relatives: PCR-Restriction Fragment Length Polymorphisms (PCR-RFLPs) [33], Random Amplified Polymorphic DNAs (RAPDs) [34,35,36], Amplified Fragment Length Polymorphisms (AFLPs) [37,38], Inter-Simple Sequence Repeats (ISSRs) [39,40,41], Microsatellites or Simple Sequence Repeats (SSRs) [6,10,42], and Single Nucleotide Polymorphisms (SNPs) [11,43,44,45].
SSR markers are a particularly powerful tool used most widely to characterize crop germplasms because of their abundance, high transferability to related species, co-dominance, and a greater degree of polymorphism provided by a large number of alleles per locus [28,46]. Microsatellite markers have been developed for the genus Amaranthus by Mallory et al. [47] and Lee et al. [48] on the basis of the genomic DNA of A. hypochondriacus, and they have successfully amplified in other amaranth species. Several studies to assess the genetic and structural diversity in different amaranth species have used many of these SSR markers [5,6,10,42,49,50]. Recently, Nguyen et al. [28] have also developed new SSR markers from the genome sequence of the A. tricolor cultivar ‘Biam’ to evaluate the genetic diversity of Vietnamese accessions of this species.
In this study, we used the microsatellite markers to assess the genetic diversity of black amaranth landraces collected at two different times in three representative provinces of Ecuadorian highlands. In this context, the diversity data sets were compared to determine genetic differences between collections and provinces in order to understand the genetic conservation status of this underutilized crop of the Ecuadorian Andean region. In addition, a possible association of the genetic diversity detected with the phenotypic diversity found in a previous study will be analyzed. This information can be very useful to develop suitable strategies for the conservation of this underutilized crop and can serve as a starting point for planning future amaranth breeding programs in Ecuador.

2. Materials and Methods
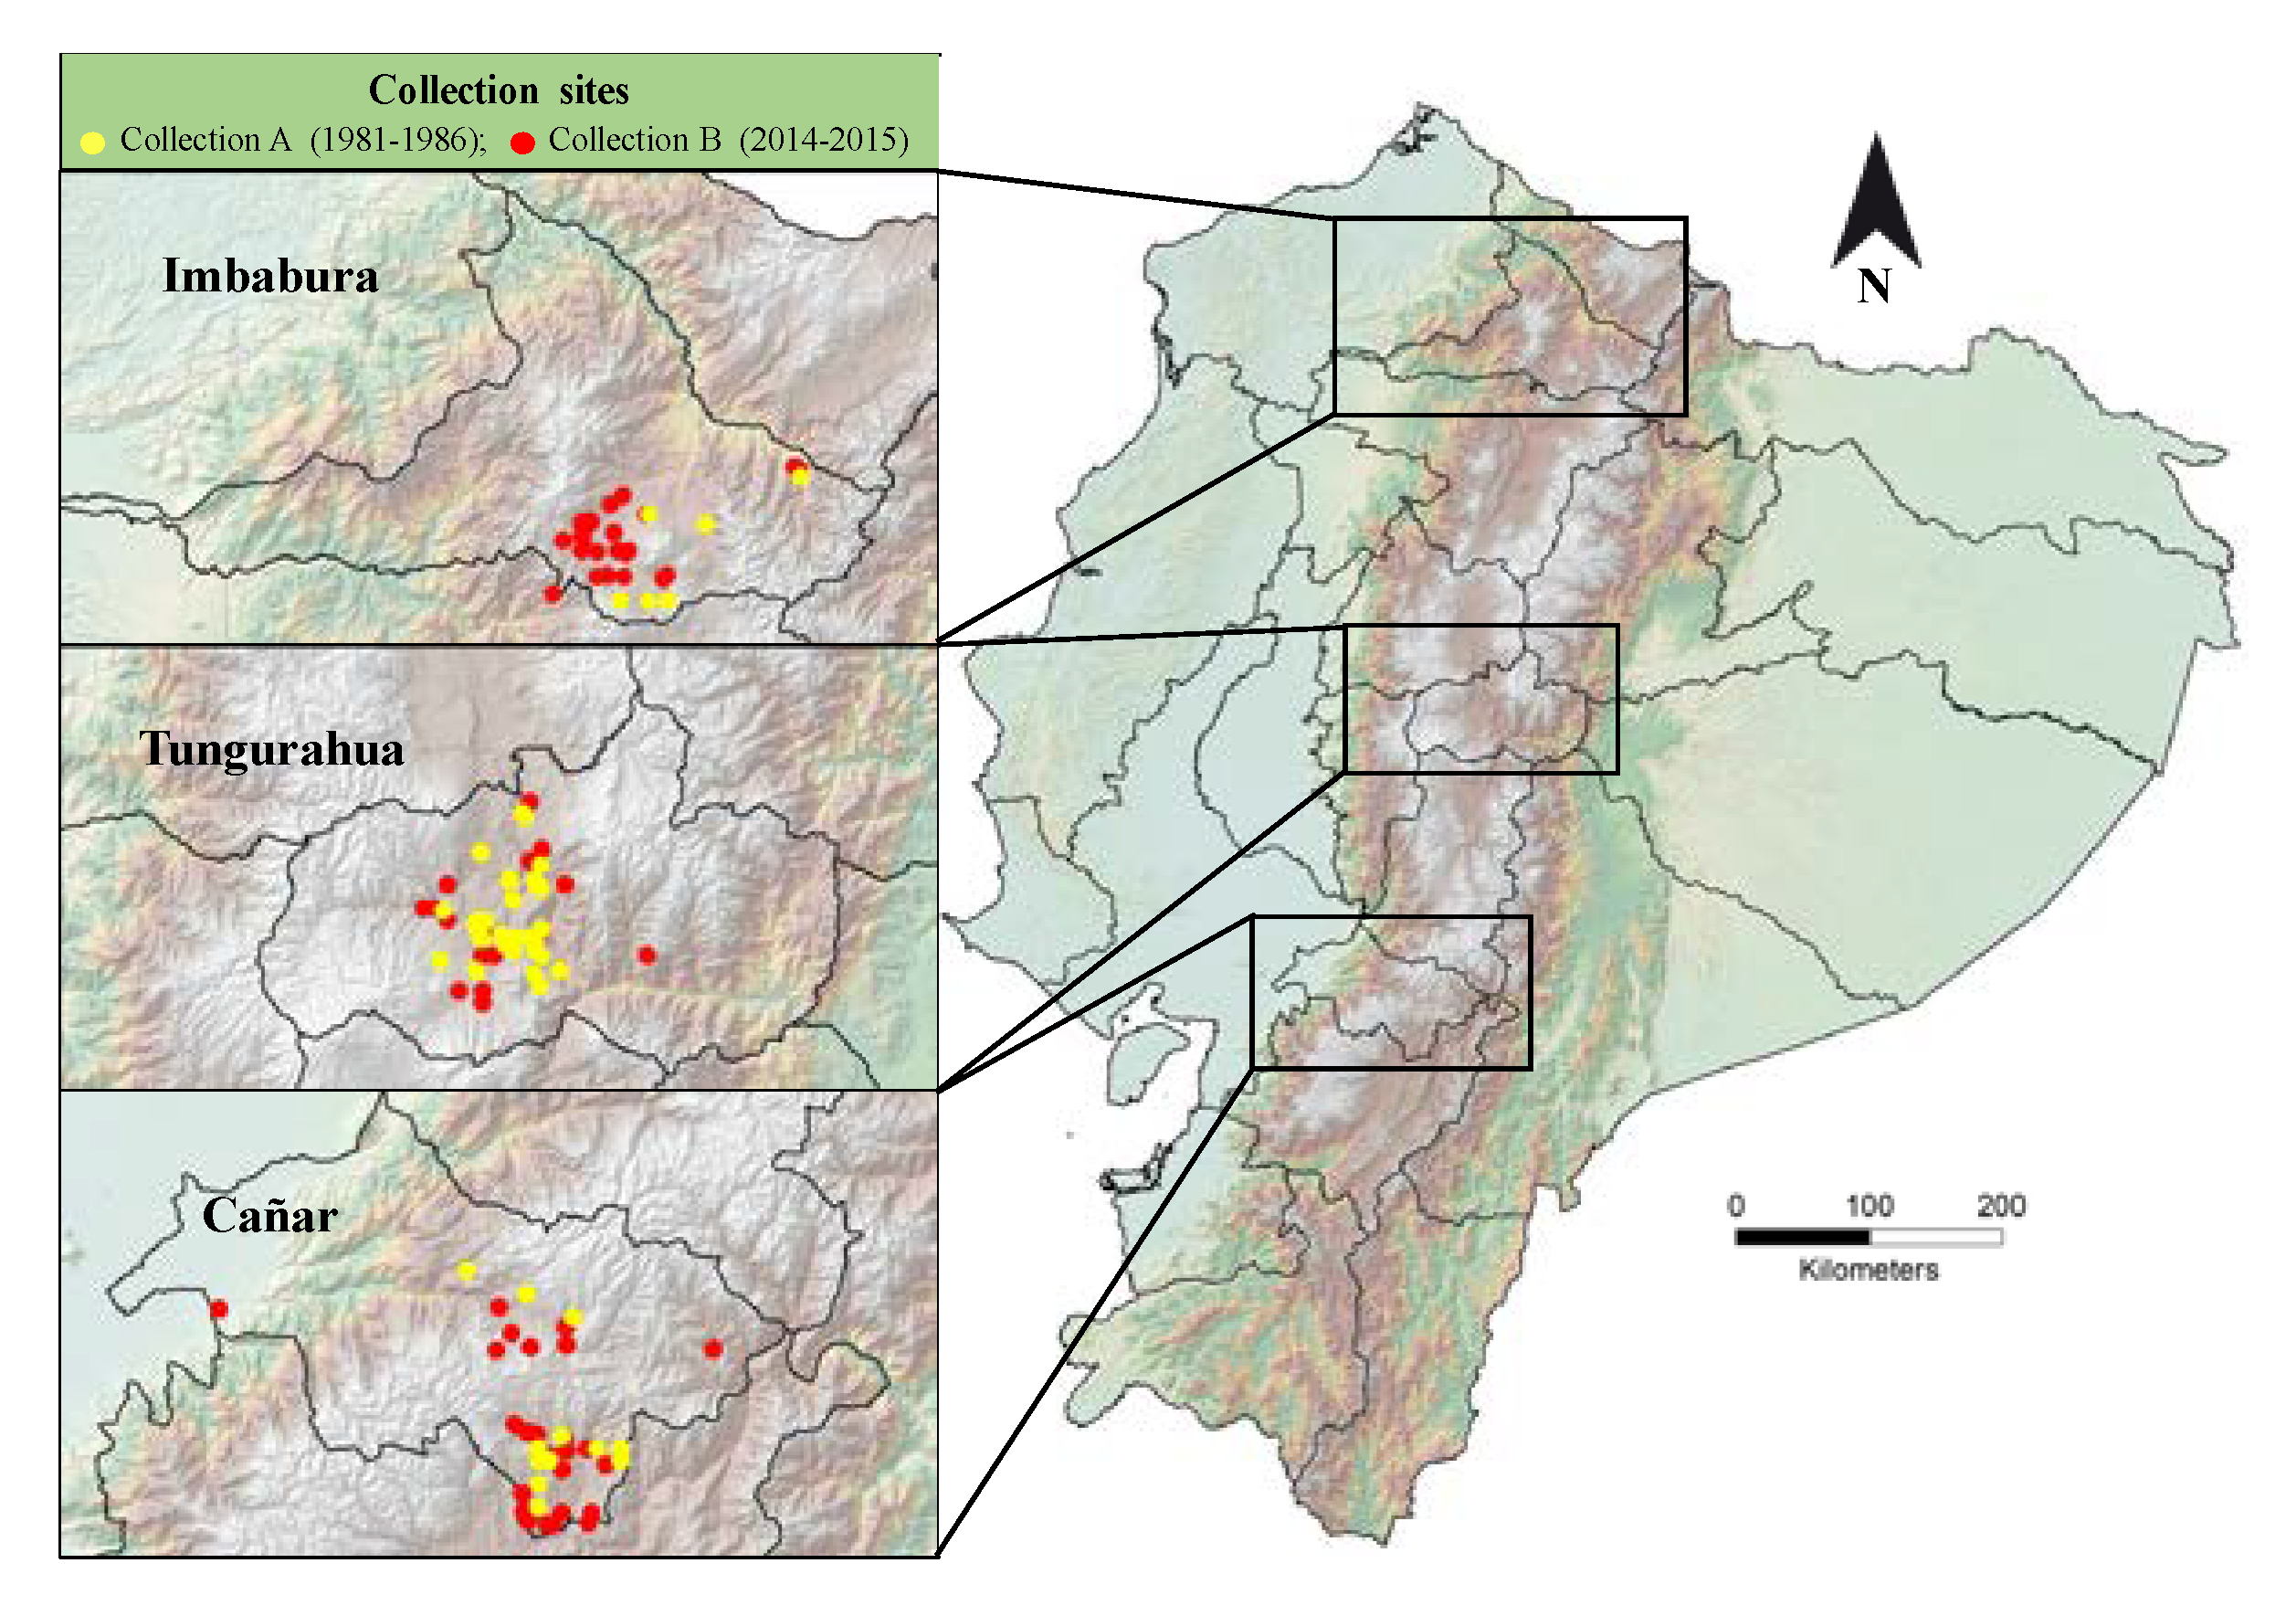
2.1. Plant Material

One hundred thirty-nine black amaranth (Amaranthus quitensis Kunth) landrace accessions were analyzed in this study, which were collected at two different times (“Collection A” was carried out between 1981 and 1986; “Collection B” was carried out in 2014 and 2015), both in three representative provinces of the Ecuadorian Andean region for this crop, in terms of cultivated area, production, consumption, and economic importance [30,51]: Imbabura, Tungurahua, and Cañar. Collection A was made up of 50 accessions (named A1 to A50): 9 in Imbabura, 24 in Tungurahua, and 17 in Cañar. Collection B was made up of 89 accessions (named A51 to A139): 29 in Imbabura, 31 in Tungurahua, and 29 in Cañar (see Figure 1 and Supplementary Table S1). The commercial variety INIAP-Alegría was also included in our analysis and was used as a reference to detect possible introgression of this improved germplasm in the landraces of black amaranth. These accessions were purchased at the Germplasm Bank (GB) of the National Institute for Agricultural Research (INIAP) in Pichincha, Ecuador. The INIAP-GB codes are indicated in Supplementary Table S1, and all passport data are found in Delgado et al. [32].

2.2. DNA Extraction and Microsatellite Genotyping

Leaf material was collected from five seedlings per accession (and for variety INIAP-Alegría) grown under greenhouse conditions during 20–24 days and was stored at −80 °C until DNA extraction. Total genomic DNA was extracted from about 100 mg of leaf tissue following the protocol supplied in the “NucleoSpin® Plant II Kit” (Macherey-Nagel GmbH & Co. KG, Düren, Germany). Quantification of the extracted DNA was carried out by visual comparison with known concentrations of lambda DNA on 1.2% (w/v) agarose gels, and a working solution of DNA (approx. 10 ng/µL) was made.
Thirty SSR loci were shortlisted among the approximately 200 polymorphic microsatellite markers previously developed and validated by Lee et al. [48] and Mallory et al. [47], taking into account the reported values of expected heterozygosity (He > 0.7) and the number of alleles per locus (>5), as well as their efficiency in other studies, to analyze the genetic diversity in different amaranth species/accessions. In a preliminary analysis, the 30 SSR loci were screened using 20 representative samples of our black amaranth landraces (three or four samples of each province/collection). Finally, nine of the 30 SSR markers were selected for use over the 139 accessions (695 samples), because they were the ones that presented analyzable amplified products, and in which some polymorphism was detected in the preliminary analysis. Table 1 summarizes forward and reverse primer sequences, repeat motifs, fluorescent dyes used to label at 5′ ends of the forward primer of each pair, and annealing temperatures for nine selected microsatellite loci.
Polymerase chain reactions (PCRs) were performed in 15 µL of final volume containing 20 ng of template DNA, 0.5 µM of each of the forward and reverse primers, 0.15 mM of each deoxynucleotide triphosphate (dNTP), 2 mM of MgCl2, and 1 U of Tth DNA polymerase in 1X of the manufacturer’s reaction buffer (BIOTOOLS, B&M Labs, Madrid, Spain). DNA amplifications were carried out in a PTC-100 thermalcycler (MJ Research, Inc., Waltham, MA, USA) with heated lid, using the same protocol for all microsatellite loci: an initial denaturalization step of 4 min at 94 °C, followed by 35 cycles of 45 s at 94 °C, 1 min at 50 or 52 °C (depending of the primer pair; see Table 1) and 1 min 10 s at 72 °C, with a final extension step of 72 °C for 5 min. Amplified products were resolved by capillary electrophoresis using an ABI PRISM® 3730 DNA analyzer (Applied Biosystems, Foster City, CA, USA). GeneScan-500 LIZ (Applied Biosystems, Foster City, CA, USA) was used as an internal size standard. Alleles were scored using Peak Scanner™ software version 1.0 (Applied Biosystems, Foster City, CA, USA).

2.3. Data Analysis

Genetic diversity parameters for the nine microsatellite loci were calculated based on data from all accessions studied, so for each locus: allele number (Na) and their frequencies, effective allele number (Ne), number of observed genotypes (Ng), observed (Ho) and expected (He) heterozygosity, and Shannon’s information index (I) were calculated using GenAlEx software version 6.5 [52]. Furthermore, the discrimination power (D; [53,54]) is an estimate of the probability that two randomly-sampled accessions could be distinguished by their microsatellite profiles and was calculated for each locus as D = 1—C, where C is the probability of coincidence, i.e., two samples match by chance at one locus (C = ΣPi2, and Pi is the frequency of different genotypes observed at that locus). The discrimination power for all loci combined (m = 9) was calculated as DT = 1—CT, where CT = ΠCm, and represents the probability of coincidence cumulative for all loci.
On the other hand, to analyze the genetic diversity among collections and among provinces of the same collection or the different collections, six groups of accessions were considered: Imbabura, Tungurahua, and Cañar from Collection A, and Imbabura, Tungurahua, and Cañar from Collection B. Thus, data from the overall microsatellite loci analyzed were used to calculate the percentage of polymorphic loci (P) and the number of allelic combinations over all loci (or genotypes, G) in each of these groups of accessions. Other parameters, such as the mean over all loci of Na, Ne, Ho, He, and I in each accession group, were also calculated using GenAlEx software. To detect significant differences in these parameters among different accession groups, the corresponding analysis of variance (ANOVA) was performed and means were compared using a Fisher’s least significant difference (LSD) test [55]. On the other hand, Nei’s genetic distances [56] among different groups of accessions considered were also calculated. Additionally, in order to determine the significance of partitioning of genetic diversity among and within collections/provinces/accessions, an analysis of molecular variance (AMOVA; [57]) was conducted using the GenAlEx package. Levels of significance of variance component estimates were computed by non-parametric permutational procedures using 10,000 random permutations.
Additionally, STRUCTURE software version 2.3.4 [58] was used to identify genetic groups in the ataco accessions studied. This Bayesian approach uses no a priori classification and assigns accessions to K genetic clusters based on the allele frequencies at each locus. The range of possible groups (K) tested varied from 1 to 10. The estimate of the most likely number of genetic groups was performed following the procedure of Evanno et al. [59], using the web of the Structure Harvester program (https://taylor0.biology.ucla.edu/structureHarvester/(accessed on 20 October 2022); [60]). Program settings used were the admixture ancestry and correlated allele frequencies models. The degree of admixture (alpha) was inferred from the data, and lambda, the parameter of the distribution of allelic frequencies, was set to 1 [59,61]. The program was run 20 independent times for each K value. In each run, a burn-in period of 10,000 iterations, and 100,000 post-burning MCMC (Markov chain Monte Carlo) simulations, were carried out. Finally, among the 20 runs performed for the optimal K value estimated, the run with the least negative log–likelihood value was used to obtain the assignation membership coefficients (Q) for each accession in each of the K inferred groups [62].
Likewise, a comparative analysis of the genetic diversity in the K-obtained groups of accessions was carried out. Thus, for each group, the mean values of Na, Ne, Ho, He, and I were calculated. To detect significant differences among groups, an ANOVA and a Fisher’s LSD test were carried out. Nei’s genetic distances among groups of accessions were also calculated. In addition, the partition of genetic diversity among groups, and among and within accessions of each group, was estimated by an AMOVA, estimating the variance components and their level of significance using a non-parametric procedure with 10,000 permutations. All these analyses were conducted using GenAlEx package. Furthermore, principal coordinates analysis (PCoA) of the different genotypes found in the 139 accessions analyzed was carried out. The genotypes found in the commercial variety INIAP-Alegría were included as a reference, in order to know their relationship with respect to genotypes of landraces. GenAlEx package was used to generate the matrix of squared distances between pairs of genotypes that were used to carry out the principal coordinates analysis. Finally, the matrix of squared distances among genotypes was also used to produce a minimum spanning tree (MST) of genotypes using the NTSYS-pc package version 2.20 [63], in order to verify the relationships among genotypes previously obtained in the analysis of principal coordinates.

3. Results

The alleles obtained for the nine microsatellite loci analyzed in the 139 accessions of black amaranth (A. quitensis) ordered by collections and provinces are shown in Supplementary Table S1. Considering the set of nine SSR loci, 17 different allelic combinations or genotypes (G1 to G17) have been found in the 139 accessions (i.e., 695 seedlings) analyzed. The same genotype was found for the five seedlings analyzed in 126 accessions, whereas in the remaining 13 accessions, two different genotypes were detected (see Supplementary Table S1). Thus, a total of 152 samples have been considered in the analyses of diversity and genetic structure, as they are 139 accessions but 13 of them showed two different genotypes.

3.1. Genetic Diversity

The results of the genetic diversity analysis carried out for the nine SSR loci in the 152 black amaranth samples considered are showed in Table 2. The alleles, as well as their frequencies, found in each of the nine SSR loci analyzed in the set of 152 samples, without considering the collection or the province of origin, are shown in Supplementary Table S2. In addition, Supplementary Table S3 shows the genotypes detected, and their frequencies, in each of the nine loci.
The number of alleles (Na) varied between 2 (loci 2_GB-AMM-099 and 4_AHAAC011) and 6 (loci 7_AHAAT051 and 8_AHAAT063), with a mean of 4.0 per locus and a cumulative of 36 alleles considering all loci (Table 2). One allele with a frequency greater than 90% was always found at all loci (see Supplementary Table S2). The number of genotypes (Ng) ranged from 3 (loci 2_GB-AMM-099 and 4_AHAAC011) to 6 (locus 9_AHAC062), with a mean of 4.3 per locus and a cumulative of 38 genotypes for all loci (Table 2). One genotype with a frequency greater than 90% was also found in each locus, coinciding with the homozygous genotype for the corresponding major allele (see Supplementary Table S2 and Table S3). On the other hand, it should be noted that 92.1% of the analyzed samples (140/152) presented the nine loci with homozygous genotypes and only the remaining 7.9% (12 samples) showed at least one heterozygous locus (see Supplementary Table S1).
The effective number of alleles (Ne) presented an average value of 1.155 per locus, varying between 1.118 for locus 4_AHAAC011 and 1.183 for locus 9_AHAAC062 (Table 2). The average values of observed (Ho) and expected (He) heterozygosity were 0.014 and 0.134, respectively; in both cases, maximum values were obtained for 9_AHAC062 and minimum for 4_AHAAC011 (Table 2). The average Shannon information index (I) for the set of nine loci analyzed was 0.297, again with a maximum value for locus 9_AHAAC062 (0.373) and a minimum for locus 4_AHAAC011 (0.216) (Table 2). Finally, regarding the discrimination power (D), the maximum and minimum values were once again for 9_AHAC062 (16.1%) and 4_AHAAC011 (11.2%), respectively; with a cumulative probability for the set of all loci of 75.1% (Table 2).
The results of the genetic diversity analysis comparing different collections and provinces are shown in Table 3. The percentage of polymorphic loci (% P) was 100% for accessions from the province of Imbabura in both collections; whereas the lowest values (11%) were obtained for accessions collected during 2014 and 2015 in the other two provinces under study, Tungurahua and Cañar (Table 3), where only the locus 9_AHAC062 turned out to be polymorphic and the eight remaining loci were monomorphic (see Supplementary Table S1).
Regarding the number of allelic combinations or genotypes (G), Table 4 summarizes the distribution of the 17 genotypes (G1 to G17) that were found in each collection and province, as well as the number of samples (of the 152 considered) that presented them. As with the percentage of polymorphic loci, the genotype number found was higher in the two collections from Imbabura (six for Collection A and eight for Collection B) and lower in Tungurahua and Cañar, particularly in the accessions from Collection B, where only two genotypes were found (Table 3), the same in both provinces (G1 and G3; Table 4). Likewise, it should be noted that 75.9% (44/58) of the samples from Collection A and 88.3% (83/94) of the samples from Collection B showed the same genotype (G1; Table 4) and that 12 of the 17 genotypes were unique or accession-private genotypes (G6 to G17; Table 4). On the other hand, when both collections were compared, although no significant differences were detected, it was observed that in the recently collected accessions (Collection B) there has been an increase in the number of unique genotypes in the province of Imbabura, as well as a loss of unique genotypes in the other two provinces (Table 3 and Table 4).
When comparing different collections and provinces, the ranges of average values obtained for the parameters used to evaluate genetic diversity (Na, Ne, Ho, He, and I) were relatively low (Table 3): 1.11–3.67 (Na), 1.007–1.770 (Ne), 0–0.034 (Ho), 0.007–0.435 (He) and 0.016–0.637 (I). On the one hand, although no significant differences were detected, the mean values of these genetic diversity parameters were usually higher for the set of accessions from Collection A (Table 3). On the other hand, in general, the diversity values obtained for the accessions collected in the province of Imbabura, independently of the collection, were significantly (p < 0.05) higher than those of the accessions collected in the provinces of Tungurahua and Cañar, which did not show significant differences between them within the same collection (Table 3). Significant differences (p < 0.05) were also detected between both collections in the province of Imbabura for the parameters Na, Ne, He, and I and in the province of Cañar for He, so that in both cases significantly higher values were obtained for the accessions collected at the beginning of the 1980s compared to those collected more recently (Table 3).
Table 5 shows Nei’s genetic distances matrix among the six groups of accessions analyzed (two collections X three provinces). Although all the genetic distances were less than 0.1, we observed that for the same collection the accessions from Imbabura showed a greater genetic distance than those from Tungurahua and Cañar, which showed practically zero values of genetic distance between them. When accessions collected in the same province but at different times were compared, we observed that in Tungurahua and Cañar the genetic distances were again practically 0, whereas the genetic distance between both collections in Imbabura was 0.037 (Table 5).
Finally, the genetic diversity analysis was completed with an analysis of molecular variance, AMOVA (see Supplementary Table S4). In all cases and hierarchical levels, the estimates obtained for the different molecular variance components were highly significant (p < 0.0001). When both collections were analyzed together, it was observed that the percentage of molecular variance due to differences among collections was null (0%), whereas 17.9% of the total variance was due to differences among provinces, and 82.1% remaining to differences among and within accessions (72.4% and 9.7%, respectively). When analyzing the results for each collection, in both cases the highest percentage of the variance was due to differences among accessions within provinces, but the percentage of the variance due to differences among provinces was greater in Collection A (26.8 %) than in Collection B (10.9%) (see Supplementary Table S4).

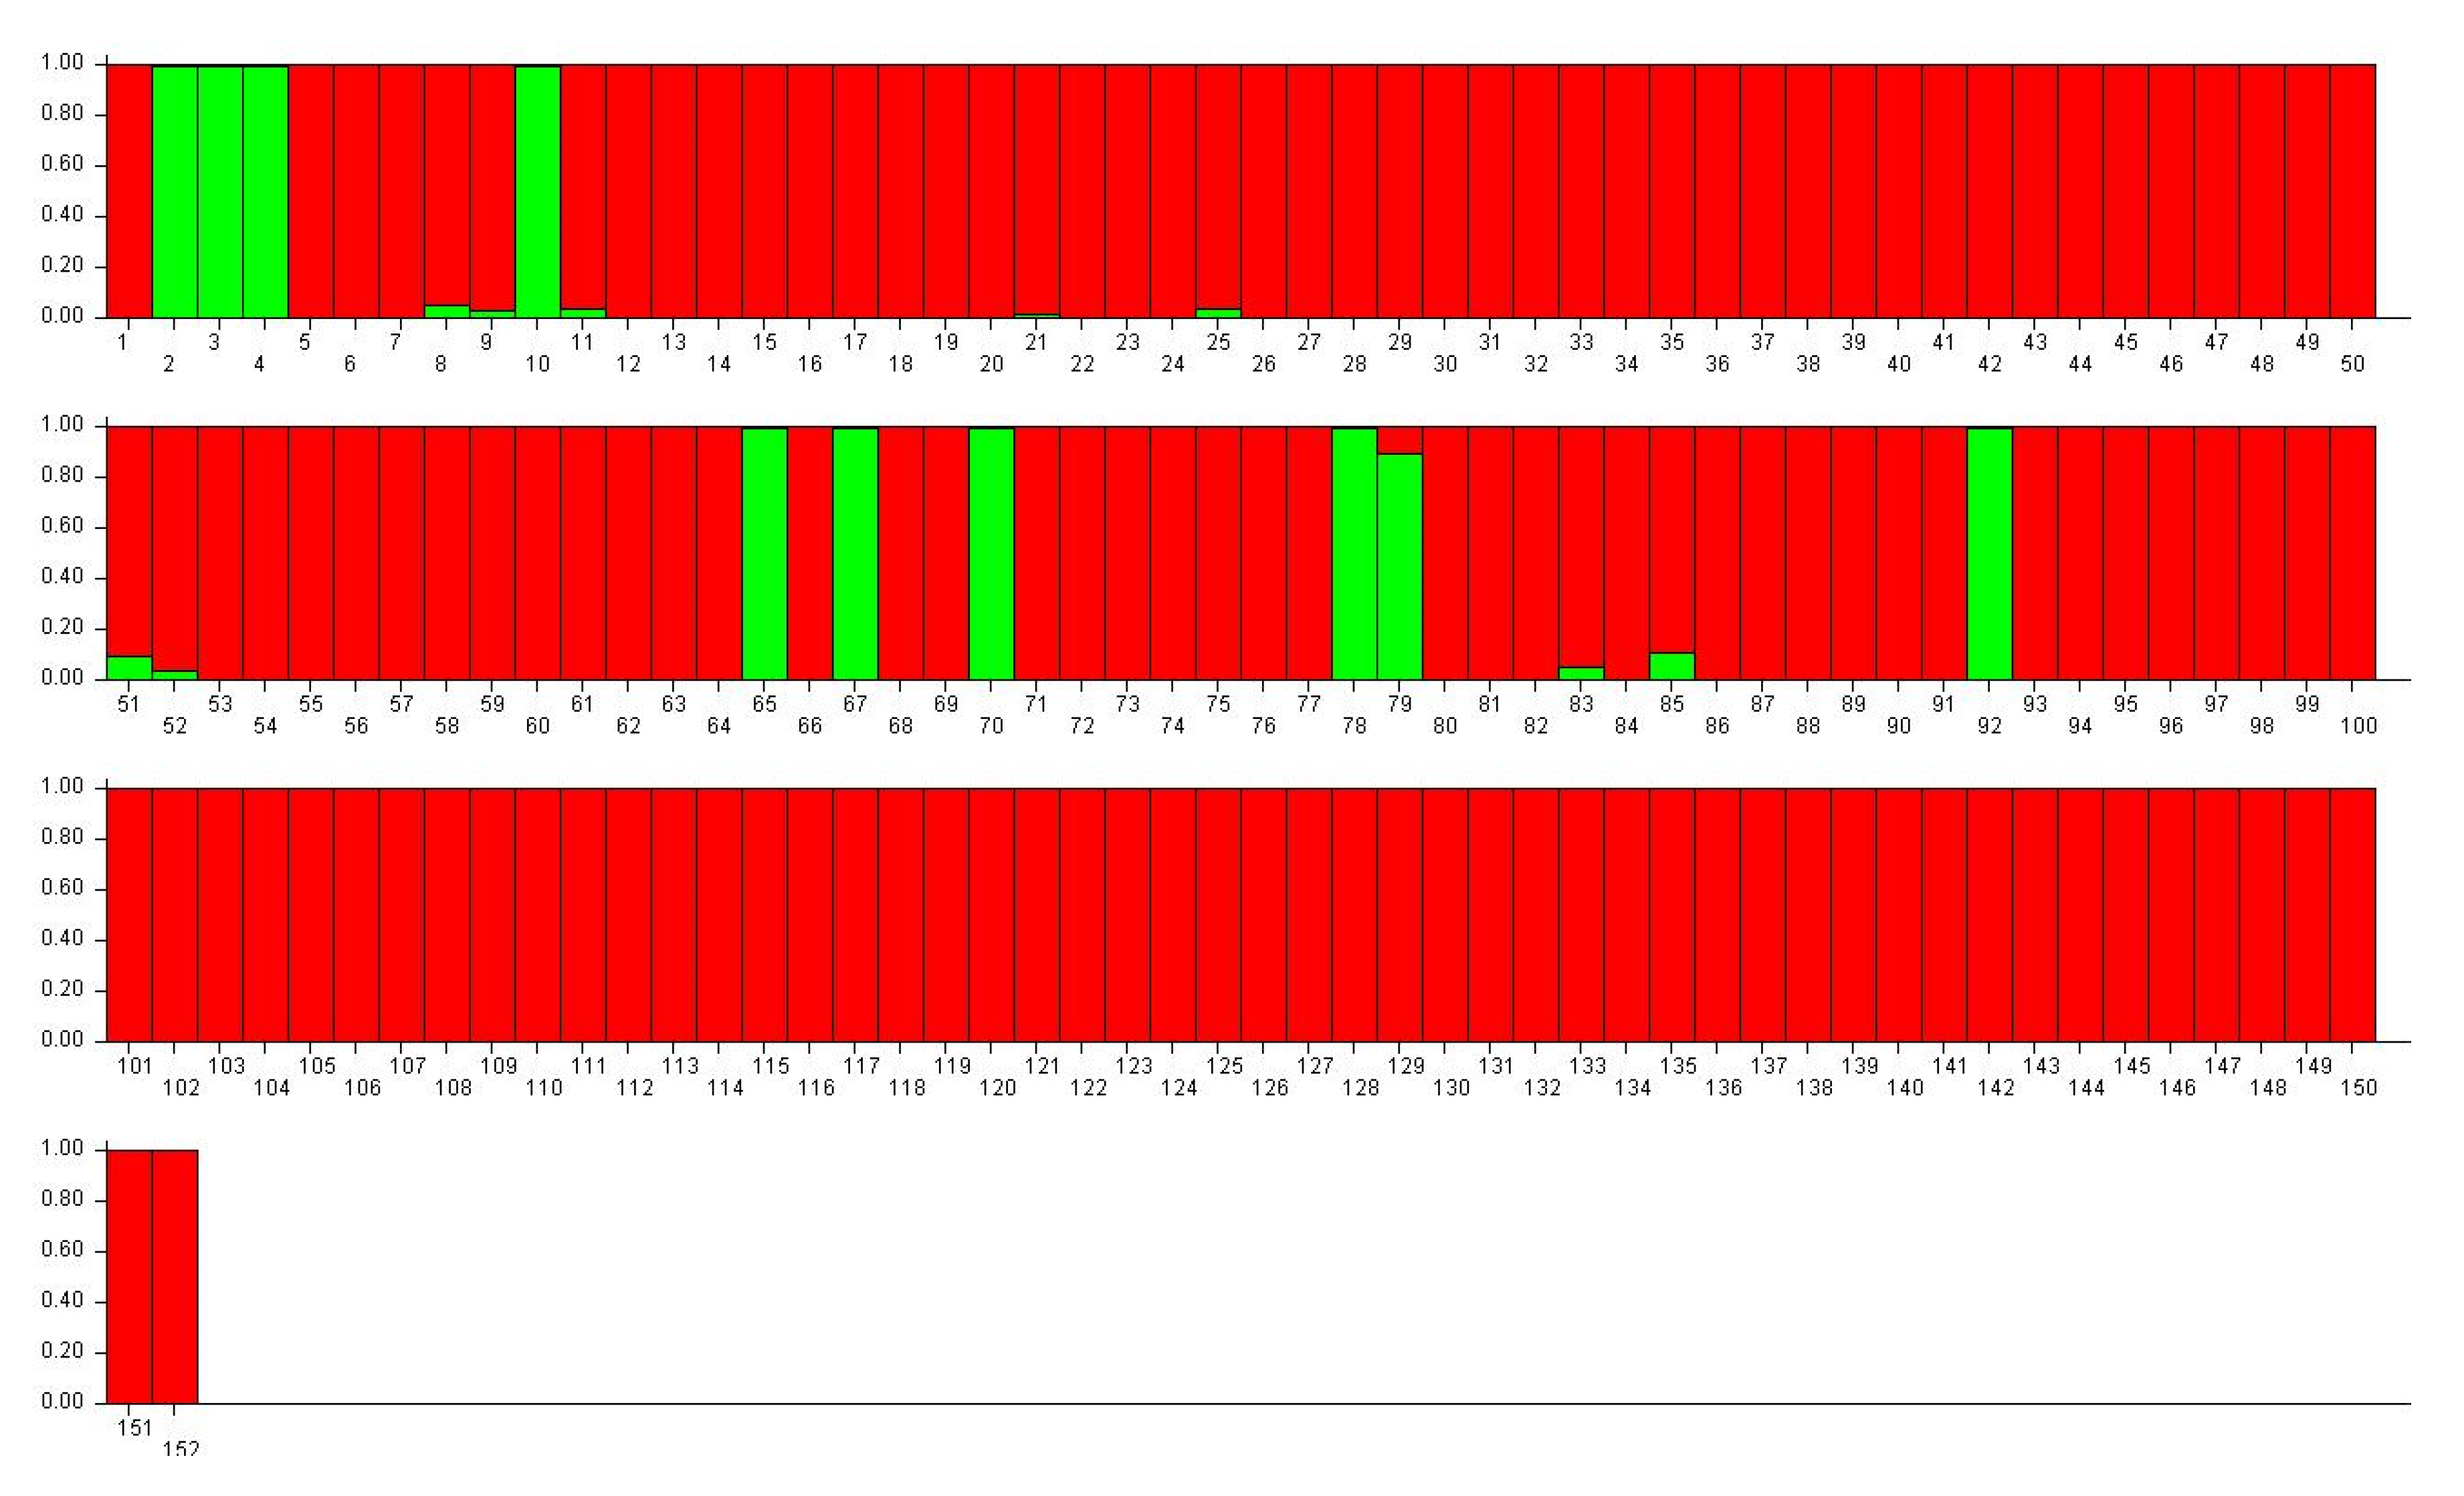
3.2. Genetic Structure

The STRUCTURE analysis of 152 black amaranth samples using the data of nine SSR loci showed that the best estimate of the optimal number of genetically different groups was obtained for the value of K = 2 [57], i.e., the detected genetic diversity seems to be structured in two clusters of samples/accessions. To assign each of the 152 samples to one of the two clusters, it was considered that they had a membership coefficient Q ≥ 0.9. Figure 2 graphically shows the membership coefficients depicted vertically for each of the 152 samples analyzed. Thus, with a membership probability threshold of 0.9, 142 (93.4%) samples were assigned to Cluster 1 and the remaining 10 (6.6%) to Cluster 2. These 10 samples assigned to Cluster 2 correspond to accessions collected in the Imbabura province, the first four (2-A1_G2 3-A2_G2, 4-A2_G8, and 10-A7_G2) during Collection A and the other six (65-A56_G2, 67-A58_G2, 70-A61_G2, 78-A68_G6, 79-A69_G15, and 92-A79_G7) during Collection B (see Figure 2 and Supplementary Table S1).
Results of the genetic diversity comparative analysis for the two accession groups defined by STRUCTURE analysis (Cluster 1 and Cluster 2) are shown in Table 6. Significant differences (p < 0.05) were obtained between both clusters for all the calculated parameters (Na, Ne, Ho, He, and I), and the obtained values for Cluster 2 were always higher. The allelic composition of samples assigned to each cluster was clearly different (see Supplementary Table S1), such that up to 10 unique or private alleles were found in samples from Cluster 1, and up to 18 unique alleles were detected in Cluster 2. All these significant differences between both sample groups were also reflected in a high value of Nei’s genetic distance (2.908) between the two clusters. The results of the analysis of molecular variance in the two clusters defined by using the STRUCTURE program are in Supplementary Table S5. The AMOVA showed that 96% of the total variance was due to differences among clusters, and only the remaining 4% to differences among (2.4%) and within (1.6%) accessions.

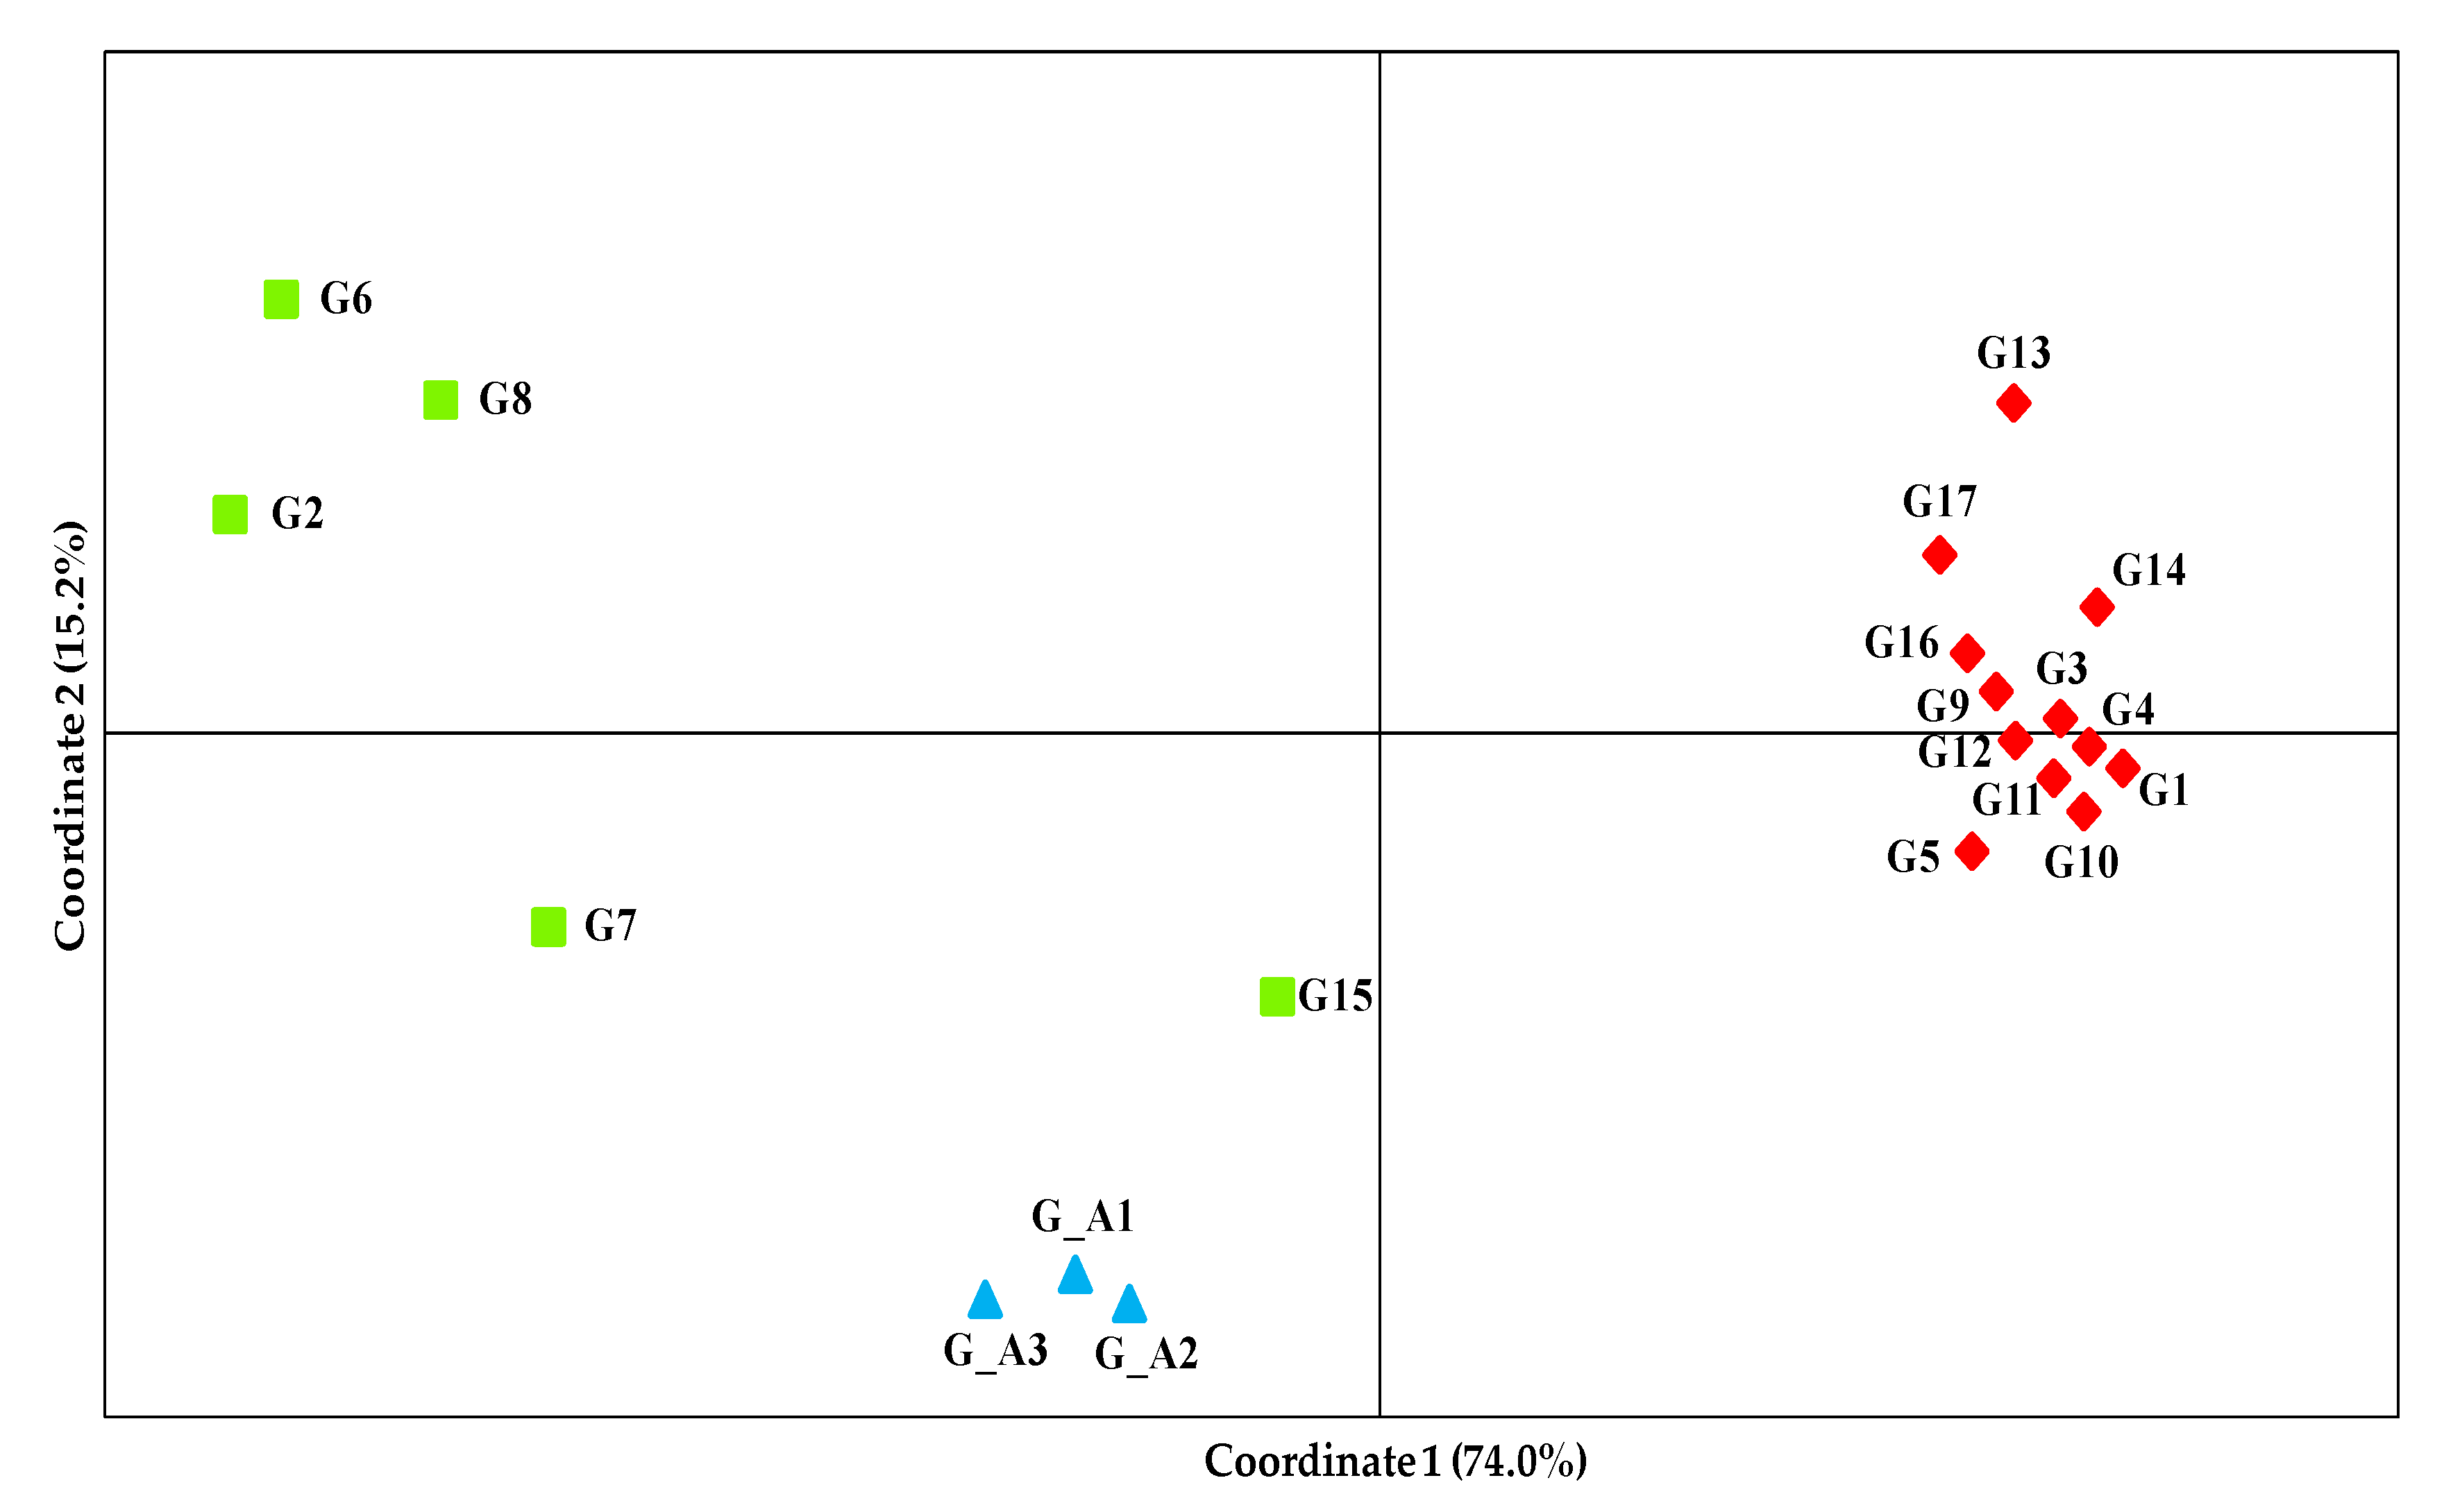
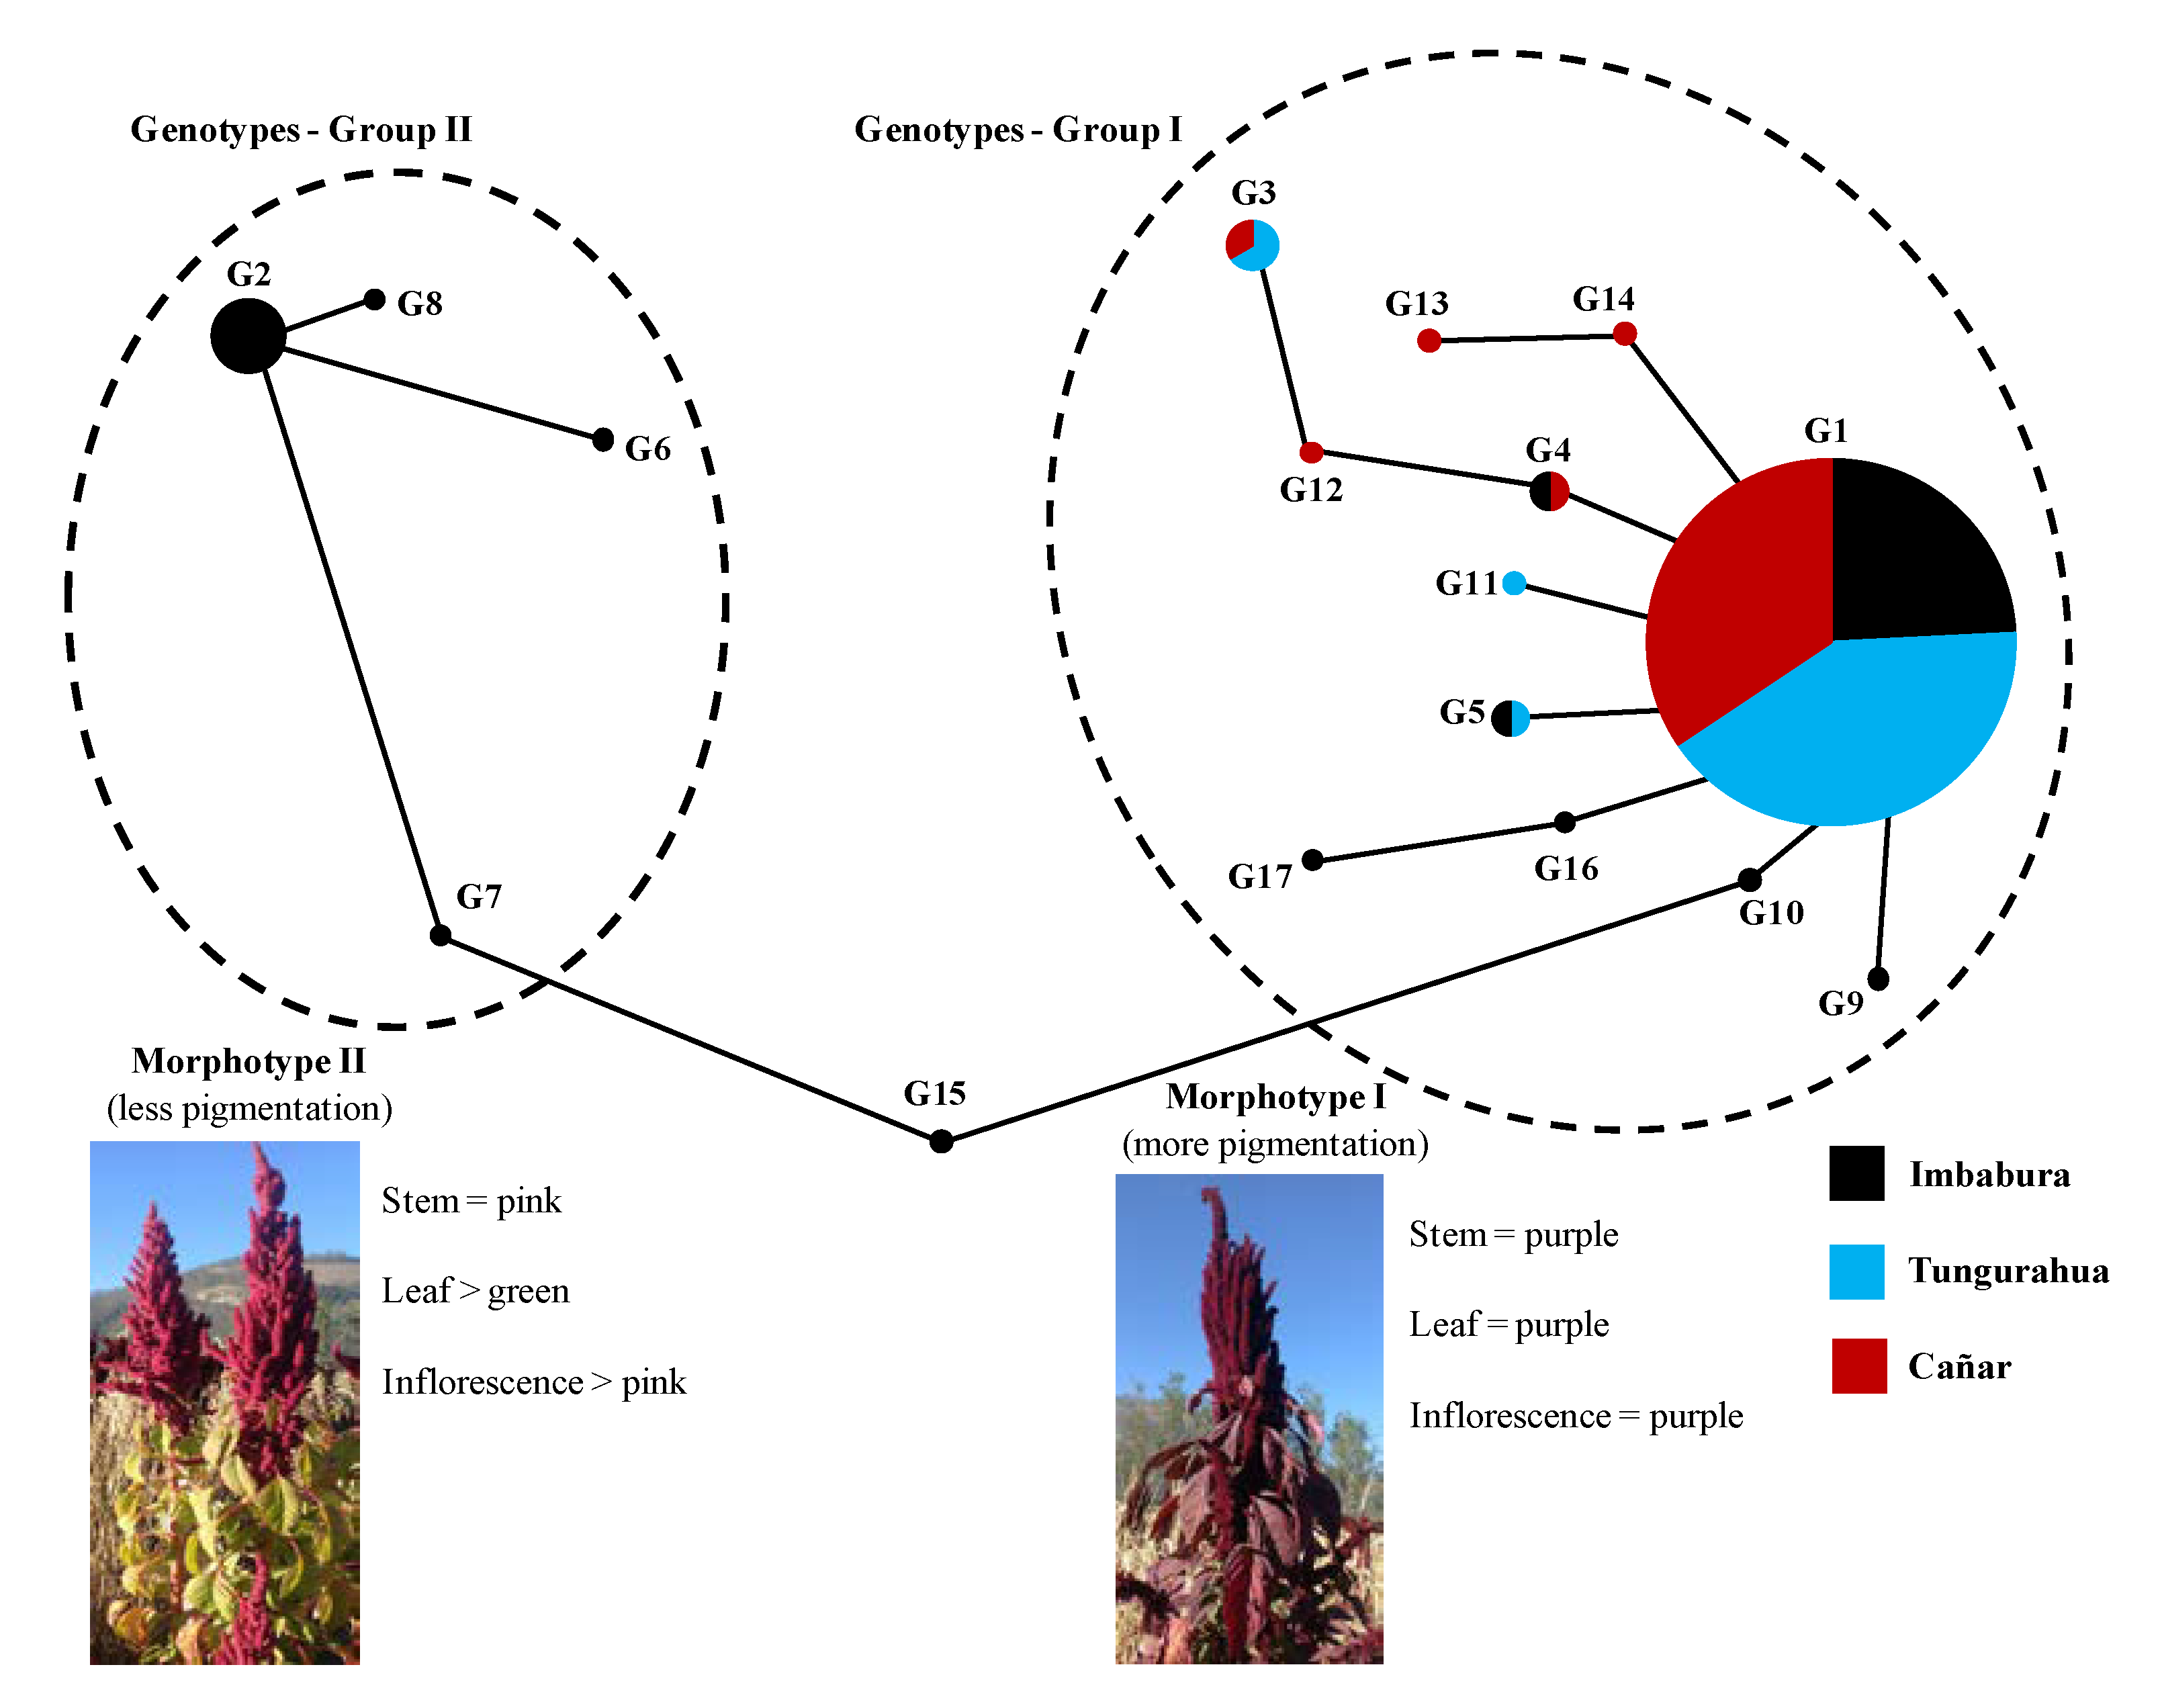
3.3. Genetic Relationships among Genotypes

In order to know the genetic relationships among 17 genotypes found in the 139 black amaranth accessions studied, a principal coordinates analysis was carried out (Figure 3), in which the three genotypes found in the commercial variety INAP-Alegría were also included as a reference (G_A1, G_A2, and G_A3; see Supplementary Table S1). The percentage of cumulated variation explained by the first two coordinates was 89.2% (74.0% for Coordinate 1 and 15.2% for Coordinate 2). The first coordinate clearly separated the genotypes into two groups, which completely coincided with the assignment of the samples that presented them to each one of the two clusters previously defined by the STRUCTURE analysis (see Figure 2 and Figure 3), so that the results of STRUCTURE analysis would be supported by the PCoA results. The three genotypes of the variety INIAP-Alegría were located between the two groups of genotypes found in the accessions of black amaranth landraces and relatively separated from them. Nevertheless, they were closer to the genotypes group of the samples assigned to Cluster 2 and, particularly, to the G15 genotype (Figure 3), which was only found in samples of accession A69, which belongs to Collection B carried out in the province of Imbabura (see Supplementary Table S1).
On the other hand, in order to verify the genetic relationships previously obtained in the PCoA, a minimum spanning tree (MST) of genotypes was generated, which is shown in Figure 4. We can observe in the MST that genotypes were clustered again in two well-defined groups (Groups I and II). The genotypes of Group I corresponded to accessions that were assigned with the STRUCTURE analysis to Cluster I, and we found the predominant genotype G1, present in 83.6% of the 152 samples analyzed, and from which the rest of the genotypes derive: G3, G4, and G5 (presented in two or three samples), and up to eight unique genotypes (G9, G10, G11, G12, G13, G14, G16, and G17). The genotypes corresponding to accessions assigned to Cluster II were located in Group II, which are accessions collected only in the province of Imbabura (A1, A2, and A7 from Collection A; A56, A58, A61, A68, and A79 from Collection B), with genotype G2 and three unique genotypes derived from it (G6, G7, and G8; see Table 4). The genotype G15 was separated between both groups, in the same way that it happened in the PCoA, although in the STRUCTURE analysis, the only accession that presented it (A69) was assigned to Cluster II. Finally, note that there is a clear association between the two groups of genotypes defined in the MST and the two color morphotypes previously found in the agromorphological characterization (Figure 4).

4. Discussion

4.1. Genetic Diversity

In the present study, we found low levels of genetic diversity. These results coincide with the reduced phenotypic diversity observed in the previous agromorphological characterization of these landraces [32].
The values detected for different genetic parameters calculated were lower than those reported in other genetic diversity studies that used SSR markers in the germplasm of different amaranth species [5,6,10,42,49,50]. These significant differences are probably due to the fact that these studies have analyzed the diversity and genetic structure in accessions of different Amaranthus species (between 5 and 33 species, depending on the paper) and, generally, with very different geographical origins, usually with the main objective of using the information to analyze the phylogenetic relationships between the species under study.
In a study similar to ours, Nguyen et al. [28] evaluated the genetic diversity in a sample of 119 accessions belonging only to the species A. tricolor and collected throughout Vietnam, using 21 SSR markers developed by themselves. In this case, they also obtained higher diversity values, but closer to ours, with 4.5 alleles per locus and a mean He of 0.340. These differences may be due to the greater amplitude of the sampling area, and probably that the gene pool of A. tricolor Vietnamese accessions is greater than that of A. quitensis accessions collected only in three provinces of the Ecuadorian highlands.
Kietlinski et al. [10] are the only ones that have reported genetic diversity data in A. quitensis accessions using microsatellite markers, although they only used five SSR loci among those described by Mallory et al. [47], and in 13 accessions from different South American countries (one from Argentina, two from Bolivia, two from Brazil, four from Peru, and four from Ecuador). They found 27 different alleles, with an average of 5.4 alleles per locus, and a high He value (0.703), which could be due to the diverse origin of the accessions.
On the other hand, in our study, very small Ho values were obtained (0.007–0.026; mean = 0.014), which indicates that the vast majority of the samples analyzed were highly homozygous, specifically 92.1% of the samples had all nine loci in homozygosity. Kietlinski et al. [10] obtained a similar mean Ho value (0.012) for the 13 A. quitensis accessions they analyzed. A possible explanation for these very low Ho values may be the predominantly autogamous character of the species [12,21] and, in general, of cultivated species of the genus Amaranthus [42,64]. Nguyen et al. [28] also obtained a low mean Ho value (0.140) in the A. tricolor accessions.
Regarding the efficiency of the nine SSR loci used in this study, it should be noted that they showed a high theoretical discrimination power (75.1%), although in practice only 17 different genotypes could be distinguished (11.2%), probably due to the existence of a reduced gene pool in the traditional black amaranth accessions. Loci developed by Mallory et al. [47], in general, were more informative than those described by Lee et al. [48], although the latter were used in the vast majority of genetic diversity studies with SSR markers in amaranth germplasm [5,6,42,49,50], and only Kietlinski et al. [10] used microsatellites developed by Mallory et al. [47]. Based on our results, we could recommend the use of the microsatellites developed by Mallory et al. [47] for future preliminary studies to characterize genetic diversity in accessions conserved in germplasm banks belonging to different species of the genus Amaranthus.
Our results seem to indicate that a reduced gene pool exists in the black amaranth accessions studied. In addition, when different collections and provinces were compared, a certain decrease in genetic diversity seems to have occurred over the last decades, essentially due to the loss of genotypes (most unique or private of accession) and, especially, in the provinces of Tungurahua and Cañar, where there is practically only a single genotype. The ataco is an ancestral crop that was of great importance in the diet of pre-Columbian Andean populations, with the regime of subjugation to which it was subjected after the arrival of the Spanish and, more recently, with changes in eating habits, among other factors, it has been relegated and has become a “forgotten” and underutilized crop [21,22,65] with the consequent progressive process of biodiversity loss or genetic erosion. On the other hand, the ataco has traditionally been cultivated in the Ecuadorian highlands on a small scale, in isolation or in association with other crops, in small plots or family gardens (chakras), or even in the gardens of farmers’ houses [66]. So, as it is an underutilized and minority crop, in recent decades it has been lost in many localities [12], which it has also contributed significantly, especially since the 1980s, to the progressive abandonment of agricultural activities by the indigenous population due to the high rates of migration to the cities, a factor that has been significant in provinces such as Tungurahua and, especially, Cañar [26].
In the case of the province of Imbabura, despite a certain loss of genetic diversity being observed, together with the fact that amaranth cultivation is a minority and only 10% of the production corresponds to landraces [67], we can say that acceptable levels of diversity have been maintained in the last four decades, and clearly higher than those observed in the other two provinces under study. This may be due that, in this province and since 2001, the rural populations have accepted in a very positive way the institutional campaign carried out to increase the cultivation and consumption of forgotten and underutilized traditional cultivars of different Andean crops [19], in addition to the promotion among local farmers of the use of agroecological or organic production systems for these traditional Andean crops [68]. Likewise, the ataco is highly appreciated by the indigenous population of the area, not so much for the consumption of the grain as for the use of the inflorescence to give color to the “colada morada”, a very typical drink in this province, especially during the celebration of the Day of the Dead [12]. All of this demonstrates that good management of a minority and underutilized plant genetic resource, with adequate dissemination of its properties and benefits among the native population, even emphasizing its social and cultural importance, in addition to food, can ensure that the biodiversity of landraces germplasm can be maintained and conserved in situ.
When comparing the results of genetic diversity for different collections and provinces with those previously obtained of phenotypic diversity [32], we found that in both cases practically no significant differences were detected between the two collections. Therefore, all these results indicate that the biodiversity of the black amaranth landraces does not seem to have undergone many significant changes in the last four decades, which would mean that local farmers would have carried out an acceptable conservation in situ (on-farm) of this germplasm.
However, when the comparative analysis between collections is carried out by provinces, significant differences can be observed between them, just as they were observed in relation to the phenotypic diversity found for the quantitative characters analyzed [32]. These differences between provinces could be related to socioeconomic circumstances, crop management, and traditional uses of ataco in each of the provinces [12,23,32,68].

4.2. Genetic Structure and Association between Genotypes and Color Morphotypes

The assignment of the samples to each cluster was not related to their geographical origin or to the time they were collected. However, a clear association was observed with qualitative traits previously analyzed and referring to the pigmentation of stem, leaves, and inflorescence. Thus, all the samples of Cluster 1 showed purple stems, leaves, and inflorescences in adult plants, a typical coloration described for the type plant of the ataco cultivated in the Ecuadorian highlands [12]; whereas, samples from Cluster 2 showed less pigmentation in these organs, in general, with pink stems and inflorescences, and green leaves [32]. Moreover, the two clusters showed to be clearly different in terms of their molecular diversity analysis, since they presented significant differences for all the diversity parameters calculated.
The three genotypes found in the commercial variety INIAP-Alegría (G_A1, G_A2, and G_A3) were closer to the G15 genotype, found only in samples of the accession A69 (Imbabura—Collection B). This G15 genotype presented seven of the nine loci analyzed in heterozygosis, whereas the rest of the genotypes associated with Cluster 2 presented the nine loci in homozygosis. Furthermore, in six of these seven heterozygous loci, one of the alleles was present in the genotypes of the INIAP-Alegría variety and four of them were clearly distinctive alleles of this variety. These molecular data seem to indicate that in accession A69 there has been a clear introgression of the commercial variety INIAP-Alegría, and the G15 genotype is the result of that introgression. This hypothesis could not be corroborated with the data previously obtained through the morphological characterization of the accession A69, referring to the pigmentation characteristics of the stem, leaf, inflorescence, and grain color [32], since this accession showed the typical pigmentation of an ataco type plant in the stem and inflorescence (both purple) and in the black color of the grain [12] so that the only variation was observed in the green leaves. This leaf color can be associated both with the INIAP-Alegría variety [69] and with the majority of the ataco accessions that showed the color morphotype with less pigmentation [32].
MST tree and PCoA data indicate that the two groups of genotypes could constitute two independent genetic lineages, which would represent part of the ancestral gene pool that existed in the landraces of black amaranth cultivated by native farmers in the Ecuadorian highlands. Likewise, the association of each of these groups of genotypes (genetic lineages) with the two color morphotypes previously defined in the agromorphological characterization of these landraces was confirmed. In this sense, it should be noted that other previous morphological characterization studies have already found some variability in the coloration of the inflorescence of black amaranth accessions collected in the early 1980s and conserved in the INIAP Germplasm Bank, from pink to very intense purple colors, the latter with great potential for extraction of the dye amaranthine [12].
The most abundant morphotype with more intense pigmentation is the most appreciated by the native population of the Ecuadorian highlands, due to the use of the dye extracted from the ripe inflorescences in the preparation of food and, especially, typical drinks such as “colada morada”, “horchata”, or “draque” [12,23]. The morphotype with less intense pigmentation was only found in accessions collected in farms and gardens from the province of Imbabura, being appreciated by farmers for its value as an ornamental plant [32].
On the other hand, the farms where the accessions with Morphotype II were collected in the early 1980s were not the same ones in which the less pigmented accessions were collected in 2014 and 2015, so the distance between these farms varied between 6 and 20 km [32]. This seems to indicate that in the last decades, within the province of Imbabura and at least locally in the cantons where accessions with less pigmentation were collected (Otavalo, Cotacachi, and Antonio Ante), there has been some mobility and exchange of ataco germplasm, which would have favored the conservation of a minority color morphotype and essentially with ornamental value. In this sense, it is worth mentioning that the flow of local cultivars of different Andean crops has been governed by a system of relatively informal networks of seed exchange that connect farmers from different areas of the Andes, and that basically has served to conserve a large part of the native agrobiodiversity that we can find today in the different Andean crops [70,71]. In the case of the province of Imbabura, numerous “Seed Exchange Fairs” have been held every year since 1998, where the germplasm exchange of traditional cultivars of different native crops is promoted, which has favored agricultural diversity and the conservation in situ of the native agrobiodiversity [22].

4.3. Implications for Conservation of Black Amaranth Landraces

In the present study, a preliminary genetic evaluation to assess the conservation status of black amaranth landraces cultivated in the Ecuadorian highlands has been carried out. The study has detected low levels of genetic diversity in the ataco accessions, with a predominant genotype (G1) and up to 12 accession-unique genotypes among the 17 genotypes that were found. This seems to indicate that the ataco cultivated in the Andean region of Ecuador has a reduced gene pool, and it is probably immersed in a process of genetic erosion, at least in some of the provinces under study, such as Tungurahua and Cañar. In addition, in these provinces, the progressive abandonment of agricultural activity in recent decades due to the migration of the rural population to the cities could be one of the reasons that have led to a greater loss of genetic diversity in some of the Andean crops conserved by the indigenous farming communities [26,71].
On the other hand, the existence of government programs that have promoted the cultivation and commercialization of commercial amaranth varieties does not favor the use and conservation of landraces either [19], since the commercial varieties tend to be more precocious and have a higher average yield [72].
Today, most of the amaranth produced and marketed in the provinces of the Ecuadorian highlands corresponds to the commercial variety INIAP-Alegría [67]. However, native farmers still tend to keep their local “family landraces” of black amaranth, as well as other typical Andean crops [71], as a very important part of their cultural heritage inherited from generation to generation, that they prefer to continue cultivating and consuming as opposed to commercial varieties, which they also cultivate but for more commercial and economic purposes. In this sense, it can be said that the farmers of the Andean region are carrying out important on-farm conservation labor.
Additionally, although most farmers simultaneously cultivate commercial varieties of amaranth and landraces of black amaranth, practically no introgression cases of the former into the latter have been detected, which has surely been helped by the fact that they are eminently autogamous species. On the other hand, farmers also avoid mixing seeds of different types of amaranth germplasm (personal communication from farmers during the elaboration of the surveys carried out in the 2014–2015 collection). Whereas in the case of other more relevant Andean crops, such as quinoa, the exchange without official control and the seed mixture of local germplasm and commercial varieties seems to be the cause of the existence of high diversity in the traditional cultivars, as well as the loss of genetic homogeneity in the commercial varieties [71,73].
Studies to assess genetic diversity, as well as phenotypic diversity, are important to improve the management and conservation of agrobiodiversity, being essential in the case of landraces and even more so of ancestral and underutilized crops, since they could be at risk of disappearing due to genetic erosion. Although local farming communities are trying to conserve in situ the native agrobiodiversity of minority and underutilized crops, such as black amaranth or ataco, the results obtained in this study indicate that it would be necessary and urgent to take institutional measures to help and facilitate this conservation in situ, which in turn would contribute to food security and reaffirm cultural values of the Andean region of Ecuador.

Supplementary Materials

The following supporting information can be downloaded at: https://www.mdpi.com/article/10.3390/agriculture13010034/s1, Table S1: Allelic combinations or genotypes (G1 to G17) found in the 139 black amaranths (A. quitensis) accessions analyzed with nine microsatellite loci. The accessions are identified with the INIAP Germplasm Bank (BG) code and the analysis code used for this study (A1 to A139). The collection and province of origin are indicated, as well as the number of the analyzed sample. At the end of the table, the genotypes found in the commercial variety INIAP-Alegría are included. Table S2: Allele sizes (A; in base pairs) and their frequencies (F) found for each of the nine SSR loci analyzed in 152 black amaranth samples. Alleles with frequencies > 0.9 are shown in bold. Table S3: Genotypes (g) and their frequencies (F) found for each of the nine SSR loci analyzed in 152 black amaranth samples. Genotypes with frequencies > 0.9 are shown in bold. Table S4: Analysis of molecular variance (AMOVA) of 152 black amaranth samples distributed in the three provinces (Imbabura, Tungurahua, and Cañar) and for both collections (A and B). The analysis has been carried out considering both collections and also for each collection separately. Table S5: Analysis of molecular variance (AMOVA) of 152 black amaranth samples distributed in the two clusters defined by STRUCTURE analysis.

Author Contributions

Conceptualization by H.D. and J.P.M.; methodology and data analysis by H.D. and J.P.M.; writing—original draft preparation by H.D. and J.P.M.; writing final draft—reviews and editing by H.D. and J.P.M. All authors have read and agreed to the published version of the manuscript.

Funding

We acknowledge the financial support from the “Universidad Politécnica de Madrid” through projects VAGI18JPMC, VAGI19JPMC, and VAGI20JPMC.

Institutional Review Board Statement

Not applicable.

Informed Consent Statement

Not applicable.

Data Availability Statement

Not applicable.

Acknowledgments

We acknowledge to Department of Plant Genetic Resources of the National Institute for Agricultural Research (DENAREF-INIAP, Ecuador) for allowing us to study a part of the black amaranth collection (Amaranthus quitensis Kunth).

Conflicts of Interest

The authors declare no conflict of interest.

References

  1. Sauer, J.D. The grain amaranths and their relatives: A revised taxonomic and geographic survey. Ann. Mo. Bot. Gard. 1967, 54, 103–137. [Google Scholar] [CrossRef]
  2. Stetter, M.G.; Schmid, K.J. Analysis of phylogenetic relationships and genome size evolution of the Amaranthus genus using GBS indicates the ancestors of an ancient crop. Mol. Phylogenet. Evol. 2017, 109, 80–92. [Google Scholar] [CrossRef] [Green Version]
  3. Waselkov, K.E.; Boleda, A.S.; Olsen, K.M. A phylogeny of the genus Amaranthus (Amaranthaceae) based on several low-copy nuclear loci and chloroplast regions. Syst. Bot. 2018, 43, 439–458. [Google Scholar] [CrossRef]
  4. Thapa, R.; Blair, M.W. Morphological Assessment of Cultivated and Wild Amaranth Species Diversity. Agronomy 2018, 8, 272. [Google Scholar] [CrossRef] [Green Version]
  5. He, Q.; Park, Y.J. Evaluation of genetic structure of amaranth accessions from the United States. Weed Turfgrass Sci. 2013, 2, 230–235. [Google Scholar] [CrossRef] [Green Version]
  6. Oo, W.H.; Park, J.Y. Analysis of the Genetic Diversity and Population Structure of Amaranth Accessions from South America Using 14 SSR Markers. Korean J. Crop. Sci. 2013, 58, 336–346. [Google Scholar] [CrossRef]
  7. Sauer, J.D. Grain amaranths. Evolution of Crop Plants; Simmonds, N.W., Ed.; Longman Group: London, UK, 1976; pp. 4–7. [Google Scholar]
  8. Stetter, M.G.; Vidal-Villarejo, M.; Schmid, K.J. Parallel seed color adaptation during multiple domestication attempts of an ancient New World grain. Mol. Biol. Evol. 2020, 37, 1407–1419. [Google Scholar] [CrossRef]
  9. Clouse, J.W.; Adhikary, D.; Page, J.T.; Ramaraj, T.; Deyholos, M.K.; Udall, J.A.; Fairbanks, D.J.; Jellen, E.N.; Maughan, P.J. The amaranth genome: Genome, transcriptome, and physical map assembly. Plant Genome 2016, 9, 1. [Google Scholar] [CrossRef] [Green Version]
  10. Kietlinski, K.; Jimenez, F.; Jellen, E.N.; Maughan, P.J.; Smith, S.M.; Pratt, D.B. Relationships between the Weedy (Amaranthaceae) and the Grain Amaranths. Crop. Sci. 2014, 54, 220–228. [Google Scholar] [CrossRef]
  11. Thapa, R.; Edwards, M.; Blair, M.W. Relationship of Cultivated Grain Amaranth Species and Wild Relative Accessions. Genes 2021, 12, 1849. [Google Scholar] [CrossRef]
  12. Peralta, E.; Villacrés, E.; Mazón, N.; Rivera, M.; Subía, C. El Ataco, Sangorache o Amaranto Negro (Amaranthus hybridus L.) en Ecuador; Publicación Miscelánea No.143. Programa Nacional de Leguminosas y Granos Andinos; Estación Experimental Santa Catalina INIAP: Quito, Ecuador, 2008; p. 63. [Google Scholar]
  13. Aderibigbe, O.R.; Ezekiel, O.O.; Owolade, S.O.; Korese, J.K.; Sturm, B.; Hensel, O. Exploring the potentials of underutilized grain amaranth (Amaranthus spp.) along the value chain for food and nutrition security: A review. Crit. Rev. Food Sci. Nutr. 2022, 62, 656–669. [Google Scholar] [CrossRef] [PubMed]
  14. Rastogi, A.; Shukla, S. Amaranth: A new millennium crop of nutraceutical values. Critical Reviews. Food Sci. Nutr. 2013, 53, 109–125. [Google Scholar] [CrossRef]
  15. Martínez-López, A.; Milla-Linares, M.C.; Rodríguez-Martín, N.M.; Millán, F.; Montserrat-de la Paz, M. Nutraceutical value of kiwicha (Amaranthus caudatus L.). J. Funct. Foods 2020, 65, 103735. [Google Scholar] [CrossRef]
  16. Ballabio, C.; Uberti, F.; Di Lorenzo, C.; Brandolini, A.; Penas, E.; Restani, P. Biochemical and immunochemical characterization of different varieties of amaranth (Amaranthus L. ssp.) as a safe ingredient for gluten-free products. J. Agric. Food Chem. 2011, 59, 12969–12974. [Google Scholar] [CrossRef]
  17. Massange-Sánchez, J.A.; Palmeros-Suárez, P.A.; Martínez-Gallardo, N.A.; Castrillón-Arbelaez, P.A.; Avilés-Arnaut, H.; Alatorre-Cobos, F.; Tiessen, A.; Délano-Frier, J.P. The novel and taxonomically restricted Ah24 gene from grain amaranth (Amaranthus hypochondriacus) has a dual role in development and defense. Front. Plants Sci. 2015, 6, 602. [Google Scholar] [CrossRef] [Green Version]
  18. Saucedo, A.L.; Hernández-Domínguez, E.E.; de Luna-Valdez, L.A.; Guevara-García, A.A.; Escobedo-Moratilla, A.; Bojorquéz-Velázquez, E.; Del Río-Portilla, F.; Fernández-Velasco, D.A.; Barba de la Rosa, A.P. Insights on structure and function of a late embryogenesis abundant protein from Amaranthus cruentus: An intrinsically disordered protein involved in protection against desiccation, oxidant conditions, and osmotic stress. Front. Plant Sci. 2017, 8, 497. [Google Scholar] [CrossRef]
  19. Peralta, E. El amaranto en Ecuador: “Estado del Arte”; Programa Nacional de Leguminosas y Granos Andinos Estación; Experimental Santa Catalina INIAP: Quito, Ecuador, 2012; p. 42. [Google Scholar]
  20. Cai, Y.; Sun, M.; Wu, H.; Huang, R.; Corke, H. Characterization and Quantification of Betacynanin Pigments from Diverse Amaranthus Species. J. Agric. Food Chem. 1998, 46, 2064–2070. [Google Scholar] [CrossRef]
  21. Peralta, E. Producción y distribución de semilla de buena calidad con pequeños agricultores de GRANOS ANDINOS: Chocho, quinua, Amaranto-sistema no convencional-Publicación Miscelánea No. 169. Programa Nacional de Leguminosas y Granos Andinos; Estación Experimental Santa Catalina. INIAP: Quito, Ecuador, 2010; p. 68. [Google Scholar]
  22. DENAREF (Departamento Nacional de Recursos Fitogenéticos). Banco Nacional de Germoplasma. Estación Experimental Santa Catalina; INIAP: Quito, Ecuador, 2016; p. 34. [Google Scholar]
  23. Patrimonio Alimentario. Ministerio de Cultura y Patrimonio. Fascículo 3. Oca Tubérculos de la Región Andina. Amaranto/Sangorache Grano de Proteína. Available online: https://www.culturaypatrimonio.gob.ec/wp-content/uploads/downloads/2013/11/3-P.Alimentario-lunes.pdf (accessed on 11 September 2022).
  24. Michelle, O.F. Innovando en la cocina andina. Saberes y sabores en movimiento. In Recetario con Productos Tradicionales Andinos de la Provincia de Imbabura; Programa de Desarrollo Territorial Rural; Oxfam Italia: Cotacachi, Ecuador, 2015; p. 67. [Google Scholar]
  25. Suquilanda, M. Producción orgánica de cultivos andinos. Capítulo 9. In Producción Orgánica del Amaranto (Amaranthus caudatus); Suquilanda, M., Ed.; UNOCANC: Cotopaxi, Ecuador, 2011; pp. 118–134. [Google Scholar]
  26. Ramírez, J. ‘Un siglo de ausencias’: Historia incompleta de la migración ecuatoriana. Mashkana 2021, 12, 47–64. [Google Scholar] [CrossRef]
  27. Malaghan, S.N.; Revanappa, S.; Ajjappalavar, P.S.; Nagaraja., M.S.; Raghavendra, S. Genetic Variability, Heritability and Genetic Advance in Grain Amaranth (Amaranthus spp.). Int. J. Curr. Microbiol. Appl. Sci. 2018, 7, 1485–1494. [Google Scholar] [CrossRef]
  28. Nguyen, D.C.; Tran, D.S.; Tran, T.T.H.; Ohsawa, R.; Yoshioka, Y. Genetic diversity of leafy amaranth (Amaranthus tricolor L.) resources in Vietnam. Breed. Sci. 2019, 69, 640–650. [Google Scholar] [CrossRef]
  29. Nyasulu, M.; Sefasi, A.; Chimzinga, S.; Maliro, M. Agromophological characterisation of Amaranth Accessions from Malawi. Am. J. Plant Sci. 2021, 12, 1528–1542. [Google Scholar] [CrossRef]
  30. Mazón, N.; Peralta, E.; Rivera, M.; Subía, C.; Tapia, C. Catálogo del Banco de Germoplasma de Amaranto (Amaranthus spp.) de INIAP-Ecuador; Estación Experimental Santa Catalina: Quito, Ecuador, 2003; p. 53. [Google Scholar]
  31. Tapia, C.; Peralta, E.; Mazón, N. Colección núcleo de amaranto del Banco de Germoplasma del INIAP, Ecuador. In Avances, Desarrollo y Sustentabilidad Agroambiental en Ecuador y Venezuela; En Sandía, L., Rivas, F., Recalde, E., S. Mafla, S., Eds.; ULA/PUCESI: Mérida, Venezuela, 2017; pp. 200–206. [Google Scholar]
  32. Delgado, H.; Tapia, C.; Borja, E.; Naranjo, E.; Martín, J.P. Phenotypic diversity of Amaranthus quitensis Kunth landraces: A millenary crop of Ecuadorian Andean region. Sci. Agropecu. 2022, 13, 381–393. [Google Scholar] [CrossRef]
  33. Park, Y.J.; Nishikawa, T.; Matsushima, K.; Minami, M.; Nemoto, K. A rapid and reliable PCR-restriction fragment length polymorphism (RFLP) marker for the identification of Amaranthus cruentus species. Breed. Sci. 2014, 64, 422–426. [Google Scholar] [CrossRef] [PubMed] [Green Version]
  34. Transue, D.K.; Fairbanks, D.J.; Robison, L.R.; Andersen, W.R. Species identification by RAPD analysis of grain amaranth genetic resources. Crop. Sci. 1994, 34, 1385–1389. [Google Scholar] [CrossRef]
  35. Lymanskaya, S.V. Estimation of the Genetic Variability of an Amaranth Collection (Amaranthus L.) by RAPD Analysis. Cytol. Genet. 2012, 46, 19–26. [Google Scholar] [CrossRef] [Green Version]
  36. Akin-Idowu, P.E.; Gbadegesin, M.A.; Orkpeh, U.; Ibitoye, D.O.; Odunola, O.A. Characterization of Grain Amaranth (Amaranthus spp.) Germplasm in South West Nigeria Using Morphological, Nutritional, and Random Amplified Polymorphic DNA (RAPD). Anal. Resour. 2016, 5, 6. [Google Scholar] [CrossRef] [Green Version]
  37. Xu, F.; Sun, M. Comparative analysis of phylogenetic relationships of grain amaranths and their wild relatives (Amaranthus;Amaranthaceae) using internal transcribed spacer, amplified fragment length polymorphism, and double-primer fluorescent intersimple sequence repeat markers. Mol. Phylogenetics Evol. 2001, 21, 372–387. [Google Scholar] [CrossRef]
  38. Wasson, J.J.; Tranel, P.J. Amplified Fragment Length Polymorphism-Based Genetic Relationships Among Weedy Amaranthus Species. J. Hered. 2005, 96, 410–416. [Google Scholar] [CrossRef] [Green Version]
  39. Raut, V.R.; Dodake, S.S.; Chimote, V.P. Evaluation of Genetic Diversity in Grain Amaranth (Amaranthus hypochondriacus) at Molecular Level using ISSR Markers. Indian J. Agric. Biochem. 2014, 27, 60–65. [Google Scholar]
  40. Štefúnová, V.; Bezo, M.; Labajová, M.; Senková, S. Genetic analysis of three Amaranth species using ISSR markers. Emir. J. Food Agric. 2014, 26, 35–44. [Google Scholar] [CrossRef]
  41. Gelotar, M.J.; Dharajiya, D.T.; Solanki, S.D.; Prajapati, N.N.; Tiwari, K.K. Genetic diversity analysis and molecular characterization of grain amaranth genotypes using inter simple sequence repeat (ISSR) markers. Bull Natl. Res. Cent. 2019, 43, 103. [Google Scholar] [CrossRef]
  42. Suresh, S.; Chung, J.W.; Cho, G.T.; Sung, J.S.; Park, J.H.; Gwag, J.G.; Baek, H.J. Analysis of molecular genetic diversity and population structure in Amaranthus germplasm using SSR markers. Plant Biosyst. 2014, 148, 635–644. [Google Scholar] [CrossRef]
  43. Maughan, P.J.; Yourstone, S.M.; Jellen, E.N.; Udall, J.A. SNP discovery via genomic reduction, barcoding, and 454-pyrosequencing in amaranth. Plant Genome 2009, 2, 260–270. [Google Scholar] [CrossRef] [Green Version]
  44. Maughan, P.J.; Smith, S.M.; Fairbanks, D.J.; Jellen, E.N. Development, Characterization, and Linkage Mapping of Single Nucleotide Polymorphisms in the Grain Amaranths (Amaranthus sp.). Plant Genome 2011, 4, 92–101. [Google Scholar] [CrossRef] [Green Version]
  45. Wu, X.; Blair, M.W. Diversity in Grain Amaranths and Relatives Distinguished by Genotyping by Sequencing (GBS). Front. Plant Sci. 2017, 8, 1960. [Google Scholar] [CrossRef] [Green Version]
  46. Vieira, M.L.C.; Santini, L.; Diniz, A.L.; Munhoz, C.D. Microsatellite markers: What they mean and why they are so useful. Genet. Mol. Biol. 2016, 39, 312–328. [Google Scholar] [CrossRef] [Green Version]
  47. Mallory, M.A.; Hall, R.V.; McNabb, A.R.; Pratt, D.B.; Jellen, E.N.; Maughan, P.J. Development and characterization of microsatellite markers for the grain amaranths. Crop. Sci. 2008, 48, 1098–1106. [Google Scholar] [CrossRef]
  48. Lee, J.R.; Hong., G.Y.; Dixit, A.; Chung, J.W.; Ma, K.H.; Lee, J.H.; Kang, H.K.; Cho, H.Y.; Gwang, J.G.; Park, Y.J. Characterization of microsatellite loci developed for Amaranthus hypochondriacus and their cross-amplification in wild species. Conserv. Genet. 2008, 9, 243–246. [Google Scholar] [CrossRef]
  49. Khaing, A.A.; Moe, K.T.; Chung, J.W.; Baek, H.J.; Park, Y.J. Genetic diversity and population structure of the selected core set in Amaranthus using SSR markers. Plant Breed. 2013, 132, 165–173. [Google Scholar] [CrossRef]
  50. Wang, X.Q.; Park, J.Y. Comparison of genetic diversity among amaranth accessions from South and Southeast Asia using SSR markers. Korean J. Crop. Sci. 2013, 21, 220–228. [Google Scholar] [CrossRef] [Green Version]
  51. Nieto, C. El Cultivo de Amaranto Amaranthus spp. Una Alternativa Agronómica para Ecuador; Publicación Miscelánea No.52 Estación Experimental Santa Catalina: Quito, Ecuador, 1989; p. 25. [Google Scholar]
  52. Peakal, R.; Smouse, P. GenAlEx 6.5: Genetic analysis in Excel. Population genetic software for teaching and research an update. Bioinformatics 2012, 28, 2537–2539. [Google Scholar] [CrossRef] [PubMed]
  53. Jones, D.A. Blood samples: Probability of discrimination. J. Forensic. Sci. Soc. 1972, 12, 355–359. [Google Scholar] [CrossRef] [PubMed]
  54. Martín del Puerto, M.; Martínez García, F.; Mohanty, A.; Martín, J.P. Genetic Diversity in Relict and Fragmented Populations of Ulmus glabra Hudson in the Central System of the Iberian Peninsula. Forests 2017, 8, 143. [Google Scholar] [CrossRef] [Green Version]
  55. Fisher, R.A. The Use of Multiple Measurements in Taxonomy Problems. Ann. Eugen. 1936, 7, 179–188. [Google Scholar] [CrossRef]
  56. Nei, M. Genetic distance between populations. Amer. Nat. 1972, 106, 283–292. [Google Scholar] [CrossRef]
  57. Excoffier, L.; Smouse, P.E.; Quattro, J.M. Analysis of molecular variance inferred from metric distances among DNA haplotypes: Application to human mitochondrial DNA restriction sites. Genetics 1992, 131, 479–491. [Google Scholar] [CrossRef]
  58. Pritchard, J.K.; Stephens, M.; Donnelly, P. Inference of population structure using multilocus genotype data. Genetics 2000, 155, 945–959. [Google Scholar] [CrossRef]
  59. Evanno, G.; Regnaut, S.; Goudet, J. Detecting the number of clusters of individuals using the software STRUCTURE: A simulation study. Mol. Ecol. 2005, 14, 2611–2620. [Google Scholar] [CrossRef] [Green Version]
  60. Earl, D.A.; vonHoldt, B.M. STRUCTURE HARVESTER: A website and program for visualizing STRUCTURE output and implementing the Evanno method. Conserv. Genet. Resour. 2012, 4, 359–361. Available online: http://www.alz.org/what-is-dementia.asp (accessed on 20 October 2022). [CrossRef]
  61. Falush, D.; Stephens, M.; Pritchard, J.K. Inference of population structure using multilocus genotype data: Linked loci and correlated allele frequencies. Genetics 2003, 164, 1567–1587. [Google Scholar] [CrossRef]
  62. Worthington, M.; Soleri, D.; Aragón-Cuevas, F.; Gepts, P. Genetic composition and spatial distribution of farmer-managed Phaseolus bean plantings: An example from a village in Oaxaca, Mexico. Crop. Sci. 2012, 52, 1721–1735. [Google Scholar] [CrossRef]
  63. Rohlf, F.J. NTSYS-pc: Numerical Taxonomy System (Ver. 2.2); Exeter Publishing, Ltd.: New York, NY, USA, 2008. [Google Scholar]
  64. Espitia, R.E.; Mapes, S.C.; Escobedo, L.D.; De la O. Olán, M.; Rivas, V.P.; Martínez, T.G.; Cortés, E.L.; Hernández, C.J. Conservación y uso de Los Recursos Genéticos de Amaranto en México; INIFAP, Centro de Investigación Regional Centro: Celaya, México, 2010; p. 200. [Google Scholar]
  65. Basantes, F.; Aragón, J.P.; Albuja, M. Cultivos andinos de importancia agro productiva y comercial en la zona 1 de Ecuador; Editorial UTN: Ibarra, Ecuador, 2022; p. 192. [Google Scholar]
  66. Informe Final. Proyecto Recolección de varios cultivos andinos en Ecuador; Instituto Nacional de Investigaciones Agropecuarias (INIAP): Quito, Ecuador, 1985; p. 100. [Google Scholar]
  67. Jurado, E.O. Estudio de la Producción y Comercialización del Amaranto (Amaranthus sp) en la Provincia de Imbabura; Trabajo de Grado; Facultad de Universidad Técnica del Norte, Ingeniería en Ciencias Agropecuarias y Ambientales: Ibarra, Ecuador, 2019. [Google Scholar]
  68. Cevallos, M.; Urdaneta, F.; Jaimes, E.; Rodriguez, M. Transición agroecológica de los sistemas de producción agrícola de la provincia de Imbabura Ecuador. Rev. Fac Agron. Luz. 2020, 37, 69–94. [Google Scholar]
  69. Monteros, C.; Nieto, C.; Caicedo, C.; Rivera, M.; Vimos, C. INIAP-ALEGRÍA; Primera variedad mejorada de amaranto para la sierra ecuatoriana, Boletín Divulgativo No.246, Programa de Cultivos Andinos; Estación Experimental Santa Catalina, INIAP: Quito, Ecuador, 1994; p. 24. [Google Scholar]
  70. Zimmerer, K.S. Geographies of seed networks for food plants (potato, ulloco) and approaches to agrobiodiversity conservation in the Andean countries. Soc. Natur. Resour. 2003, 16, 583–601. [Google Scholar] [CrossRef]
  71. Salazar, J.; De Lourdes, M.; Gutiérrez, B.; Torres, A.F. Molecular characterization of Ecuadorian quinoa (Chenopodium quinoa Willd.) diversity: Implications for conservation and breeding. Euphytica 2019, 215, 60. [Google Scholar] [CrossRef]
  72. Peralta, E.; Mazón, N.; Murillo, Á.; Villacrés, E.; Rivera, M. Catalogó de Variedades Mejoradas de Granos Andino: Chocho, Quinua, Amaranto, Sangorache, Para la Sierra Ecuatoriana; Publicación Miscelánea No. 151.Tercera Edición, Programa Nacional de Leguminosas y Granos Andinos, Estación; Experimental Santa Catalina INIAP: Quito, Ecuador, 2013; p. 63. [Google Scholar]
  73. González, M.S. Estudio de Flujo de Genes en Quinua (Chenopodium quinoa w.) en Campo de Agricultores Mediante el uso de Marcadores Microssatélites; Trabajo de Grado; Departamento de Ciencias de la Vida Ingeniería en Biotecnología, Escuela Politécnica del Ejercito: Pichincha, Ecuador, 2009. [Google Scholar]
Figure 1. Geographical map of Ecuador indicating the collection sites of black amaranth accessions in the provinces of Imbabura, Tungurahua, and Cañar during 1981–1986 (Collection A) and 2014–2015 (Collection B).
Agriculture 13 00034 g001
Figure 2. Assignment model of 152 black amaranth samples at the K = 2 genetic clusters by using nine SSR markers (Cluster 1 in red and Cluster 2 in green). Membership coefficients (Q) are depicted vertically for each sample. Sample numbers coincide with the number assigned in Supplementary Table S1.
Agriculture 13 00034 g002
Figure 3. Principal coordinates analysis (PCoA) of the 17 genotypes (G1 to G17) found in the 139 black amaranth accessions, and the three genotypes found in the commercial variety INAP-Alegría (G_A1, G_A2, and G_A3). Percentages of variation explained by each of the first two coordinates are indicated. Color of each genotype matches that assigned in the STRUCTURE analysis: Cluster 1 in red and Cluster 2 in green. Genotypes of commercial variety INIAP-Alegría are in blue.
Agriculture 13 00034 g003
Figure 4. Minimum spanning tree (MST) showing the genetic relationships of 17 genotypes (G1 to G17) found in 139 black amaranth accessions. The circle sizes are proportional to the abundance of each genotype (see Table 4), and the colors indicate the province to which the samples that present them belong. The association of the two groups of Genotypes (I and II, circles with dashed lines) with the two color Morphotypes (I and II; see Delgado et al. [32]) differentiated in the morphological characterization is indicated.
Agriculture 13 00034 g004
Table 1. Primer sequences, repeat motifs, florescent dyes used to label the forward primer and annealing temperatures for nine selected SSR loci used for molecular characterization of the black amaranth accessions.
No._Locus aForward Sequence (5′-3′)
Reverse Sequence (5′-3′)
Repeat MotifFluorescent Dye bAnnealing Temp. (°C)
1_GB-AMM-051GAGGAGACTTGGTGGCCT
TCGGGAGCAATGTAGCAC
(AGA)5FAM50
2_GB-AMM-099AAATTGACAATGCGCAGC
TTCCTCACCAAAATTGCC
(TCA)12(TCT)5FAM50
3_GB-AMM-136TCAGCAAAACATGATCAACAA
GTTGCTGCATTGGTGGTT
(GAA)6(CCA)6CFR59050
4_AHAAC011CCGTCTGTGCTGTATTGAGG
GGCCACTTGGGTTTATTCCT
(GTT)8FAM50
5_AHAAC021GAGTTATGGCCGAATTTCCA
TTGGTGTTGTTCAACATTTGG
(CAA)9CFG54050
6_AHAAT030CCAGATGCCAGATGTGCTTA
CCAAACAAGGTCGATTTCAGA
(ATT)11Q57052
7_AHAAT051TGTAACACTGCGCTACAAATCA
CCCTCAGAGTTTCCTTCACC
(AAC)7AGC(AAT)AGT(AAT)20CFR59050
8_AHAAT063TCGGAAATTAGTCGGAGGTTT
CGATGACAATTATGTAACCCAATG
(TTA)25CFG54050
9_AHAC062GGCTCCCAAGTCACAGTGTT
TCATCTTTATCGTTGATTCGTTTC
(AC)11(AGACACAC)2(AC)5 (AGACACAC)4(AC)4Q57052
a 1 to 3, SSR loci described by Lee et al. [48]; 4 to 9, SSR loci described by Mallory et al. [47]. b CFR590: CAL Fluor Red 590, CFG 540: CAL Fluor Gold 540, Q570: Quasar 570 (LGC Biosearch Tech., Petaluma, CA, USA).
Table 2. Genetic diversity parameters calculated for each of the nine microsatellite loci analyzed in 152 black amaranth samples. Na: number of alleles, Ne: effective number of alleles, Ng: number of genotypes, Ho: observed heterozygosity, He: expected heterozygosity, I: Shannon information index, C: probability of coincidence, and D: discrimination power.
No._LocusNaNeNgHoHeICD
1_GB-AMM-05141.14940.0130.1290.2780.8640.136
2_GB-AMM-09921.14030.0260.1230.2430.8520.148
3_GB-AMM-13641.15050.0130.1300.2920.8630.137
4_AHAAC01121.11830.0070.1060.2160.8880.112
5_AHAAC02131.14940.0130.1290.2730.8640.136
6_AHAAT03041.16440.0130.1410.2950.8530.147
7_AHAAT05161.16650.0260.1430.3440.8400.160
8_AHAAT06361.17550.0070.1490.3580.8510.149
9_AHAC06251.18360.0070.1550.3730.8390.161
Mean4.01.1554.30.0140.1340.297--
Cumulative36-38---0.2490.751
Table 3. Genetic diversity parameters calculated for provinces of Imbabura, Tungurahua, and Cañar in accessions collected between 1981 and 1986 (Collection A) and accessions collected in 2014 and 2015 (Collection B). % P: percentage of polymorphic loci, and G: number of genotypes (allelic combinations). Average values of allele number (Na), effective number of alleles (Ne), observed heterozygosity (Ho), expected heterozygosity (He), and Shannon information index (I). For each parameter (data column), different letters indicate significant differences (p < 0.05).
Provinces (Collection)% PGNaNeHoHeI
Imbabura (A)10062.11 a1.770 a0.034 a0.435 a0.637 a
Tungurahua (A)3341.33 b1.018 b0.009 a,b0.017 b,c0.039 b
Cañar (A)4451.44 b1.050 b0.023 a,b0.043 c0.087 b
Mean Collection A59.35.01.631.2790.0220.1650.254
Imbabura (B)10083.67 c1.417 c0.029 a0.292 d0.555 c
Tungurahua (B)1121.11 b1.007 b0.000 b0.007 b 0.016 b
Cañar (B)1121.11 b1.008 b0.000 b0.007 b0.017 b
Mean Collection B40.74.01.961.1440.0100.1020.196
Table 4. Distribution of the 17 genotypes (G1 to G17) found in accessions collected in the provinces of Imbabura, Tungurahua, and Cañar between 1981 and 1986 (Collection A) and 2014 and 2015 (Collection B). The number of samples (of the 152 analyzed) in each province and collection that presented each of the genotypes are indicated in parentheses. Different letters indicate significant differences.
Collection ACollection B
ImbaburaTungurahuaCañarImbaburaTungurahuaCañar
G1 (6)G1 (23)G1 (15)G1 (25)G1 (30)G1 (28)
G2 (3) G2 (3)
G3 (1) G3 (1)G3 (1)
G4 (1)G4 (1)
G5 (1)G5 (1)
G6 (1)
G7 (1)
G8 (1)
G9 (1)
G10 (1)
G11 (1)
G12 (1)
G13 (1)
G14 (1)
G15 (1)
G16 (1)
G17 (1)
Table 5. Matrix of Nei’s genetic distances among the six groups of accessions analyzed (two collections, A and B, x three provinces: Imbabura, Tungurahua, and Cañar).
Imbabura_ATungurahua_ACañar_AImbabura_BTungurahua_BCañar_B
Imbabura_A---
Tungurahua_A0.094---
Cañar_A0.0950.002---
Imbabura_B0.0370.0150.016---
Tungurahua_B0.0950.0000.0010.016---
Cañar_B0.0950.0000.0010.0160.000---
Table 6. Genetic diversity parameters calculated for accessions of Clusters 1 and 2 defined by STRUCTURE analysis. Average values of allele number (Na), effective number of alleles (Ne), observed heterozygosity (Ho), expected heterozygosity (He), and Shannon information index (I). For each parameter (data column), different letters indicate significant differences (p < 0.05).
NaNeHoHeI
Cluster 12.00 a1.018 a0.009 a0.018 a0.049 a
Cluster 22.89 b1.401 b0.089 b0.264 b0.510 b
Mean2,441,2100,0490,1410,279
Disclaimer/Publisher’s Note: The statements, opinions and data contained in all publications are solely those of the individual author(s) and contributor(s) and not of MDPI and/or the editor(s). MDPI and/or the editor(s) disclaim responsibility for any injury to people or property resulting from any ideas, methods, instructions or products referred to in the content.

