Article

X-ray Microtomography for Investigating Pore Space and Its Relation to Water Retention and Conduction in Highly Weathered Soils

by
Thaís Nascimento Pessoa
1,*,
Talita Rosas Ferreira
2,
Luiz Fernando Pires
3,
Miguel Cooper
1,
Daniel Uteau
4,
Stephan Peth
5,
Carlos Manoel Pedro Vaz
6 and
Paulo Leonel Libardi
1
1
Department of Soil Science, University of São Paulo-“Luiz de Queiroz” College of Agriculture, Pádua Dias Avenue, 11, Piracicaba 13418-900, Brazil
2
Brazilian Synchrotron Light Laboratory (LNLS), Brazilian Center for Research in Energy and Materials (CNPEM), Campinas 13083-970, Brazil
3
Laboratory of Physics Applied to Soils and Environmental Sciences, State University of Ponta Grossa, Ponta Grossa 84030-900, Brazil
4
Department of Soil Science, Faculty of Ecological Agriculture, University of Kassel, 37213 Witzenhausen, Germany
5
Institute of Soil Science, Leibniz Universität Hannover, 30419 Hannover, Germany
6
Embrapa Agricultural Instrumentation, São Carlos 13560-970, Brazil
*
Author to whom correspondence should be addressed.
Agriculture 2023, 13(1), 28; https://doi.org/10.3390/agriculture13010028
Submission received: 20 November 2022 / Revised: 15 December 2022 / Accepted: 19 December 2022 / Published: 22 December 2022
(This article belongs to the Special Issue X-ray Computed Tomography in Agricultural Systems)

Abstract

:
Soil structure controls soil hydraulic properties and is linked to soil aggregation processes. The aggregation processes of Oxisols are controlled mainly by clay mineralogy and biological activity. Computed microtomography (µCT) may be a tool for improving the knowledge of the hydraulic properties of these soils. Thus, this study brings an advance in the use of 3D image analysis to better comprehend the water behavior in tropical soils. In this work, three Oxisols were studied with the objective to (i) characterize the soil water retention curve (SWRC), the corresponding pore size frequency, and the saturated hydraulic conductivity (Ksat); (ii) use µCT to obtain, based on 3D images of soil structure and pore size distribution; and (iii) correlating parameters from SWRCs, Ksat, and µCT with other physical-hydric, chemical, and mineralogical attributes. Rhodic Haplustox—P1, Anionic Acrustox—P2, and Typic Hapludox—P3 were the three studied Oxisols. The differences among the SWRCs were related to the microgranular and block type’s structure morphology, which modified the soil pore space. The pore size frequency was calculated from SWRCs for pores with diameters of 87 ± 2 μm in P1, 134 ± 11μm in P2, and 175 ± 18 μm in P3. Pore size distribution from µCT was determined for the range of 20–100 µm, mainly with the highest percentages: 12 ± 1.09% for P1 and 12 ± 1.4% for P2. Pore connectivity was assessed from images by calculating Euler Numbers (EN), with the differences related to the biggest pore (ENbigpore): P1 (−44,223 ± 10,096) and P2 (−44,621 ± 12,573) showed more connected pores (ENbigpore) in comparison to P3 (−11,597 ± 6935). The parameter ENbigpore was decisive in understanding the water retention and conduction processes of the studied soils. The better-connected pore space increased Ksat in P1 (220 ± 0.05 mm h−1) and P2 (189 ± 0.1 mm h−1) in comparison to P3 (20 ± 0.3 mm h−1) and modified the shape of SWRCs.

1. Introduction

Soil structure controls hydraulic properties and regulates soil functions and ecosystem services [1]. The pore space organization is essential for predicting soil water retention, water and solute transport, plant availability water, soil temperature and aeration, and finally the intermediation of biogeochemical cycles. Soil structure functionality varies according to the pore characteristics, which, in turn, are a result of soil aggregation processes [2]. Soil aggregation and the development of soil structure interfere with the architecture and dynamics of the pore space [3].
Aggregation processes in highly weathered soils are controlled mainly by iron/aluminum oxides and kaolinite, but in some cases, other minerals (e.g., vermiculite with Hydroxyl-Al) may coexist [4,5]. All processes are regulated by intense weathering and, therefore, for the thermodynamic stability of the minerals present in the soil. According to FAO [6], Oxisols (Ferralsols) cover approximately 750 million hectares in the world and are found mostly in the humid tropics on the continental shields (e.g., South America and Africa). The main physical characteristics of these soils are stable microaggregates, high porosity, and good permeability and water infiltration. The mechanisms of the genesis of aggregates in Oxisols are complex, influenced by biological activity and mainly by the mineralogy of the clay fraction, because iron oxides (e.g., goethite and hematite), aluminum oxides (e.g., gibbsite), and kaolinite are essential for the formation of microaggregates with high stability [7,8].
Soil hydraulic properties are related to soil structure, i.e., the porous space, pore size distribution, pore morphology, and pore connectivity. One of the soil properties used to understand the pore system is the soil water retention curve (SWRC). This soil physical attribute expresses the relationship between soil water content (θ) as a function of matric potential (ψm). The soil water retention curve may be applied for studying soil water retention energy and to estimate the unsaturated hydraulic conductivity function [9] and/or saturated hydraulic conductivity [10], and plant available water. Using capillary theory (Young–Laplace equation) [11], it is possible to estimate pore size distributions from the SWRC, which is conceptually divided into textural and structural porosity. The latter is related to transmission pores and the former corresponds to pores formed by the individual arrangement of particles [2,12]. This type of pore system, associated with a “bimodal pore size distribution,” is commonly found in tropical soils typically composed of inter- and intra-aggregate pores [13].
X-ray microtomography (µCT) has been used as an important tool in studies of soil and sediments [14], particularly in the prediction of solute transport in structured soils [15], soil aeration, and redox potential as a function of pore connectivity [16], changes in soil structure as a function of soil use and management [17,18,19,20], and understanding the physical-hydric properties related to soil aggregation and mineralogy [21]. X-ray microtomography opens a great perspective for advancing the quantification on the structure of tropical soils and can thus contribute to understanding the relationship between pore networks and soil processes and functions [22]. In addition, µCT can be considered a complementary technique to SWRC measurements, especially with respect to characterizing transmission pores, which are crucial for transport and for which, besides pore size, other characteristics like pore connectivity are important and can be determined from pore space images. The capillary theory assumes the pore space as a capillary bundle model, which hardly represents the true complexity of the soil pore space [23]. Another problem is related to the unimodal function described by the van Genuchten model [24], which may not often represent the bimodal and complex pore size distribution found in highly weathered Oxisols [25]. Thus, µCT not only enables access to the complexity of the pore space by enabling detailed analysis of pore sizes, but also anisotropy and connectivity, which are important for understanding the dynamic processes in the soil.
The formation of the microstructure and the dynamics of the pore space in Brazilian Oxisols were characterized by different techniques (2D and 3D image analysis) by Pessoa et al. [21]. The image resolution used in these techniques was sufficient for comparing 3D image parameters with saturated hydraulic conductivity. However, most of the parameters obtained from 3D image analysis, if not all, depending on the spatial scale considered. Therefore, the spatial resolution of the image determines the range of pore sizes that can be assessed and, typically, increasing the image resolution requires reducing the sample size [26]. The pore space of Oxisols can often present intra and inter-aggregate porosity (i.e., bimodal pore size distribution) due to the specific aggregation mechanisms of these soils [2,7,8]. The presence of this complex pore space is directly linked to the mineralogy of the clay fraction (e.g., iron/aluminum oxides and kaolinite) and the active biological activity characteristics of this class of soils [4,5,13]. The type of structure present (e.g., blocks or microgranular) directly interferes in the pore space configuration. Previous studies have evaluated the relationship between the type of structure of Oxisols and their physical-hydric behavior [13,21]. However, scarce studies have clarified the direct connection between aggregate morphology—pore space configuration—soil water retention and conduction properties, especially in highly weathered soils. Thus, the hypotheses of this study were: (a) the morphology of soil aggregates modifies the pore space and, therefore, pore size distribution, pore size frequency, and pore connectivity; (b) a better connectivity pore space increases the saturated hydraulic conductivity, modifying the shape of SWRCs and the soil water availability to plants; and (c) parameters from 3D image analysis are essentials to improve the understanding of the physical-hydric behavior of highly weathered soils. The objectives of this work were to (i) characterize the behavior of SWRC, its pore size frequency, and the saturated hydraulic conductivity (Ksat); (ii) use the µCT to obtain parameters of porous space and pore size distribution; and (iii) correlate the parameters from the 3D image analysis with the physical-hydric properties, as well as the chemical and mineralogical attributes of the Oxisols.

2. Materials and Methods

2.1. Soil Sampling and Study Areas

Typical soil profiles of clayey Oxisols were classified according to Soil Taxonomy [27] and to the Brazilian Soil Classification System [28]. The studied Oxisols were: P1—Rhodic Haplustox/Latossolo Vermelho Distroférrico típico, climate type Aw-tropical zone with dry winter (20°13′18.5″ S, 48°01′40.3″ W); P2—Anionic Acrustox/Latossolo Vermelho Acriférrico típico, climate type Cwa-dry winter and hot summer (21°28′23″ S, 47°53′50″ W); and P3—Typic Hapludox/Latossolo Bruno Distrófico típico, climate type Cfb-humid subtropical zone with temperate summer (25°08′54″ S, 50°09′06″ W). The decisive factors for choosing the soil profiles for this study were mainly different proportions of kaolinite argilomineral, a quantitative discrepancy between the iron oxides (e.g., goethite and hematite), and aluminum oxides (e.g., gibbsite), different climatic conditions, and different parent material for soil formation. All these factors affect the degree of development of the structure of Oxisols, which can present a more pronounced formation of microaggregates (microgranular structure) or the formation of a block-type structure [21].
Undisturbed and disturbed soil samples were collected on top of the Bw horizons of the three chosen Oxisols (0.80–1.35 m depth), under native forest conditions with the aim of preventing the probable influence of soil use and management on the physical-hydric properties of Oxisols. Physical analyses such as saturated hydraulic conductivity (Ksat), soil bulk density (ρ), and porosity (β) were determined (ten replicates) by collecting ten undisturbed soil samples in cylinders of dimensions of (0.07 m × 0.075 m) using an Uhland soil sampler. For the determination of SWRCs, five undisturbed soil samples for each matric potential were collected in cylinders with dimensions of (0.05 m × 0.05 m) using a type Uhland soil sampler, totalizing 50 samples for each soil. For µCT scanning, the samples were collected in blocks using plastic containers to support them and maintain the soil structure. The structural morphology of the soils was characterized in the field during the soil sampling. Disturbed soil samples were also collected (five replicates) to conduct the particle size analysis, along with the particle density (ρs), chemical, and mineralogical analyses [21].

2.2. Soil Characterization

Soil particle size distribution was first determined by pre-treatment with HCl 0.01 mol L−1 to remove poorly crystallized iron/aluminum oxides because these forms affect the degree of soil microaggregation and interfere with the efficiency of soil dispersion [29,30]. Next, the samples were dispersed chemically with a solution of 0.1 mol L−1 NaOH and physically shaken for 16 h. Sand fractions were separated by sieving, and silt and clay fractions were quantified by pipette method [31,32]. The water-dispersible clay was done by the same method, without the use of chemical dispersant. The degree of flocculation (DF) of the soil was calculated by the equation: DF = [clay-water dispersible clay)/clay]100. Soil specific surface area (SSA) was determined with the BET method (Brunauer-Emmett-Teller) [33]. Soil bulk density (ρ) was determined by the volumetric ring method [34], soil particle density (ρs) was determined by helium gas pycnometer [35], soil porosity (β) was calculated by equation: β = 1 − (ρ/ρs), and saturated hydraulic conductivity (Ksat) was determined in steady-state conditions by applying the Darcy–Buckingham equation with the support of a constant-head permeameter [36].
Mineralogical analysis was performed in the clay fraction after treatment to remove organic matter with a solution of 12% NaClO. The main minerals that composed the clay fraction of studied Oxisols were goethite, hematite, gibbsite, kaolinite, and vermiculite with Hydroxyl-Al (VHE) [21]. Goethite and hematite were quantified by the diffuse reflectance spectroscopy (DRS) technique, and from that, the relation of the amount of Fe2O3 (determined by citrate-bicarbonate-dithionite—CBD), which obtained the crystalline and poorly forms of oxides. The amplitudes of spectrum bands from 420 to 450 nm and from 530 to 580 nm were related to goethite and hematite, respectively. The Hm/(Hm + Gt) ratio was calculated with that information [32,37,38,39]. Kaolinite and gibbsite were quantified by differential thermal analysis (DTA) in a clay fraction without iron oxides that were removed with CBD solution. The peaks between 240 and 256 °C and 503 and 517 °C were associated with gibbsite and kaolinite [39]. X-ray diffraction (XRD) was done in natural clay without soil organic carbon (SOC) and iron oxides to qualitatively identify the kaolinite and gibbsite minerals. To identify the peaks of probable 2:1 mineral in P3, the clay fraction was saturated with MgCl2 and solvated with ethylene glycol [40] because the subtropical conditions of pedogenesis of this Oxisol may favor the formation of 2:1 mineral. The samples were scanned with a diffractometer ranging from 3° to 65° (2θ) [41]. The following chemical analyses [32] were done: pH (in H2O and KCl 1 mol L−1), soil organic carbon (SOC), and Fe2O3/Al2O3 (OAA—ammonium oxalate acid and CBD methods). Detailed information about the physical, chemical, and mineralogical analyses is presented by Pessoa and Libardi [13] and Pessoa et al. [21].

2.3. Soil Water Retention Curves

Soil water retention curves were determined using Haine’s funnels (ψm of −2, −4, −6, and −8 kPa) and Richard’s pressure chambers (ψm of −10, −30, −100, −300, −500, and −1500 kPa) [36]. Each ψm was determined using five different undisturbed samples (n = 5), totaling 50 samples for each SWRC. The use of a separate set of samples at each potential was to avoid intense wetting/drying cycles, maintain the hydraulic contact of the soil sample with the porous plate in each potential, and also to avoid the possibility of opening of pores/fissures, especially in P3, which presents the VHE mineral. The time for hydraulic equilibrium of soil samples at each matric potential to be reached varied from two days to one month [13]. The experimental data was fitted to Equation (1) used by van Genuchten [24]:
θ = θ r + ( θ s     θ r ) [ 1 + ( α | ψ m | ) n ] m
where θ is the volumetric soil water content (m3 m−3); ψm is the matric potential (m); θs and θr are the saturation and residual soil water content, respectively (m3 m−3); α (m−1), m and n are empirical parameters. The parameters α, m, and n were estimated from Equation (1) considering the restriction m = 1 − (1/n). θs and θr were also estimated from Equation (1) fitting. For the study of frequency of pores, Equation (2) was obtained from differentiating Equation (1) with applying the capillary theory:
d θ   dlog ( d ) = θ s θ r θ s   m n ( A ) n   d n [ 1 + ( A ) n d n ] m 1
where A = 4σα/ρwg; σ is the water surface tension (0.07194 N m−1); ρw is the water density (c. 1000 kg m−3); g the acceleration of gravity (c. 9.81 m·s−2); and d (m) is the equivalent pore diameter. In this study, available water content (AWC) was considered as the difference between the field capacity (FC; correspondent to ψm −10 kPa) and the permanent wilting point (PWP; correspondent to ψm −1500 kPa). More details about equations and procedures performed for the SWRC evaluations are presented by Pessoa and Libardi [13].

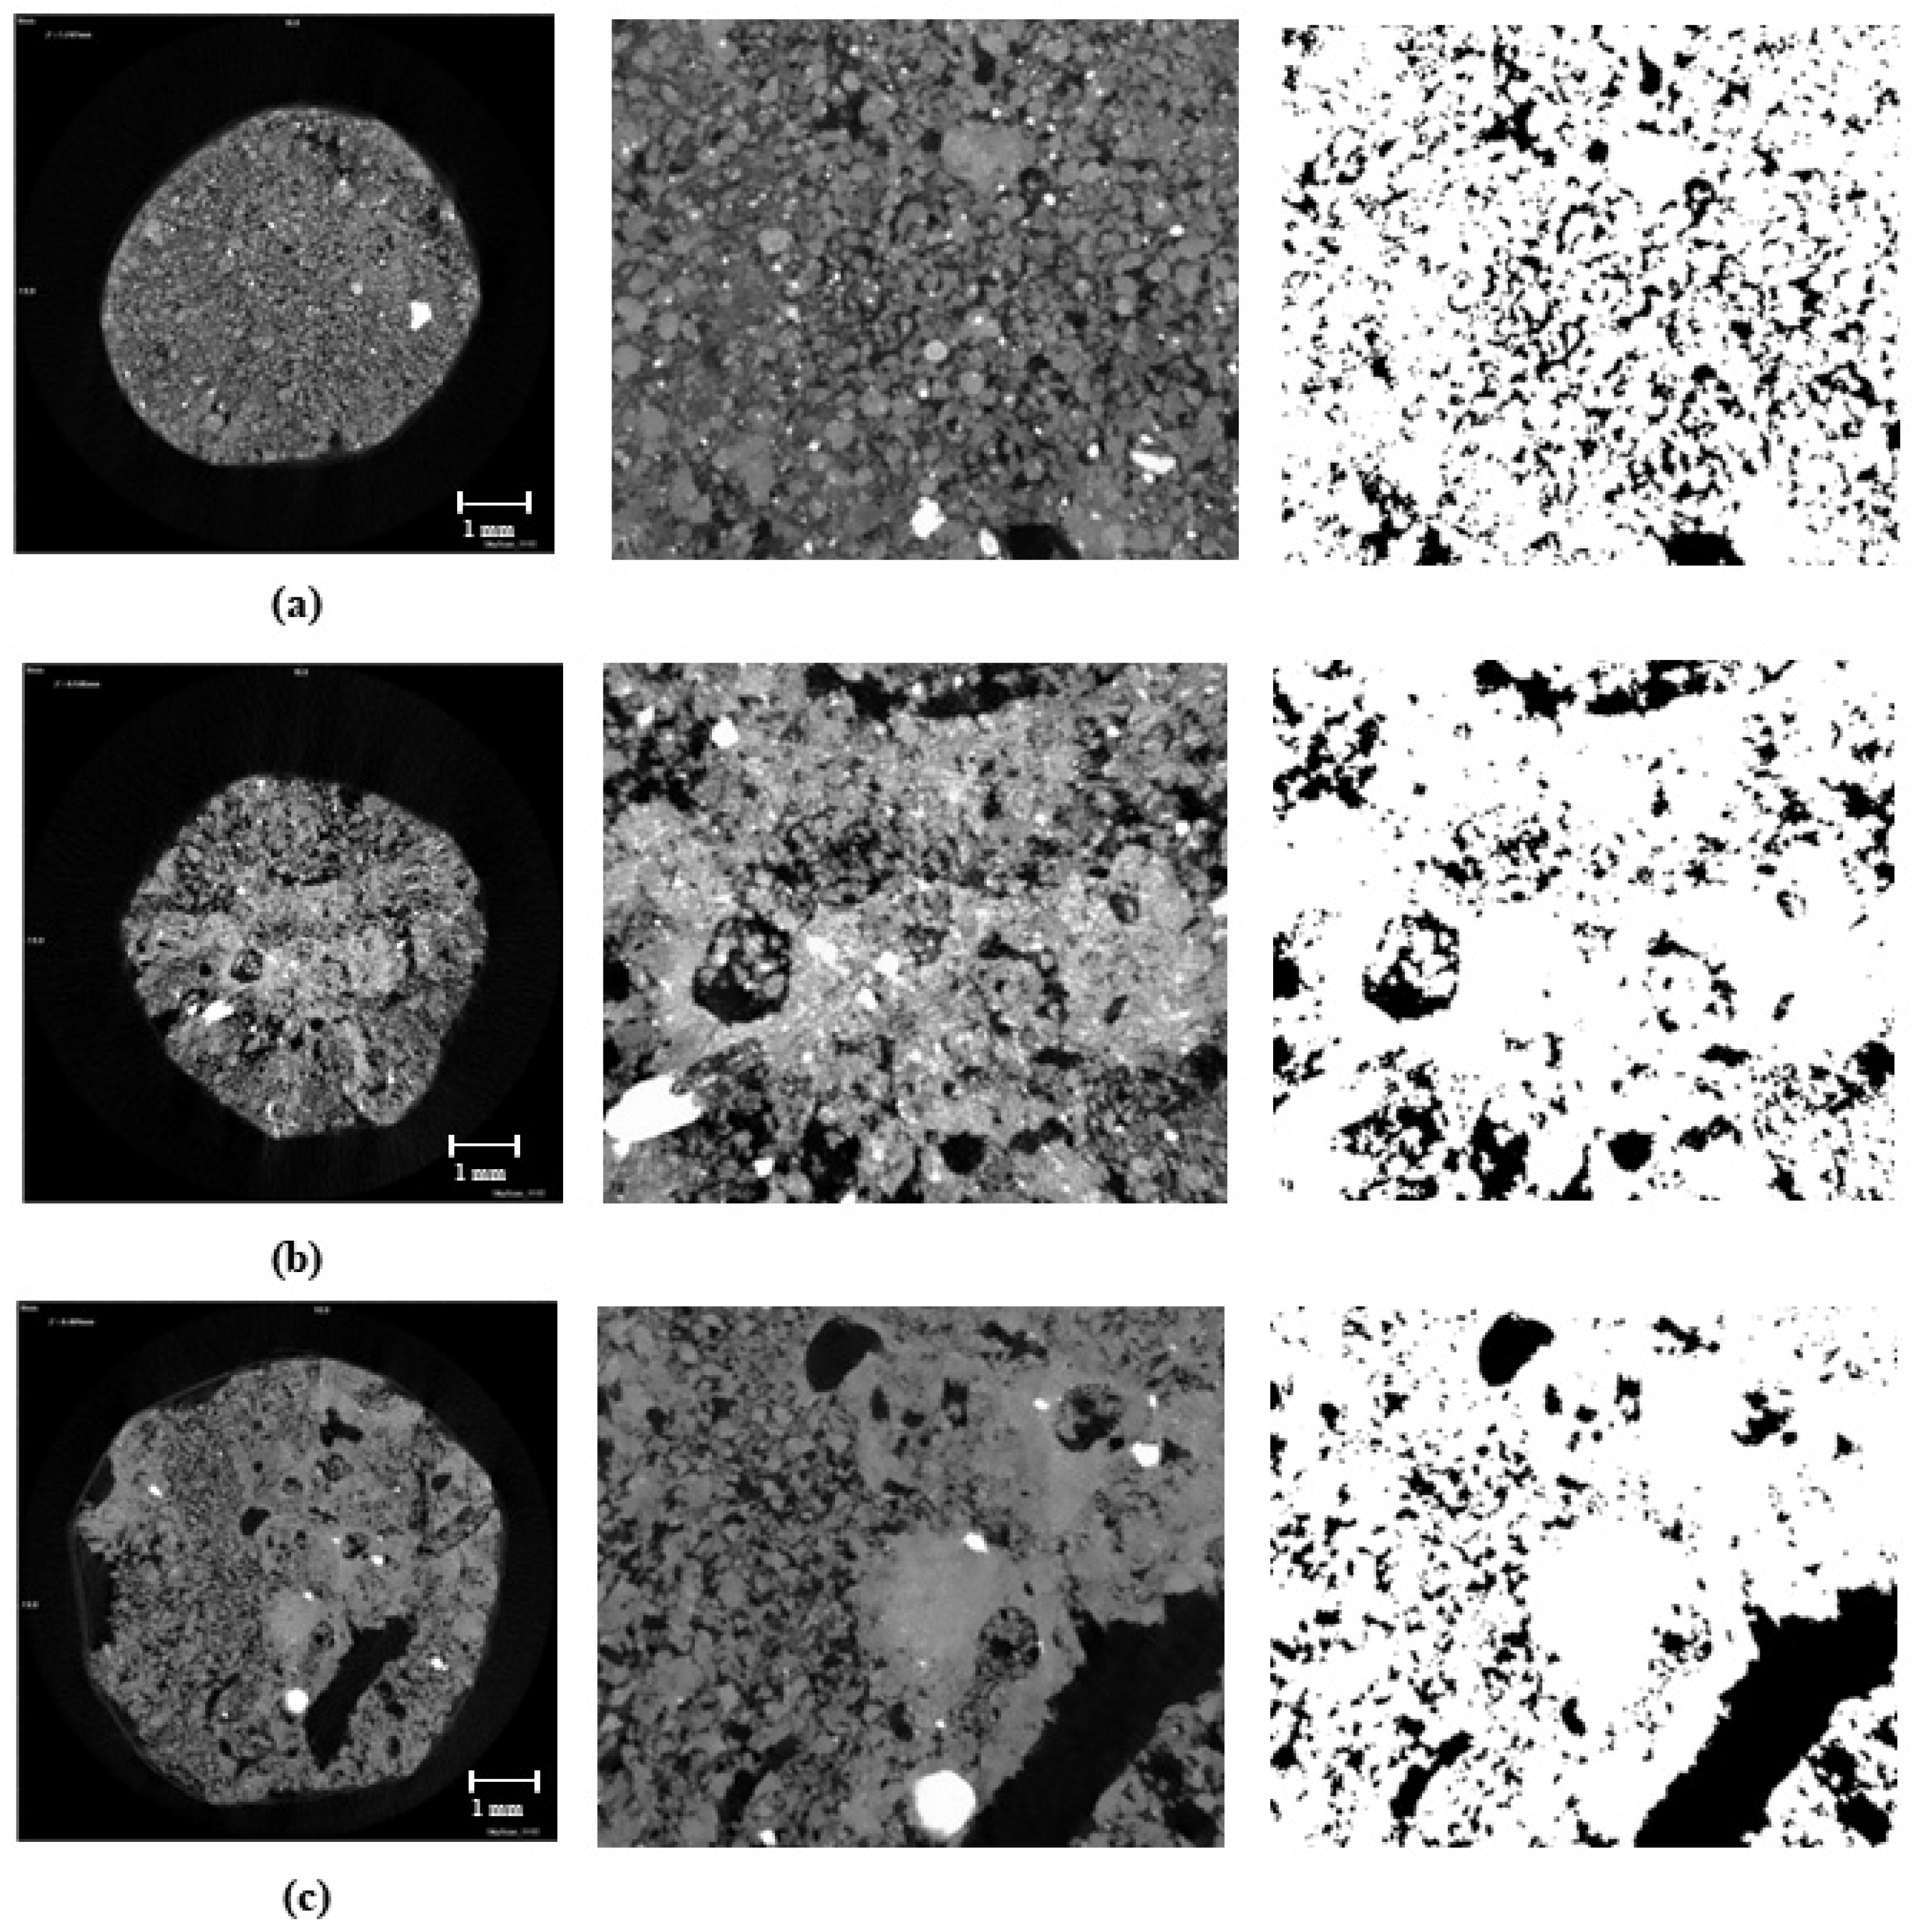
2.4. X-ray Computed Microtomography (μCT) Scanning and 3D Image Analysis

For the scanning step, soil blocks collected with the support of plastic containers (0.45 m × 0.22 m) were air-dried, separated into small pieces. In sequence, subsamples (0.020 m × 0.010 m) were prepared. The scanning was performed in 4–6 replicates using a SkyScan 1172 (Bruker microCT®, Kontich, Belgium) at an energy of 100 keV. To harden the beam, a filter with Al + Cu was used and adjustment in the camera was done with the objective of obtaining a voxel size of c. 9 µm. The projections were done in steps of 0.2° from 0 to 180°, totalizing c. 940 projections with an average time of c. 2 h/image acquisition. The software NRecon® (Bruker microCT®, Kontich, Belgium) was used for the reconstruction of 3D images [42].
The software’s ImageJ® and ToolIP® (Tool for Image Processing) were used to perform 3D image analysis. The MAVI® (Modular Algorithms for Volume Images, Fraunhofer ITWM, Kaiserslautern, Germany) toolbox is implemented in ToolIP® to solve numerous features on 3D images. Initially, a region of interest covering most parts of the sample was selected (600 to 800 voxels in each direction). The images were filtered with a non-local-means filter with the aim of reducing noise of the image before segmentation. Otsu’s algorithm [43] was used to threshold (separation of the porous space and the solid matrix). In sequence, the following parameters from the pore space were obtained: total resolved pore volume (TRPV), volume of the biggest pore (where biggest means the most voluminous pore), pore size distribution (PSD) by hydraulic diameter (which was calculated on the basis of the local maximal inscribed ball fitting into each pore region), Euler number (EN) of the biggest connected pore (ENbigpore), ENtotal (EN normalized by the volume of sample), and surface density (SurfDens) [21,44,45].

2.5. Data Analysis

The Kolmogorov–Smirnov test was applied to confirm hypotheses of normality. The data were analyzed from 95% confidence intervals. The confidence intervals were used to compare the soil water content obtained from SWRCs, parameters from SWRCs (e.g., FC, PWP, and AWC), and 3D image analysis parameters (e.g., TRPV, PSD, Euler number, and SurfDens). The efficiency of the equation fitting to SWRCs was tested by the coefficient of determination (R2) and the root-mean-square error (RMSE). The Pearson’s correlations (α = 0.05) were used to link SWRCs parameters, 3D image analysis parameters, and physical, chemical, and mineralogical attributes. Additionally, a principal component analysis (PCA) to represent the components with higher weight was done by a graphical type BIPLOT. Statistical analyses were done with the support of the software’s Origin® and OriginPro®.

3. Results

3.1. Soil Characterization

The texture of the three Oxisols was clayey and the structural morphology was: (i) very small granular in P1, (ii) subangular block types very small/granular in P2, and (iii) subangular block types large/moderate in P3. The degree of flocculation varied from 68.50 to 99.65% and bulk density ρ presented low values (0.89–1.03 kg dm−3), β varied from 0.66 to 0.68 m3 m−3, and Ksat were higher in P1 (219.81 ± 0.05 mm h−1) and P2 (188.7 ± 0.1 mm−1) compared to P3 (20.2 ± 0.3 mm h−1) (Table 1). The chemical composition indicates low pHH2O (4.18–5.30), a positive ΔpH in P2, and a low predominance of exchange bases (Ca2+, Mg2+, and K+), which influences the presence of Al3+ and potential acidity (Table S1—Supplementary Material). The mineralogy was composed by kaolinite, goethite, hematite, and gibbsite. In P3, peaks of 2:1 mineral (vermiculite with Hydroxyl-Al) were observed (Table S2—Supplementary Material). The highest kaolinite amount was found in P2 (370.37 g kg−1), gibbsite in P1 (285.56 g kg−1), goethite in P3 (72.68 g kg−1), and hematite in P2 (132.52 g kg−1). The forms of Fe2O3 extracted with CBD were higher than that extracted with OAA. Fe2O3 was found in higher amount mainly in red Oxisols (P1 and P2), and Al2O3 in P3; SOC was higher in P3 (16.96 g kg−1) (Table S1) [21].

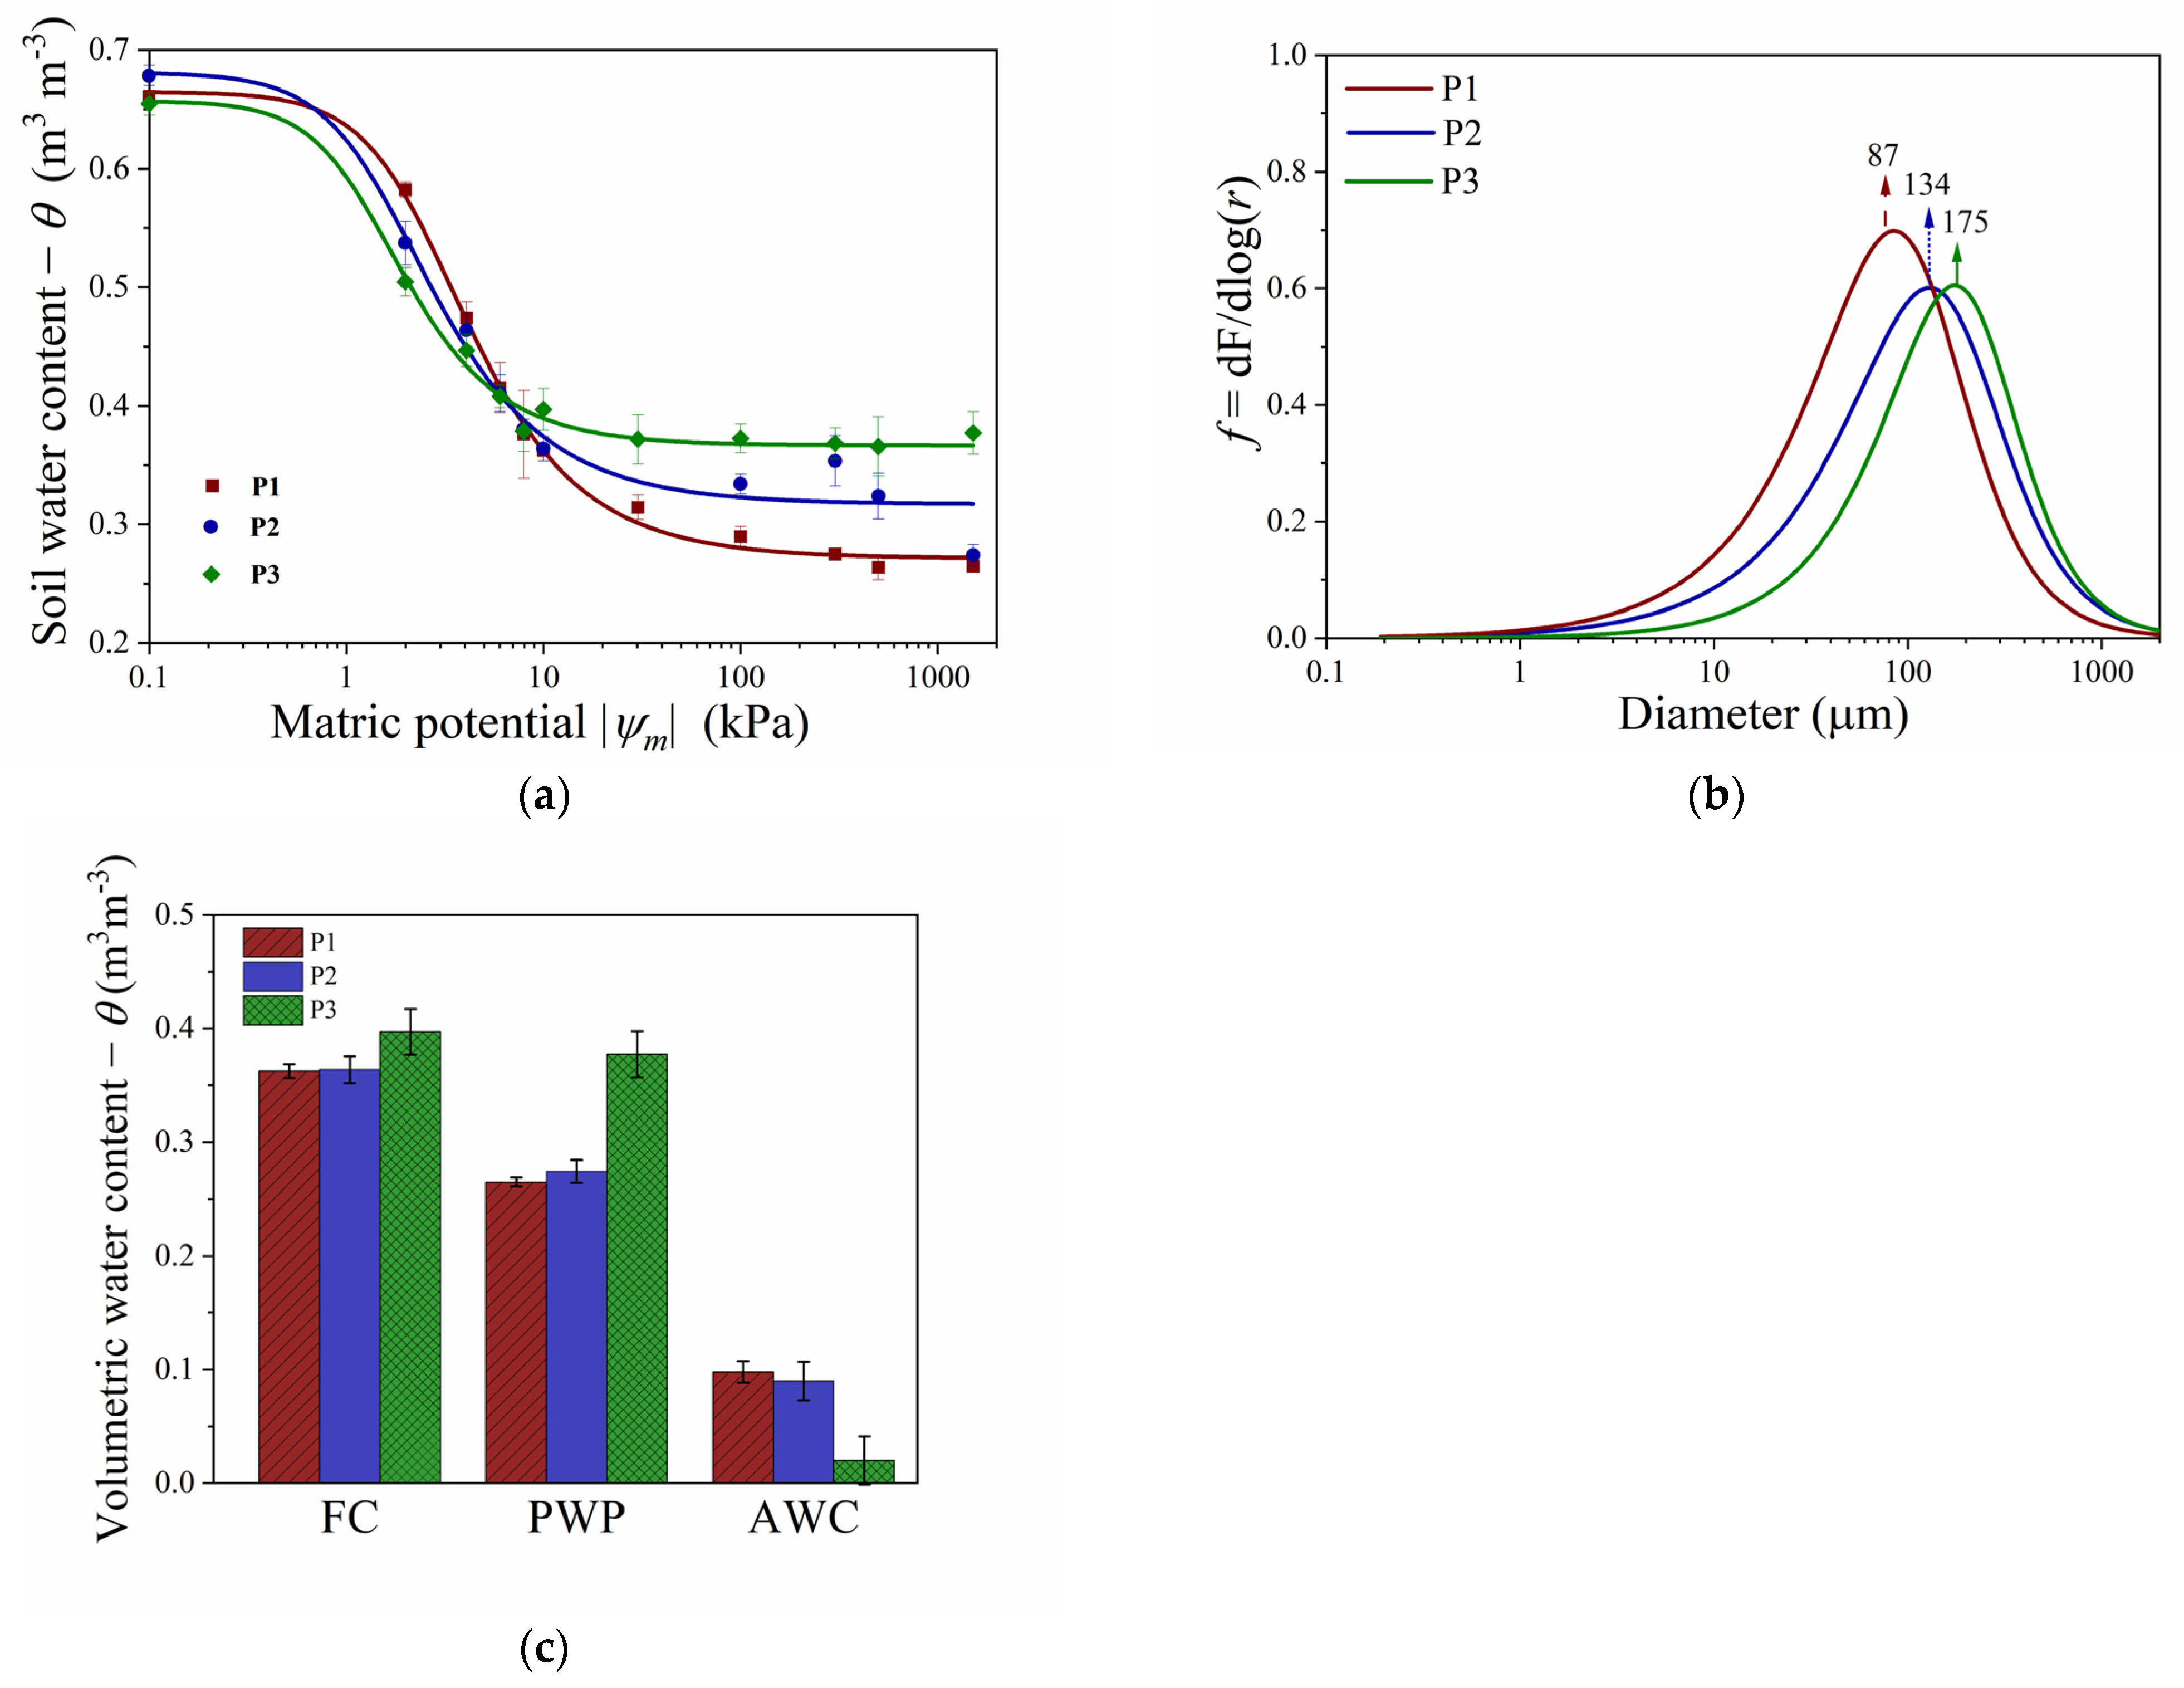
3.2. Soil Water Retention Curves

The R² values among soils varied from 0.981–0.992, and those of RMSE were lower than 5.59 × 10⁻⁴, thus showing a good fit to SWRC data. The soil water content at saturation θs varied between 0.657–0.681 m3 m−3 and θr between 0.271–0.366 m3 m−3 (Table 2). The soil water retention curves showed a tendency of higher water content in P1 > P2 > P3 for ψm = −2 kPa, the inverse for ψm ≤ −10 kPa, that is, P3 > P2 > P1. It is very important to highlight the higher water content observed in P3 with values that are practically the same as the matric potential values from −30 to −1500 kPa (Figure 1a). The curves of the f(log d) function obtained from Equation (2) showed that the diameter of maximum frequency (dmax) was 87 µm in P1, 134 µm in P2, and 175µm in P3 (Figure 1b). For the field capacity, P3 > P2 = P1, the permanent wilting point was higher in P3, and available water content was very small in P3 compared to P1 and P2 (Figure 1c).

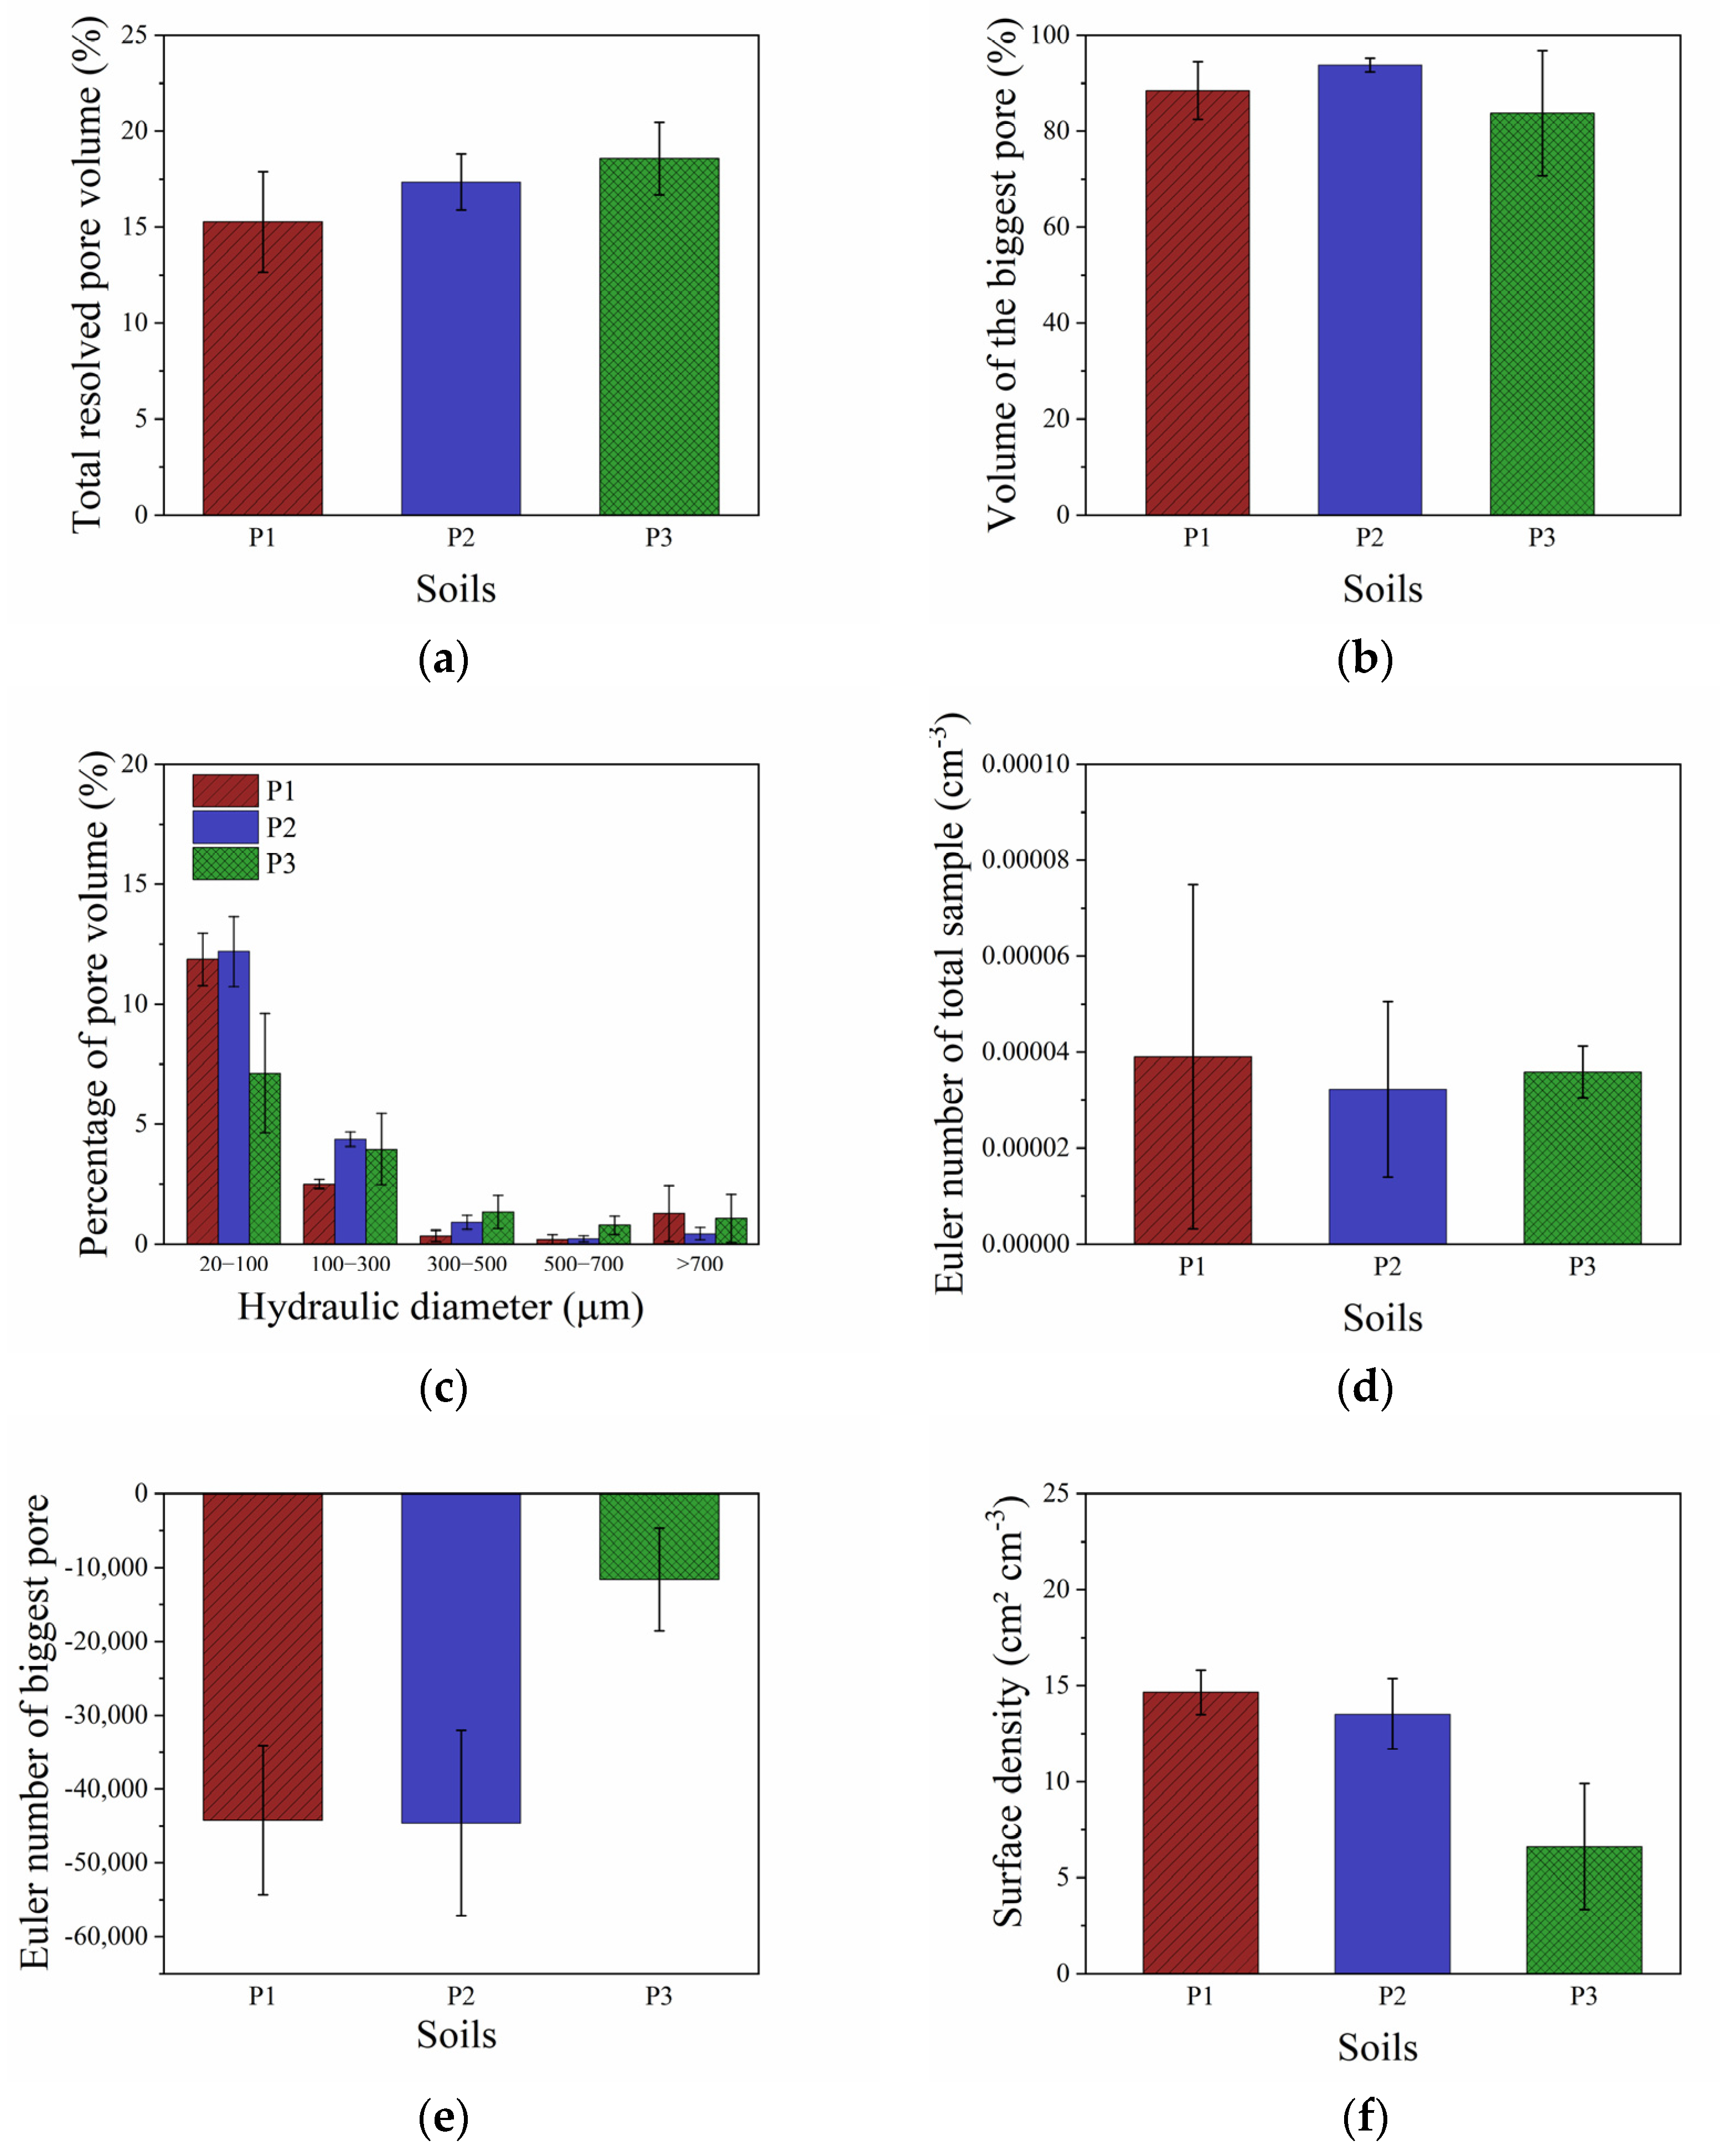
3.3. 3D Image Analysis Parameters

In Figure 2, the sequence of original microtomographic images, the region of interest for processing and the binarized (i.e., segmented) image for each soil is shown. The total resolved pore volume followed the order P3 (18.57%) > P2 (17.25%) > P1 (15.28%) (Figure 3a). The percentage of the volume of the biggest pore followed a trend of P2 (93.74%) > P1 (88.45%) > P3 (83.76%) (Figure 3b). The pore size distribution presented the highest percentage and differences (p < 0.05) in the 20–100 µm size class: P2 and P1 had porosities of 12.20% and 11.87% in this size class, and P3 had a porosity of 7.12%. For the 100–300 µm size class, there was a difference between P1 (2.50% porosity) and P2 (4.36% porosity) (Figure 3c).
Because of the high standard deviation for P1 and P2 concerning the values of the Euler Number for the total sample (ENtotal) (Figure 3d), no differences were detected among soils for this parameter. However, differences were detected for EN of the biggest pore (ENbigpore), the more negative values being found for P1 and P2 relative to P3; thus, the biggest pore in P1 and P2 presented better connectivity (Figure 3e). The pore surface density (SurfDens), which represents the ratio of pore surface to pore volume, was significantly higher in P1 and P2 than in P3 (Figure 3f).

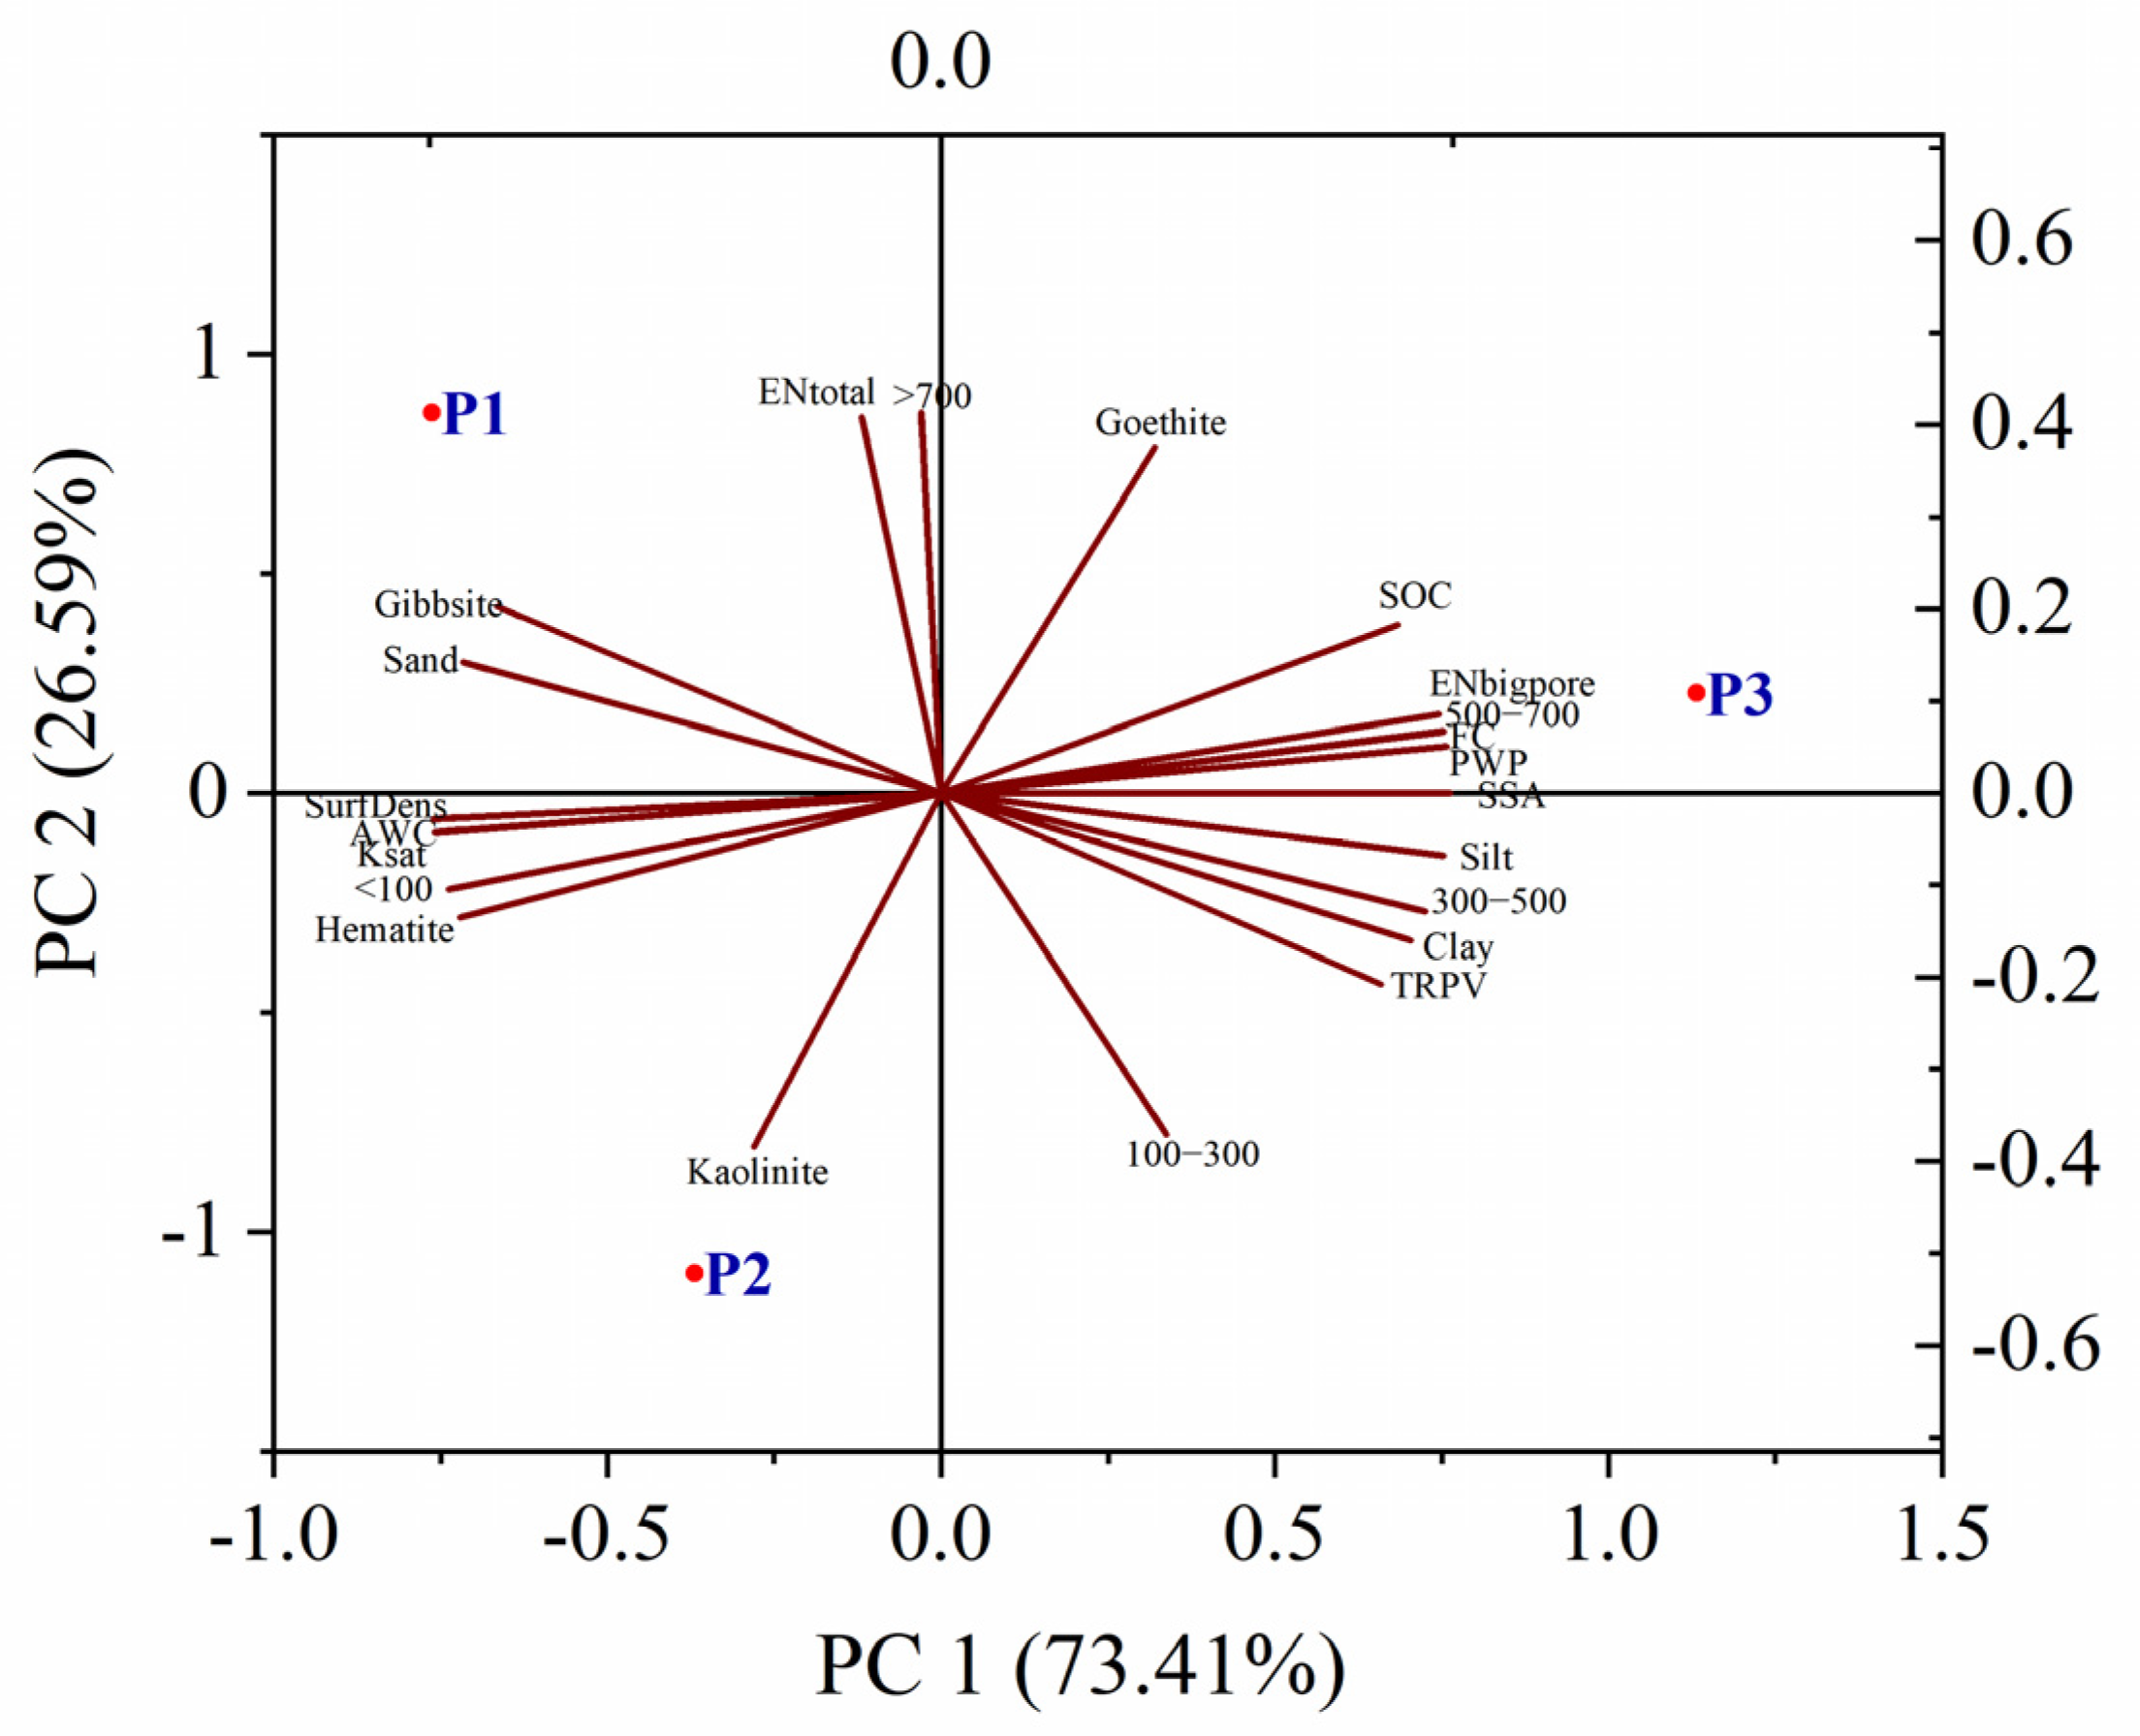
3.4. Correlations of 3D Image Analysis Parameters, Soil Attributes and Principal Component Analysis (PCA)

Table S3 shows the Pearson’s matrix of correlation between PSD and parameters from 3D image analysis, FC, PWP, Ksat, SOC, clay content, SSA, Gt, Hm, Gb, and K. The correlations, when significant, were very high (≥|0.99|). Significant positive correlations were found between pores of 20–100 µm vs. hematite; pores of 500–700 µm vs. FC, PWP, and ENbigpore; FC vs. PWP, and ENbigpore; Ksat vs. SurfDens. On the other hand, significant negative correlations were found for pores 20–100 µm pores vs ENbigpore; pores of 500–700 µm vs. Ksat; FC vs. Ksat; PWP vs. Ksat and SurfDens; SurfDens vs. SSA, and finally, Gt vs. K.
The results of the PCA analysis showed that 100% of the variation from the original data is explained for PC1 and PC2, whose values were 70.28% and 29.72%, respectively (Table S4). Thus, considering PC1 and PC2, most parts of the variables in PC1 had similar weights (>|0.25|). In PC2, the variables and pores of 100–300 µm, >700 µm, ENtotal, Gt, and K presented the highest weight (>|0.37|) (Table S4). The BIPLOT evidence correlations between variables and the tendency to formation of different groups. i.e., P1 was characterized by higher amounts of Gb, higher values for SurfDens, and lower values for ENtotal. The variables Ksat and pores of 20–100 µm showed similar behavior and concentered between P1 and P2 in BIPLOT (Figure 4). P2 had higher amounts of Hm and K, while P3 was the soil with more discrepancy in relation to soil attributes, evidenced visually by BIPLOT. P3 had higher amounts of soil organic carbon, specific surface area, and clay, as well as higher values of ENbigpore, field capacity and permanent wilting point, and predominance of pores of 500–700 µm and 300–500 µm (Figure 4).

4. Discussion

SWRCs showed a discrepancy in θ for lower ψm (i.e., −100 to −1500 kPa) (Figure 1a). The shape of SWRCs from ψm −2 kPa to −10 kPa was similar among Oxisols. However, the decrease of matric potential resulted in higher permanent wilting point for P3 and, consequently, a decrease in the available water content (Figure 1a,c). It is important to highlight that the soil texture is of the same class (>600g kg−1 of clay) (Table 1). However, soil aggregation, morphology, and aggregate size distribution were different in the studied soils [13,21].
The frequency of pores obtained from the SWRCs evidenced the predominance of the macropore class (>80 µm) in the Oxisols, according to the classification adapted from Brewer [46]. The maximum frequency of pores of a higher diameter was found in P3 (175.34 µm) and a frequency of pores with a smaller diameter was detected in P1 (86.74 µm) (Figure 1b). The smaller size of the more frequent pore diameter in P1 (Figure 1b) is related to the presence of interaggregate pores formed in typical microgranular structure in this Oxisol (Table S2). A similar trend was observed for the pore size distribution obtained by 3D image analysis (Figure 3c), in which a higher percentage of pore volume was found in the 20–100 µm diameter class, mainly in P1 and P2. The lower size limit of the macropores in this study was the diameter of 80 µm. Therefore, the pore size distribution obtained from SWRCs and 3D image analysis showed a predominance of macropores for the three Oxisols (Figure 3c). It is worth noting that all Oxisols presented a frequency for the macropore classes; however, the proportion between the different pore classes was also relevant in the physical-hydric behavior of the studied soils. In a previous study, it was shown that there is a strong influence on mesoporosity (<80 µm) [13]. The main differences were found for P1 and P2, which were the soils that presented the highest proportion of pores in the mesopore class in comparison to P3. The higher degree of microaggregation observed, mainly in P1, was strongly correlated with the lower hematite/goethite ratio and higher amounts of gibbsite in this Oxisol compared to P2 and P3 [21]. However, the structural morphology present in P2 also favors the formation of interaggregate pores, which influences the formation of relevant proportions of mesopores.
Significant differences for the pore size distribution were mainly found in the 20–100 µm size class. P1 and P2 had a higher percentage of pore volume in this size class compared to P3. The same behavior of the pore size distribution was observed for the Ksat; that is, Ksat was lower for P3 relative to P1 and P2 (Table 1). A negative correlation was observed for pores of 20–100 µm vs. ENbigpore (r = −0.99*), indicating an inverse behavior for these variables. Thus, when the porosity associated with pores in this size class increases, the ENbigpore becomes more negative, and therefore, the connectivity also increases [26,47]. In this way, the tendency of more negative ENbigpore found in P1 and P2 suggests more redundant connections and less isolated pores, which is in line with a higher Ksat and the behavior of the SWRCs [16]. Other negative correlations were observed for the porosity associated with pores of 500–700 µm diameters vs. Ksat (r = −0.99*) and FC vs. Ksat (r = −0.99*). Note that the percentage of pore volumes with a larger size (500–700 µm diameter), considered conductive pores, did not favor the increase of Ksat. This highlights the importance of observing other attributes related to pore space, such as connectivity and pore space geometry, to understand the physical-hydric properties [48]. Thus, a well-connected pore space can improve transport processes within the pore network of Oxisols [45].
Field capacity was also negatively correlated with Ksat, and it is very important to understand this behavior because even though P3 retained a high amount of-water in the FC, Ksat was low. This behavior gets worse as the soil reaches low matric potentials (e.g., PWP), when the water is strongly retained by the soil matrix.
With respect to the frequency of pore size, it is important to note the shift of the peaks of the diameter frequency curves per unit of diameter logarithm (Figure 1b). There is a tendency for P1 to shift to the left (range of smaller pores, e.g., mesopores) and for P2 to show an intermediate peak between P1 and P3. This behavior is related to the type of structural morphology of the studied soils. P1 presents a microgranular structure (aggregates < 250 µm), P2 presents an intermediate between microgranular and very small subangular blocks, and P3 presents large subangular blocks (aggregates > 250 µm) [21]. Therefore, the predominant structural morphology in each soil was decisive in the shape of the SWRCs, water retention, and conduction properties [13]. The type of microgranular structure often promotes rapid water drainage, giving the soil a physical-hydric behavior of sandy soil, even when they have a high clay content [49,50]. The pores that influence the rapid drainage of water under these conditions are mainly the interaggregate pores or structural pores [2,51]. The formation of structural pores in highly weathered soils is mainly a result of the amount of iron (Fe) and aluminum (Al) oxides present in the clay fraction. The Fe and Al oxides help in the cementation of the aggregates and disarrangement of the adjustment face-to-face of kaolinite plates, and interfere in the formation of the block-like or microgranular structure [3,4,8].
Soil P3 presented the highest soil water content and a lower AWC (c. 0.05 m3 m−3). This behavior may be associated with the following factors: (i) the interactions between (e.g., soil organic carbon, kaolinite, vermiculite with Hydroxy-Al between the layers—VHE) and goethite, hematite, and gibbsite (Table S1—Supplementary Material); mutually contributed to increasing of SSA, ultramicroporosity, cryptoporosity and soil water content for lower matric potentials [52,53,54,55]; (ii) subangular block structure, that promotes lower drainage of water in SWRC and Ksat compared to soil P1, which presents a typical microgranular structure (P1) [49,56]; (iii) connectivity of the biggest pore (ENbigpore); P3 presented an expressive percentage of pores with a larger size from µCT and a frequency of larger size pores from SWRC; however, the ENbigpore in P3 was significantly different, with more positive values indicating lower connectivity compared to more negative values of ENbigpore found for P1 and P2 [16,45].
In a previous study, better connectivity (ENtotal) of the pore space and of the biggest pore (ENbigpore) were found for P1 and P2 compared to P3 [21]. However, a spatial resolution used was c. 17 µm, obtained for samples of 20 mm × 20 mm sizes [21]. In this study, the resolution used was c. 9 µm, but no differences were found for ENtotal. Our results were similar to those observed by Ferreira et al. [57], who found a soil porous space, in which the part of volume was occupied by dominant and better-connected pores (e.g., negative EN values) and also with a large amount of disconnected residual pores (e.g., positive EN values). Thus, the increase of resolution in the present study did not necessarily indicate an increase in connectivity of pore space (more negative EN values) as would be theoretically expected. The more negative values found for ENbigpore were crucial to understanding the water behavior of the studied soils. These soils present practically the same porosity (0.66–0.68 m3 m−3) and textural class. Therefore, the differences related to physical-hydric properties were mainly explained by the type of soil structure and pore morphology. The 3D image-based parameters, particularly the connectivity, enabled a deeper comprehension of traditional SWRCs.

5. Conclusions

The main differences among the SWRCs of the three studied Oxisols were related to structure morphology, which modified the characteristics of the pore space. The frequency of pores obtained from SWRCs indicated the predominance of macropore size class (diameter > 80 µm). P3 (Typic Hapludox) had a higher field capacity and at the permanent wilting point, and consequently lower available water content relative to P1 (Rhodic Haplustox) and P2 (Anionic Acrudox).
From µCT image analyses, pore size distribution was concentrated in the pore diameter class of 20–100 µm with P1 and P2 having the highest percentages. For the Euler number (connectivity of pore space), there were no differences when comparing values for the total sample (ENtotal); however, differences were found for EN related to the biggest pore of each sample (ENbigpore). P1 and P2 showed more negative values of ENbigpore or, in other words, better-connected pore space compared to P3.
The parameter ENbigpore was decisive for understanding the water behavior of the studied soils. The better-connected porous space in P1 and P2 increased the saturated hydraulic conductivity (Ksat) and modified the shape of SWRCs. It was possible to understand physical-hydric properties from the knowledge of the morphology of structure and pore space. The connectivity from 3D image analyses was important for comprehending the behavior of SWRCs and Ksat.

Supplementary Materials

The following supporting information can be downloaded at: https://www.mdpi.com/article/10.3390/agriculture13010028/s1, Table S1: Chemical and mineralogical characterization of the Oxisols; Table S2: Additional information about the general description of the Oxisols and the Bw horizons studied; Table S3: Pearson’s correlation matrix for pore size distribution, parameters from 3D image analysis, and physical, chemical, and mineralogical attributes; Table S4: Results of eigenvalues and eigenvectors extracted from the principal components analysis (PCA).

Author Contributions

Conceptualization, T.N.P. and P.L.L.; methodology, T.N.P.; software, T.N.P. and D.U.; formal analysis, T.N.P. and D.U.; investigation, T.N.P.; resources, T.N.P. and P.L.L.; data curation, T.N.P.; writing—original draft preparation, T.N.P., P.L.L., T.R.F., L.F.P. and M.C.; writing—review and editing, T.N.P., P.L.L., T.R.F., L.F.P., M.C., D.U., S.P. and C.M.P.V.; supervision, P.L.L.; project administration, T.N.P.; funding acquisition, T.N.P. and P.L.L. All authors have read and agreed to the published version of the manuscript.

Funding

CNPq (Conselho Nacional de Desenvolvimento Científico e Tecnológico—#140126/2017-1), CAPES (Coordenação de Aperfeiçoamento de Pessoal de Nível Superior—#001), AGRISUS (Fundação Agrisus#2735/19), and FEALQ (Fundação de Estudos Agrários “Luiz de Queiroz” Project #4161-0).

Data Availability Statement

All data are available upon reasonable request to thaispessoa@usp.br.

Conflicts of Interest

The authors declare no conflict of interest.

References

  1. Rabot, E.; Wiesmeier, M.; Schlüter, S.; Vogel, H.J. Soil structure as an indicator of soil functions: A review. Geoderma 2018, 314, 122–137. [Google Scholar] [CrossRef]
  2. Dexter, A.R.; Czyż, E.A.; Richard, G.; Reszkowska, A. A user-friendly water retention function that takes account of the textural and structural pore spaces in soil. Geoderma 2008, 143, 243–253. [Google Scholar] [CrossRef]
  3. Six, J.; Bossuyt, H.; Degryze, S.; Denef, K. A history of research on the link between (micro)aggregates, soil biota, and soil organic matter dynamics. Soil Tillage Res. 2004, 79, 7–31. [Google Scholar] [CrossRef]
  4. Ferreira, M.M.; Fernandes, B.; Curi, N. Mineralogia da classificação e estrutura da região sudeste do Brasil. Rev. Bras. Ciênc. Solo 1999, 23, 507–514. [Google Scholar] [CrossRef] [Green Version]
  5. Fontes, M.P.F.; Camargo, O.A.; Sposito, G. Electrochemistry of colloidal particles and its relationship with the mineralogy of highly weathered soils. Sci. Agric. 2001, 58, 627–646. [Google Scholar] [CrossRef] [Green Version]
  6. FAO. Lecture Notes on the Major Soils of the World. Set #6. Mineral Soils Conditioned by a Wet (Sub)Tropical Climate. 2001. Available online: https://www.fao.org/3/y1899e/y1899e08a.htm#P165_22557 (accessed on 1 November 2022).
  7. Cooper, M.; Vidal-Torrado, P.; Chaplot, V. Origin of microaggregates in soils with ferralic horizons. Sci. Agric. 2005, 62, 256–263. [Google Scholar] [CrossRef] [Green Version]
  8. Totsche, K.U.; Amelung, W.; Gerzabek, M.H.; Guggenberger, G.; Klumpp, E.; Knief, C.; Lehndorff, E.; Mikutta, R.; Peth, S.; Prechtel, A.; et al. Microaggregates in soils. J. Plant Nutr. 2018, 181, 104–136. [Google Scholar] [CrossRef] [Green Version]
  9. Mualem, Y. A new model for predicting the hydraulic conductivity of unsaturated porous media. Water Resour. Res. 1976, 12, 513–522. [Google Scholar] [CrossRef] [Green Version]
  10. Ahuja, L.R.; Cassel, D.K.; Bruce, R.R.; Barnes, B.B. Evaluation of spatial distribution of hydraulic conductivity using effective porosity data. Soil Sci. 1989, 148, 404–411. [Google Scholar] [CrossRef]
  11. Schelle, H.; Heise, L.; Janicke, K.; Durner, W. Water retention characteristics of soils over the whole moisture range: A comparison of laboratory methods. Eur. J. Soil Sci. 2013, 64, 814–821. [Google Scholar] [CrossRef]
  12. Nimmo, J.R. Porosity and pore size distribution. In Encyclopedia of Soils in the Environment; Hillel, D., Ed.; Elsevier: London, UK, 2004; pp. 295–303. [Google Scholar]
  13. Pessoa, T.N.; Libardi, P.L. Physical-hydric properties of Oxisols as influenced by soil structure and clay mineralogy. Catena 2022, 211, 106009. [Google Scholar] [CrossRef]
  14. Peth, S. Chapter 3—Applications of Microtomography in Soils and Sediments. Dev. Soil Sci. 2010, 34, 73–101. [Google Scholar] [CrossRef]
  15. Köhne, J.; Schlüter, S.; Vogel, H.-J. Predicting Solute Transport in Structured Soil Using Pore Network Models. Vadose Zone J. 2011, 10, 1082–1096. [Google Scholar] [CrossRef] [Green Version]
  16. Dorau, K.; Uteau, D.; Hövels, M.P.; Peth, S.; Mansfeldt, T. Soil aeration and redox potential as function of pore connectivity unraveled by X-ray microtomography imaging. Eur. J. Soil Sci. 2021, 73, e13165. [Google Scholar] [CrossRef]
  17. Yang, Y.; Wu, J.; Han, Q.; Pan, X.; He, F.; Chen, C. Assessment of the responses of soil pore properties to combined soil structure amendments using X-ray computed tomography. Sci. Rep. 2018, 8, 695. [Google Scholar] [CrossRef] [Green Version]
  18. Pires, L.F.; Borges, J.A.R.; Rosa, J.A.; Cooper, M.; Heck, R.J.; Passoni, S.; Roque, W.L. Soil structure changes induced by tillage systems. Soil. Till. Res. 2017, 165, 66–79. [Google Scholar] [CrossRef] [Green Version]
  19. Ferreira, T.R.; Pires, L.F.; Wildenschild, D.; Brinatti, A.M.; Borges, J.A.; Auler, A.C.; dos Reis, A.M. Lime application effects on soil aggregate properties: Use of the mean weight diameter and synchrotron-based X-ray μCT techniques. Geoderma 2019, 338, 585–596. [Google Scholar] [CrossRef]
  20. Pires, L.F.; Ferreira, T.R.; Cássaro, F.A.M.; Cooper, H.V.; Mooney, S.J. A Comparison of the Differences in Soil Structure under Long-Term Conservation Agriculture Relative to a Secondary Forest. Agriculture 2022, 12, 1783. [Google Scholar] [CrossRef]
  21. Pessoa, T.N.; Cooper, M.; Nunes, M.R.; Uteau, D.; Peth, S.; Vaz, C.M.P.; Libardi, P.L. 2D and 3D techniques to assess the structure and porosity of Oxisols and their correlations with other soil properties. Catena 2022, 210, 105899. [Google Scholar] [CrossRef]
  22. Zhou, H.; Mooney, S.J.; Peng, X. Bimodal Soil Pore Structure Investigated by a Combined Soil Water Retention Curve and X-Ray Computed Tomography Approach. Soil Sci. Soc. Am. J. 2017, 81, 1270–1278. [Google Scholar] [CrossRef]
  23. Tuller, M.; Or, D. Water Retention and Characteristic Curve. In Encyclopedia of Soils in the Environment; Elsevier Inc.: Amsterdam, The Netherlands, 2004; Volume 4, pp. 278–289. [Google Scholar] [CrossRef]
  24. Van Genuchten, M.T. A closed-form equation for predicting the hydraulic conductivity of unsaturated soils. Soil Sci. Soc. Am. J. 1980, 44, 892–898. [Google Scholar] [CrossRef] [Green Version]
  25. Durner, W. Hydraulic conductivity estimation for soils with heterogeneous pore structure. Water Resour. Res. 1994, 30, 211–223. [Google Scholar] [CrossRef]
  26. Lucas, M.; Vetterlein, D.; Vogel, H.-J.; Schlüter, S. Revealing pore connectivity across scales and resolutions with X-ray CT. Eur. J. Soil Sci. 2020, 72, 546–560. [Google Scholar] [CrossRef] [Green Version]
  27. Soil Survey Staff. Simplified Guide to Soil Taxonomy. In USDA-Natural Resources Conservation Service; National Soil Survey Center: Lincoln, NE, USA, 2014. [Google Scholar]
  28. Santos, H.G.; Jacomine, P.K.T.; Anjos, L.H.C.; Oliveira, V.A.; Lumbreras, J.F.; Coelho, M.R.; Almeida, J.A.; Araújo Filho, J.C.; Oliveira, J.B.; Cunha, T.J.F. Sistema Brasileiro de Classificação de Solos, 5th ed.; Embrapa: Brasília, Brazil, 2018; 356p. [Google Scholar]
  29. Barreto, W. Eletroquímica de Solos Tropicais de Carga Variável: Capacidade da Dupla Camada Elétrica; Universidade Federal do Rio de Janeiro: Itaguaí, Brazil, 1986; 273p. [Google Scholar]
  30. Donagemma, G.K.; Ruiz, H.A.; Alvarez, V.H.; Ker, J.C.; Fontes, M.P.F. Fósforo remanescente em argila e silte retirados de Latossolos após pré-tratamentos na análise textural. Rev. Bras. Ciênc. Solo 2008, 32, 1785–1791. [Google Scholar] [CrossRef] [Green Version]
  31. Gee, G.W.; Or, D. Particle-size analysis. In Methods of Soil Analysis, Part 4. Physical Methods; Dane, J.H., Topp, G.C., Eds.; American Society of America: Madison, WI, USA, 2002; pp. 255–289. [Google Scholar]
  32. Teixeira, P.C.; Donagemma, G.K.; Fontana, A.; Teixeira, W.G. Manual de Métodos de Análise de Solo, 3rd ed.; Embrapa: Brasília, Brazil, 2017; 573p. [Google Scholar]
  33. Brunauer, S.; Emmett, P.H.; Teller, E. Adsorption of gases in multimolecular layers. J. Am. Chem. Soc. 1938, 60, 309–319. [Google Scholar] [CrossRef]
  34. Blake, G.R.; Hartge, K.H. Bulk density. In Methods of Soil Analysis—Physical and Mineralogical Methods, 2nd ed.; Klute, A., Ed.; American Society of Agronomy: Madison, WI, USA, 1986; pp. 363–375. [Google Scholar]
  35. Flint, A.L.; Flint, L.E. Particle Density. In Methods of Soil Analysis, Part 4. Physical Methods; Dane, J.H., Topp, G.C., Eds.; American Society of America: Madison, WI, USA, 2002; pp. 229–240. [Google Scholar]
  36. Klute, A.; Dirksen, C. Hydraulic conductivity and diffusivity: Laboratory methods. In Methods of Soil Analysis, Part 1. Physical and Mineralogical Methods; Klute, A., Ed.; American Society of Agronomy: Madison, WI, USA, 1986; pp. 687–734. [Google Scholar]
  37. Scheinost, A.C.; Chavernas, A.; Barrón, V.; Torrent, J. Use and limitations of second-derivative diffuse reflectance spectroscopy in the visible to near-infrared range to identify and quantify Fe oxide minerals in soils. Clay Clay Miner. 1998, 46, 528–536. [Google Scholar] [CrossRef]
  38. Fernandes, R.B.A.; Barrón, V.; Torrent, J.; Fontes, M.P.F. Quantificação de óxidos de ferro de Latossolos brasileiros por espectroscopia de refletância difusa. Rev. Bras. Ciênc. Solo 2004, 28, 245–257. [Google Scholar] [CrossRef]
  39. Jackson, M.L. Soil Chemical Analysis—Advanced Course; Prentice Hall: Madison, WI, USA, 1979; 895p. [Google Scholar]
  40. Jackson, M.L. Soil Chemical Analysis—Advanced Course, 2nd ed.; Madison: Madison, WI, USA, 1969; 894p. [Google Scholar]
  41. Anderson, J.U. An improved pretreatment for mineralogical analysis of samples containing organic matter. Clay Clay Miner. 1963, 10, 380–388. [Google Scholar] [CrossRef]
  42. Vaz, C.M.P.; de Maria, I.C.; Lasso, P.O.; Tuller, M. Evaluation of an Advanced Benchtop Micro-Computed Tomography System for Quantifying Porosities and Pore-Size Distributions of Two Brazilian Oxisols. Soil Sci. Soc. Am. J. 2011, 75, 832–841. [Google Scholar] [CrossRef]
  43. Otsu, N. A threshold selection method from gray-level histograms. IEEE Trans. Syst. Man Cybern. 1979, 9, 62–66. [Google Scholar] [CrossRef] [Green Version]
  44. Vogel, H.J.; Roth, K. Quantitative morphology and network representation of soil pore structure. Adv. Water Resour. 2001, 24, 233–242. [Google Scholar] [CrossRef]
  45. Bucka, F.B.; Kölbl, A.; Uteau, D.; Peth, S.; Kögel-Knabner, I. Organic matter input determines structure development and aggregate formation in artificial soils. Geoderma 2019, 354, 113881. [Google Scholar] [CrossRef]
  46. Brewer, R. Fabric and Mineral Analysis of Soils; John Wiley and Sons: New York, NY, USA, 1964; 470p. [Google Scholar]
  47. Vogel, H.J.; Weller, U.; Schlüter, S. Quantification of soil structure based on Minkowski functions. Comput. Geosci. 2010, 36, 1236–1245. [Google Scholar] [CrossRef]
  48. Withers, P.J.; Bouman, C.; Carmignato, S.; Cnudde, V.; Grimaldi, D.; Hagen, C.K.; Maire, E.; Manley, M.; Plessis, A.D.; Stock, S.R. X-ray computed tomography. Nat. Rev. Methods Prim. 2021, 1, 18. [Google Scholar] [CrossRef]
  49. Ferreira, M.M.; Fernandes, B.; Curi, N. Influência da mineralogia da fração argila nas propriedades físicas de Latossolos da região sudeste do Brasil. Rev. Bras. Ciênc. Solo 1999, 23, 515–524. [Google Scholar] [CrossRef] [Green Version]
  50. Buol, S.W.; Eswaran, H. Oxisols. In Advances in Agronomy; Sparks, D., Ed.; Academic Press: Cambridge, MA, USA, 1999; pp. 151–195. [Google Scholar]
  51. Sasanian, S.; Newson, T.A. Use of mercury intrusion porosimetry for microstructural investigation of reconstituted clays at high water contents. Eng. Geol. 2013, 158, 15–22. [Google Scholar] [CrossRef]
  52. Grohmann, F.; Camargo, O.A. Influência dos óxidos de ferro livres e da matéria orgânica na adsorção da água pelo solo. Bragantia 1973, 32, 203–222. [Google Scholar] [CrossRef]
  53. Williams, J.; Prebble, R.E.; Williams, W.T.; Hignett, C.T. The influence of texture, structure and clay mineralogy on the soil moisture characteristic. Aust. J. Soil Res. 1983, 21, 15–32. [Google Scholar] [CrossRef]
  54. Zaffar, M.; Lu, S.-G. Pore size distribution of clayey soils and its correlation with soil organic matter. Pedosphere 2015, 25, 240–249. [Google Scholar] [CrossRef]
  55. Lu, S.; Malik, Z.; Chen, D.; Wu, C. Porosity and pore size distribution of Ultisols and correlations to soil iron oxides. Catena 2015, 123, 79–87. [Google Scholar] [CrossRef]
  56. Reatto, A.; Bruand, A.; Silva, E.M.; Martins, E.S.; Brossard, M. Hydraulic properties of the diagnostic horizon of Latosols of a regional toposequence across the Brazilian Central Plateau. Geoderma 2007, 139, 51–59. [Google Scholar] [CrossRef] [Green Version]
  57. Ferreira, T.R.; Pires, L.F.; Wildenschild, D.; Heck, R.J.; Antonino, A.C.D. X-ray microtomography analysis of lime application effects on soil porous system. Geoderma 2018, 324, 119–130. [Google Scholar] [CrossRef]
Figure 1. (a) Soil water retention curves. (b) Curves of diameter frequency/logarithm of diameter (f) as a function of logarithm of diameter (log d) from SWRCs; (c) and field capacity (FC), permanent wilting point (PWP), and available water content (AWC) of Rhodic Haplustox (P1), Anionic Acrustox (P2), and Typic Hapludox (P3). Mean values were used to compare their respective 95% confidence intervals.
Agriculture 13 00028 g001
Figure 2. Microtomographic (left and middle) and binarized (right) images for the Rhodic Haplustox (a), Anionic Acrustox (b), and Typic Hapludox (c).
Agriculture 13 00028 g002
Figure 3. (a) Total resolved pore volume (TRPV). (b) Volume for the biggest pore. (c) Pore size distribution (PSD). (d) Euler number (EN) of the total sample. (e) Euler number of the biggest pore. (f) Pore surface density (SurfDens). Mean values were compared with 95% confidence intervals.
Agriculture 13 00028 g003
Figure 4. BIPLOT representing the variables pore size distribution (20–100, 100–300, 300–500, 500–700, >700 µm); FC: field capacity (−10 kPa); PWP: permanent wilting point (−1500 kPa); Ksat: saturated hydraulic conductivity; ENtotal: Euler number for total sample or Euler density; ENbigpore: Euler number for the biggest pore connected; SurfDens: surface density; SOC: soil organic carbon; SSA: specific surface area; Clay: the amount of clay fraction; Gt: goethite; Hm: hematite; Gb: gibbsite; K: kaolinite for Rhodic Haplustox (P1), Anionic Acrustox (P2), and Typic Hapludox (P3).
Agriculture 13 00028 g004
Table 1. Physical characterization of the P1—Rhodic Haplustox, P2—Anionic Acrustox, and P3—Typic Hapludox [21].
Physical AttributesUnit Soils
P1P2P3
Clayg kg−1674.74727.49768.65
Siltg kg−1159.01167.69183.10
Very coarse sandg kg−18.543.454.85
Coarse sandg kg−113.885.044.34
Medium sandg kg−135.5921.457.66
Fine sandg kg−169.1154.5116.34
Very fine sandg kg−139.1220.3715.06
Water dispersible clayg kg−12.862.55242.15
Degree of flocculation%99.5899.6568.50
Bulk density (ρ)kg dm−31.03 ± 0.020.98 ± 0.020.89 ± 0.02
Particle density (ρs)kg dm−33.05 ± 0.013.04 ± 0.012.59 ± 0.04
Porosity (β)m3 m−30.66 ± 0.010.68 ± 0.010.66 ± 0.01
Saturated hydraulic conductivity—Ksatmm h−1219.81 ± 0.05188.7 ± 0.120.2 ± 0.3
Specific surface area—SSAm2 g−136 ± 641 ± 460 ± 3
Mean values were compared with their respective 95% confidence intervals.
Table 2. Parameters of Equation (1) (θs, θr, α, n, m), R², RMSE, and rmax, for SWRCs [13].
SoilsθsθrαnmR2RMSEdmax
m3 m−3kPa−1µm
P10.6650.2710.4062.0270.5070.9922.72 × 10−487 ± 2
P20.6810.3170.6401.9930.4980.9795.59 × 10−4134 ± 11
P30.6570.3660.7782.2350.5530.9812.86 × 10−4175 ± 18
θs and θr (saturation and residual soil water contents); α, n and m (empirical parameters of the Equation (1)); R2 (coefficient of determination); RMSE (root mean square error); dmax (most frequent pore diameter).
Disclaimer/Publisher’s Note: The statements, opinions and data contained in all publications are solely those of the individual author(s) and contributor(s) and not of MDPI and/or the editor(s). MDPI and/or the editor(s) disclaim responsibility for any injury to people or property resulting from any ideas, methods, instructions or products referred to in the content.

