Article

Identification and Verification of qGS11, a QTL Controlling Grain Size and Heading Date in Rice

1
Rice Research Institute, Fujian Academy of Agricultural Sciences, Fuzhou 350018, China
2
State Key Laboratory of Rice Biology, China National Rice Research Institute, Hangzhou 310006, China
3
Crop Research Institute, Fujian Academy of Agricultural Sciences, Fuzhou 350013, China
*
Authors to whom correspondence should be addressed.
These authors contributed equally to this work.
Agriculture 2022, 12(9), 1384; https://doi.org/10.3390/agriculture12091384
Submission received: 29 July 2022 / Revised: 28 August 2022 / Accepted: 28 August 2022 / Published: 3 September 2022
(This article belongs to the Special Issue Breeding, Genetics, and Genomics of Rice)

Abstract

:
Grain size, shape and weight are important factors influencing grain yield and quality of rice. They are mostly determined by grain length (GL) and grain width (GW). A 13.2 Mb interval, RM167–RM287 on chromosome 11 of rice, was previously found to be associated with variations in 1000-grain weight (TGW). In this study, three populations derived from the indica rice cross Teqing/IRBB52 were used to identify and validate quantitative trait loci (QTLs) controlling GL, GW, TGW and the ratio of GL to GW (RLW) in the RM167–RM287 region. First, two QTL clusters associated with these traits were detected using two populations, segregating the RM167–RM287 interval only. One controlled GL, GW and TGW and was designated as qGS11. The other controlled GL and RLW. The allelic directions of the two QTL clusters on GL were opposite. Then, qGS11 was further mapped in a 1.4 Mb interval using near-isogenic lines, showing a small effect on GL and a relatively large effect on TGW, GW and RLW. Meanwhile, a stable and small effect on the heading date was detected. The allelic direction for the heading date was the opposite for TGW and GW but the same for GL and RLW. The results suggest that qGS11 has the potential for application in rice breeding.

1. Introduction

Rice (Oryza sativa L.) is one of the most important food crops. Grain size, shape and weight are important traits determining grain yield and quality. Grain size is determined by grain length, width and thickness, grain shape is determined by grain length and width, and grain weight is mostly determined by grain size. These are all complex traits controlled by quantitative trait loci (QTLs).
Hundreds of QTLs controlling grain size in rice have been identified (https://www.gramene.org (accessed on 20 July 2022)). More than 20 causal genes underlying these QTLs have been cloned and functionally characterized, but few of them have shown minor effects [1]. One minor QTL, SG3, was isolated by using a BC4F3 population developed from the rice cross Nanyangzhan/Chuan 7 [2]. This QTL is closely linked to a major QTL, GS3, having a substantial effect on grain length and weight only when GS3 is not functional. Another minor QTL, qTGW1.2b, was fine-mapped into a 44.0 kb region using seven near-isogenic line (NIL) populations that originated from the rice cross Zhenshan 97/Milyang 46. Its causal gene, OsVQ4, was confirmed by creating CRISPR/Cas9 knockout lines [3]. Since the QTLs underlying natural variation mostly have a subtle effect and are sensitive to variations in genetic background, environmental conditions and phenotyping accuracy, a careful validation of the genetic effect is required before the implementation of gene cloning [3,4].
It is widely recognized that grain yield and component traits are often correlated with heading date (HD) [5,6]. Ghd7 has major effects on HD and grain number per panicle. The enhanced expression of Ghd7 under long-day conditions delayed heading and significantly increased panicle size [7]. For Ghd7.1, the transformation of the Nipponbare allele into Zhenshan 97 resulted in a 15-day delay in heading and 50% increase in grain yield [8]. For DTH8, Hd1, Hd2 and RFT1, the alleles for delaying heading also acted to improve grain yield [9,10,11,12]. The isolation of more QTLs for HD would be beneficial for establishing the network regulating the HD and grain yield of rice.
In a previous study, a QTL analysis for grain size and weight was performed using an F2:3 population, which originated from a residual heterozygote (RH) identified from an indica rice cross between Teqing (TQ) and IRBB52, named Ti52-3. Of the 135 DNA markers that were polymorphic between IRBB52 and TQ, 33 were segregated and 102 were homozygous in the Ti52-3 population [13]. A 13.2 Mb region of chromosome 11, RM167–RM287, was found to be associated with variations in 1000-grain weight (TGW) [14]. The additive effect was 0.22 g and 5.7 % of the phenotypic variance was explained (R2). At the same time, this region showed no significant effect on grain length (GL) and grain width (GW). Such a large region may contain two or more QTLs for related traits, which should be dissected and delimitated into smaller regions before the implementation of gene cloning and breeding applications. The objectives of the present study are: (1) to identify QTLs for TGW, GL, GW and the ratio of GL to GW (RLW) in the interval RM167–RM287; (2) to validate and more accurately map one or more QTLs; and (3) to study the influence of these QTLs on HD.

2. Materials and Methods

2.1. Plant Materials

Three mapping populations were used. Firstly, two RH plants that were heterozygous in the interval RM167–RM287 only were identified from the Ti52-3 population (Table S1). They were selfed to produce two NIL-F2:3 populations, including ZL1 and ZL2, consisting of 295 and 296 F2:3 lines, respectively. Then, one plant that was heterozygous in the 1.4 Mb upper region of RM167–RM287 only was selected from the ZL1 population. It was selfed to produce an NIL-F2 population. Plants having a homozygous genotype at RM167 were selected and selfed. An NIL population was constructed, consisting of 30 lines of NILTQ and 30 lines of NILIR that carried the TQ and IRBB52 homozygous alleles at RM167, respectively.

2.2. Field Trials and Phenotypic Evaluation

The ZL1 and ZL2 F2:3 lines were tested in the mid-rice season in 2018. The ZL1 population was grown in Hangzhou, Zhejiang Province, from May to September, and in Jianyang, Fujian Province, from June to October. The ZL2 population was grown in Hangzhou only. The NIL population was grown in Lingshui, Hainan Province, from December 2021 to April 2022. The experiments followed a randomized complete block design with two replications. In each replication, twelve plants per line were planted in one row. Spacings of 26.7 cm between rows and 16.7 cm between plants in a row were used. Field management followed common agricultural practices. HD was scored for the ZL1 and ZL2 populations, and GL, GW, RLW and TGW were measured for all the three populations.
HD was recorded for each plant when the first panicle emerged and averaged for each line in each replication. At maturity, 5 plants from the middle 10 plants in each row were harvested in bulk and sun-dried. Two samples of approximately 10 g fully filled grains were selected for the measurement of GL, GW, RLW and TGW following the procedure reported by Zhang et al. [15].

2.3. DNA Marker Analysis

Nine polymorphic DNA markers, including six InDels and three SSRs, were used (Table S2). The InDel markers were designed according to the sequence differences between Teqing and IRBB52. The SSR markers were chosen from the Gramene database (http://www.gramene.org (accessed on 10 January 2020)). Total DNA was extracted from a 2 cm-long leaf sample collected from an F2 plant using a mini-preparation protocol reported by Zheng et al. [16]. PCR amplification was performed following the method of Chen et al. [17]. The products were separated on 6% non-denaturing polyacrylamide gels and visualized using silver staining.

2.4. Data Analysis

Basic descriptive statistics, including mean value, standard deviation, coefficient of variation, the minimum and maximum trait values, skewness, and kurtosis, were analyzed.
For the ZL1 and ZL2 populations, QTLs were determined using the BIP (QTL mapping in the bi-parental populations) functionality of QTL IciMapping 4.1 [18]. LOD thresholds for genome-wide type I error of p < 0.05 were calculated with a 1000 permutation test and used to claim a putative QTL. QTLs were designed as proposed by McCouch and CGSNL [19]. For the NIL population, phenotypic differences between the two genotypes were tested using two-way ANOVA in the SAS procedure GLM following a method described previously [20].

3. Results

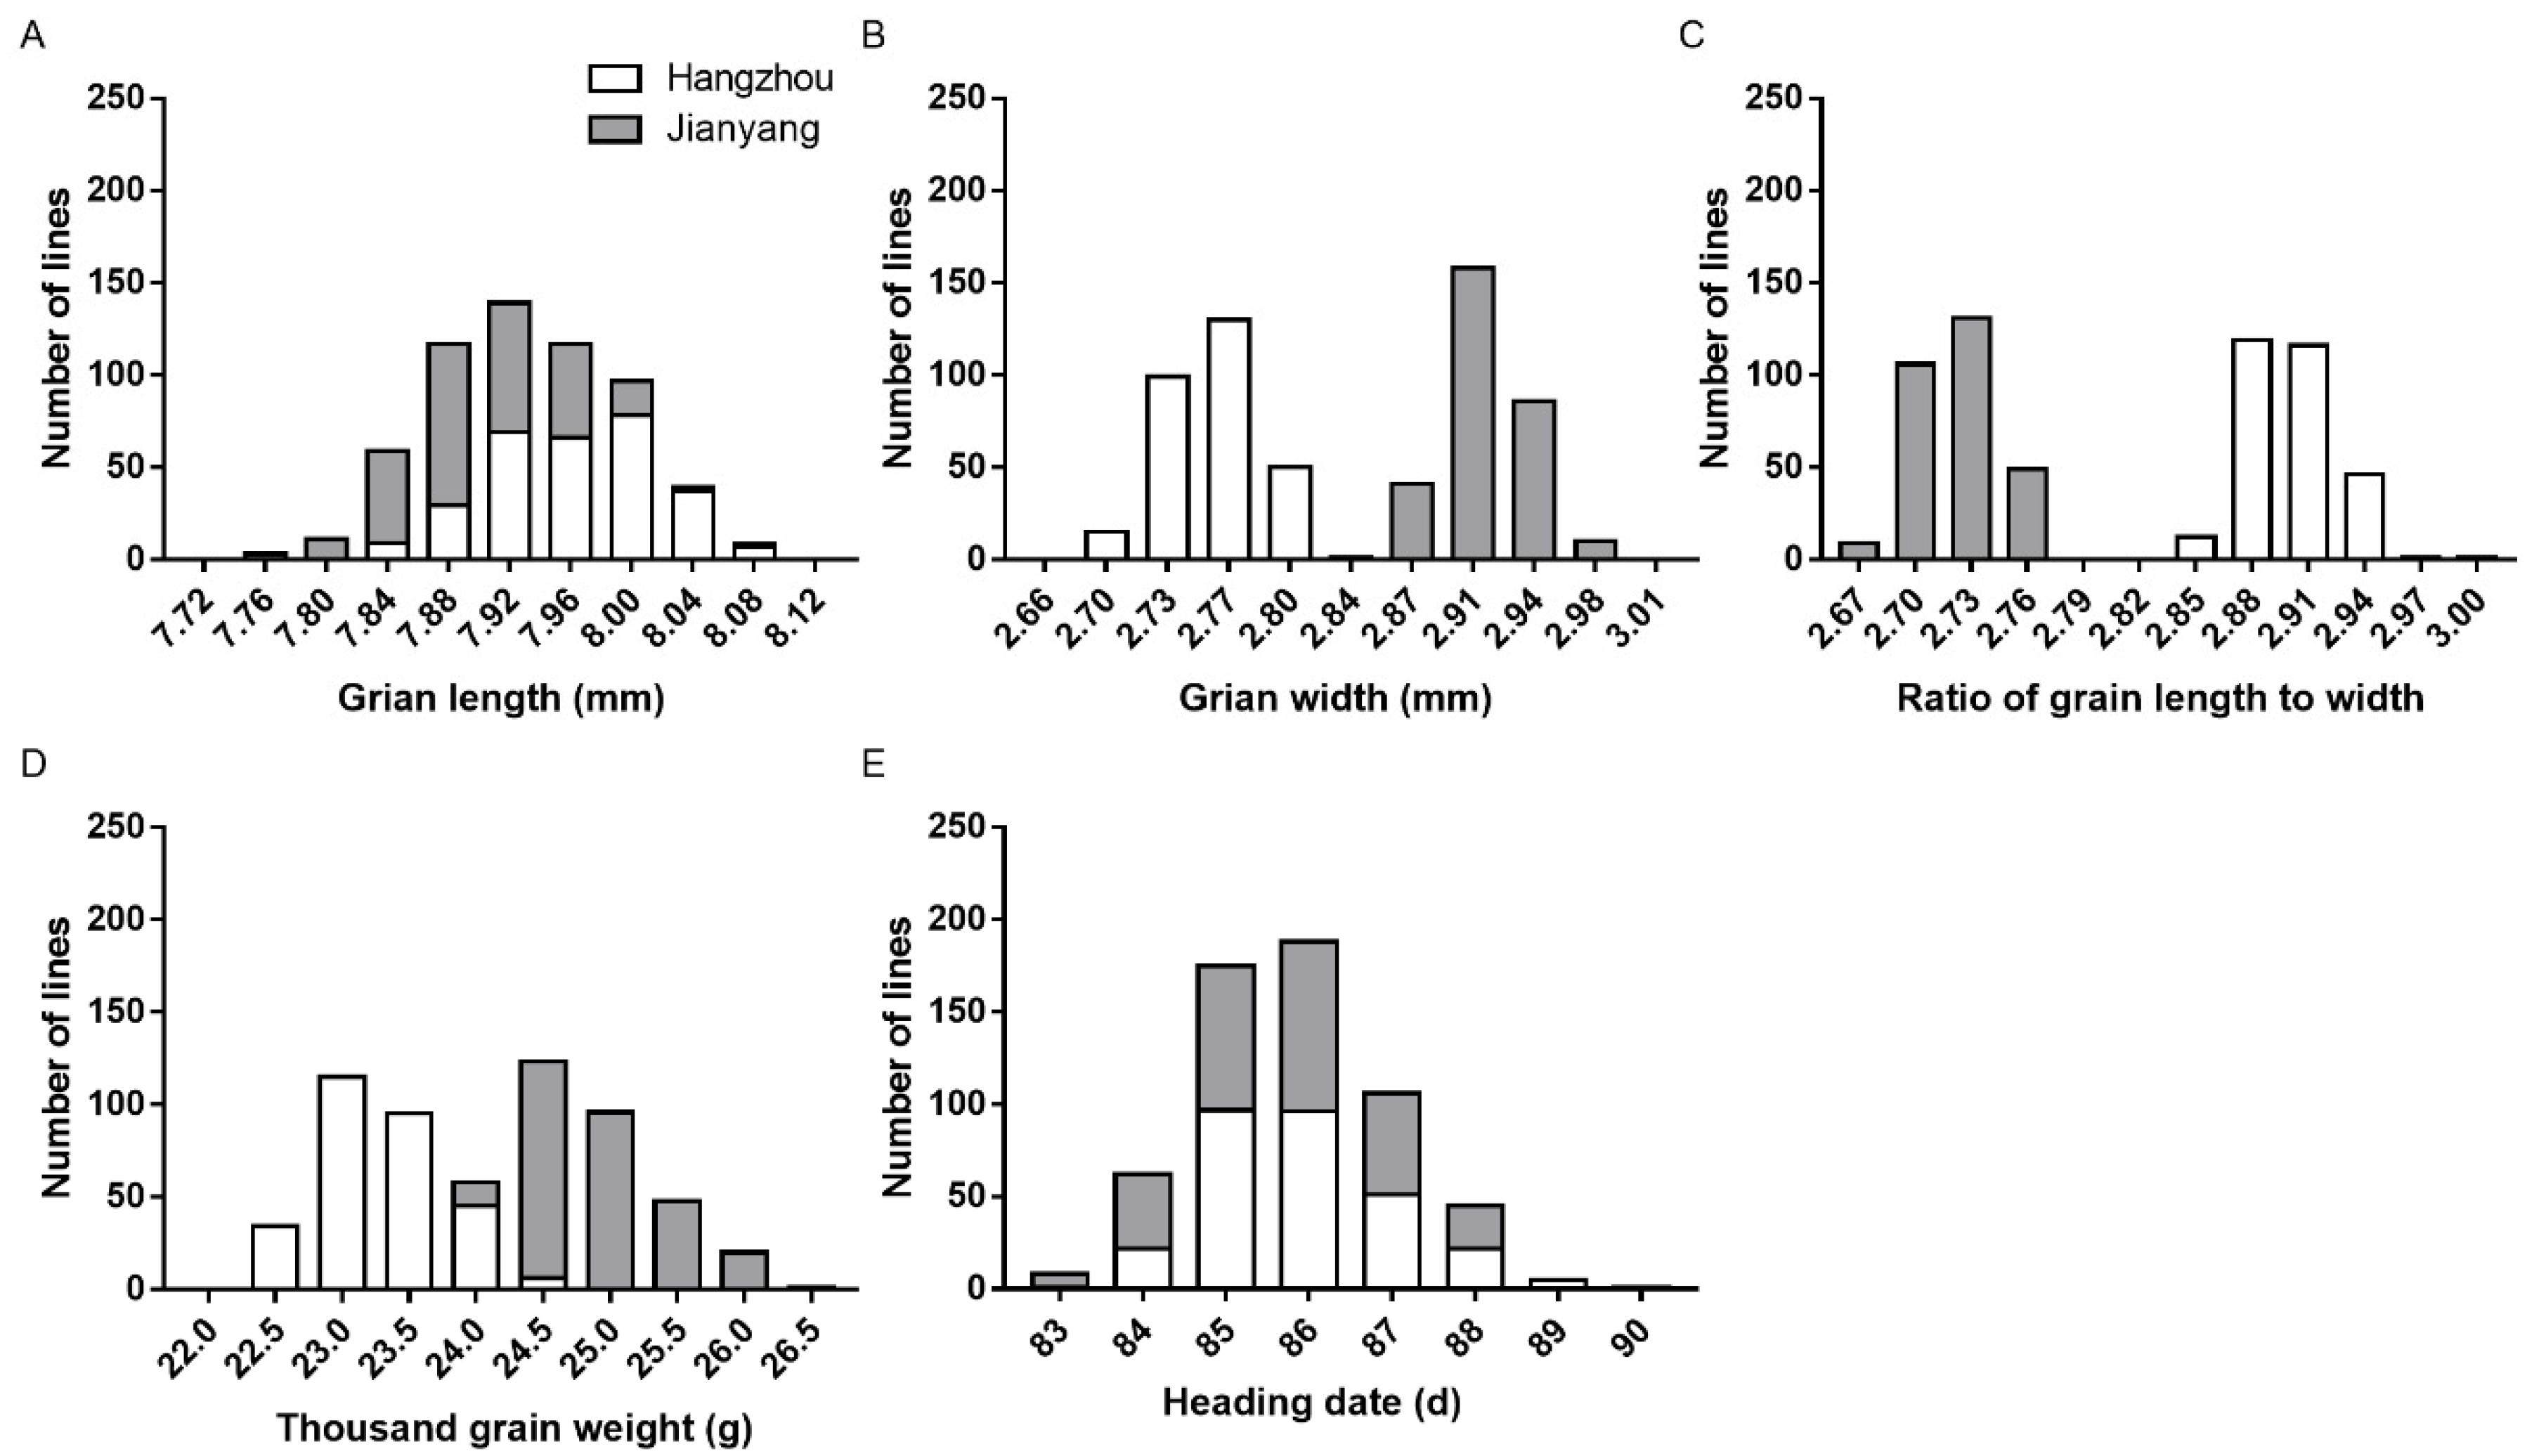
3.1. Phenotypic Performance of the ZL1 and ZL2 Populations

Descriptive statistics of GL, GW, RLW, TGW and HD in the ZL1 and ZL2 populations are presented in Table 1. All the traits had low skewness and kurtosis.
For ZL1, which was tested in two locations, two of the five traits showed consistent coefficients of variation (CV), estimated as 0.67 and 0.68 for GL and 0.77 to 0.79 for GLW. Among the other three traits, CV values in Hangzhou (HZ) were higher for GW and TGW and lower for HD compared with those in Jianyang (JY). Continuous distributions were observed for all the traits in both locations. Distributions of the same trait in HZ and JY were similar in HD, slightly different in GL and highly different in the other three traits (Figure 1).
Pearson’s correlation analysis between the two trials conducted in different locations showed highly significant (p < 0.001) correlations for all five traits. The correlation coefficients were 0.476, 0.599, 0.650, 0.700 and 0.335 for GL, GW, RLW, TGW and HD, respectively. Pearson’s correlation analysis was also performed between different traits in each location (Table 2). In both locations, significantly positive correlations were observed between GL, GW and TGW, while RLW showed significantly positive correlations with GL but significantly negative correlations with GW and TGW. Among these correlations, the r values between TGW and GW were the highest (0.896 and 0.817) in both locations. Much larger variations were observed among the correlations between HD and the other four traits. HD was negatively correlated with TGW, but positively correlated with RLW. The correlations were significant (p < 0.001 or p < 0.01) in both locations, but the coefficients were much higher in HZ (−0.468 and 0.442) than in JY (−0.180 and 0.155). Correlations between HD and two other traits, GL and GW, were either non-significant or negative significant (p < 0.001).

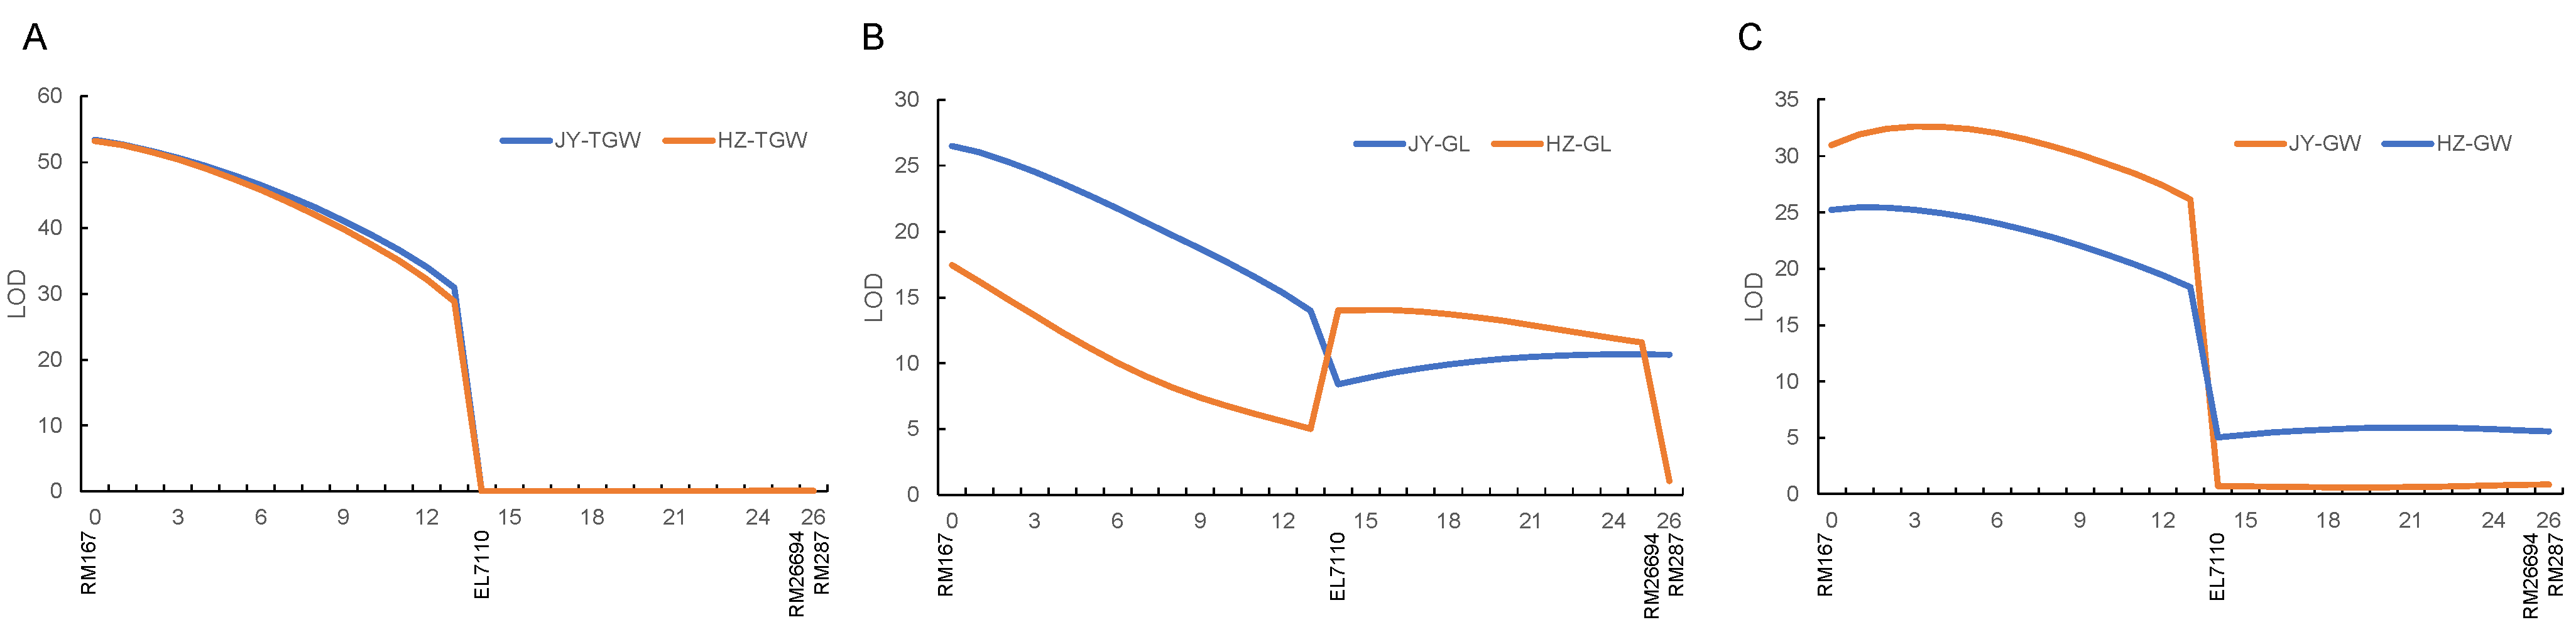
3.2. QTLs Detected in the ZL1 Population

The results of QTL analysis for the five traits in the ZL1 population are shown in Table 3. Two QTLs were detected for GL and one QTL was detected for each of the other four traits. The LOD scores ranged from 14.1 to 53.2 in HZ and 9.8 to 53.4 in JY. The R2 values ranged from 13.7 to 56.6% in HZ and 6.1 to 56.7% in JY. Among these QTLs, qTGW11, located in the upper interval RM167–EL7110, had the highest LOD score and the largest R2 value. The IRBB52 allele increased TGW by 0.41 g in both locations. Two other QTLs, qGL11.1 and qGW11, were also located in the interval RM167–EL7110, with the enhancing alleles derived from IRBB52. The remaining three QTLs, qGL11.2, qRLW11 and qHD11, were located in the lower interval EL7110–RM26694. They were detected with smaller LOD scores and R2 values, with the enhancing alleles all derived from TQ.
The mapping results indicate that two QTL clusters for grain size may be located in the interval RM167–RM287. The upper region RM167–EL7110 had a relatively large effect on GL, GW and TGW. For ease of description, the QTLs for grain size detected in this region were integrated as qGS11.
For qTGW11, which was had the highest LOD scores, its peak LOD positions landed at the RM167 locus (Figure 2), suggesting that a Mendelian factor controlling TGW is tightly linked to RM167. To test this assumption, 70 lines having the highest values of TGW and 70 lines having the lowest values were selected from the ZL1 population. They were classified into three groups according to their genotypes at RM167. As expected, all lines having the homozygous TQ and IRBB52 genotypes were distributed in the low-value and high-value areas, respectively, while the heterozygous lines were located in both areas (Figure S1).

3.3. QTLs Detected in the ZL2 Population

The results of QTL analysis for the five traits in the ZL2 population are shown in Table 4. Four QTLs, qGW11, qRLW11, qTGW11 and qHD11, were detected. All of them were also detected in the ZL1 population. Two other QTLs detected in the Z1 population, qGL11.1 and qGL11.2, were not found in ZL2.
The allelic effects of the four common QTLs were consistent across the two populations, with the enhancing alleles derived from IRBB52 at qGW11 and qTGW11, and from TQ at qRLW11 and qHD11. Consistency was also observed for the location of qGW11, qRLW11 and qTGW11. On the other hand, the effects of these three QTLs were much lower in ZL2 than in ZL1. In HZ, where the two populations were tested together, the LOD scores ranged from 3.7 to 5.6 in ZL2 and 24.1 to 53.2 in ZL1, and the R2 values ranged from 5.6 to 9.1% in ZL2 and 32.3 to 56.6% in ZL2. The additive effects on GW, RLW and TGW were also decreased from 0.016 mm, 0.016 and 0.41 g in ZL1 to 0.006 mm, 0.006 and 0.14 g in ZL2, respectively. The remaining common QTL, qHd11, was more consistent across the two populations, especially the additive effect.

3.4. Validation of qGS11 Using NILs

Following the results of QTL mapping in the ZL1 and ZL2 populations, the upper region of the interval RM167–RM287 was targeted for further study. A plant that was heterozygous at RM167 and EL5428 but homozygous at seven other marker loci was identified and selfed to derive an NIL population segregating the 1.4 Mb interval RM167–EL5428 (Table S2).
Two-way ANOVA detected highly significant differences (p < 0.0001) between NILTQ and NILIR on all the four traits tested (Table 5). The enhancing alleles were derived from TQ for RLW and from IRBB52 for GL, GW and TGW. The proportions of phenotypic variance explained were 59.9% for TGW, 56.3% for GW and 20.3% for RLW, with the additive effects of 0.47 g, 0.022 mm and 0.012. All these results are in good agreement with the mapping results in the ZL1 population. For GL, the additive effect of 0.019 mm and R2 value of 9.5% were lower than the values estimated for qGL11.1 and qGL11.2, suggesting that the repulsion linkage of qGL11.1 and qGL11.2 in the ZL1 population may interfere with the estimation of their effects.

4. Discussion

It is generally understood that complex traits are mainly controlled by a large number of genes having small effects that interact with other genes and environmental factors [21]. However, most cloned genes/QTLs controlling grain size in rice are those having major effects, and not much attention has been paid to minor QTLs until recently [22]. In this study, the 13.2 Mb interval RM167–RM287 on chromosome 11 previously found to be associated with genetic variation of grain weight in rice was targeted for the detection and validation of QTLs for grain weight, size and shape. Two QTL clusters were detected. One of them, qGS11, having a relatively large effect on grain width and weight and a smaller effect on grain length, was mapped in a 1.4 Mb interval flanked by an SSR marker, RM167, and InDel marker, EL5428. These results lay a foundation for the cloning and breeding utilization of qGS11.
Rice grain quality is composed of many components, among which appearance quality is one of the critical factors affecting market value [23]. The appearance quality is usually judged by GL, GW, and the percentage of chalky grain and endosperm transparency. The target region of this study exhibited significant effects on GW, RLW and TGW, with the IRBB52 allele increasing GW and TGW but reducing RLW. In previous studies using the same rice cross, this region was also reported to affect endosperm transparency with the reducing allele derived from IRBB52 [24]. It is worth noting that this region also controlled HD with the IRBB52 allele promoting heading. Pleiotropism of heading date genes on yield traits has been frequently observed, including Ghd7, DTH8/Ghd8, RFT1, HD1 and HD2 [7,8,9,10,11,12]. Nevertheless, no study assessing the pleiotropic effect of heading date genes on grain appearance quality in rice has been reported. The qGS11 region is a good target for analyzing the genetic relationship between HD and appearance quality.
Four of the cloned genes for HD were located on chromosome 11, including RCN1, Os11g0187200, OsFKF1 and DHD1. RCN1 had effects on HD and grain panicles. The overexpression of RCN1 delayed flowering and increased the spikelet number. RCN-knockdown plants exhibited small panicles with reduced branches [25]. DHD1 interacted with OsHAP5C/D to delay heading by suppressing EHd1, Hd3a and RFT1. Compared to the wild-type lines, the plant height, panicle length, primary branching and secondary branching of overexpression lines were significantly increased, while the tiller number and grain weight were not changed [26]. OsFKF1 delayed heading, decreased grain number, and increased panicle number, spikelet fertility and grain weight [27]. It is noteworthy that an association between delayed heading and enhanced grain yield was commonly observed [28,29,30,31], whereas early flowering is required for double-season cropping and for growing in the northernmost cultivation area [32,33,34]. The small but stable additive effect of the qGS11 region on HD may be utilized for fine-tuning the growth duration.

5. Conclusions

Two QTL clusters for grain size and shape in rice were mapped in the 13.2 Mb RM167–RM287 interval on chromosome 11. One of them, qGS11, was located in the 1.4 Mb interval RM167–EL5428, having a relatively large effect on grain width and weight and a smaller effect on grain length. This QTL had a consistent effect across different environments, making it a good candidate for gene cloning.

Supplementary Materials

The following supporting information can be downloaded at: https://www.mdpi.com/article/10.3390/agriculture12091384/s1. Table S1. Two residual heterozygous plants used to produce the ZL1 and ZL2 populations. Table S2. Polymorphic DNA markers used to map qGS11. Figure S1. Frequency distribution of 140 individuals with extreme thousand grain weight in ZL1 population on the RM167 locus.

Author Contributions

Conceptualization, J.-Y.Z. and Y.-J.Z.; investigation, S.-L.W., C.-L.Z., Y.-Y.F. and T.-X.H.; writing—original draft preparation, Y.-J.Z., C.-L.Z., S.-L.W. and H.Z.; writing—review and editing, J.-Y.Z., Y.-J.Z. and H.Z. All authors have read and agreed to the published version of the manuscript.

Funding

This research was funded by project of Key program of Science and Technology in Fujian province (Grant No. 2020NZ08016), project of the State Key Laboratory of Rice Biology (Grant No. 2020ZZKT10105), Central Public-interest Scientific Institution Basal Research Fund (Grant No. CPSIBRF-CNRRI-202112) and “Elite Youth” program (FAAS) (Grant No. YC2021009).

Institutional Review Board Statement

Not applicable.

Informed Consent Statement

Not applicable.

Data Availability Statement

The data generated in this study are included in this published article and its Supplementary Materials.

Acknowledgments

The authors would like to thank D.-P. Li for his assistance in field work. We acknowledge Y.-F. Sun and H.-Z. Lin for their technical assistance in laboratory works.

Conflicts of Interest

The authors declare no conflict of interest.

References

  1. Zuo, Z.-W.; Zhang, Z.-H.; Huang, D.-R.; Fan, Y.-Y.; Yu, S.-B.; Zhuang, J.-Y.; Zhu, Y.-J. Control of thousand-grain weight by OsMADS56 in rice. Int. J. Mol. Sci. 2022, 23, 125. [Google Scholar] [CrossRef] [PubMed]
  2. Li, Q.; Lu, L.; Bai, X.; Zhou, X.; Wu, B.; Yuan, M.; Yang, L.; Xing, Y. A minor QTL, SG3, encoding an R2R3-MYB protein, negatively controls grain length in rice. Theor. Appl. Genet. 2020, 133, 2387–2399. [Google Scholar] [CrossRef] [PubMed]
  3. Chan, A.N.; Wang, L.-L.; Zhu, Y.-J.; Fan, Y.-Y.; Zhuang, J.-Y.; Zhang, Z.-H. Identification through fine mapping and verification using CRISPR/Cas9-targeted mutagenesis for a minor QTL controlling grain weight in rice. Theor. Appl. Genet. 2021, 134, 327–337. [Google Scholar] [CrossRef] [PubMed]
  4. Silvio, S.; Tuberosa, R. To clone or not to clone plant QTLs: Present and future challenges. Trends Plant Sci. 2005, 10, 297–304. [Google Scholar] [CrossRef] [PubMed]
  5. Endo-Higashi, N.; Izawa, T. Flowering time genes Heading date 1 and Early heading date 1 together control panicle development in rice. Plant Cell Physiol. 2011, 52, 1083–1094. [Google Scholar] [CrossRef] [PubMed]
  6. Guo, L.; Zhang, Z.-h.; Zhuang, J.-y. Quantitative Trait loci for heading date and their relationship with genetic control of yield traits in rice (Oryza sativa). Rice Sci. 2013, 20, 1–12. (In Chinese) [Google Scholar] [CrossRef]
  7. Xue, W.; Xing, Y.; Weng, X.; Zhao, Y.; Tang, W.; Wang, L.; Zhou, H.; Yu, S.; Xu, C.; Li, X.; et al. Natural variation in Ghd7 is an important regulator of heading date and yield potential in rice. Nat. Genet. 2008, 40, 761–767. [Google Scholar] [CrossRef]
  8. Yan, W.; Liu, H.; Zhou, X.; Li, Q.; Zhang, J.; Lu, L.; Liu, T.; Liu, H.; Zhang, C.; Zhang, Z.; et al. Natural variation in Ghd7.1 plays an important role in grain yield and adaptation in rice. Cell Res. 2013, 23, 969–971. [Google Scholar] [CrossRef]
  9. Wei, X.; Xu, J.; Guo, H.; Jiang, L.; Chen, S.; Yu, C.; Zhou, Z.; Hu, P.; Zhai, H.; Wan, J. DTH8 suppresses flowering in rice, influencing plant height and yield potential simultaneously. Plant Physiol. 2010, 153, 1747–1758. [Google Scholar] [CrossRef]
  10. Zhang, Z.-H.; Wang, K.; Guo, L.; Zhu, Y.-J.; Fan, Y.-Y.; Cheng, S.-H.; Zhuang, J.-Y. Pleiotropism of the photoperiod-insensitive allele of Hd1 on heading date, plant height and yield traits in rice. PLoS ONE 2012, 7, e52538. [Google Scholar] [CrossRef] [Green Version]
  11. Zhang, Z.-H.; Cao, L.-Y.; Chen, J.-Y.; Zhang, Y.-X.; Zhuang, J.-Y.; Cheng, S.-H. Effects of Hd2 in the presence of the photoperiod-insensitive functional allele of Hd1 in rice. Biol. Open 2016, 5, 1719–1726. [Google Scholar] [CrossRef] [PubMed]
  12. Zhu, Y.-J.; Fan, Y.-Y.; Wang, K.; Huang, D.-R.; Liu, W.-Z.; Ying, J.-Z.; Zhuang, J.-Y. Rice flowering locus T1 plays an important role in heading date influencing yield traits in rice. Sci. Rep. 2017, 7, 4918. [Google Scholar] [CrossRef]
  13. Zhang, H.; Zhu, Y.-J.; Zhu, A.-D.; Fan, Y.-Y.; Huang, T.-X.; Zhang, J.-F.; Xie, H.-A.; Zhuang, J.-Y. Identification and verification of quantitative trait loci affecting milling yield of rice. Agronomy 2020, 10, 75. [Google Scholar] [CrossRef]
  14. Zhu, A.-D. Mapping Minor-Effect QTL for Grain Weight and Shape and Validation of Five QTL in Rice. Master’s Degree, Chinese Academy of Agricultural Sciences, Hangzhou, China, 2019.
  15. Zhang, H.-W.; Fan, Y.-Y.; Zhu, Y.-J.; Chen, J.-Y.; Yu, S.-B.; Zhuang, J.-Y. Dissection of the qTGW1.1 region into two tightly-linked minor QTLs having stable effects for grain weight in rice. BMC Genet. 2016, 17, 98. [Google Scholar] [CrossRef] [PubMed]
  16. Zheng, K.; Huang, N.; Bennett, J.; Khush, G.S. PCR-Based Marker-Assisted Selection in Rice Breeding; IRRI Discussion Paper Series No.12; International Rice Research Institute: Los Baños, Philippines, 1995. [Google Scholar]
  17. Chen, X.; Temnykh, S.; Xu, Y.; Cho, Y.G.; McCouch, S.R. Development of a microsatellite framework map providing genome-wide coverage in rice (Oryza sativa L.). Theor. Appl. Genet. 1997, 95, 553–567. [Google Scholar] [CrossRef]
  18. Meng, L.; Li, H.; Zhang, L.; Wang, J. QTL Icimapping: Integrated software for genetic linkage map construction and quantitative trait locus mapping in biparental populations. Crop J. 2015, 3, 269–283. [Google Scholar] [CrossRef]
  19. McCouch, S.R.; CGSNL. Committee on Gene Symbolization, Nomenclature and Linkage, Rice Genetic Cooperative. In Gene Nomenclature System for Rice; Springer: Berlin, Germany, 2008; Volume 1, pp. 72–84. [Google Scholar]
  20. Dai, W.-M.; Zhang, K.-Q.; Wu, J.-R.; Wang, L.; Duan, B.-W.; Zheng, K.-L.; Cai, R.; Zhuang, J.-Y. Validating a segment on the short arm of chromosome 6 responsible for genetic variation in the hull silicon content and yield traits of rice. Euphytica 2008, 160, 317–324. [Google Scholar] [CrossRef]
  21. Mauricio, R. Mapping quantitative trait loci in plants: Uses and caveats for evolutionary biology. Nat. Rev. Genet. 2001, 2, 370–381. [Google Scholar] [CrossRef]
  22. Gu, H.; Zhang, K.; Gull, S.; Chen, C.; Ran, J.; Zou, B.; Wang, P.; Liang, G. Fine mapping of qTGW7b, a minor effect QTL for grain weight in rice. Int. J. Mol. Sci. 2022, 23, 8926. [Google Scholar] [CrossRef]
  23. Bao, J. Genes and QTLs for rice grain quality improvement. In Rice-Germplasm, Genetics and Improvement; Yan, W., Bao, J., Eds.; Intech: Rijeka, Croatia, 2014; pp. 239–278. [Google Scholar]
  24. Mei, D.-Y.; Zhu, Y.-J.; Yu, Y.-H.; Fan, Y.-Y.; Huang, D.-R.; Zhuang, J.-Y. Quantitative trait loci for grain chalkiness and endosperm transparency detected in three recombinant inbred line populations of indica rice. J. Integr. Agric. 2013, 12, 1–11. [Google Scholar] [CrossRef]
  25. Nakagawa, M.; Shimamoto, K.; Kyozuka, J. Overexpression of RCN1 and RCN2, rice TERMINAL FLOWER1/CENTRORADIALIS homologs, confers delay of phase transition and altered panicle morphology in rice. Plant J. 2002, 29, 743–750. [Google Scholar] [CrossRef] [PubMed]
  26. Zhang, H.; Zhu, S.S.; Liu, T.Z.; Wang, C.M.; Cheng, Z.J.; Zhang, X.; Chen, L.P.; Sheng, P.K.; Cai, M.H.; Li, C.N.; et al. DELAYED HEADING DATE1 interacts with OsHAP5C/D, delays flowering time and enhances yield in rice. Plant Biotecnol. J. 2019, 17, 531–539. [Google Scholar] [CrossRef] [PubMed]
  27. Han, S.-H.; Yoo, S.-C.; Lee, B.-D.; An, G.; Peak, N.-C. Rice FLAVIN-BIDING, KELCH REPEAT, F-BOX1 (OsFKF1) promotes flowering independent of photoperiod. Plant Cell Environ. 2015, 38, 2527–2540. [Google Scholar] [CrossRef]
  28. Saito, H.; Yuan, Q.; Okumoto, Y.; Doi, K.; Yoshimura, A.; Inoue, H.; Teraishi, M.; Tsukiyama, T.; Tanisaka, T. Multiple alleles at Early flowering 1 locus making variation in the basic vegetative growth period in rice (Oryza sativa L.). Theor. Appl. Genet. 2009, 119, 315–323. [Google Scholar] [CrossRef] [PubMed]
  29. Yuan, Q.; Saito, H.; Okumoto, Y.; Inoue, H.; Nishida, H.; Tsukiyama, T.; Teraishi, M.; Tanisaka, T. Identification of a novel gene ef7 conferring an extremely long basic vegetative growth phase in rice. Theor. Appl. Genet. 2009, 119, 675–684. [Google Scholar] [CrossRef]
  30. Gao, H.; Jin, M.; Zheng, X.; Chen, J.; Yuan, D.; Xin, Y.; Wang, M.; Huang, D.; Zhang, Z.; Zhou, K.; et al. Days to heading 7, a major quantitative locus determining photoperiod sensitivity and regional adaptation in rice. Proc. Natl. Acad. Sci. USA 2014, 111, 16337–16342. [Google Scholar] [CrossRef]
  31. Wei, H.-H.; Li, C.; Xing, Z.-P.; Wang, W.-T.; Dai, Q.-G.; Zhou, G.-S.; Wang, L.; Xu, K.; Huo, Z.-Y.; Guo, B.-W.; et al. Suitable growing zone and yield potential for late-maturity type of Yongyou japonica/indica hybrid rice in the lower reaches of Yangtze River. J. Integr. Agric. 2015, 1, 13. [Google Scholar] [CrossRef]
  32. Wei, X.; Liu, L.; Xu, J.; Jiang, L.; Zhang, W.; Wang, J.; Zhai, H.; Wan, J. Breeding strategies for optimum heading date using genotypic information in rice. Mol. Breed. 2010, 25, 287–298. [Google Scholar] [CrossRef]
  33. Fujino, K.; Yamanouchi, U.; Yano, M. Roles of the Hd5 gene controlling heading date for adaptation to the northern limits of rice cultivation. Theor. Appl. Genet. 2013, 126, 611–618. [Google Scholar] [CrossRef]
  34. Naranjo, L.; Talón, M.; Domingo, C. Diversity of floral regulatory genes of japonica rice cultivated at northern latitudes. BMC Genom. 2014, 15, 101. [Google Scholar] [CrossRef] [Green Version]
Figure 1. Frequency distribution of five traits in the ZL1 population. (A) Grain length. (B) Grain width. (C) Ratio of grain length to width. (D) Thousand grain weight. (E) Heading date.
Agriculture 12 01384 g001
Figure 2. LOD profiles of QTLs for TGW, GL and GW detected in the ZL1 population. (A) TGW, 1000-grain weight. (B) GL, grain length. (C) GW, grain width.
Agriculture 12 01384 g002
Table 1. Phenotypic performance of five traits in the ZL1 and ZL2 populations.
PopulationTraitLocationMeanSDCVRangeSkewnessKurtosis
ZL1GLHangzhou7.9620.0540.687.830−8.111−0.08−0.51
Jianyang7.9020.0530.677.753−8.0730.13−0.10
GWHangzhou2.7570.0260.942.692−2.8190.09−0.39
Jianyang2.9130.0220.762.870−2.9800.31−0.30
RLWHangzhou2.9000.0230.792.846−2.9970.360.36
Jianyang2.7220.0210.772.670−2.7680.04−0.59
TGWHangzhou23.270.472.0222.29−24.450.26−0.61
Jianyang24.890.471.8923.93−26.470.50−0.24
HDHangzhou85.81.11.2883.1−89.50.540.22
Jianyang85.71.21.4083.0−88.20.09−0.57
ZL2GLHangzhou8.0430.0460.577.906–8.1670.01−0.33
GWHangzhou2.7120.0260.962.627–2.789−0.120.10
RLWHangzhou2.9780.0220.742.912–3.0620.460.76
TGWHangzhou23.070.381.6521.83–24.15−0.250.19
HDHangzhou84.91.11.2980.8–89.60.210.89
Table 2. Correlation coefficients between five traits in the ZL1 population.
TraitsGL GW RLW TGW
HangzhouJianyangHangzhouJianyangHangzhouJianyangHangzhouJianyang
GW0.576 ***0.434 ***
RLW0.175 ***0.470 ***−0.703 ***−0.590 ***
TGW0.766 ***0.616 ***0.896 ***0.817 ***−0.406 ***−0.244 ***
HD−0.194 ***0.108 −0.504 ***−0.0580.442 ***0.155 **−0.468 ***−0.180 **
GL (mm), grain length; GW (mm), grain width; RLW, ratio of grain length to grain width; TGW (g), 1000-grain weight; HD (d) heading date; **, p < 0.01; ***, p < 0.001.
Table 3. QTLs detected in the ZL1 population.
QTLIntervalHangzhou Jianyang
LODADR2 (%)LODADR2 (%)
qGL11.1RM167—EL711017.40.0290.01318.326.50.0390.00616.5
qGL11.2EL7110—RM2669414.1−0.028−0.00813.710.7−0.025−0.0096.1
qGW11RM167—EL711025.40.016−0.00145.532.60.0170.000440.2
qRLW11EL7110—RM2669424.1−0.016−0.00732.313.2−0.011−0.00520.3
qTGW11RM167—EL711053.20.410.0256.653.40.410.0156.7
qHD11EL7110—RM2669414.2−0.6−0.220.49.8−0.6−0.214.5
A, additive effect of replacing a maternal allele with a paternal allele; D, dominance effect; R2, percentage of phenotypic variance explained; GL (mm), grain length; GW (mm), grain width; RLW, ratio of grain length to grain width; TGW (g), 1000-grain weight; HD (d), heading date.
Table 4. QTLs detected in the ZL2 population.
QTLIntervalLODADR2 (%)
qGW11RM167–EL71103.70.006−0.0095.6
qRLW11EL7110–RM266944.1−0.0060.0076.9
qTGW11RM167–EL71105.60.14−0.029.1
qHD11RM167–EL71107.8−0.50.211.3
A, additive effect of replacing a maternal allele with a paternal allele; D, dominance effect; R2, percentage of phenotypic variance explained; GW (mm), grain width; RLW, ratio of grain length to grain width; TGW (g), 1000-grain weight; HD (d), heading date.
Table 5. The effect of qGS11 detected in an NIL population.
TraitPhenotypic (Mean ± SD)pAR2 (%)
NILTQNILIR
GL7.658 ± 0.0467.696 ± 0.051<0.00010.0199.5
GW3.006 ± 0.0143.049 ± 0.019<0.00010.02256.3
RLW2.548 ± 0.0202.524 ± 0.024<0.0001−0.01220.3
TGW23.96 ± 0.2424.9 ± 0.34<0.00010.4759.9
A, additive effect of replacing a TQ allele with an IRBB52 allele; R2, percentage of phenotypic variance explained. NILTQ and NILIR are near-isogenic lines carrying homozygous TQ and IRBB52 alleles in RM167–EL5428, respectively.
Publisher’s Note: MDPI stays neutral with regard to jurisdictional claims in published maps and institutional affiliations.

