Review

Applications of Electronic Nose Coupled with Statistical and Intelligent Pattern Recognition Techniques for Monitoring Tea Quality: A Review

1
Department of Tropical Agriculture and International Cooperation, National Pingtung University of Science and Technology, Pingtung 91201, Taiwan
2
Department of Food Science, National Pingtung University of Science and Technology, Pingtung 91201, Taiwan
*
Author to whom correspondence should be addressed.
Agriculture 2022, 12(9), 1359; https://doi.org/10.3390/agriculture12091359
Submission received: 8 August 2022 / Revised: 26 August 2022 / Accepted: 31 August 2022 / Published: 1 September 2022
(This article belongs to the Special Issue The Application of Machine Learning in Agriculture)

Abstract

:
Tea is the most widely consumed non-alcoholic beverage worldwide. In the tea sector, the high demand for tea has led to an increase in the adulteration of superior tea grades. The procedure of evaluating tea quality is difficult to assure the highest degree of tea safety in the context of consumer preferences. In recent years, the advancement in sensor technology has replaced the human olfaction system with an artificial olfaction system, i.e., electronic noses (E-noses) for quality control of teas to differentiate the distinct aromas. Therefore, in this review, the potential applications of E-nose as a monitoring device for different teas have been investigated. The instrumentation, working principles, and different gas sensor types employed for E-nose applications have been introduced. The widely used statistical and intelligent pattern recognition methods, namely, PCA, LDA, PLS-DA, KNN, ANN, CNN, SVM, etc., have been discussed in detail. The challenges and the future trends for E-nose devices have also been highlighted. Overall, this review provides the insight that E-nose combined with an appropriate pattern recognition method is a powerful non-destructive tool for monitoring tea quality. In future, E-noses will undoubtedly reduce their shortcomings with improved detection accuracy and consistency by employing food quality testing.

1. Introduction

Tea is one of the most popular and consumable non-alcoholic beverages globally. It has been extensively explored due to its abundant health-benefiting compounds. Certain chemical compounds in tea, such as amino acids, polyphenols, theanine, catechins, etc., may help to prevent oxidation, chronic gastritis, and cardiovascular disease [1,2]. These compounds accumulate during the growing stage of fresh tea leaves and the tea processing stage, which are responsible for distinctive features of tea flavor and internal tea quality [2]. Among them, polyphenols are the main bioactive substances in tea that indirectly affect both the aroma as well as the volatility of flavor compounds in tea. In addition, polyphenol content varies in different tea varieties and is regarded as an important marker for evaluating tea quality. Recently, tea polyphenols have gained much attention in the scientific community due to their diverse pharmacological effects, making quantitative extraction as well as determination of tea polyphenol content particularly essential [3]. According to reports, global tea market demand is expected to surpass USD 148.16 billion by 2027, with a compound annual growth rate (CAGR) of 6.4% [4]. With the rapidly growing demand for tea globally, the superior grades of tea are sold at higher prices in the market. The intentional substitution of superior tea grades with inferior ones and the misappropriation of geographical indications harm not only consumers’ interests but also tea producers’ profits [1,5]. As a result, these occurrences contribute to declining consumer confidence in the tea sector. Therefore, geographical discrimination and quality assessment of teas have become essential for promoting tea drinking and consumption around the world [5].
Tea quality is affected by several parameters, including soil, climate, plucking season, and different processing methods. Superior-quality teas are usually grown in favorable conditions, harvested at certain times, and processed using specific methods. As a result, the aforesaid considerations limited the supply of superior-quality teas [1]. In the tea industry, the tea processing procedures involve withering, fixation (oolong tea, yellow tea, and green tea), rolling, fermentation (black tea), post-fermentation (dark tea), drying, or roasting. Following the processing steps, fresh tea leaves are categorized into six major types: green tea (unfermented tea), yellow tea, white tea, black tea, oolong tea, and dark tea (fermented tea). Among them, black tea is the most popular tea, comprising nearly 75% of all tea types consumed globally [6]. The different grades of tea have distinct aromas, tastes, and bioactive compounds [1,7]. However, due to the presence of numerous compounds in tea, it is difficult for the average consumer to discriminate between teas of different quality grades [2]. Hence, an efficient method for the accurate estimation of tea quality is required.
Usually, human sensory analysis is used to assess the quality of tea based on sensory descriptors, namely morphological characteristics, tastes, aromas, texture, and colors [7,8]. The analysis requires professional panel evaluators to have their own perceptions about various tea sensory attributes, which is difficult for consumers to understand. Besides, the main problems of sensory analysis are the need for a large group of educated and trained people (not always feasible) [9], long and constant training, harmonization of vocabulary, and special technical conditions (such as room and lighting). In recent years, numerous analytical techniques have been proposed for assessing tea quality: for example, ultraperformance liquid chromatography (UPLC), high-performance liquid chromatography (HPLC), gas chromatography-mass spectrometry (GC-MS), capillary electrophoresis (CE), and plasma atomic emission spectrometry [7,8]. These methods, however, have disadvantages in that they impose high operation costs, require highly skilled analysts and time-consuming techniques, and cannot be applied for real-time monitoring of tea quality [3,8,10]. Therefore, the higher expectations for quality control of products have increased the requirements for rapid, reliable, and cost-effective analysis.
With the rapid advancement of multi-sensor and electronic technologies, accurate results in fast food analysis have become possible. Electronic eye (E-eye), electronic nose (E-nose), and electronic tongue (E-tongue) systems are composed of color, gas, and liquid sensors that resemble human vision, olfactory, and gustatory systems. The sample detection is fast, with no requirement for sample pretreatment [2]. An E-nose system has been developed to identify and distinguish different odors [11]. An E-nose system’s sensor array consists of some non-specific sensors, and an odor stimulus generates a fingerprint from this array. Fingerprints or patterns from known odors are used to train a pattern recognition model such that unknown odors can be classified and identified subsequently [9]. Recently, the E-nose has been regarded as a powerful tool for tea quality monitoring. For instance, wide applications in tea research include tea classification, tea fermentation methods, tea components, tea grade quality, and tea storage [3,9]. The aforementioned studies demonstrated the potential of the E-nose device to classify tea and monitor its quality. To date, no systematic review has extensively explored various pattern recognition methods coupled with E-nose technology, in particular for tea research. Specifically, this review focuses on the recent advancements in the use of E-noses to assess tea quality. Therefore, the purpose of this review is to disseminate to other researchers not only the advancements in the tea research area but, more importantly, the common methodologies that can be applied to address the problems with quality control in different areas. Hence, this review will inform readers about how E-nose technology coupled with various pattern recognition methods can be successfully employed in the field of food authentication.

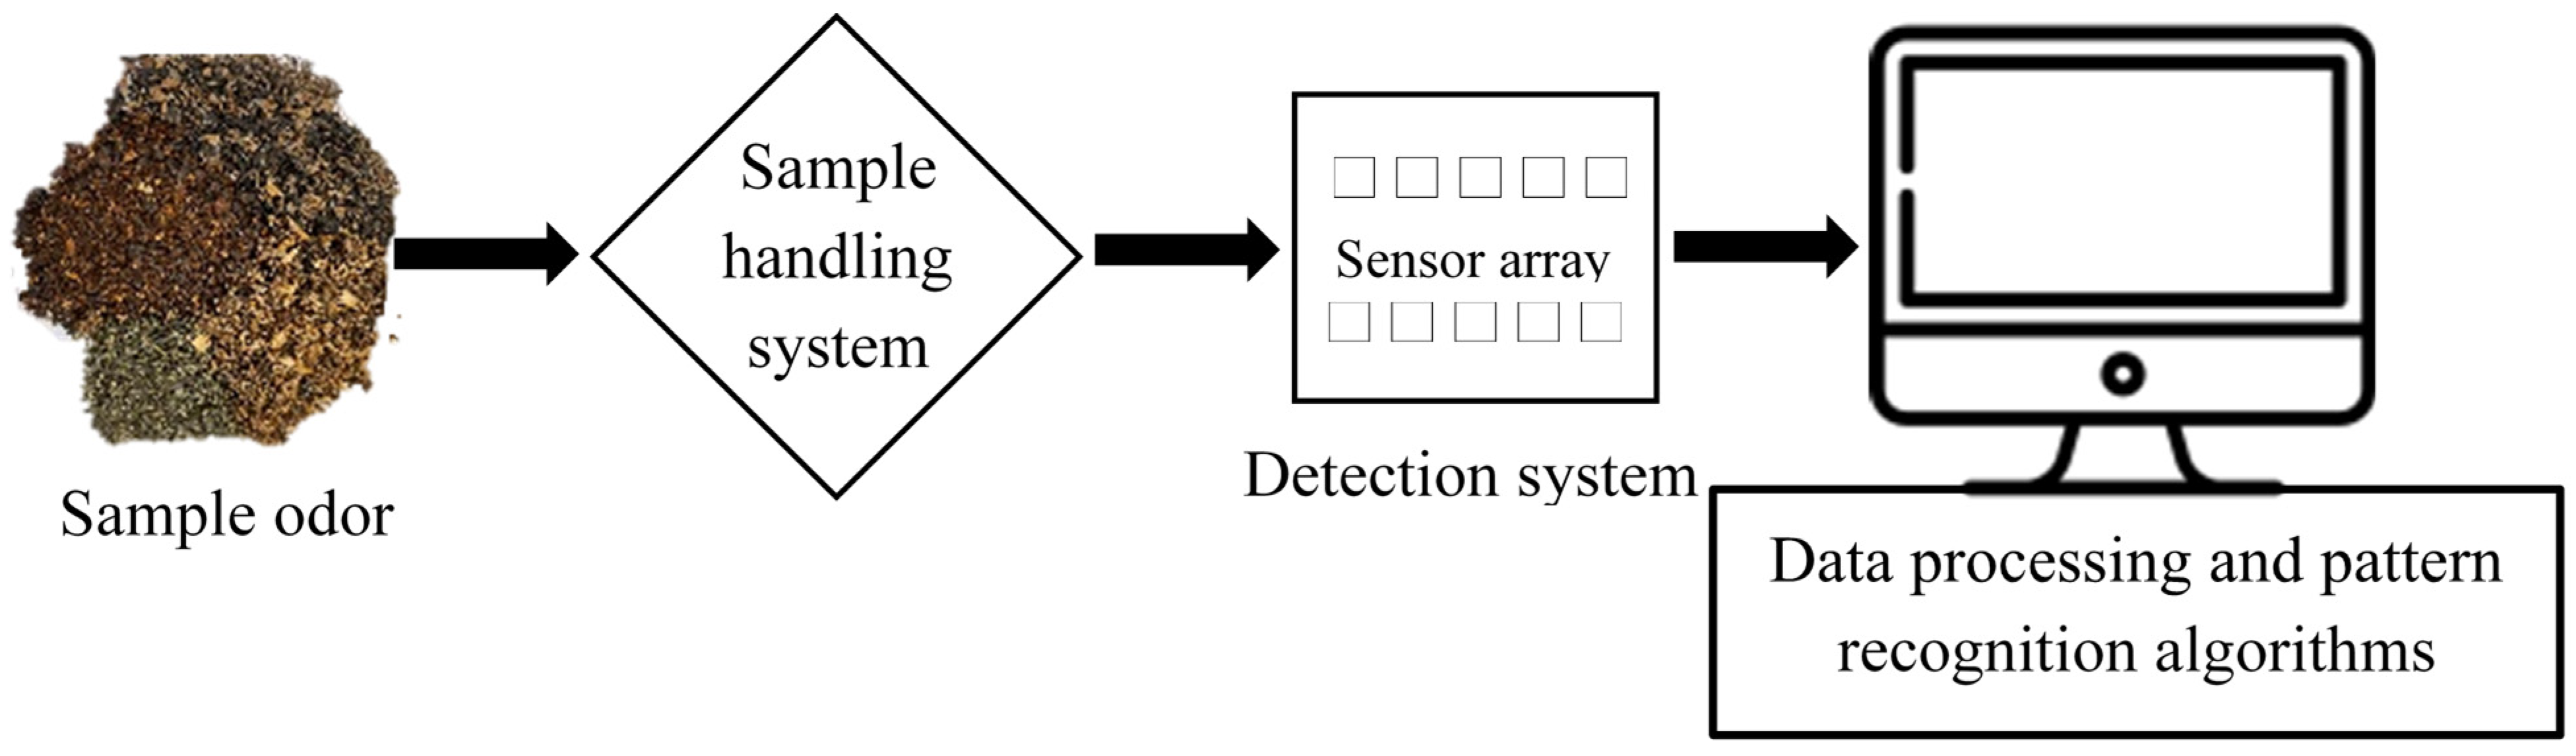
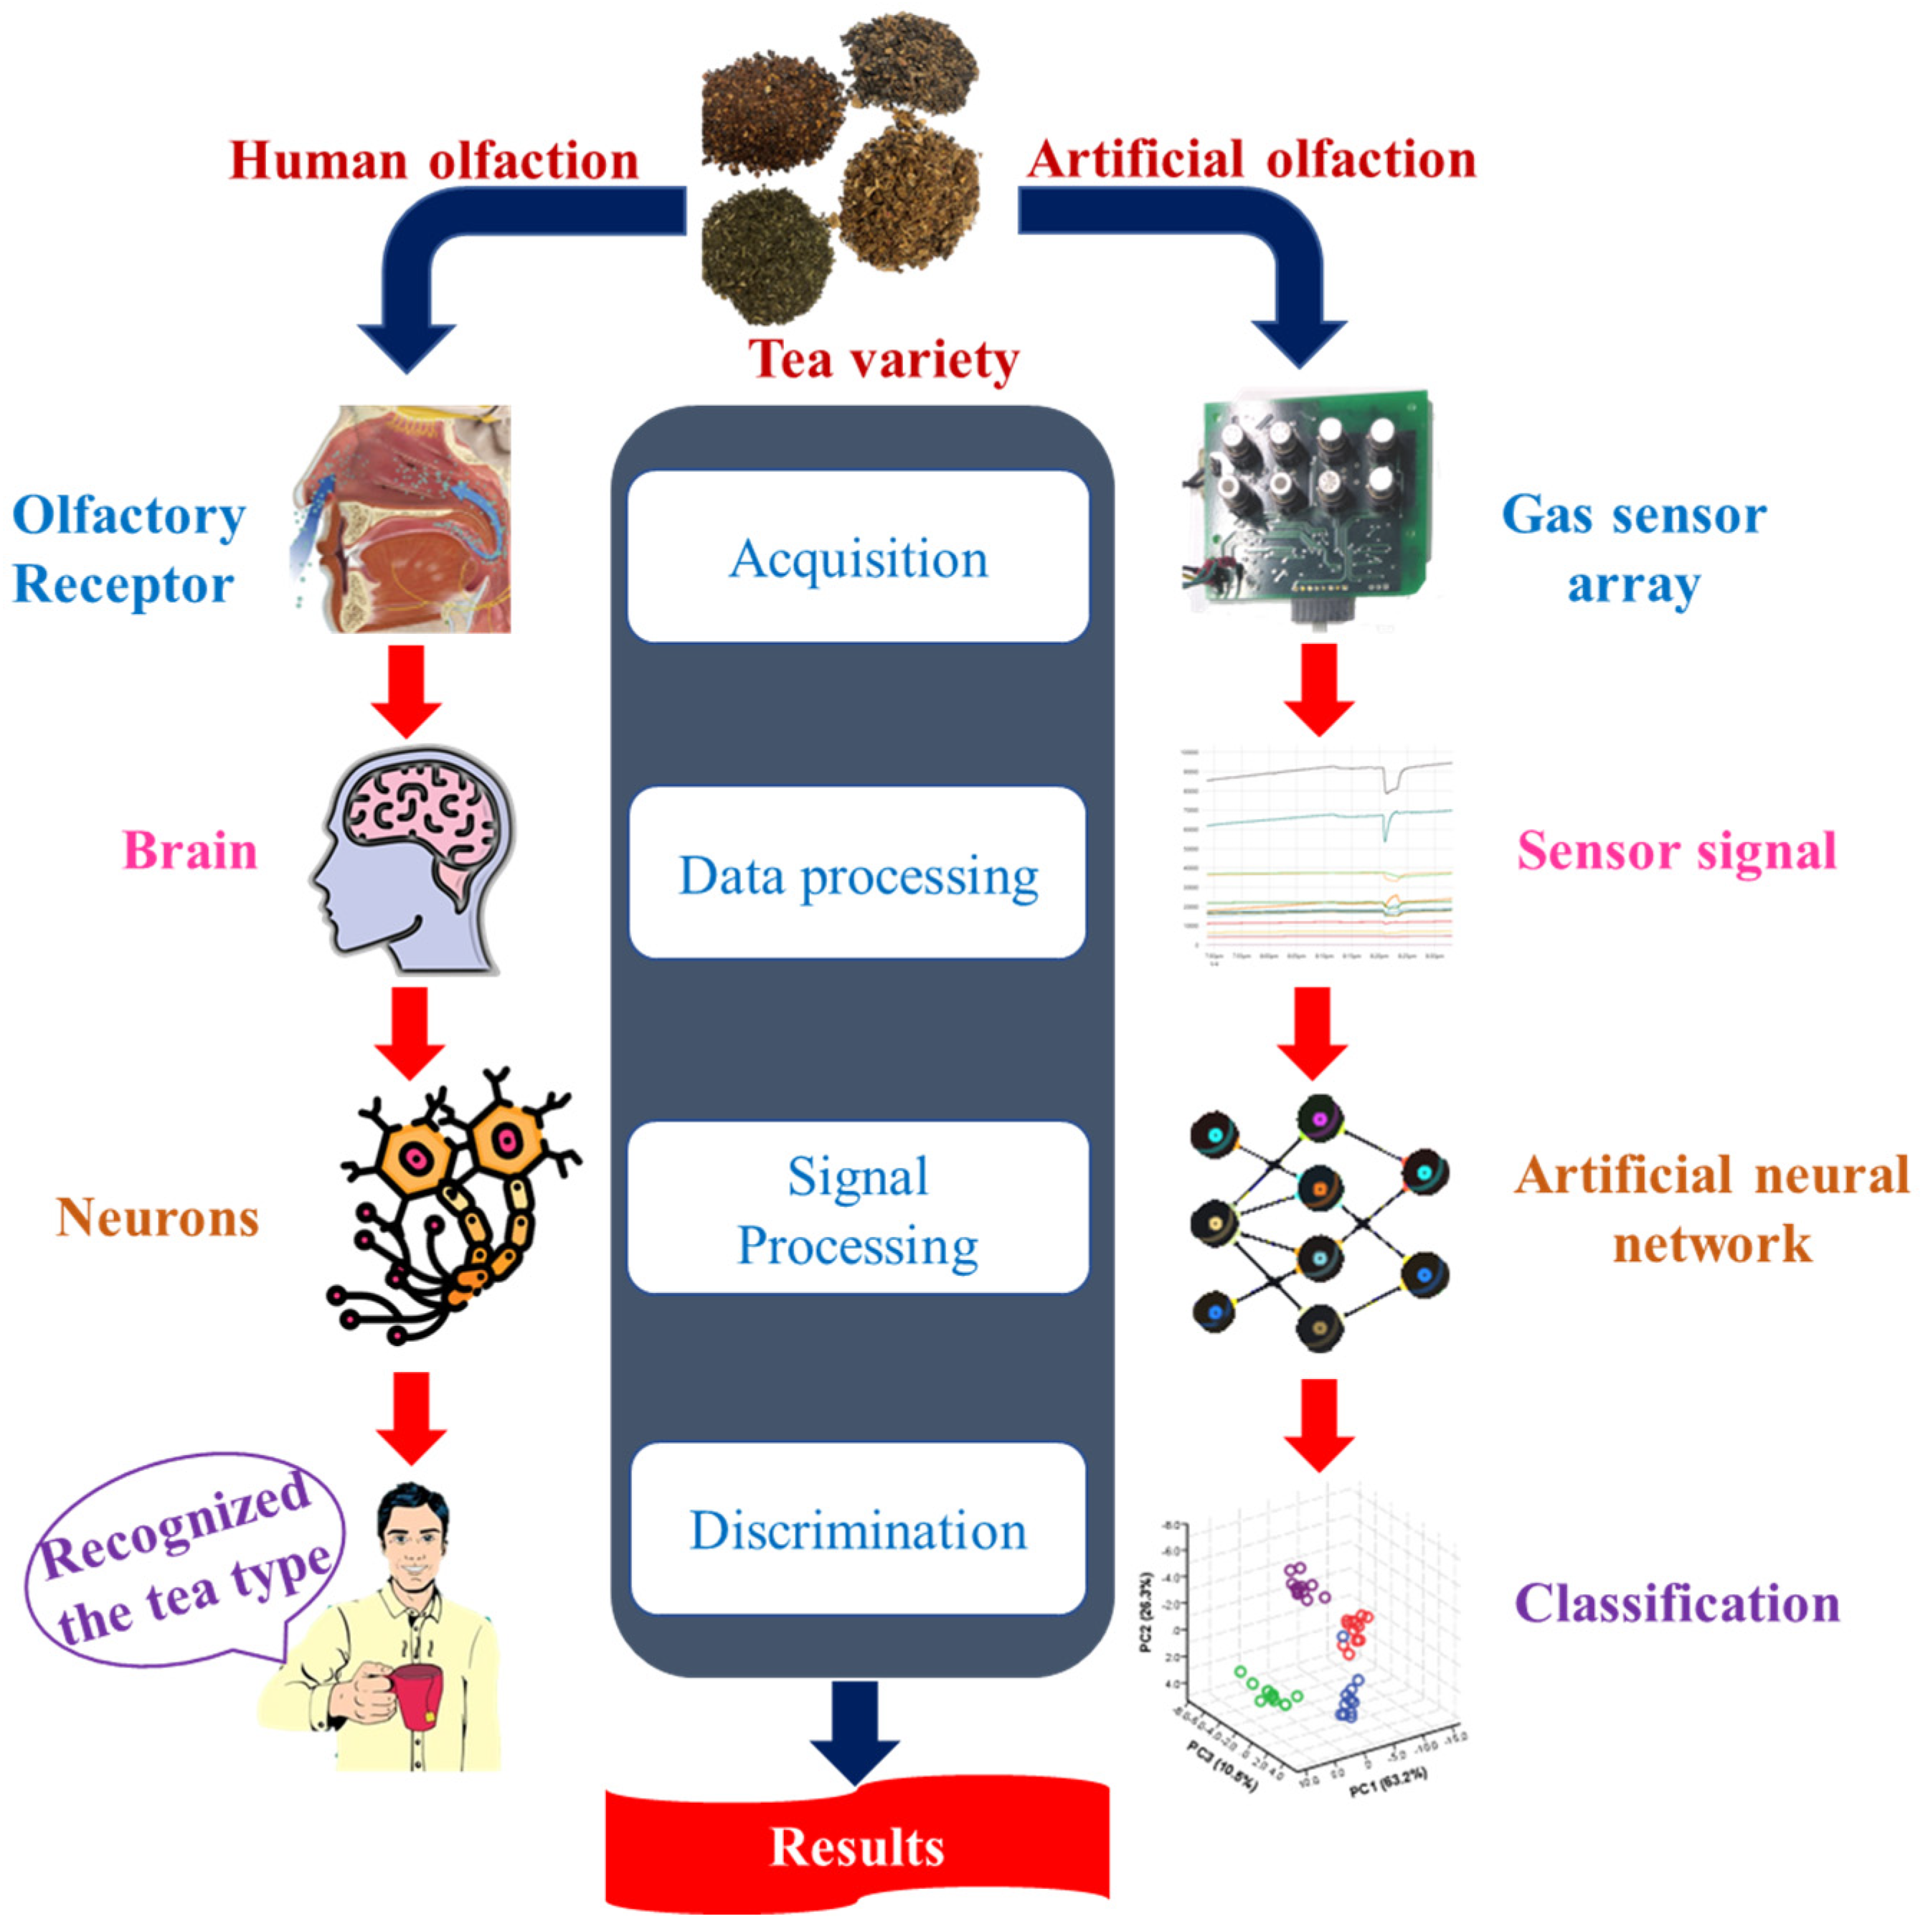
2. E-Nose Instrumentation

The E-nose device is designed in such a manner as to identify and distinguish between a variety of complex odors. This non-destructive device is composed of sensor arrays that react to the vapors and gases the sample generates. Typically, the sensor array comprises non-specific sensors that have been sensitized to various chemical substances; thus, each element measures a distinct property of the chemical perceived [12]. When the odors or volatile molecules react with the sensor array, subsequent changes in the electrical properties, mainly conductivity, occur. As a consequence, pattern recognition algorithms are used to characterize those detected changes to perform classification or discrimination of samples [13]. As represented in Figure 1, the E-nose device consists of three main parts: (1) sample handling system, (2) detection system, and (3) data processing system and pattern recognition algorithms. A comparison of the basic analogies between human olfaction (biological olfaction) and an E-nose (artificial olfaction) is represented in Figure 2.

2.1. Sample Handling System

An important step in the sample handling system is transferring the volatile odor molecules generated in the headspace (HS) to the E-nose sensor array. Prior to sample detection, several variables must be optimized, including sample quantity, sample temperature, vial size, and equilibration time [14]. Different sampling methods have been explored in the literature for applications in the food industry. These include solid-phase micro-extraction (SPME), dynamic headspace (DHS), purge and trap (P&T), static headspace (SHS), inside-needle dynamic extraction (INDEX), stir bar sportive extraction (SBSE), and membrane introduction mass spectrometry (MIMS) [12,14,15]. Among these, SHS is the most commonly used method due to its ease of use. However, this method presents a drawback in providing low sensitivity because of the lack of a pre-concentration system involved for volatile components [12]. In particular, for the advancement in tea analysis, an innovative sample handling system was developed on the basis of the principle of illumination-controlled heating coupled with physical raking to enhance the sensitivity of the sensor array [15,16].

2.2. Detection System

The most sophisticated and important component of an E-nose detection system is the gas/odor sensor array, which consists of various sensors with a wide range of response characteristics and high cross-sensitivity towards varied gases/vapors. These gas sensors convert gas concentrations into electrical signals, which are then used to perform quantitative or qualitative analysis on the samples being monitored. In consideration of improving the performance of an E-nose system for monitoring samples, the selection of an appropriate gas sensor array is essential [14]. A vast variety of different gas sensors have been devised, as shown in Table 1. Each sensor category has different types that are sensitive to different gaseous molecules, and the individual selection of a sensor depends on the gas exposure type [12]. Among them, metal oxide semiconductor (MOS), conducting polymer (CP), and electrochemical (EC) sensors are the most popularly utilized sensors for E-nose applications because of their rapid response, high sensitivity, high detection of gases, and low cost [12,14,17].
The sensor array, constituting the most essential part, is made up of 10 MOS sensors, each of which has a particular sensitivity to volatile substances. The 10 MOS sensors are listed in Table 2, which also details their main applications [18]. Recently, applications of MOS sensors have been explored in various food areas, including quality control and monitoring and identification of geographical origin, aging, spoilage and contamination, and adulteration [19]. The MOS sensors employed in commercial E-noses prevail from different companies around the world. Ongoing research on enhancing the sensitivity and selectivity is paving the way towards the advancement of these sensors [17]. The E-nose instrument is typically integrated with a variety of sensing materials, such as quartz crystal microbalance, CP, EC, MOS (e.g., tin, zinc, cobalt, nickel, titanium, and iron oxides) sensors, etc. As a result, the material and sensor types employed impact the selectivity, response time, sensitivity, and efficiency of each E-nose [20]. However, studies have proved the potential of MOS sensors in food applications for long-term operation in continuous mode [17]. For example, MOS sensors successfully discriminated the five different tea categories, indicating the potential of the instrument to distinguish between flavors of the different teas manufactured under various processing methods [19]. Another recent study demonstrated that an E-nose device equipped with MOS sensors could classify complex odors of volatile compounds present in food materials such as tea. Thereafter, it can be used for discrimination purposes and the determination of quality changes [20].

2.3. Data Processing System

After collection of the data signals from the different sensor arrays, interpretation of the complex data is accomplished [12]. The key criteria for the measuring systems are the preprocessing of collected E-nose signals. For example, baseline processing, data compression (feature extraction or selection), and normalization are common signal preprocessing techniques. Odor signal pretreatment has a significant impact on the E-nose performance, which increases E-nose classification performance while reducing noise, complexity, and recognition errors [14]. The majority of E-nose devices record the sensor’s raw response over time. A number of factors influence sensor response, including pumping system effectiveness, noisy gas sensor records, and sample aroma retention following the cleaning stage. Therefore, raw data are first preprocessed using singular value decomposition (SVD) or a difference model, where the change in sensor resistance relative to a reference gas is determined, and then the data set of static change in sensor resistance, dR (dR = Rair − Rodor), is normalized by maximum value to set the range to 0–1. Other studies reported the usage of standard normal variate (SNV) for data preprocessing with E-nose devices [30]. Moreover, to identify and analyze the data, appropriate post-processing methods are required. Several pattern recognition algorithms are used in post-processing techniques [15], which are discussed in detail in Section 3.

3. Pattern Recognition Algorithms for E-Nose

Pattern recognition constitutes an important part in the development of an E-nose instrument capable of detection, identification, and quantification of different complex volatile compounds. These are typically classified as statistical and intelligent pattern recognition methods [14]. The most widely applied pattern recognition techniques in E-nose applications include linear discriminant analysis (LDA) and discriminant function analysis (DFA), principal component analysis (PCA), multinomial logistic regression (MultiLR), partial least squares discriminant analysis (PLS-DA), partial least squares regression (PLSR), hierarchical cluster analysis (HCA), K-nearest neighbor (KNN), artificial neural network (ANN), convolutional neural network (CNN), decision trees (DT), random forest (RF), and support vector machine (SVM) [14,31]. PCA and HCA are unsupervised learning algorithms, while LDA and DFA, MultiLR, PLS-DA, PLSR, KNN, ANN, CNN, DT, RF, and SVM are supervised learning algorithms [32]. These algorithms can be categorized into statistical or intelligent pattern recognition methods based on linear or nonlinear approaches [13,14,15].

3.1. Statistical Pattern Recognition Methods

3.1.1. Linear Discriminant Analysis (LDA)

LDA, a dimensionality reduction technique, is a widely applied recognition method for E-nose devices. This method identifies a linear combination of features that characterize or distinguish between two or more classes of odors [33]. Suppose there are two classes of odors in samples. LDA creates one hyperplane and projects the data in such a way that the separation of classes is maximized. The hyperplane is drawn based on minimizing the distance within the same class and maximizing the distance between the classes [34]. The purpose of LDA is to reduce the original dataset into a lower-dimensional space with high sample discrimination, thus reducing the risk of overfitting and computing costs [35]. The requirements of LDA include continuous quantities of the input independent variables for given observations [33].

3.1.2. Principal Component Analysis (PCA)

PCA is a statistical method belonging to the factorial analysis group. PCA aims to use a small number of factors to represent the variance in a dataset [36]. Using an orthogonal transformation, it converts a set of observations of possibly correlated variables into a set of values of linearly uncorrelated variables. These variables are known as principal components (PCs) [33]. Iteratively calculated PCs retain as much variance as possible from the original data, such that PC1 accounts for more data variance than PC2, and PC2 accounts for more data variance than PC3, and so on. Because of this, a few PCs account for the variability in a large number of original data sets. For PCA analysis, only PCs having eigen values greater than 1 are considered significant based on the Kaiser criterion. In contrast, Bartlett’s test of sphericity indicates the suitability of the raw data for performing PCA [36].

3.1.3. Multinomial Logistic Regression (MultiLR)

MultiLR is an extension of the logistic (binary) regression model. This method is used when the dependent variable of a study has more than two categorical levels of outcome variable. MultiLR, like binary logistic regression, employs maximum likelihood estimation to determine the probability of categorical membership [37]. MultiLR is a classification approach with a discrete random variable set of 1,2,3, …, K, where K is the number of categories. The independent variable is either 0 or 1. Several studies have employed the application of MultiLR to create classification models with good classification results [38]. MultiLR has gained much popularity because it does not require assumptions of normality, linearity, and homogeneity of variance of independent variables. Hence, it is a more commonly used method of analysis than discriminant function analysis since it does not require such assumptions [39].

3.1.4. Partial Least Squares Discriminant Analysis (PLS-DA)

The PLS algorithm was earlier used for regression analysis and later developed into the PLS-DA classification approach (PLS-DA). PLS-DA has been used in practice for both predictive and descriptive modelling, as well as the selection of discriminative variables [40]. PLS-DA is a dimensionality reduction technique that is referred to as a supervised version of PCA. It can be used for feature selection and classification as well. It seeks to find linear transformations that transform data to a lower dimensional space with the least amount of error via optimizing separation between samples of different groups [41]. Furthermore, PLS-DA does not require the data to fit a specific distribution, making it more flexible compared to other discriminant methods such as Fisher’s LDA. Several researchers have reported a wide range of applications of PLS-DA modelling in food analysis and metabolomics [40].

3.1.5. Partial Least Squares Regression (PLSR)

The PLSR technique combines and generalizes the features of PCA and MLR (multiple linear regression). Its aim is to predict a set of dependent variables from a set of independent variables. This prediction is accomplished by extracting a set of orthogonal factors (known as latent variables) from the predictors having the highest predictive ability. This technique is especially useful when a dependent variable set needs to be predicted from a large independent variable set [42]. The PLSR model finds the relationship between two data matrices, X and Y. In addition, it goes beyond the traditional regression by modelling the structure of X and Y. PLSR can analyze data in both X and Y with numerous, correlated, noisy, and even incomplete variables. The precision of the model parameters improves with the increase in the number of observations and relevant variables. As a result, PLSR enables more realistic investigation of complex issues and data analysis [43].

3.1.6. Hierarchical Cluster Analysis (HCA)

HCA is a clustering algorithm that examines the organization of test samples within and among groups in the form of a hierarchy. HCA results are typically presented in the form of a dendrogram, which is a tree-like plot that depicts the organization of samples and their relationships. In HCA, there are two main approaches to resolving the grouping problem: agglomerative and divisive [36]. It basically allows the classification of variables based on their similarities and differences, while taking previously assigned characteristics into account [44]. Clustering is performed using the appropriate distance measure (Manhattan, Euclidean, or Mahalanobis distance) and linkage criteria (single and average, complete, or Ward’s linkage). HCA has been widely applied to assess the multivariate relationship between bioactive substances and the bioactivity of beverages and foods [36].

3.2. Intelligent Pattern Recognition Methods

3.2.1. K-Nearest Neighbor (KNN)

KNN is one of the most popularly used algorithms in the food industry to solve classification problems. The “K” in KNN represents the number of the nearest neighbors being included in the majority voting process [45]. KNN is classified by computing the distances between different feature values. The idea is that if the majority of the K similar samples in the feature space belong to a particular category, then the sample does as well belong to that category, where k represents an integer no greater than 20. Moreover, the selected neighbors in the KNN algorithm are all correctly classified objects. This algorithm only determines which category the samples to be classified belong to, depending on the category of the proximity of the samples in the decision-making of classification [46]. In this algorithm, the Manhattan or Euclidean distance is usually used as the distance metric [46,47].

3.2.2. Artificial Neural Network (ANN)

An ANN is a supervised model inspired by the networks of biological neurons and is commonly used in classification and regression problems. It comprises multiple layers of nodes consisting of an input layer, one or more hidden layers, and an output layer [48]. The number of hidden layers is largely dependent upon the task to be achieved. The activation of hidden layers is determined by the input layer and the weights between the input and hidden layers. Similarly, the activation of the output layer is determined by the hidden layers and the weights between them [23]. The functions of an ANN are determined by the neuron activation function, the structure of the neuron pattern, and the learning process [13]. There are three types of learning methods in ANN: supervised, unsupervised, and reinforced learning. Recently, ANN modelling has shown the potential to model nonlinear complex food engineering processes that are difficult to solve using traditional approaches [49]. Several types of ANNs have been used to classify E-nose data and food processing models. These include learning vector quantization (LVQ), Kohonen networks, multi-layer perceptron (MLP), feed-forward backpropagation neural network (FFBPNN), convolutional neural network (CNN), and long short-term memory (LSTM) network, recurrent neural networks (RNNs), generative adversarial network (GAN), restricted Boltzmann machine (RBM), and deep Boltzmann machine (DBM) [13,49].

3.2.3. Convolutional Neural Network (CNN)

CNN is a type of deep neural network like ANN that is a purely supervised learning algorithm and is primarily applied for image recognition [13,49]. In brief, the image data (such as RGB value and intensity) pass through a certain series of convolutional layers that include filters (core or neurons), pooling layers, and fully connected layers before generating the output. The filters apply convolutional operations to the input image data and extract high-level features such as edges from the input image. The pooling layers then reduce the size of the image using the two common pooling methods, namely average pooling and maximum pooling. Following the above process steps, the data are finally fed to the fully connected layers, i.e., ANN, to perform classification [13]. In contrast to traditional feature-based pattern recognition methods, CNN performs feature extraction and selection automatically, hence the preprocessing of input data is not required. Recently, CNN combined with E-nose has been identified as a useful tool in food and beverage analysis, especially for the classification of liquors [23].

3.2.4. Decision Trees (DT) and Random Forest (RF)

A DT builds regression or classification models in the form of a tree-like architecture. DT organizes the dataset progressively into smaller homogeneous subsets (sub-populations), while also generating an associated tree graph. The internal nodes represent the dataset features, branches represent decision rules, and leaf nodes represent the classification outcome [46,48]. The most common learning algorithms in this classification are regression and classification trees, the iterative dichotomizer, and the chi-square automatic interaction detector [48].
An RF is a combination of tree (decision) predictors, widely used as a predictor and classifier for E-nose analysis. The value of a random vector determines a single tree predictor individually as well as for the other trees with the same distribution [35,46]. This algorithm basically employs the rules to binary split data. The main rules used to binary split data in classification problems are the towing rule, Gini index, and deviance, among which the Gini index is the most commonly used [50]. Aside from high predictive performance, RF analysis may indicate feature importance, revealing the contribution of each feature to predictors and thus allowing a quantifiable comparison of different structural features [51].

3.2.5. Support Vector Machine (SVM)

A SVM is a supervised learning algorithm that can be extensively employed for statistical regression and classification analysis [52]. It is based on a method for finding a particular type of linear model known as the maximum-margin hyperplane. In order to visualize the maximum-margin hyperplane, consider a two-class dataset whose classes are linearly separable, which means that a hyperplane in the input space correctly classifies all training instances [53]. After being transformed by a nonlinear function, i.e., kernel function, the algorithm process enables SVM to fit the n-dimensional feature space into a K-dimensional hyperplane (K > n) [35]. SVM algorithms are frequently used in E-Nose related applications [23]. Commonly used SVM algorithms include successive projection algorithm-support vector machine, support vector regression, and least squares support vector machine [48].

4. Applications of E-Nose in Tea Quality Evaluation

In the tea industry, tea quality management is considered a critical responsibility. As a result, tea quality and nutrition throughout tea processing must be analyzed so as to maintain the top quality of marketed tea products. However, due to the high cost of tea items, adulteration is common, resulting in a flood of tea products bearing false brand names in the market and unscrupulous vendors profiting from the awful fakes. As a result, distinguishing between genuine and counterfeit products is difficult [54]. According to numerous reports, E-nose is a potential technology for monitoring the authenticity of food products [21]. Table 3 summarizes a set of E-noses utilized in combination with various pattern recognition algorithms to assess the quality of varied tea types from the last 10 years. E-nose devices were employed to categorize and differentiate different tea types according to their origins, quality grades, adulteration degree based on the mix ratios, and drying processes, and to monitor the smell variation of fermentation (Table 3).
Several E-nose systems have been developed to distinguish different teas in terms of authenticity, discrimination, and quality assessment. For example, instead of human sensory analysis, the scientists developed an E-nose system consisting of eight MOS gas sensors to distinguish green tea quality. A PCA was conducted for feature extraction. Non-linear classification approaches, such as KNN, ANN, and SVM, were applied to build discriminative models. The results demonstrated that the E-nose technique, coupled with the SVM model, showed better discrimination for green tea quality when compared to the other models [9]. Furthermore, a rapid detection method using both E-nose and computer vision system (CVS) was developed for the identification of Longjing tea quality grades. The feature and decision-level strategies, namely, PCA, KNN, SVM, and MLR, were introduced for classification modelling. Based on a decision-level fusion strategy, the SVM classification results combining both E-nose and CVS showed great performance, i.e., 100% for both training and testing sets. This study highlighted the usage of E-nose and CVS in combination with a decision-level fusion algorithm as a quick tea quality detection tool [38]. In another investigation [8], a multi-level fusion strategy was proposed using both E-nose and E-tongue for evaluating four grade levels of Longjing tea. Two distinct features, namely, frequency-domain and time-domain based features, were extracted from sensor responses of both E-nose and E-tongue. The merged features were analyzed for feature selection using non-linear kernel linear discriminant analysis (KLDA), a dimensionality reduction algorithm. The results obtained by the KNN classifier from both the systems were fused, providing an efficient decision fusion algorithm. Using a multi-level fusion system, the KLDA-KNN model showed better classification ability for most of the graded tea samples, with improved recognition accuracy. As a result, this work provided a framework for combining features and decisions, which is critical to consider for better identification of tea quality. Dai et al. [55] introduced a feature fusion method to study the quality classification of four grades of Xihu-Longjing tea, via E-nose. They found that non-linear kernel-based algorithms (KPCA and KLDA) showed better classification results than linear algorithms (PCA and LDA). The fused features yielded a 100% identification rate with the KLDA-KNN model, compared to single features. This analysis revealed the superiority of fused features in reflecting signal properties, indicating that E-nose could be utilized to successfully classify Xihu-Longjing tea grades.
The quality evaluation and origin identification of chrysanthemum flower teas are essential to promote their consumption globally. In this regard, a combination of GC-MS and E-nose was used to categorize 15 chrysanthemum flower teas from five different origins. The PCA for volatile profiles accounted for 86.82% of total variance, separating the teas into five groups. These agreed with GC-MS results, demonstrating the effectiveness of E-nose in the quality control of chrysanthemum flower teas [5]. Ye et al. [56] developed a rapid discrimination method for Pu-erh tea types as an alternative to sensory analysis. They successfully applied the E-nose system coupled with PCA to identify raw Pu-erh tea from matured ones. This study contributed to preventing counterfeit problems associated with the quality and economic significance of ripened Pu-erh teas. Yuan et al. [7] demonstrated that E-nose coupled with PCA and LDA could be rapidly applied to categorize the tea products, i.e., varied storage periods of Pu-erh tea and various priced Xi-hu Longjing tea samples. Using E-nose, the authors identified specific aroma characteristics for wet and dry samples of Pu-erh tea and Xi-hu Longjing tea. More interestingly, alcohols, methane, and nitrogen oxides are regarded as key components that add to the aromas of different priced Xi-hu Longjing teas, whereas amines, nitrogen oxides, and aromatic compounds contribute to the aromas of Pu-erh teas with varying storage years. Hidayat et al. [10] studied the in situ ability of E-nose to differentiate between different black tea quality levels using feature extraction (PCA) and classification models (LDA, QDA (quadratic discriminant analysis), SVM-linear, SVM-radial). The results showed that E-nose with the SVM-linear model was the most accurate, allowing 100% correct recognition rates for the tea samples according to quality levels.
Tea polyphenols, amino acids, and caffeine are responsible for forming the astringency and bitterness of tea. Even though many methods have been developed to evaluate tea’s taste, this task has always been challenging. In this regard, a rapid and feasible method was established using E-nose and mathematical modelling to identify the bitterness and astringent taste of green tea samples. The findings revealed that the BPNN model was more reliable than the PLSR and MLR models in examining the bitterness and astringency of tea infusions [57]. Yang et al. [3] used E-nose and hyperspectral imaging (HSI) focused on the fusion features method to estimate polyphenols of cross-category tea (e.g., yellow tea, green tea, and black tea). Three models, namely grid support vector regression (Grid-SVR), extreme gradient boosting (XGBoost), and random forest (RF), were constructed. SVR is a dimensionally transformed linear regression. The values of the SVR parameters greatly influence the SVR evaluation performance, and a grid algorithm is used to enhance the model’s accuracy. XGBoost is a lifting tree-based integrated method that improves weak learners’ integrated tree approach by using the gradient descent architecture (typically a classification and regression tree). It was demonstrated that fusion features were more accurate than single sensor features. Additionally, the XGBoost (R2 = 0.998 and adjusted R2 = 0.995 for calibration, R2 = 0.90 and adjusted R2 = 0.75 for validation) model showed the best performance among other models, providing a technical basis for quantitative measurement of the tea polyphenol content of cross-category tea. Xuemei et al. [58] studied E-nose to assess the aromas of Pu-erh tea from 10 different storage periods. However, PCA was effective in discriminating the aromas between infused leaves, tea infusions, and dry tea samples, while LDA successfully discriminated dry tea and tea infusion aromas. This approach could be practically implemented for building the aroma fingerprint profiles for the identification of teas based on their storage years. Furthermore, to investigate bio-inspired flavor evaluation of herbal tea, Zakaria et al. [18] introduced a data fusion method using both E-nose and E-tongue with four classification approaches (LDA, SVM, KNN, and probabilistic neural network (PNN)). They found that the KNN classifier performed best for assigning tea samples according to different types, brands, and concentrations, while PNN outshined the other classifiers for flavor masking agents.
Similarly, Xu et al. [59] conducted an investigation into the usage of E-nose and a visible/near-infrared spectrometer to provide a fast and intelligent detection method for the type, blended ratio, and mixed ratio of Pu’er tea. The results of the PLSR and LDA analyses revealed that CNN had better detection capability, acquiring more local features compared to the traditional method of feature extraction. In another study, characterization and quality assessment of different grades of organic green tea were carried out by Liu et al. [60] via electronic nose. For the classification task, all three models (RF, SVM, and MBPNN) displayed outstanding performance. For the regression task, MBPNN displayed the best performance among SVR and kernel ridge regression (KRR). According to this study, MBPNN was capable of classifying and grading the teas as well as predicting their prices. Wang et al. [61] analyzed the variations in aroma characteristics of several Jasmine tea grade samples with E-nose. The E-nose results, along with PCA and HCA, demonstrated that E-nose was effective at differentiating tea grade differences caused by volatile organic compound (VOC) concentrations. Since then, one of China’s most valuable teas, Xihu Longjing (XHLJ), has been adulterated with some low-quality teas and sold on the market. In this regard, Wang et al. [62] investigated XHLJ tea samples to detect their geographical indications using E-nose. The experimental findings demonstrated that the TrLightGBM model outperformed the other five models (RF, SVM, XGBoost, LightGBM, and BPNN) in terms of identifying different harvesting times and producing areas.
Processing technology is crucial in providing the distinctive flavor of black tea, including withering, rolling, fermentation, and drying processes. Yang et al. [63] employed E-nose to examine the volatile profile of Congou black tea, as well as the changes in the aroma features across the different variable-temperature final firing processes. The applied PLS-DA clearly differentiated the tea samples by different drying conditions. Likewise, categorization and prediction of green tea were performed by Wang et al. [64] using fusion approaches combining E-nose and E-tongue. The PCA and DFA separated the different grades of tea samples. The PLSR findings showed that the integrated use of E-nose and E-tongue was more efficient compared to their separated usage for the prediction of flavor and volatile compounds. According to Yang et al. [65], at present, the evaluation of Pu-erh tea’s quality is totally dependent upon human sensory perception. However, they successfully conducted a fast characterization of the volatile compounds in Pu-erh tea using E-nose and the orthogonal partial least squares discriminant analysis (OPLS-DA) model, providing an important basis of reference for quality monitoring of Pu-erh tea. Another quality evaluation of different Longjing tea grades was conducted by Xu et al. [1] by applying E-nose. The outcomes revealed that LDA outperformed PCA and multi-dimensional scaling (MDS) in both SVM and logistic regression (LR) models. Moreover, LDA-SVM accounted for 100% of the recognition rate.
In the literature, investigations into the aroma profiles and quality parameters of herbal teas, especially mulberry teas, are scarce. In this context, a study was undertaken to characterize the volatile profiles for quality assessment of mulberry leaf teas using a rapid and non-destructive E-nose technology. The experimental results showed that PCA and LDA successfully separated three mulberry cultivars into their respective groups based on their volatile profiles. Overall, Buriram 60 (BR) samples presented clear separation from Khunphai (KP) and Sakonnakhon (SK) samples [66]. On the other hand, pesticide residues in tea have been a long-time concern in the tea quality assessment process, as they pose health hazards even at extremely low levels. To determine chlorpyrifos (CPS) pesticide residues in green tea, Sanaeifar et al. [67] developed a data fusion approach combining confocal Raman micro spectroscopy (CRM) and E-nose. The merged E-nose and CRM responses improved the prediction model’s performance. It is also important to note that the developed PLS, SVM, and ANN models performed admirably well in prediction analyses. However, for both individual and fusion datasets, the ANN model predicted the CPS residues most effectively. This study suggests an alternate method for quick and safe control of pesticide residues in tea. Likewise, Yan et al. [68] employed E-nose to examine the fragrance chemical components and differences between Fuyun 6 and Jinguanyin black teas produced from two tea cultivars. The applied PCA and HCA achieved good differentiation of the two tea cultivars. Additionally, the OPLS-DA model proved to be reliable, indicating that four sensors, namely S2 (sulfide and hydrogen sulfide), S6 (biogas, hydrocarbons, and methane), S7 (combustible gases), and S10 (combustible gases and alkanes), contributed the most to discriminating between the two cultivars. Additionally, LDA achieved a 100% correct classification rate for species discrimination. Similarly, Yang et al. [69] studied the changes in green tea samples dried at various temperatures and times with gas phase E-nose (GC-E-nose). The results indicated the validity of the PLS-DA model, thus differentiating the drying process into three clusters. The PCA also clearly distinguished the samples by varying drying temperatures. Further, Chen et al. [70] investigated the quality assessment of Dianhong black tea (DBT) infusions with GC-E-nose. The findings revealed that PLS-DA (78.6%) had a lower prediction accuracy rate than Fisher discriminant analysis (FDA; 95.2%). In addition, stepwise-MLR also successfully predicted the fragrance quality score of tea infusions.
To assure that E-nose could be successfully employed in tea factories, Tseng et al. [71] investigated the variation in smell of Oolong tea leaves at various steps of the manufacturing process. The LDA categorized the smell into three groups (before the first shaking (BS1), before the shaking group, and after the shaking group). The E-nose finding was similar to that of tea practitioners, implying that the E-nose possesses the potential to eventually replace human sensory perception. In another study on tea quality control, Wang et al. [72] proposed a feature reduction method coupled with SVM to improve quality detection performance for Shucheng Xiaolanhua tea using E-nose. The grey wolf optimization-support vector machine (GWO-SVM) classification performance for variable importance of projection-kernel entropy component analysis (VIP-KECA) achieved a 98% accuracy rate. This study suggested the usage of the feature reduction method to enhance the performance ability of E-nose, which might be a useful tool for tracking tea quality.

5. Challenges and Future Perspectives

The E-nose device, resembling the human olfactory system, is a well-studied area of research for classifying volatile aromas in non-alcoholic beverages such as tea. The results using the traditional method for tea evaluation always vary and are inconsistent due to the psychological parameters of tasters and a lack of pre-defined standard protocols. However, defined odor characteristics are necessary to assess the quality of tea, which could be possible using E-nose technology. The various gas sensors used in E-nose are extremely sensitive to vapor concentration, temperature, moisture, pressure, and gas velocity, which poses a substantial challenge to, and effect on, the detection of targets. E-nose assessment requires systematic control of sample preparation and sampling conditions with high repeatability and precision [73]. Other challenges include its inability to understand the target gas and the identification of a specific chemical compound aroma. The E-nose device’s detection levels and accuracies are still lacking, and more research is required. Even though there are numerous types of odor sensors, their applications are limited, necessitating the development of novel odor sensors. Furthermore, developing new pattern recognition algorithms will aid in the acquisition of more accurate detection results. However, in the future, the integration and development of emerging E-nose hardware and data processing techniques will be decisive steps for improving detection accuracy, enhanced recognition, and decision-making processes for agricultural and food products [74].
Similarly, the advancements in new sensing materials with greater sensitivity and accuracy for detecting specific volatile substances might minimize the sample handling process and reduce its environmental impact. Although there is no commercial E-nose available to analyze all volatile components in food materials, experts are demanding this type of application. The use of nano gas sensors in combination with many gas sensors can improve the capability of E-nose to differentiate distinct odors. Another development for E-nose is the employment of artificial intelligence and big data. For instance, a smart interface is required for a collaborative online library that collects data from users around the world via standardized E-noses. In short, E-noses will have more widespread applications and be more user-friendly, smaller in size, and invariant in monitoring the environment [13].
In the future, commercial E-nose devices with optimal settings will be required to improve the capability for identification of volatile compounds and minimize errors in food analysis. The continuous growth in demand for E-noses in numerous industrial applications requires the integration of multi-function features of E-noses with maximum usage. Existing nanotechnology will play a vital role in developing hybrid E-noses and could expand the potential applications for E-noses for real-time analysis of volatile substances in the food industry, such as early detection of food quality, particularly for food control and human consumption [75]. In this context, researchers should focus on developing appropriate approaches to integrate E-nose applications in order to certify real-time analysis and production practices in situ.

6. Conclusions

This review revealed advancements in the application of E-noses in the tea sector. The E-nose instrumentation and working principles were introduced, and different types of gas sensors employed in E-noses were discussed. The commonly employed statistical and intelligent pattern recognition algorithms, such as LDA, PLS-DA, KNN, ANN, CNN, and SVM, in the literature for different tea evaluations were also discussed in detail. Overall, this review demonstrates the potential application of E-noses coupled with pattern recognition methods as a powerful non-destructive tool for monitoring tea quality. However, the relatively poor repeatability and comparability of E-nose measurements, as well as data processing, are remaining challenges that must be addressed. As discussed in this review, the continuous use of E-noses will undoubtedly contribute to reducing the technology’s shortcomings. As a result, the future trend will be marked by growth in demand for the utilization of advanced E-noses with improved detection accuracy and consistency, employed for food quality testing.

Author Contributions

Conceptualization, S.K. and H.-H.C.; methodology, S.K.; writing—original draft preparation, S.K., P.N. and D.R.; writing—review and editing, S.K. and H.-H.C.; supervision, H.-H.C.; project administration, H.-H.C. All authors have read and agreed to the published version of the manuscript.

Funding

This research received no external funding.

Institutional Review Board Statement

Not applicable.

Informed Consent Statement

Not applicable.

Data Availability Statement

The data supporting the reported results can be found in publicly available databases, as specified in the manuscript.

Acknowledgments

The authors are grateful to the MOE Taiwan for the Scholarship.

Conflicts of Interest

The authors declare no conflict of interest.

References

  1. Xu, M.; Wang, J.; Zhu, L. Tea quality evaluation by applying E-nose combined with chemometrics methods. J. Food Sci. Technol. 2021, 58, 1549–1561. [Google Scholar] [CrossRef]
  2. Xu, M.; Wang, J.; Zhu, L. The qualitative and quantitative assessment of tea quality based on E-nose, E-tongue and E-eye combined with chemometrics. Food Chem. 2019, 289, 482–489. [Google Scholar] [CrossRef]
  3. Yang, B.; Qi, L.; Wang, M.; Hussain, S.; Wang, H.; Wang, B.; Ning, J. Cross-category tea polyphenols evaluation model based on feature fusion of electronic nose and hyperspectral imagery. Sensors 2020, 20, 50. [Google Scholar] [CrossRef]
  4. Industry Research. Global Tea Market Size-Share, Industry Demand [2022–2027]|Type (Green Tea, Black Tea, Oolong Tea, Dark Tea, Other), Growing at a CAGR of 6.4%, Leading Players Updates, Emerging Trends, Investment Opportunities and Revenue Expectation. 2022. Available online: https://www.globenewswire.com/en/news-release/2022/03/24/2409291/0/en/Global-Tea-Market-Size-Share-Industry-Demand-2022-2027-Type-Green-Tea-Black-Tea-Oolong-Tea-Dark-Tea-Other-Growing-at-a-CAGR-of-6-4-Leading-Players-Updates-Emerging-Trends-Investmen.html (accessed on 12 May 2022).
  5. Luo, D.; Chen, J.; Gao, L.; Liu, Y.; Wu, J. Geographical origin identification and quality control of Chinese chrysanthemum flower teas using gas chromatography–mass spectrometry and olfactometry and electronic nose combined with principal component analysis. Int. J. Food Sci. Technol. 2017, 52, 714–723. [Google Scholar] [CrossRef]
  6. Liang, S.; Granato, D.; Zou, C.; Gao, Y.; Zhu, Y.; Zhang, L.; Yin, J.-F.; Zhou, W.; Xu, Y.-Q. Processing technologies for manufacturing tea beverages: From traditional to advanced hybrid processes. Trends Food Sci. Technol. 2021, 118, 431–446. [Google Scholar] [CrossRef]
  7. Yuan, H.; Chen, X.; Shao, Y.; Cheng, Y.; Yang, Y.; Zhang, M.; Hua, J.; Li, J.; Deng, Y.; Wang, J.; et al. Quality evaluation of green and dark tea grade using electronic nose and multivariate statistical analysis. J. Food Sci. 2019, 84, 3411–3417. [Google Scholar] [CrossRef]
  8. Zhi, R.; Zhao, L.; Zhang, D. A framework for the multi-level fusion of electronic nose and electronic tongue for tea quality assessment. Sensors 2017, 17, 1007. [Google Scholar] [CrossRef]
  9. Chen, Q.; Zhao, J.; Chen, Z.; Lin, H.; Zhao, D.-A. Discrimination of green tea quality using the electronic nose technique and the human panel test, comparison of linear and nonlinear classification tools. Sens. Actuators B Chem. 2011, 159, 294–300. [Google Scholar] [CrossRef]
  10. Hidayat, S.N.; Triyana, K.; Fauzan, I.; Julian, T.; Lelono, D.; Yusuf, Y.; Ngadiman, N.; Veloso, A.C.A.; Peres, A.M. The electronic nose coupled with chemometric tools for discriminating the quality of black tea samples in situ. Chemosensors 2019, 7, 29. [Google Scholar] [CrossRef]
  11. Chen, L.-Y.; Wu, C.-C.; Chou, T.-I.; Chiu, S.-W.; Tang, K.-T. Development of a dual MOS electronic nose/camera system for improving fruit ripeness classification. Sensors 2018, 18, 3256. [Google Scholar] [CrossRef] [Green Version]
  12. Kiani, S.; Minaei, S.; Ghasemi-Varnamkhasti, M. Application of electronic nose systems for assessing quality of medicinal and aromatic plant products: A review. J. Appl. Res. Med. Aromat. Plants 2016, 3, 1–9. [Google Scholar] [CrossRef]
  13. Tan, J.; Xu, J. Applications of electronic nose (e-nose) and electronic tongue (e-tongue) in food quality-related properties determination: A review. Artif. Intell. Agric. 2020, 4, 104–115. [Google Scholar] [CrossRef]
  14. Zhou, H.; Luo, D.; GholamHosseini, H.; Li, Z.; He, J. Identification of chinese herbal medicines with electronic nose technology: Applications and challenges. Sensors 2017, 17, 1073. [Google Scholar] [CrossRef] [PubMed]
  15. Loutfi, A.; Coradeschi, S.; Mani, G.K.; Shankar, P.; Rayappan, J.B.B. Electronic noses for food quality: A review. J. Food Eng. 2015, 144, 103–111. [Google Scholar] [CrossRef]
  16. Bhattacharya, N.; Tudu, B.; Jana, A.; Ghosh, D.; Bandhopadhyaya, R.; Saha, A.B. Illumination heating and physical raking for increasing sensitivity of electronic nose measurements with black tea. Sens. Actuators B Chem. 2008, 131, 37–42. [Google Scholar] [CrossRef]
  17. Deshmukh, S.; Bandyopadhyay, R.; Bhattacharyya, N.; Pandey, R.A.; Jana, A. Application of electronic nose for industrial odors and gaseous emissions measurement and monitoring–An overview. Talanta 2015, 144, 329–340. [Google Scholar] [CrossRef]
  18. Zakaria, N.Z.I.; Masnan, M.J.; Zakaria, A.; Shakaff, A.Y.M. A bio-inspired herbal tea flavour assessment technique. Sensors 2014, 14, 12233–12255. [Google Scholar] [CrossRef]
  19. Berna, A. Metal oxide sensors for electronic noses and their application to food analysis. Sensors 2010, 10, 3882–3910. [Google Scholar] [CrossRef]
  20. Gharibzahedi, S.M.T.; Barba, F.J.; Zhou, J.; Wang, M.; Altintas, Z. Electronic sensor technologies in monitoring quality of tea: A review. Biosensors 2022, 12, 356. [Google Scholar] [CrossRef]
  21. Gliszczyńska-Świgło, A.; Chmielewski, J. Electronic nose as a tool for monitoring the authenticity of food. A review. Food Anal. Methods 2017, 10, 1800–1816. [Google Scholar] [CrossRef] [Green Version]
  22. Wilson, A.D.; Baietto, M. Applications and advances in electronic-nose technologies. Sensors 2009, 9, 5099–5148. [Google Scholar] [CrossRef] [PubMed]
  23. Karakaya, D.; Ulucan, O.; Turkan, M. Electronic nose and its applications: A survey. Int. J. Autom. Comput. 2020, 17, 179–209. [Google Scholar] [CrossRef]
  24. James, D.; Scott, S.M.; Ali, Z.; O’Hare, W.T. Chemical sensors for electronic nose systems. Microchim. Acta 2005, 149, 1–17. [Google Scholar] [CrossRef]
  25. Wojnowski, W.; Majchrzak, T.; Dymerski, T.; Gębicki, J.; Namieśnik, J. Portable electronic nose based on electrochemical sensors for food quality assessment. Sensors 2017, 17, 2715. [Google Scholar] [CrossRef] [PubMed]
  26. Stetter, J.R.; Penrose, W.R.; Yao, S. Sensors, chemical sensors, electrochemical sensors, and ECS. J. Electrochem. Soc. 2003, 150, S11–S16. [Google Scholar] [CrossRef]
  27. Esfahani, S.; Tiele, A.; Agbroko, S.O.; Covington, J.A. Development of a tuneable NDIR optical electronic nose. Sensors 2020, 20, 6875. [Google Scholar] [CrossRef]
  28. Han, F.; Huang, X.; Aheto, J.H.; Zhang, D.; Feng, F. Detection of beef adulterated with pork using a low-cost electronic nose based on colorimetric sensors. Foods 2020, 9, 193. [Google Scholar] [CrossRef]
  29. Han, A.; Hao, S.; Yang, Y.; Li, X.; Luo, X.; Fang, G.; Liu, J.; Wang, S. Perspective on recent developments of nanomaterial based fluorescent sensors: Applications in safety and quality control of food and beverages. J. Food Drug Anal. 2020, 28, 486–508. [Google Scholar] [CrossRef]
  30. Sharmilan, T.; Premarathne, I.; Wanniarachchi, I.; Kumari, S.; Wanniarachchi, D. Electronic nose technologies in monitoring black tea manufacturing process. J. Sens. 2020, 2020, 3073104. [Google Scholar] [CrossRef]
  31. Rahman, M.M.; Charoenlarpnopparut, C.; Suksompong, P. Classification and pattern recognition algorithms applied to E-Nose. In Proceedings of the 2015 2nd International Conference on Electrical Information and Communication Technologies EICT, Khulna, Bangladesh, 10–12 December 2015; pp. 44–48. [Google Scholar]
  32. Goseva-Popstojanova, K.; Tyo, J. Identification of security related bug reports via text mining using supervised and unsupervised classification. In Proceedings of the IEEE International Conference on Software Quality, Reliability and Security, Lisbon, Portugal, 16–20 July 2018; pp. 344–355. [Google Scholar]
  33. Rahman, M.M.; Charoenlarpnopparut, C.; Suksompong, P. Signal processing for multi-sensor E-nose system: Acquisition and classification. In Proceedings of the 10th International Conference on Information, Communications and Signal Processing ICICS, Singapore, 2–4 December 2015; pp. 1–5. [Google Scholar]
  34. Balas, V.E.; Solanki, V.K.; Kumar, R. An Industrial IoT Approach for Pharmaceutical Industry Growth: Volume 2; Academic Press: Cambridge, MA, USA, 2020. [Google Scholar]
  35. Qiu, S.; Wang, J. The prediction of food additives in the fruit juice based on electronic nose with chemometrics. Food Chem. 2017, 230, 208–214. [Google Scholar] [CrossRef]
  36. Granato, D.; Santos, J.S.; Escher, G.B.; Ferreira, B.L.; Maggio, R.M. Use of principal component analysis (PCA) and hierarchical cluster analysis (HCA) for multivariate association between bioactive compounds and functional properties in foods: A critical perspective. Trends Food Sci. Technol. 2018, 72, 83–90. [Google Scholar] [CrossRef]
  37. Ali, A.; Lee, J.-I. A Study on consumption and consumer preference for halal meat among Pakistani community in South Korea. J. Korean Soc. Int. Agric. 2019, 31, 1–7. [Google Scholar] [CrossRef]
  38. Xu, M.; Wang, J.; Gu, S. Rapid identification of tea quality by E-nose and computer vision combining with a synergetic data fusion strategy. J. Food Eng. 2019, 241, 10–17. [Google Scholar] [CrossRef]
  39. Bayaga, A. Multinomial logistic regression: Usage and application in risk analysis. J. Appl. Quant. Methods 2010, 5, 288–297. [Google Scholar]
  40. Lee, L.C.; Liong, C.-Y.; Jemain, A.A. Partial least squares-discriminant analysis (PLS-DA) for classification of high-dimensional (HD) data: A review of contemporary practice strategies and knowledge gaps. Analyst 2018, 143, 3526–3539. [Google Scholar] [CrossRef]
  41. Ruiz-Perez, D.; Guan, H.; Madhivanan, P.; Mathee, K.; Narasimhan, G. So you think you can PLS-DA? BMC Bioinform. 2020, 21, 2. [Google Scholar] [CrossRef]
  42. Abdi, H. Partial least squares regression and projection on latent structure regression (PLS Regression). Wiley Interdiscip. Rev. Comput. Stat. 2010, 2, 97–106. [Google Scholar] [CrossRef]
  43. Wold, S.; Sjöström, M.; Eriksson, L. PLS-regression: A basic tool of chemometrics. Chemom. Intell. Lab. Syst. 2001, 58, 109–130. [Google Scholar] [CrossRef]
  44. Ares, G. Cluster analysis: Application in food science and technology. In Mathematical and Statistical Methods in Food Science and Technology, 1st ed.; Granato, D., Ares, G., Eds.; Wiley Blackwell: Oxford, UK, 2014; pp. 103–120. [Google Scholar]
  45. Khollam, P.; Mane, P. Review on food categorization techniques in machine learning. Int. J. Res. Anal. Rev. 2019, 6, 107–111. [Google Scholar]
  46. Zhu, L.; Spachos, P.; Pensini, E.; Plataniotis, K.N. Deep learning and machine vision for food processing: A survey. Curr. Res. Nutr. Food Sci. 2021, 4, 233–249. [Google Scholar] [CrossRef]
  47. Hu, L.-Y.; Huang, M.-W.; Ke, S.-W.; Tsai, C.-F. The distance function effect on k-nearest neighbor classification for medical datasets. SpringerPlus 2016, 5, 1304. [Google Scholar] [CrossRef] [PubMed]
  48. Liakos, K.G.; Busato, P.; Moshou, D.; Pearson, S.; Bochtis, D. Machine learning in agriculture: A Review. Sensors 2018, 18, 2674. [Google Scholar] [CrossRef] [PubMed] [Green Version]
  49. Bhagya Raj, G.V.S.; Dash, K.K. Comprehensive study on applications of artificial neural network in food process modeling. Crit. Rev. Food Sci. Nutr. 2022, 62, 2756–2783. [Google Scholar] [CrossRef] [PubMed]
  50. de Santana, F.B.; Borges Neto, W.; Poppi, R.J. Random forest as one-class classifier and infrared spectroscopy for food adulteration detection. Food Chem. 2019, 293, 323–332. [Google Scholar] [CrossRef]
  51. Lam, K.-L.; Cheng, W.-Y.; Su, Y.; Li, X.; Wu, X.; Wong, K.-H.; Kwan, H.-S.; Cheung, P.C.-K. Use of random forest analysis to quantify the importance of the structural characteristics of beta-glucans for prebiotic development. Food Hydrocoll. 2020, 108, 106001. [Google Scholar] [CrossRef]
  52. Zhu, L.; Spachos, P. Support vector machine and YOLO for a mobile food grading system. Internet Things 2021, 13, 100359. [Google Scholar] [CrossRef]
  53. Barbosa, R.M.; Nelson, D.R. The use of support vector machine to analyze food security in a region of Brazil. Appl. Artif. Intell. 2016, 30, 318–330. [Google Scholar] [CrossRef]
  54. Chen, Q.; Zhang, D.; Pan, W.; Ouyang, Q.; Li, H.; Urmila, K.; Zhao, J. Recent developments of green analytical techniques in analysis of tea’s quality and nutrition. Trends Food Sci. Technol. 2015, 43, 63–82. [Google Scholar] [CrossRef]
  55. Dai, Y.; Zhi, R.; Zhao, L.; Gao, H.; Shi, B.; Wang, H. Longjing tea quality classification by fusion of features collected from E-nose. Chemom. Intell. Lab. Syst. 2015, 144, 63–70. [Google Scholar] [CrossRef]
  56. Ye, J.; Wang, W.; Ho, C.; Li, J.; Guo, X.; Zhao, M.; Jiang, Y.; Tu, P. Differentiation of two types of pu-erh teas by using an electronic nose and ultrasound-assisted extraction-dispersive liquid–liquid microextraction-gas chromatography-mass spectrometry. Anal. Methods 2016, 8, 593–604. [Google Scholar] [CrossRef]
  57. Zou, G.; Xiao, Y.; Wang, M.; Zhang, H. Detection of bitterness and astringency of green tea with different taste by electronic nose and tongue. PLoS ONE 2018, 13, e0206517. [Google Scholar] [CrossRef] [PubMed]
  58. Yang, X.; Liu, Y.; Mu, L.; Wang, W.; Zhan, Q.; Luo, M.; Tian, H.; Lv, C.; Li, J. Discriminant research for identifying aromas of non-fermented Pu-erh tea from different storage years using an electronic nose. J. Food Process. Preserv. 2018, 42, e13721. [Google Scholar] [CrossRef]
  59. Xu, S.; Sun, X.; Lu, H.; Zhang, Q. Detection of type, blended ratio, and mixed ratio of pu’er tea by using electronic nose and visible/near infrared spectrometer. Sensors 2019, 19, 2359. [Google Scholar] [CrossRef] [PubMed]
  60. Liu, H.; Yu, D.; Gu, Y. Classification and evaluation of quality grades of organic green teas using an electronic nose based on machine learning algorithms. IEEE Access 2019, 7, 172965–172973. [Google Scholar] [CrossRef]
  61. Wang, S.; Zhao, F.; Wu, W.; Wang, P.; Ye, N. Comparison of volatiles in different jasmine tea grade samples using electronic nose and automatic thermal desorption-gas chromatography-mass spectrometry followed by multivariate statistical analysis. Molecules 2020, 25, 380. [Google Scholar] [CrossRef]
  62. Wang, X.; Gu, Y.; Liu, H. A transfer learning method for the protection of geographical indication in China using an electronic nose for the identification of Xihu Longjing tea. IEEE Sens. J. 2021, 21, 8065–8077. [Google Scholar] [CrossRef]
  63. Yang, Y.; Hua, J.; Deng, Y.; Jiang, Y.; Qian, M.C.; Wang, J.; Li, J.; Zhang, M.; Dong, C.; Yuan, H. Aroma dynamic characteristics during the process of variable-temperature final firing of Congou black tea by electronic nose and comprehensive two-dimensional gas chromatography coupled to time-of-flight mass spectrometry. Food Res. Int. 2020, 137, 109656. [Google Scholar] [CrossRef]
  64. Wang, J.; Wei, Z. The classification and prediction of green teas by electrochemical response data extraction and fusion approaches based on the combination of e-nose and e-tongue. RSC Adv. 2015, 5, 106959–106970. [Google Scholar] [CrossRef]
  65. Yang, Y.; Rong, Y.; Liu, F.; Jiang, Y.; Deng, Y.; Dong, C.; Yuan, H. Rapid characterization of the volatile profiles in Pu-erh tea by gas phase electronic nose and microchamber/thermal extractor combined with TD-GC-MS. J. Food Sci. 2021, 86, 2358–2373. [Google Scholar] [CrossRef]
  66. Ruengdech, A.; Siripatrawan, U. Visualization of mulberry tea quality using an electronic sensor array, SPME-GC/MS, and sensory evaluation. Food Biosci. 2020, 36, 100593. [Google Scholar] [CrossRef]
  67. Sanaeifar, A.; Li, X.; He, Y.; Huang, Z.; Zhan, Z. A data fusion approach on confocal Raman microspectroscopy and electronic nose for quantitative evaluation of pesticide residue in tea. Biosyst. Eng. 2021, 210, 206–222. [Google Scholar] [CrossRef]
  68. Yan, T.; Lin, J.; Zhu, J.; Ye, N.; Huang, J.; Wang, P.; Jin, S.; Zheng, D.; Yang, J. Aroma analysis of Fuyun 6 and Jinguanyin black tea in the Fu’an area based on E-nose and GC–MS. Eur. Food Res. Technol. 2022, 248, 947–961. [Google Scholar] [CrossRef]
  69. Yang, Y.; Chen, J.; Jiang, Y.; Qian, M.C.; Deng, Y.; Xie, J.; Li, J.; Wang, J.; Dong, C.; Yuan, H. Aroma dynamic characteristics during the drying process of green tea by gas phase electronic nose and gas chromatography-ion mobility spectrometry. LWT 2022, 154, 112691. [Google Scholar] [CrossRef]
  70. Chen, J.; Yang, Y.; Deng, Y.; Liu, Z.; Xie, J.; Shen, S.; Yuan, H.; Jiang, Y. Aroma quality evaluation of Dianhong black tea infusions by the combination of rapid gas phase electronic nose and multivariate statistical analysis. LWT 2022, 153, 112496. [Google Scholar] [CrossRef]
  71. Tseng, T.; Hsiao, M.-H.; Chen, P.-A.; Lin, S.-Y.; Chiu, S.-W.; Yao, D.-J. Utilization of a gas-sensing system to discriminate smell and to monitor fermentation during the manufacture of oolong tea leaves. Micromachines 2021, 12, 93. [Google Scholar] [CrossRef]
  72. Wang, C.; Yang, J.; Wu, J. Feature reduction method coupled with electronic nose for quality control of tea. Sens. Mater. 2021, 33, 2095–2108. [Google Scholar] [CrossRef]
  73. Kiselev, I.; Sysoev, V.; Kaikov, I.; Koronczi, I.; Adil Akai Tegin, R.; Smanalieva, J.; Sommer, M.; Ilicali, C.; Hauptmannl, M. On the temporal stability of analyte recognition with an e-nose based on a metal oxide sensor array in practical applications. Sensors 2018, 18, 550. [Google Scholar] [CrossRef]
  74. Jia, W.; Liang, G.; Jiang, Z.; Wang, J. Advances in electronic nose development for application to agricultural products. Food Anal. Methods 2019, 12, 2226–2240. [Google Scholar] [CrossRef]
  75. Ali, M.M.; Hashim, N.; Abd Aziz, S.; Lasekan, O. Principles and recent advances in electronic nose for quality inspection of agricultural and food products. Trends Food Sci. Technol. 2020, 99, 1–10. [Google Scholar]
Figure 1. A schematic representation of the E-nose system.
Agriculture 12 01359 g001
Figure 2. Illustration representing the analogy between human olfaction and artificial olfaction.
Agriculture 12 01359 g002
Table 1. Different types of sensors utilized in the design of E-noses and their sensing mechanisms.
Sensor TypeDescriptionReference
Metal Oxide Semiconductor (MOS) SensorsMOS sensors are the most widely used sensors in the beverage and food industries. These detect the target volatile gas molecules via oxidation–reduction reactions between the gas molecules and the chemisorbed oxygen species on their sensing material surfaces. These types of sensors offer the advantages of high sensitivity towards hydrogen and unsaturated hydrocarbons or solvent vapors containing hydrogen atoms, stability over time, fast response, and ease of use. The main disadvantage is the requirement to operate at a high temperature (150–400 °C), which leads to considerable energy usage.[13,21]
Conducting Polymer (CP) SensorsCP sensors are the second most widely used gas sensors in the food industry after MOS sensors. Their working principle is based on the changes in electrical resistance due to the adsorption of volatile gases on the sensing surface. These offer high sensitivity to detect volatile gas molecules, fast response times, and less energy consumption. The main disadvantage is their high susceptibility to environmental humidity.[13,22]
Surface Acoustic Wave (SAW) SensorsSAW sensors are utilized in the food industry for the rapid detection of spoilage and pathogens in food. These types of sensors use acoustic (mechanical) waves that are transmitted through the sensing surface on the sorption of volatile molecules. As a result, changes in velocity or amplitude occur. These types of sensors offer high sensitivity, fast response, and good precision. However, they have poor signal-to-noise ratios and are affected by humidity.[13,22,23]
Metal Oxide Semiconductor Field Effect Transistors (MOSFETs)MOSFETs have been utilized in a variety of food-related analyses, such as food cooking, production of juice, and fermentation. Any reaction of volatile gas molecules changes the insulator properties or metal gate, which alters the electrical properties of the MOSFET sensors, resulting in a change in the drain current. High sensitivity, low susceptibility to humidity, and small sensor size are the advantages of MOSFETs. However, they require environmental control, show baseline drift, and have low sensitivity to carbon dioxide and ammonia.[12,22,24]
Electrochemical (EC) SensorsEC sensors work on the principle of interaction between the volatile gaseous molecules of interest and the sensing materials that generate the electrical signals. In other words, EC sensors work on the amperometry principle, which generates current signals that are related to analyte concentration by Faraday’s law and the laws of mass transport. These sensors require low power consumption and are resistant to changes in relative humidity. However, they do offer a limitation of cross-sensitivity to some of the volatile compounds in the samples.[22,25,26]
Optical SensorsOptical sensors are based on the measurement of light modulation characteristics, such as changes in wavelength, color, and light absorbance, upon interaction with gaseous molecules. The advantages include high signal-to-noise ratios and less power consumption. Contrarily, these sensors offer less adaptability to the environment and lower accuracy levels for long-distance measurements.[14,22,27]
Colorimetric SensorsCalorimetric sensors are used in the meat industry to monitor the freshness and spoilage of meat. The detection principle of these sensors is based on color change and absorbance upon interactions between the volatile gaseous molecules and chromogenic materials. These are highly specific to oxidized volatile compounds and give rapid response. However, they require a high operating temperature and provide sensitivity only to oxygen-containing volatile compounds.[22,28]
Fluorescence SensorsFluorescence sensors are employed for detection of food contaminants. These sensors are based on the detection of fluorescent light emissions from the target gaseous molecules at a lower wavelength.[22,29]
Table 2. List of MOS sensors in E-noses and their target gas sensitivity.
Sensor NumberTarget Gas
S1Aromatic compounds
S2Nitrogen oxides
S3Ammonia
S4Hydrogen
S5Alkenes, less polar compounds, and aromatic compounds
S6Methane broad range
S7Sulphur compounds
S8Alcohols and partially aromatic compounds
S9Sulphur organic compounds and aromatic compounds
S10High concentrations
Adapted from Zakaria et al. [18] and distributed under the terms and conditions of the Creative Commons Attribution (CC BY) license.
Table 3. Description of various E-nose configurations and pattern recognition methods used for tea quality evaluation.
S. No.Tea VarietyPurpose of AnalysisE-Nose ConfigurationPattern Recognition MethodsReferences
1Chaoqing Green TeaTo differentiate green teas according to its qualityE-nose system (developed by Agricultural Product Processing and Storage Laboratory, Jiangsu University, Zhenjiang, China) with 8 TGS gas sensors (Figaro Co., Ltd., Osaka, Japan)PCA, SVM, KNN, and ANN[9]
2Longjing TeaTo detect tea aroma for tea quality identificationPEN3 (Airsense Analytics, Schwerin, Germany) with 10 MOS sensorsPCA, KNN, SVM and MLR[38]
3Longjing TeaTo develop a multi-level fusion framework for enhancing tea quality prediction accuracyFox 4000 (Alpha M.O.S., Co., Toulouse, France) with 18 MOS sensorsK(LDA), KNN[8]
4Xihu-Longjing TeaTo classify the grades of tea based on the feature fusion methodFox 4000 (Alpha MOS Company, Toulouse, France) with 18 MOS sensorsK(PCA), K(LDA), KNN[55]
5Chinese Chrysanthemum TeaTo differentiate the aroma profiles of teas from different geographical originsGC Flash E-nose (Alpha M.O.S. Heracles, Toulouse, France)PCA[5]
6Pu-erh TeaTo perform classification of two types of teas based on the volatile componentsFox-3000 (Alpha MOS, Toulouse, France) with 12 MOS sensorsPCA[56]
7Green and Dark TeaTo assess the quality of tea gradesPEN3 (Airsense Analytics GmbH, Schwerin, Germany) with 10 gas sensorsPCA, LDA[7]
8Black TeaTo investigate in situ discrimination of the quality of tea samplesLab-made E-nose with 8 MOS sensors (Figaro Engineering Inc., Osaka, Japan)PCA, LDA, QDA, SVM-linear, SVM-radial[10]
9Xinyang Maojian TeaTo evaluate the different tastes of tea samples PEN3 (Win Muster Airsense Analytics Inc., Schwerin, Germany) with 10 MOS sensorsMLR, PLSR, BPNN[57]
10Black Tea, Yellow Tea, and Green TeaTo evaluate polyphenols of cross-category teasPEN3 (Win Muster Air-sense Analytics Inc., Schwerin, Germany) with 10 MOS sensorsRF, Grid-SVR, XGBoost[3]
11Pu-erh TeaTo discriminate between the aroma components of teas from varying storage yearsPEN3 (Airsense, Schwerin, Germany) with 10 MOS sensorsLDA, PCA[58]
12Herbal TeaTo investigate bio-inspired flavor evaluation of teas from different types and brandsPEN3 (Win Muster Airsense Analytics Inc., Schwerin, Germany) with 10 MOS sensorsLDA, SVM, KNN, and PNN[18]
13Pu’er TeaTo devise a rapid method for determining the type, blended as well as mixed ratios of teaPEN 3 (Airsense Inc., Schwerin, Germany) with 10 MOS sensorsLDA, CNN, PLSR[59]
14Green TeaTo evaluate the quality grades of different teasPEN3 (Airsense Analytics GmbH, Schwerin, Germany) with 10 MOS sensorsPCA, LDA, RF, SVM, PLSR, KRR, SVR, MBPNN[60]
15Jasmine TeaTo examine the differences in aroma characteristics in different tea gradesISENSO (Shanghai Ongshen Intelligent Technology Co., Ltd., Shanghai, China) with 10 MOS sensorsPCA, HCA[61]
16Xihu Longjing TeaTo detect teas from different geographical indicationsPEN3 (Airsense Analytics GmbH, Schwerin, Germany) with 10 MOS sensorsPCA, SVM, RF, XGBoost, LightGBM, TrLightGBM, BPNN[62]
17Congou Black TeaTo investigate the aroma characteristics of tea during the variable-temperature final firingHeracles II ultra-fast gas phase E-nose (Alpha M.O.S., Toulouse, France)PLS-DA[63]
18Longjing TeaTo determine the different quality grades of green teasPEN2 (Airsense Company, Schwerin, Germany) with 10 MOS sensorsPCA, DFA, PLSR[64]
19Pu-erh TeaTo rapidly characterize the volatile compounds in teaHeracles II gas phase E-nose (Alpha M.O.S., Toulouse, France)OPLS-DA[65]
20Longjing teaTo determine the tea quality of different gradesPEN3 (Airsense Corporation, Schwerin, Germany), with 10 MOS sensorsPCA, MDS, LDA, LR, SVM[1]
21Mulberry TeaTo develop a rapid and non-destructive method for visualizing the volatile profiles of different leaf tea samples of various gradesFox 4000 (Alpha M.O.S., Toulouse, France) with 18 MOS sensorsPCA, LDA[66]
22Green TeaTo propose a multi-technology fusion system based on E-nose to evaluate pesticide residues in teaFox 4000 (ALPHA MOS, Toulouse, France) with 18 MOS sensorsPLS, SVM, ANN[67]
23Fuyun 6 and Jinguanyin Black TeaTo investigate the aroma differences of tea produced from two different tea cultivarsE-nose (Shanghai Ongshen Intelligent Technology Co., Ltd., Shanghai, China) with 10 sensorsLDA, PCA, HCA, OPLS-DA[68]
24Green TeaTo investigate the changes in volatile profiles of tea using different drying processesHeracles II gas phase E-nose (Alpha M.O.S., Toulouse, France)PLS-DA, PCA[69]
25Dianhong Black TeaTo investigate the quality of tea infusionsHeracles II fast GC-E-Nose (Alpha M.O.S., Toulouse, France)PLS-DA, FDA[70]
26Oolong TeaTo discriminate between the smell of tea leaves during various stages of manufacturing processE-nose with 12 MOS sensors (Figaro USA, Inc., Arlington Heights, IL, USA and Nissha FIS, Inc., Osaka, Japan)LDA[71]
27Shucheng Xiaolanhua TeaTo enhance the performance of tea quality detectionPEN3 (Airsense Analytics, Schwerin, Germany) with 10 MOS sensorsK(PCA), KECA, SVM[72]
Publisher’s Note: MDPI stays neutral with regard to jurisdictional claims in published maps and institutional affiliations.

