Article

Comparative Analysis of Environmental and Economic Performance of Agricultural Cooperatives and Smallholder Farmers for Apple Production in China

School of Economics and Management, Northwest A&F University, Yangling District, Xianyang 712100, China
*
Author to whom correspondence should be addressed.
Agriculture 2022, 12(8), 1281; https://doi.org/10.3390/agriculture12081281
Submission received: 10 July 2022 / Revised: 1 August 2022 / Accepted: 15 August 2022 / Published: 22 August 2022
(This article belongs to the Section Agricultural Economics, Policies and Rural Management)

Abstract

:
China is the world’s largest apple producer, and agricultural cooperatives play an important role in promoting sustainable production in its whole life cycle system. However, few studies on cooperatives have evaluated the environmental and economic performance from the life cycle thinking perspective. In this study, the combined methods of life cycle assessment (LCA) and life cycle cost (LCC) were used to comparatively analyze the environmental and economic performance of apple production between cooperatives and smallholder farmers. The results showed that, compared to the smallholder farmers, cooperatives significantly reduced resource depletion and environmental impacts by 12.50–22.16% in each category. The total environmental index for the cooperatives was 7.44% and 22.09% lower than smallholder farmers; meanwhile, the total LCC was 2659.71 Chinese Yuan (CNY), 19.27% lower than smallholder farmers. However, the net profit was 2990.29 CNY for the cooperatives, 21.23% higher than smallholder farmers. The results indicated that cooperatives exhibited a higher net profit while having lower resource input, environmental impact, and LCC than smallholder farmers. Moreover, pesticides and fertilizers were identified as the most critical environmental hotspots. Moreover, human labor cost was the most significant contributor to the total economic cost of the apple production system. These findings provide insights into optimizing farm inputs for apple production and active participation in agricultural cooperatives to alleviate multiple environmental impacts while maintaining apple yield and improving economic benefits, intending to make a marginal contribution to promoting sustainable development of the apple industry in China.

1. Introduction

With the emergence of large farms, agricultural conglomerates, and modern marketing companies, sustainable agricultural production by smallholder farmers in many developing countries faces increasing challenges in accessing modern agricultural inputs, technologies, and markets [1,2,3]. Some of these challenges are manageable, while others are not. For example, lack of adequate knowledge of best farm management practices, limited access to improved farm management technologies, high transaction costs to access input markets, frequent occurrence of pests and diseases, uncertainty in weather conditions, etc. [4,5,6]. These constraints expose farmers to the risk of low agricultural productivity, crop failure, and product quality that struggles to meet consumer market demand. In the long run, this will not only damage farmers’ economic returns but will also put enormous environmental pressure on the entire agricultural production system, ultimately threatening the achievement of sustainable development goals in the field of agricultural production.
To address these challenges, governments in many developing countries have taken steps to promote the formation of collective action groups by smallholder farmers to improve their production and marketing performance [7,8]. The emergence of agricultural cooperatives is widely recognized as an important institutional arrangement that can help overcome the constraints that prevent smallholder farmers in developing countries from taking advantage of agricultural production and marketing opportunities. For example, agricultural cooperatives can enhance farmers’ bargaining power in markets to obtain more competitive prices for inputs and outputs, reduce transaction costs and information asymmetries, and improve safety and quality standards for agricultural products [9,10]. In addition, cooperatives usually promote the adoption of environmentally friendly technologies by farmers through technical training and the development of production standard norms [11,12,13]. All of the above studies show that smallholder farmers who join the cooperative have a positive and beneficial impact on agricultural production. However, few studies have focused on the environmental performance of cooperatives on agricultural production, which means that it is unclear whether and to what extent on differences in environmental impact between cooperatives and smallholder farmers [14].
The availability of more sustainable agricultural products is expected to increase as consumer awareness and sensitivity to environmental protection increase and government environmental regulation initiatives are implemented [15]. In this context, agricultural producers should consider the improvement of the economic benefits of the produced agricultural products, and at the same time, more important is to be concerned about the environmental impacts in producing process. Therefore, quantifying and assessing the environmental and economic performance of different producers in producing essential agricultural products becomes a vital realization issue that needs to be addressed.
China is the largest apple-producing country globally, recording a total production of about 45 million tons in 2021, accounting for more than 50% of the world’s total production. Despite leading the world in apple production volume, China faces constraints on the world markets, with only about 3% of apples produced finding their way into international markets [16]. The main reason for this low percentage is the difficulty in meeting food safety and quality standards, as China has a typical production model with smallholder farmers in agriculture. In this model, smallholder farmers usually have the misconception of more inputs—more outputs due to their own knowledge limitations and therefore use a large amount of agricultural chemicals, such as chemical fertilizers and pesticides, in the apple production process. From an environmental perspective, the high input and unregulated use of chemical fertilizers and pesticides are the main culprits of environmental problems in agricultural production [17,18,19,20,21]. However, it has been shown that apples, as a perennial economic crop, are more dependent on fertilizers and pesticides than cereal crops, thus becoming an important component that hinders the sustainability of the entire agricultural system [19,22,23,24,25,26]. The main reasons include two aspects: on the one hand, a large amount of fertilizer and pesticide inputs in apple production means that the agricultural materials production side needs to produce more products to meet market demand, while industrial processing is an energy- and emission-intensive activity due to the use of large amounts of fossil fuels, diesel, electricity, etc., which results in large greenhouse gas (GHG) emissions [27,28]; on the other hand, in the farming production stage, the heavy use of fertilizers and pesticides can lead to some significant negative impacts on the environment, as evidenced by soil erosion and reduced land fertility, water pollution, air pollution, which even further harm to human health [29,30].
In addition, smallholder farmers in apple production and marketing are severely constrained by high transaction costs and information asymmetries, especially those living in remote areas. So the government in China has made efforts to promote the development of agricultural cooperatives in the apple industry. Production techniques promoted by cooperatives include orchard management practices (e.g., pruning and plucking), effective use of inputs (e.g., fertilizers and pesticides), pest and disease management, and quality control, which can decrease the environmental burden to a certain extent. In addition, cooperatives provide some services by purchasing inputs for their members collectively at reasonable prices to reduce their operating costs and then improve economic returns. However, few studies have focused on the comparative environmental and economic impacts between agricultural cooperatives and smallholder farmers of apple production. Therefore, there is an urgent need for methods to assess the environmental and economic performance of cooperative participation in apple production and thus provide some basis for guidance to decision makers and stakeholders.
The life cycle assessment (LCA) method is usually used to help systematically understand the potential environmental impacts of specific production systems, which is increasingly applied in apple production systems [23,24,31,32], and these previous studies mainly focused on the comparative environmental evaluation of different cultivars and production systems [22,23,24,32,33] as well as apple and other crop production [34,35,36]. However, few scholars have focused on comparative studies on different agricultural producers. Although some individual studies have focused on the environmental performance of different producers, they have not also focused on their economic effects from a life cycle cost (LCC) perspective [31].
With the widespread use of the LCA method and some scholars believe that LCA needs to be further developed to address economic issues [37]. It is an obvious fact that the combined use of LCA and LCC methods has become a popular trend and a necessity [38,39,40]. The important reason is that LCA focuses on assessing the potential pollutant emissions to the environment from a given production process or option, but in the agricultural production system, some options that impose a smaller environmental burden are not always economically viable. For example, the negative environmental impact of organic fertilizer use is significantly reduced compared to chemical fertilizers, but its higher cost becomes an important constraint that prevents farmers from choosing and using it [24,41]. Fortunately, the method of LCC can precisely identify the component costs of each input in different production stages, and it is most important to consider total environmental cost, which is often overlooked by other economic costing methods [38,42,43]. All in all, the combined use of LCA and LCC methods enables the quantification of environmental impacts and corresponding economic losses in different stages and substances of crop production from a whole life cycle perspective, and enables the identification of key hotspots that contribute to environmental burdens and economic costs, then providing feasible specific and targeted improvement solutions for operators and policy makers. This is the main reason for choosing the combination of the two methods in this paper.
This study aims to quantify the apple production system’s environmental and economic impacts on agricultural cooperatives and smallholder farmers and identify the main pollution processes and substances, and then build a database on the apple industry. The current study uses a combined LCA and LCC approach to achieve this goal, taking Qingcheng County in Gansu Province, a representative region of apple production in China as the study area and one ton (1000 kg) of apples as a functional unit (FU). Furthermore, consider two critical stages from agricultural materials production to farming production as the system boundary. The purpose is to make a marginal contribution to the literature on the environmental and economic impact assessment of agricultural cooperatives and to provide guidance on more sustainable options for apple production in China.

2. Materials and Methods

2.1. Study Area and Data Sources
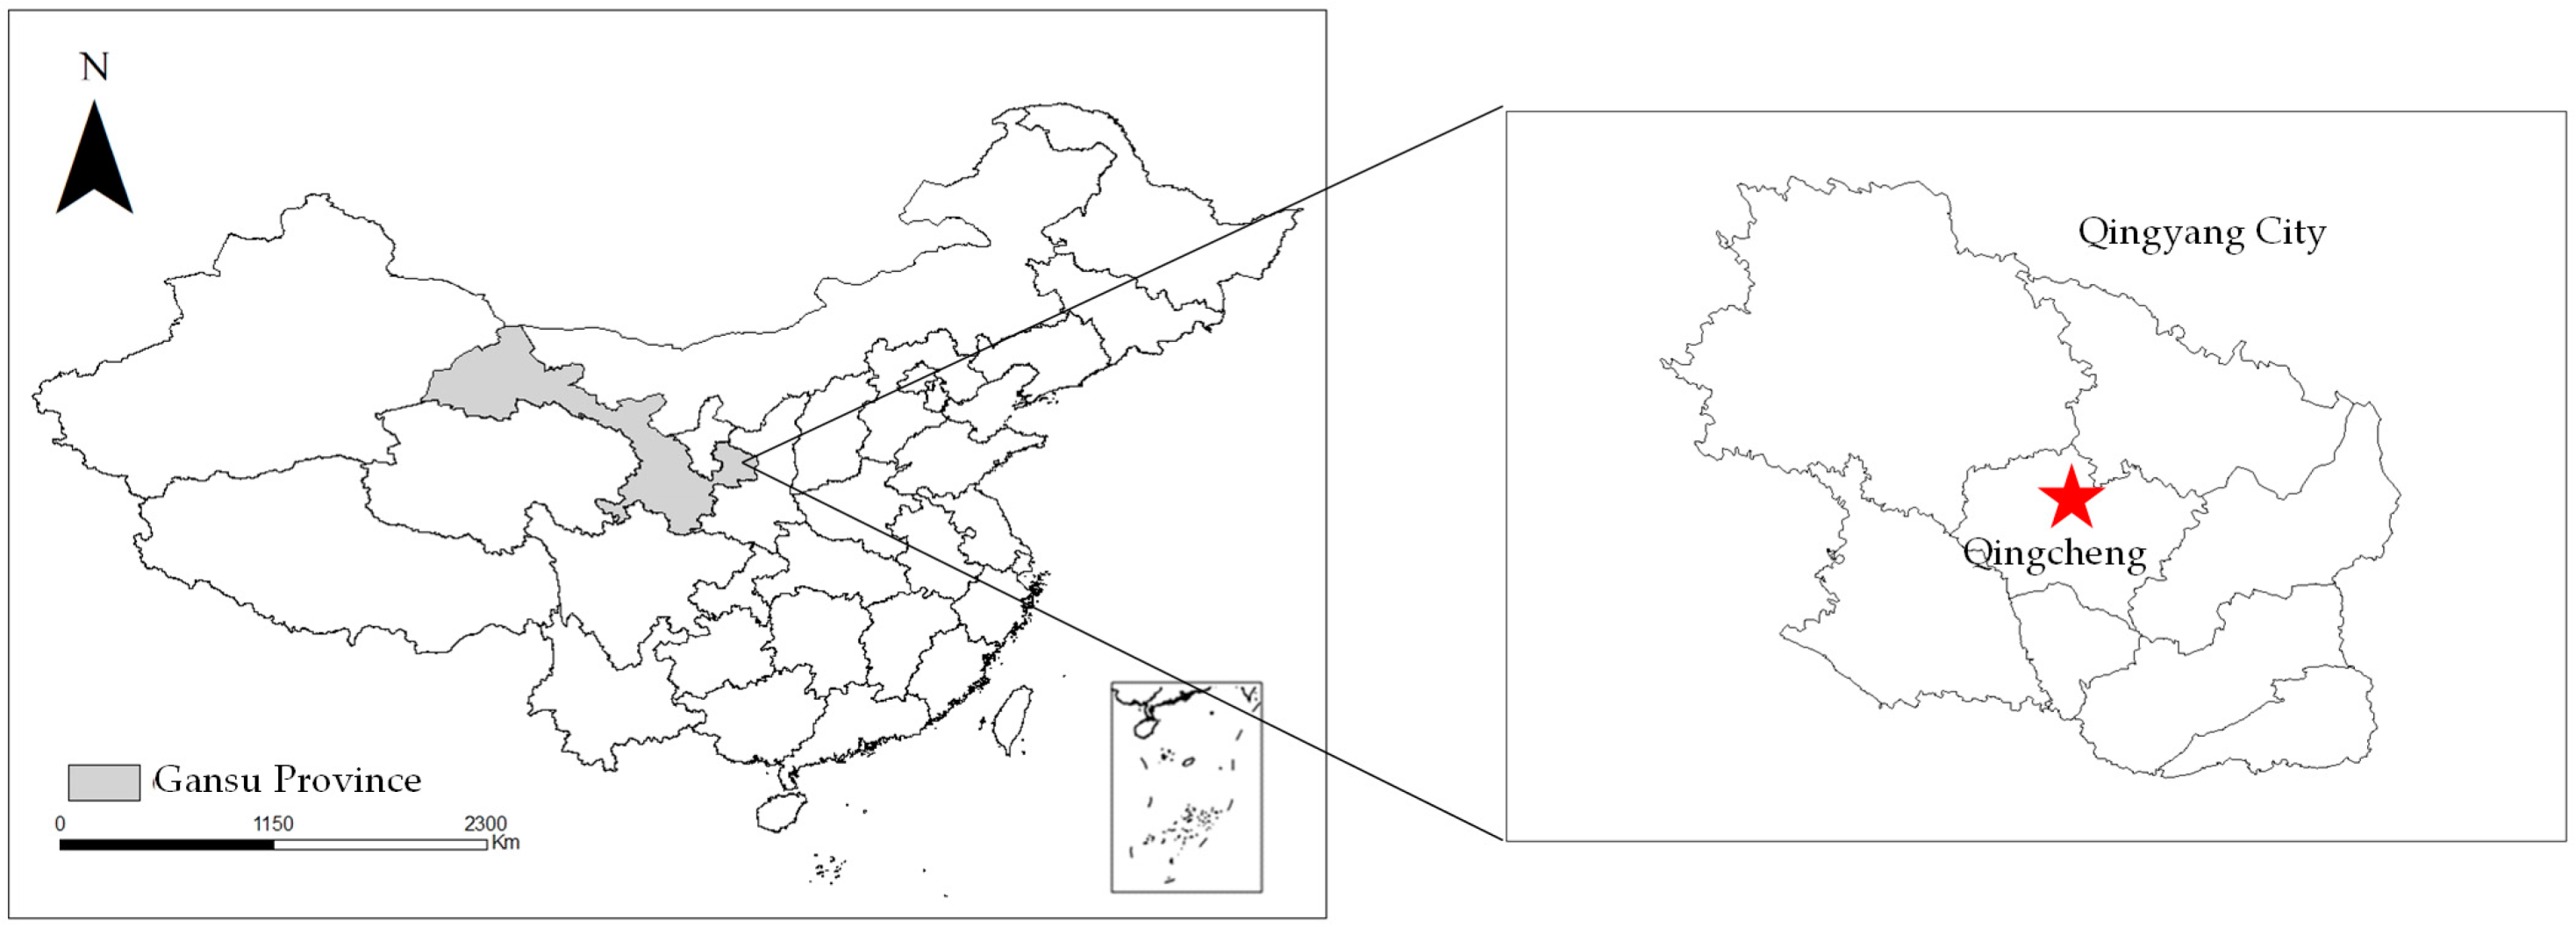
2.1.1. Study Area

The study was conducted in Qingcheng County of Gansu Province, which is one of the birthplaces of Chinese farming culture and also one of the important apple production areas in China. The county is located in the eastern region of Gansu Province (Figure 1) and ranges from approximately 107°16′–108°05′ E to 35°42′–36°17′ N. The county covers a total land area of 2692.6 km2, of which 79% is arable, and the elevation of the county ranges from 1011 to 1623 m. Moreover, the county has a temperate continental monsoon climate with an average annual precipitation of 537.5 mm, an average annual temperature of 9.4 °C, and a frost-free period of 150 d, which is well-suited for apple cultivation. In 2021, there was 10,306 ha of land used for apple cultivation in Qingcheng County, with a total yield of 124,400 tons of apples (data source: http://www.chinaqingcheng.gov.cn/zwgk/xxgkml/tjxx/content_70704, accessed on 21 April 2022) (corresponds to 12.07 tons/ha vs. 21.55 tons/ha in China). Despite the low yield, the region fully meets the seven meteorological indicators and six auxiliary indicators for high-quality apple production proposed in the analysis of the National Apple Zoning Research Report in China and is one of the key development areas of apples with special advantages in China.

2.1.2. Data Sources

The data used in this study came from background and foreground data systems. The background data set can offer related data to the production of consumable inputs, which are obtained mainly through Ecoinvent 3 and Industry data 2.0. The foreground data set includes all data related to the apple cultivation process, which were collected from a survey of 175 apple growers (110 of whom did not join the cooperative, namely smallholder farmers; while 65 joined the agricultural cooperatives, namely cooperatives) of Qingcheng County in October 2021. In practice, a random sampling method was used to select three townships in Qingcheng County and then randomly select two villages in each township; finally, about 30 apple growers were randomly selected from each sampled village for face-to-face interviews. Based on the survey on a total of 307 farms from 175 apple growers, we obtained the information that most apple farms in Qingcheng County are 0.53 ± 0.25 ha, with tree ages distributed from 1 to 40, which lays the foundation for considering the entire life cycle of the apple orchard. In more detail and specifically, the main characteristics of the studied apple orchards were obtained, which are shown in Table 1. It needs to be noted that the apple orchards in Qingcheng County are mainly Fuji varieties of the arbor, so the current study only considers this cultivar to simplify the analysis.
Furthermore, the questionnaire also obtains essential information on the input resources required for different operation steps of the apple orchard, such as pesticide, fertilizer, machinery and diesel, electricity, human labor input, and apple output. Based on the records information provided by the growers, the content information printed on pesticide and fertilizer packages, and the power and service life information of agricultural machinery such as tricycles, tractors, and cultivator weeders in orchards used, the specific amounts of agricultural inputs for apple orchards can be determined. The input-output list of the studied orchards in Qingcheng County is summarized in Table 2. The heterogeneity of agricultural inputs and apple yields resulted from the varying standardization level of the operations for different kinds of growers. An interesting finding from the data in Table 2 is that the inputs of cooperatives were significantly lower than smallholder farmers, with a range of 3.08% to 24%. However, the former yield was 20.94% higher than that of the latter. It is important to note that regarding the primary data handling of fertilizers, pesticides, diesel, and electricity consumption of agricultural machinery, as well as human labor, we have maintained a consistent approach with the study [44].

2.2. Methodology of Life Cycle Assessment

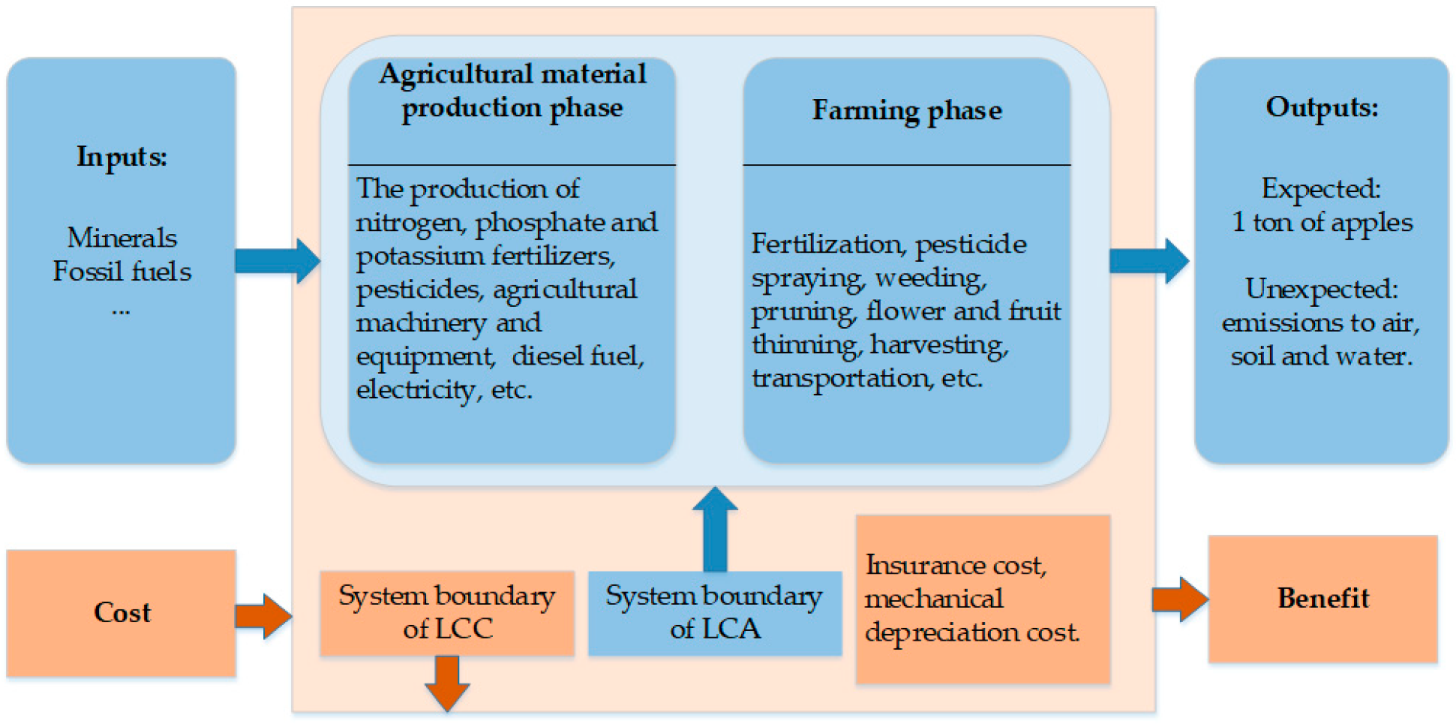
2.2.1. Goal and Scope Definition

The goal and scope definition of an LCA describes the production system in terms of the system boundary and a FU [17]. In this study, the system boundary is a “cradle-to-gate” system (Figure 2), which started with the exploitation of minerals and fossil fuels used to produce agricultural materials and ended with the harvest of the apples in the orchards; the post-farm stage (distribution, processing, transportation, and consumption of apples) was excluded. For FU, as a vital concept in LCA, it is considered the reference unit by which the performance of the production system would be quantified. In this study, the FU was defined as 1 ton of apples.
It is important to note that apple production is a perennial crop with specificity. As recommended by the crucial reviews for LCA applied to perennial cropping systems [23,33,45,46,47], the most significant stage in the whole life cycle of the orchard including the unproductive stages (i.e., orchard creation and establishment and the first three years of sapling growth) and the productive stage (i.e., in apple commercialization years of 4–40) were considered in the analysis. However, the nursery stage has been excluded in this study, mainly due to there is a special organization in charge of fruit seedling cultivation and makes lack of reliable data regarding this phase of apple-growing, which would not significantly affect the final results as the longevity of the apple trees and the small percentage of annual tree replacement [36,48].

2.2.2. Inventory Analysis

In the LCA study, the life cycle inventory (LCI) quantifies all the inputs and outputs of the studied system according to the FU and system boundary considered throughout the product’s life cycle. The foreground data set that described farming practices was used to establish an inventory of farming inputs for apple production, and the outputs, including emissions to air, soil, and water, were calculated according to the previous research findings [24,27,49,50,51,52,53,54,55,56,57] and the background data system. The detailed information on the LCI generated in different phases, including the agricultural material production subsystem and farming subsystem, is shown in Table 3.
For the agricultural material production subsystem, the inventory data were calculated by drawing on the research results of Liang [27], combined with the actual situation of the research data. For the farming subsystem, the pollutant emission parameters from different operational measures such as fertilizer application, pesticide application, and orchard management were mainly derived from the relevant research results published by previous authors. There are large differences between chemical and organic fertilizers in terms of the impacts generated by fertilization. For chemical fertilizers, ammonia (NH3) volatilization and nitrate (NO3) leaching were 8.74% and 17.21% of N input in the apple production area, respectively [24,49], and direct nitrogen dioxide (N2O) emissions were 3.01% of N input [50]. Relatively speaking, these three types of emissions, including NH3 volatilization, NO3 leaching, and direct N2O emissions from organic fertilizers, were smaller, accounting for 2.68%, 14.42%, and 0.78% of the N input, respectively. Moreover, it is important to note that indirect N2O emissions can also occur from NH3 volatilization and NO3 leaching, with values of 1% and 2.5%, respectively [51]. According to Lu [52] and Zhu [24], the data on phosphorus losses in orchards are relatively lacking, so the national average loss of which (0.2% of inorganic and organic P2O5 input) was used in this study. Moreover, emissions of CO2, CO, and other GHG generated during fertilization were calculated according to Ji [53]. In addition, the heavy metal content produced in organic fertilizer used was calculated based on Liang [27] and Feng [54].
Apple production is also greatly dependent on pesticide use, leading to environmental hazards and health risks [55]. The pollutant emissions such as CO2, chemical oxygen demand (COD), and total phosphate (Ptot) in the production of pesticides were considered referring to Liang [27]. During the use, the percentages of pesticides released into the water, air, and soil were 1%, 10%, and 43%, respectively [56]. In addition, the pollutant emissions from the production and use of diesel and electricity were derived from Liang [27]. Furthermore, according to Nguyen and Hermansen [57], an emission factor of 0.7 kg CO2−eq/man·h was used to evaluate the environmental impact of labor inputs for apple cultivation.

2.2.3. Impact Assessment

The life cycle impact assessment is usually used to interpret the LCI data further. Specifically, it included three steps: characterization, normalization, and weighting. In this study, environmental impact factors, including land resource depletion, demand for non-renewable energy resources, global warming, aquatic eutrophication, acidification, human toxicity, aquatic eco-toxicity, and soil eco-toxicity, were analyzed. Characterization generally applies equivalent coefficients to compute the environmental impact potential caused by the same type of pollutant, the results of characterization were obtained by referring to the study of Guo et al. [58], and the calculation formula is shown in Equation (1):
Environmental   impact   potential =   ( Q i   ×   E C i )    
In Equation (1), Q i is the number of pollutant emissions (kg/t) and E C i is the equivalent coefficient of pollutant i. In particular, the demand for non-renewable energy resources was determined based on Guo et al. [58]. The environmental impact factor of land resource depletion was based on the methodology developed by Wang et al. [59]. The global warming potential used CO2 equivalent over a 100-year time horizon from the Intergovernmental Panel on Climate Change to compute [60]. Acidification potential and aquatic eutrophication potential used SO2 and PO4 equivalent factors to calculate, respectively [51]. Moreover, human toxicity potential, aquatic eco-toxicity potential, and soil eco-toxicity potential were calculated according to Nemecek et al. [61], and the characterization factors of pesticides and heavy metals were converted to 1,4-dichlorobenzene (1,4-DCB) equivalent factors to compute three toxicity impacts potential.
Normalization values are generally the average levels of global (or national or regional) resource consumption and environmental pollutants emission [58]. The normalization step was performed, and each of the environmental impact potentials was divided by the world per capita environmental impact normalization factor for 2000 to calculate the environmental impact of eight categories considered in this study for apple production. After normalization, the different types of environmental impacts can be directly compared.
Weighting is necessary since various environmental impact categories are of different importance to environmental carrying capacity and sustainable development. The weighting results of each type of environmental impact were obtained by the normalized results to multiply the corresponding weighting value referred to Wang et al. [17]. By this step, the environmental impact indices of each type of category were obtained. The composite environmental impact index for different growers of the apple production system was calculated by summing each type of environmental impact indices. In practice, the final total environmental index was calculated using Equation (2).
Total   environmental   impact   index =   ( E P j / R V j )   ×   W j    
In Equation (2), E P j   is the environmental impact potential of category j, R V j is the relevant reference value of environmental impact j, and W j is the weighting value of environmental impact j.

2.2.4. Interpretation

This step examines the environmental damage results for presenting logical exegesis for different growers in the apple production system. Based on the results that reflect the current situation can draw conclusions and make specific and targeted recommendations to alleviate environmental pressure and promote sustainable development for apple growers and policymakers.

2.3. Life Cycle Cost Analysis

LCC analysis has been used to estimate the related costs involved throughout the entire life cycle of a product, service, project, and investment [42]. In the LCC analysis process, the focus is on calculating and identifying key metrics such as environmental emissions costs, economic indices, including sale price, production revenue, variable and fixed cost, and net profit value, which were obtained by the following formula:
Sales   price = Economic   value   per   kg   of   apple  
Total   production   revenue = Sale   price   ×   Apple   yield  
Total   variable   cost = Sum   of   marginal   cos ts   over   all   apple   produced  
Total   fixed   cost = Cost   does   not   change   with   the   quantity   of   apple   produced  
Total   environmental   cost = Cost   of   elimination   emissions   effects   the   environment  
LCC = Total   variable   cost + Total   fixed   cost + Total   environmental   cost  
Net   profit = Total   production   revenue     LCC  
In the specific calculation process, the sales price of apples is based on the actual selling price of the surveyed growers of Qingcheng County in 2021. The variable costs mainly include fertilizer, pesticide, diesel, electricity, employed human labor cost, etc. The prices of those agricultural inputs were obtained from the survey of growers and relevant agricultural product trade websites (http://www.agri.cn/, accessed on 16 October 2021). The fixed costs are mainly composed of the insurance cost of apple orchard and the mechanical depreciation cost of agricultural machinery. Insurance cost was calculated based on actual insurance expenses purchased by growers, and the mechanical depreciation cost of machinery was according to the average age method.
Furthermore, the six environmental impacts caused by pollutant emissions were monetized to gain insights into additional external costs, namely environmental costs. It needs to be noted that the environmental cost was converted to express with Chinese Yuan (CNY) to unify the calculation, and the exchange rate was determined by 1 Euro to 7.75 CNY. In the further detailed calculation process, the damage costs due to global warming, acidification, and aquatic eutrophication were expressed per emission of CO2, SO2, and PO4 equivalents, and the indicators of 0.46 CNY/kg CO2−eq, 38.50 CNY/kg SO2−eq and 4.65 CNY/kg PO4−eq, respectively, were used according to Guo et al. [58] and Yadav et al. [62]; meanwhile, the cost of human toxicity, aquatic eco-toxicity, and soil eco-toxicity was expressed per emission of 1, 4-DCB equivalents, and the indicators of 0.77, 0.08 and 0.08 CNY/kg 1,4−DCB−eq, respectively, were used refer to Annaert et al. [31] and Guo et al. [58].

3. Results

3.1. Energy and Land Consumption

As is shown in Table 3, producing 1 ton of apples for the cooperatives required 3658.96 MJ of energy depletion, which was 20.24% lower than smallholder farmers (4587.49 MJ). The main reason is that the cooperative’s apple production process is more standardized, and the amount of various material inputs is lower, thus reducing the corresponding energy consumption. Further analysis revealed that about 80% of the energy depletion occurred in the agricultural material production subsystem for all growers because agrochemical production such as fertilizer and pesticide are all high energy-consuming industries, which require 92.93, 20.96, 13.13, and 240 MJ to produce 1 kg of N, P2O5, K2O, and pesticide products, respectively [27]. It required 500.17 m2 of land use to produce 1 ton of apples for the cooperatives, reducing land consumption by 17.31% compared to smallholder farmers (604.87 m2), which was mainly caused by the higher production of cooperatives.
In particular, it is essential to note that water consumption was not considered in this study because the study area is located in a typical dryland farming region where water resources are relatively scarce, resulting in very few farmers conducting dedicated apple orchard irrigation and generally relying on precipitation to maintain the water requirements for apple production.

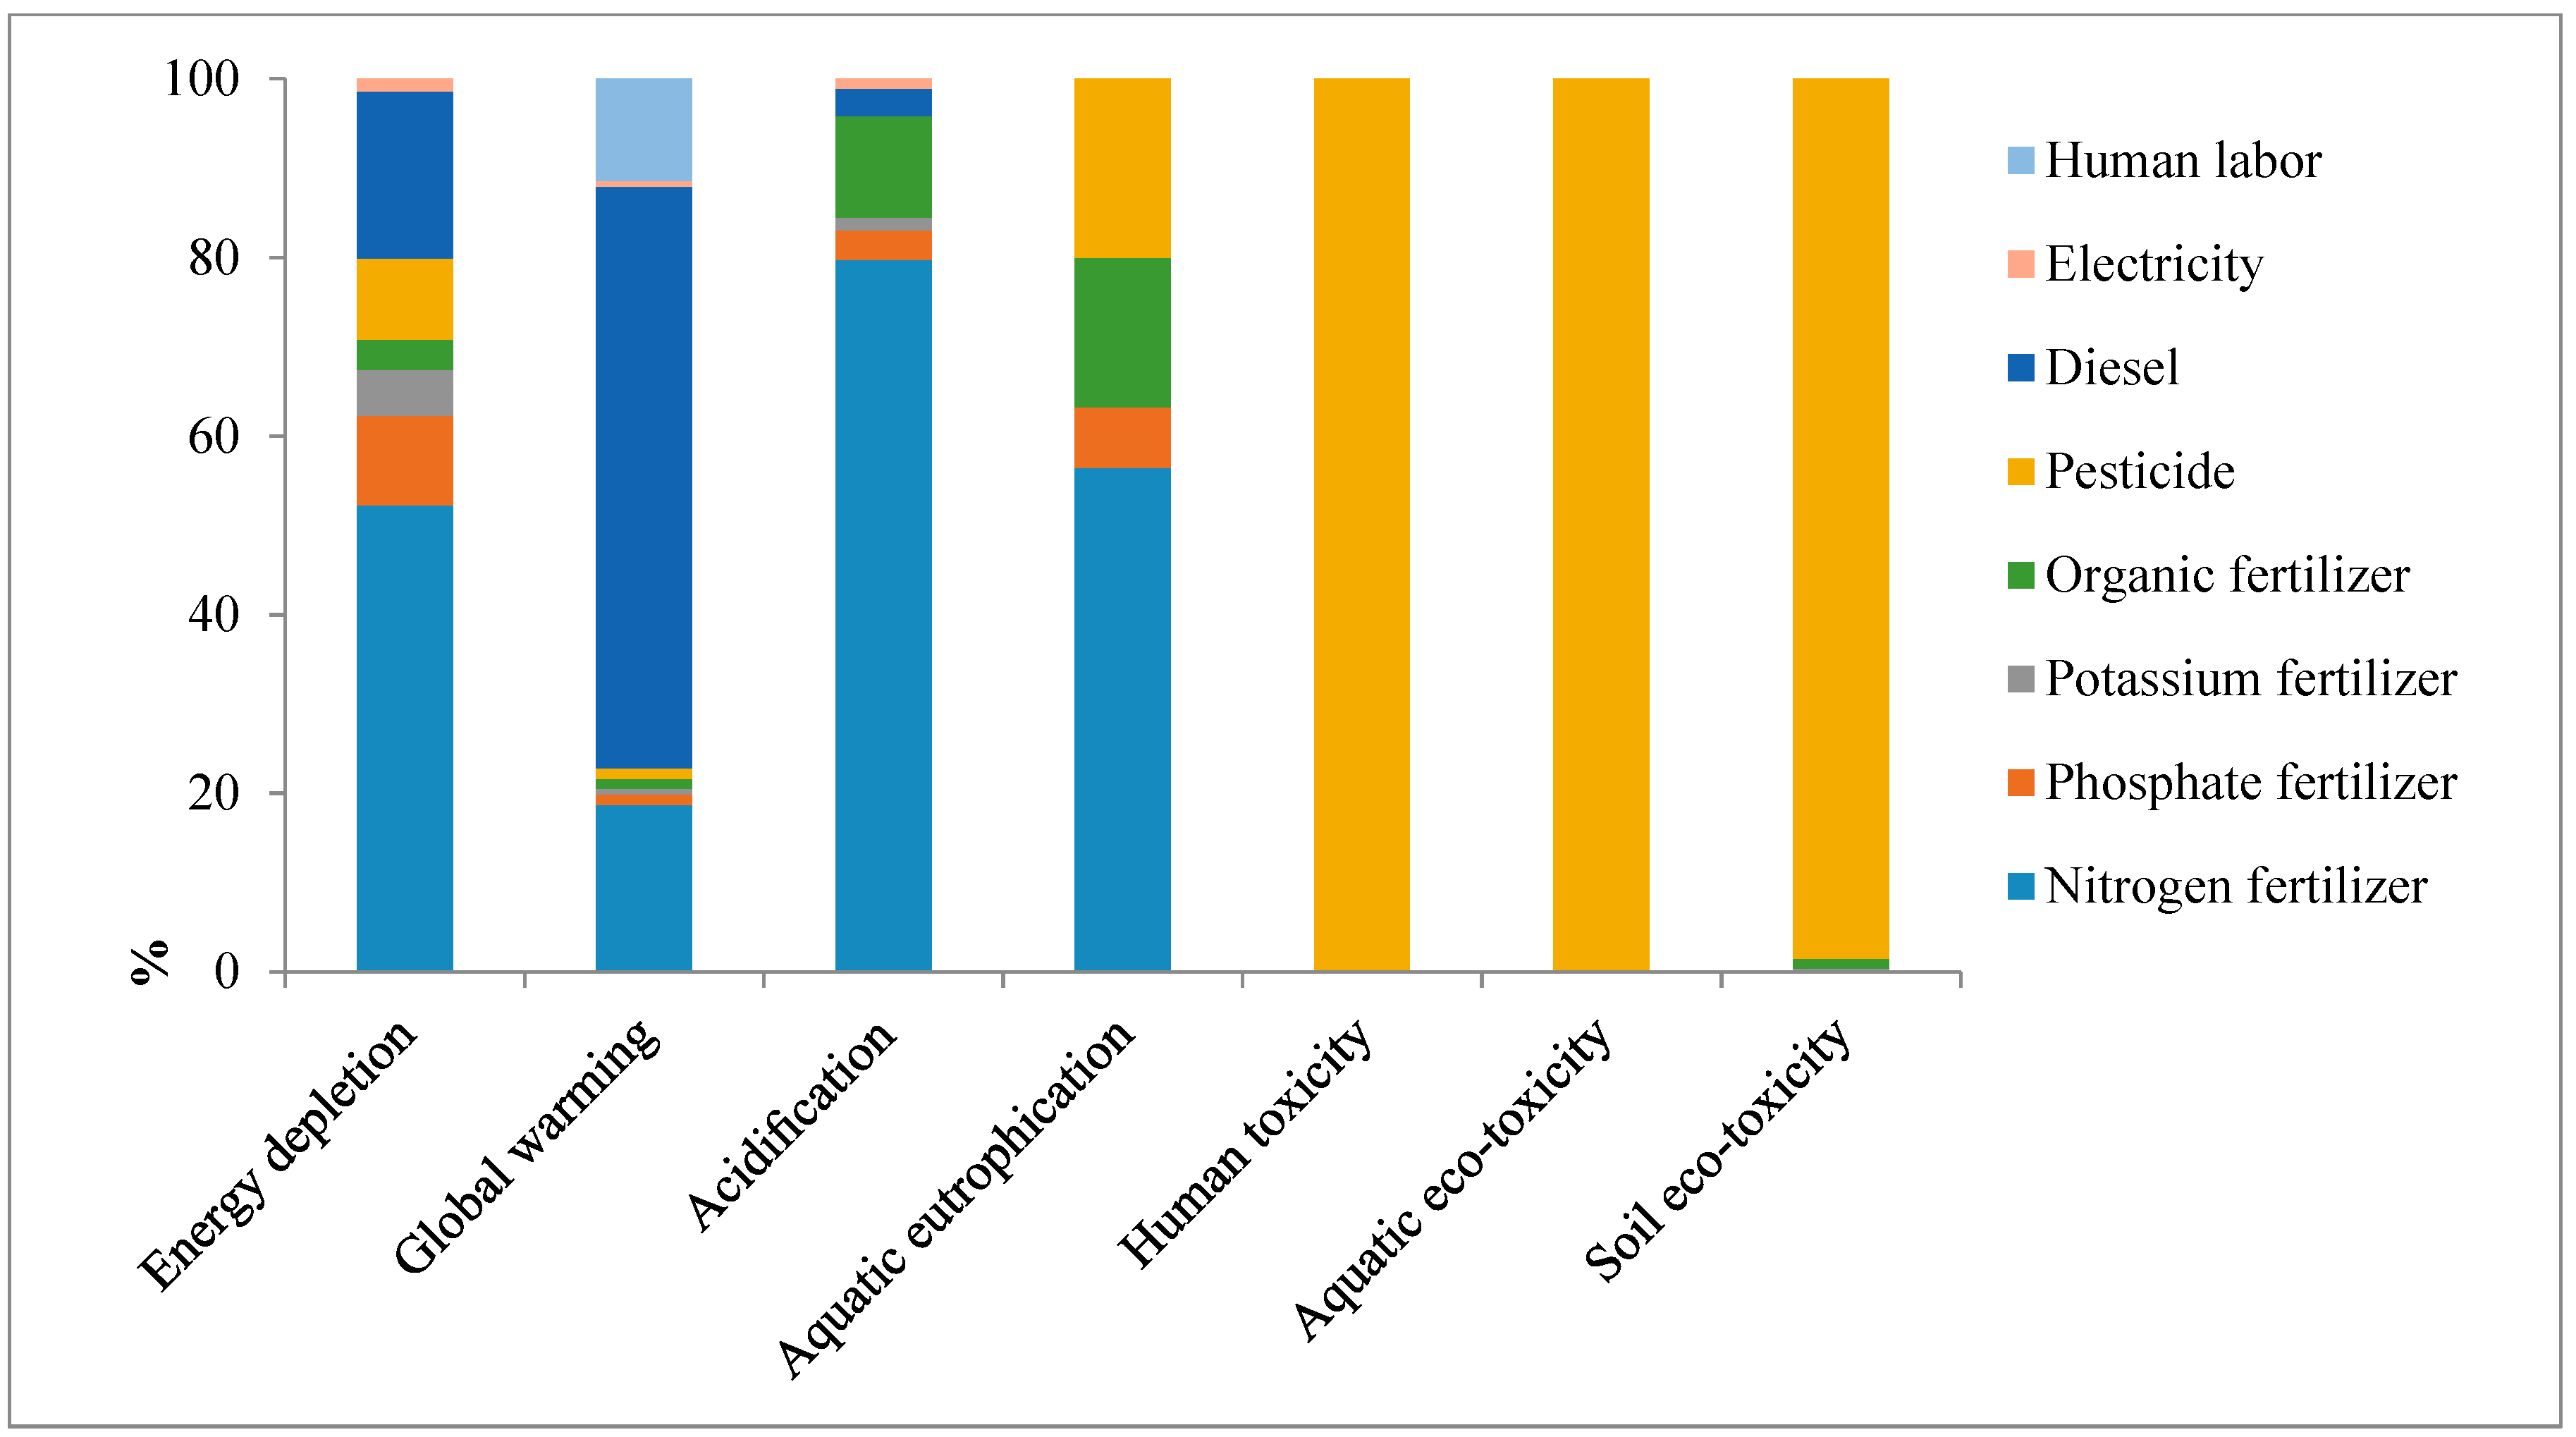
3.2. Characterization of Pollutant Emission

The pollutant emissions were mainly considered the potential for global warming, acidification, and aquatic eutrophication. As shown in Table 4, global warming potential consists of CO, CO2, methane (CH4), and N2O. To produce 1 ton of apples for the smallholder farmers, 2770.95 kg CO2-eq was emitted, whereas 2210.18 kg CO2-eq was emitted for the cooperatives. Since cooperatives are more specialized in apple production than smallholder farmers, which usually increase the efficiency of resource use and reduce the amount of inefficient inputs such as fertilizers, pesticides, and machinery, then reduce the potential for GHG emissions. More specifically, the impact of global warming on apple production is dominated by CH4 and CO2 in Qingcheng County, which together accounted for ~90%. As for CH4, it is mainly derived from the use of diesel for agricultural machinery, and the consumption of 1 kg of diesel fuel results in 3.19 kg of CH4 emissions [24,27], and the corresponding global warming potential of CH4 is 28 times that of CO2. As for CO2, the emissions are mainly from N production in the agricultural material production phase and labor input in the farming phase. Moreover, N2O is also one of the important greenhouse gases, and the global warming potential of which is 265 times higher than that of CO2 [60].
Sulfur oxides (SOx), NH3, and nitrogen oxide (NOx) were included in estimating acidification potentials in the present study. As shown in Table 4, the total acidification potential to produce 1 ton of apples for smallholder farmers was 7.23 kg SO2-eq, which was reduced by 19.92% for the cooperatives (5.79 kg SO2-eq), mainly due to the significantly lower use of N fertilizer in the latter. Specifically, the agricultural material production phase (especially N production) is the primary source of SOx and NOx, and the potential contributions are higher than 90%. In contrast, NH3 mainly comes from the farming phase, which is obviously caused by the use of N, and the potential contribution is ~86%.
Aquatic eutrophication potential was 2.39 kg PO4-eq from the smallholder farmers, higher than 19.67% of the cooperatives (Table 4), mainly due to the fact that smallholder farmers use more pesticides and N fertilizer than cooperatives. Further analysis revealed that aquatic eutrophication was caused by releasing Ptot, NO3, ammonium nitrate (NH4), NH3, and COD. Among them, Ptot, NO3, and NH3 together played a leading role, and the potential contribution accounted for ~90%, while NH4 and COD together accounted for ~10%. Specifically, Ptot is mainly caused by pesticides, and the production of 1 kg of pesticides can result in 0.92 kg of Ptot; the use of P2O5 is the second contributor to Ptot because the solubility characteristics of P2O5 make runoff easy to cause eutrophication of water bodies. Moreover, the NO3 and NH3 mainly resulted in the use of N.

3.3. Characterization of Toxicity

The toxicity impact category comprises the effects of the pesticide, including insecticides, fungicides and herbicides, and heavy metals on human, aquaculture, and soil ecosystems. In the present study, all of the three toxicity types are higher for the smallholder farmers than for the cooperatives because the lower pesticide consumption and emissions are attributed to a more standardized daily operation and management model for the latter.
As shown in Table 5, the human toxicity to produce 1 ton of apples for the smallholder farmers was 2.36 kg 1,4-DCB-eq, which was reduced by 21.61% for the cooperatives (1.85 kg). Human toxicity was dominated by omethoate, a type of insecticide, which accounted for ~38% of the total human toxicity potential; followed by carbendazim, a type of fungicide, and its potential contribution was accounted for ~36%. In comparison, the impact of atrazine (one of the herbicides) on human toxicity is minimal, accounting only for ~3%.
Aquatic eco-toxicity was 394.27 kg 1,4-DCB-eq for the smallholder farmers, which is 22.18% higher than the cooperatives (306.83 kg), mainly due to the higher fungicide application of smallholder farmers than cooperatives. Aquatic eco-toxicity is derived from pesticides leaching into the water when applied to apple orchards and heavy metals discharging into the water during agricultural material production and consumption, especially for the production of N and the use of organic fertilizer. As shown in Table 5, the aquatic eco-toxicity of apple production in Qingcheng County was dominated by carbendazim and mancozeb, are all belong to fungicides, which contributed more than 80% of the total aquatic eco-toxicity potential. The third contributor to aquatic eco-toxicity comes from chlorpyrifos, a type of insecticide. Although the emission quantity of chlorpyrifos entering the water was low than 0.1 g to produce 1 ton of apples, its characterization value was as high as 640,000. As a result, the aquatic eco-toxicity brought by chlorpyrifos was amplified accordingly.
Table 5 also shows that soil eco-toxicity was 17.93 kg 1,4-DCB-eq for the smallholder farmers, higher 21.03% than the cooperatives (14.16 kg). The specific analysis revealed that soil eco-toxicity mainly comes from pesticide residues and heavy metals in fertilizers entering the soil. Similar to aquatic eco-toxicity, the top three impacts on soil eco-toxicity are derived from carbendazim, chlorpyrifos, and mancozeb; and the corresponding contribution potential is approximately 50%, 23%, and 20%, respectively.
It is worth noting that the impacts caused by herbicides on the three toxicity types are all relatively small. The most important reason is that the majority of herbicides are included in the banned list by the Chinese agricultural department to promote the apple industry to achieve sustainable development, protect the ecological environment and do an excellent job of ecological management. This largely explains the need for mandatory government environmental regulatory measures.

3.4. Total Environmental Impacts

The normalization and weighting results of environmental impacts on the apple production system in Qingcheng County are shown in Table 6. The degrees of environmental impact categories in descending order of normalization value to produce 1 ton of apples were aquatic eco-toxicity > soil eco-toxicity > aquatic eutrophication > land use efficiency > global warming > acidification > human toxicity > energy depletion. Thus, aquatic eco-toxicity and soil eco-toxicity were the major environmental impacts on the apple production system, and the normalization value for the cooperatives were 63.53 and 2.32, respectively, which are 22.17% and 20.82% lower than for the smallholder farmers. A more in-depth analysis revealed that the main contributors to aquatic eco-toxicity and soil eco-toxicity are all carbendazim, mancozeb, and chlorpyrifos, which means that pesticides, especially fungicides and insecticides, are the biggest environmental hotspots in apple production. In addition, Table 6 also shows that the six remaining environmental impact potentials for the cooperatives are all reduced by more than 20%, except for land use is 17%, compared to the smallholder farmers. This illustrates that growers who join cooperatives can largely reduce environmental burdens and improve resource efficiency and is, therefore, a more sustainable way of management for apple production.
During the weighting step, the normalization value for all types of environmental impact categories was multiplied by the corresponding weighting factor, which represented the potential of an impact category to harm resources, natural ecosystems, and human health. Then the gained values were summed to attain the total environmental index of apple production. We can see in Table 6 that the total environmental index for the cooperatives was 7.44, which was 22.09% lower than that of the smallholder farmers. This is the result of the comprehensive environmental effects of the advanced technical training and daily standardized management functions carried out by the cooperatives.
The contribution of various agricultural inputs to each environmental impact potential was analyzed to identify the critical environmental hotspots of the apple production system in Qingcheng County. As shown in Figure 3, the major contribution to energy depletion comes from the fertilizer application (70.81%), and the production and use of N stand out, with a share of 52.21%, followed by P2O5, with a share of 10.06%. Thus, N and P2O5 accounted for 62.27% of the energy depletion impact category. Moreover, the diesel application also has an enormous impact on energy consumption, with a contribution potential of 18.67%.
For the impact category of global warming, the significant contribution is driven by the production and use of diesel (65.19%), followed by N (18.68%), and the third contributor comes from human labor used in the orchard, with a share of 11.43%. An interesting finding is that the contribution potential of human labor to global warming is the largest in all kinds of impact categories, mainly because the emissions from human labor are CO2.
Concerning the impact category of acidification, the production and use of N caused the most outstanding contributions, accounting for 79.76%, followed by organic fertilizer, with a share of 11.32%. In contrast, the contribution potentials of other inputs are relatively small, and the accounts are all less than 3.27%. Because the amount of N used is closely related to pH value changes of soil. Excessive use of N will lower the pH value of soil and cause acidification, which will not only affect the biological activity in the soil but also change the form of nutrients in the soil and reduce the effectiveness of nutrients, which in turn will be detrimental to apple production.
For the impact category of aquatic eutrophication, the contribution potential of fertilizers is similar to energy depletion. The production and use of N and P2O5 accounted for 63.22% of aquatic eutrophication. However, the difference is that the production and use of organic fertilizer is 16.79%, higher than the energy depletion is 3.40%. Moreover, pesticide also has a large impact on aquatic eutrophication, with a contribution potential of 19.99%.
In the human toxicity, aquatic eco-toxicity, and soil eco-toxicity categories, the production and use of pesticides has a dramatically leading degree, and the contribution potential is 100%, 99.95%, and 98.52%, respectively. This indicates that the different toxicity potentials in the apple production system are mainly caused by pesticides.
In particular, it is essential to note that we did not consider the environmental impact of land use in the contribution analysis. Because land is used as the most basic carrier in the apple production process, its utilization’s most critical environmental burden comes from the impact of agricultural materials rather than the land itself.
To summarize the above analysis, it can be seen that the most outstanding contribution to environmental impact is produced by the production and use of pesticides, followed by the fertilizers (especially N, which accounts for 76.76% of all fertilizers), which together contribute more than 80% in all the categories considered. Thus, pesticides and fertilizers are prominent environmental impact hotspots in the apple production system.

3.5. Life Cycle Cost and Net Profit

The LCC and net profit analysis were undertaken to evaluate apple production from an economic perspective, with the results reported in Table 7. A total environmental cost of 1275.63 CNY was incurred when producing 1 ton of apples for the cooperatives, which was 20.22% lower than the smallholder farmers (1598.90 CNY). Among the environmental impact categories considered in the present study, global warming was the most significant contributor to environmental cost, with a share of ~80%; followed by acidification, with a share of ~17%; the environmental costs for the remaining impact categories are low, together contribution was only ~3%. The decrease in environmental cost for the cooperatives can be attributed to the reduced agrochemicals, especially N, which not only lowered the CO2 discharge in the factory production process but also lowered N2O emissions and NO3 leaching in apple farming.
As for economical cost, both the variable cost and fixed cost were determined. Compared to the fixed cost, the variable cost is the main component of the total economic cost, accounting for ~93%. Among the variable cost, the employed human labor cost is the highest, accounting for 36–37%, followed by the organic fertilizer cost, contributing ~15%. As shown in Table 7, the total economic cost was 1384.08 CNY when producing 1 ton of apples for the cooperatives, which was 18.38% lower than the smallholder farmers (1695.66 CNY). There are two reasons for this: on the one hand, cooperatives are more efficient in the use of resources for apple production; on the other hand, they have a lower amount of various material inputs.
The LCC was 2659.71 CNY for the cooperatives, while for the smallholder farmers was 3294.56 CNY, the latter higher 19.27% than the former, which indicated that the cooperatives could reduce the total LCC of apple production. In order to further analyze the net profit, it is calculated that the economic income was 5650 CNY for 1 ton of apples. The net profit was 2990.29 CNY for the cooperatives, which was 21.23% higher than the smallholder farmers (2355.44 CNY). Hence, joining the cooperative could improve the net profit of apple production. It is worth noting that the cooperatives in this study did not participate in sales, thus making their sales prices not higher; otherwise, the cooperatives would have generated a higher net economic profit.

4. Discussion

4.1. Comparison with Literature

The present study quantified the energy depletion, land resource depletion, global warming, aquatic eutrophication, acidification, human toxicity, aquatic eco-toxicity, and soil eco-toxicity of the apple production system. Based on 175 farmer surveys in Qingcheng County of Gansu Province of China, the environmental and economic performance of agricultural cooperatives and smallholder farmers were comparatively analyzed with the combination method of LCA and LCC. The results demonstrate a more considerable difference in environmental impacts and economic returns between cooperatives and smallholder farmers, which consist of Deng et al. [14]. In particular, the total environmental index for the cooperatives was 7.44, which is 22.09% lower than smallholder farmers; meanwhile, for the cooperatives, the total LCC was 2659.71 CNY, which is 19.27% lower than smallholder farmers, while the net profit was 2990.29 CNY, 21.23% higher than smallholder farmers. This largely suggests that cooperatives could reduce the environmental burden while increasing economic returns of apple production and is a more conducive production method for achieving sustainable development goals in the agricultural field. Moreover, the contributions of agricultural material inputs to each environmental impact potential were analyzed in this study, and the findings show that pesticides and fertilizers (especially N) are prominent hotspots in the apple production system, consistent with previous studies [24,25,32,44].
More specifically, as for the resource demand, water depletion was not considered in this study, which is different from Guo et al. [58] and Zhu et al. [24]. Because the study area is located in a typical dryland farming region where water resources are relatively scarce, resulting in very few farmers conducting dedicated apple orchard irrigation. However, this dependence on the weather for orchard operations (relying on precipitation to meet water needs) creates a potential risk of uncertainty to a large extent. As the orchard may be in a non-rainfall period when it is particularly in need of water, which can cause droughts, then directly affect apple yields and quality. So exploring water-saving irrigation technologies in apple production requires more attention [28]. Drip fertilization is a conservation technology that applies fertilizer through a drip irrigation system that can improve both water and nutrient use efficiency [64]. Therefore, it is essential and promising to consider the infrastructure construction of drip fertilization in the study area. Moreover, for smallholder farmers, the energy depletion in this study (4587.49 MJ/t) is higher than 17.64% than Zhu et al. [24], which is largely caused by the application of agrochemicals. Furthermore, the land use for producing 1 ton of apples in this study is 604.87 m2, while of which in Zhu et al. [24] is only 194.07 m2 (in Shangdong province of China) and 291.94 m2 (in Shaanxi province of China), respectively. This is because the apple yields in the studied region by Zhu et al. [24] are much higher than those in the current study.
Concerning the impact category of global warming, which holds 2210.18–2770.95 kg CO2-eq/t in this study, it is 2.59–17 times higher than the published studies [22,25,32,33,35,36,44] and is even ~31 times higher than Alaphilippe et al. [23] and Bartzas et al. [34], which essentially indicates that the effect of apple production on global warming is generally high in Qingcheng County. The fundamental reason for such a large gap may be that apple production is at a lower level, only 16.53–19.99 t/ha in the current study. While it is 40, 37.8–55.4 and 32.4 t/ha/year in Italy, France, and Greece, respectively [23,33,34], which suggests that when using yield as a FU, low yield production can result in more significant GHG emissions [33].
For the acidification, the present study is 5.79–7.23 kg SO2-eq/t, which is much higher than the result of some research [23,33,34,35]; while close to Longo et al. [32], Zhu et al. [24], Keyes et al. [22] and Cheng et al. [44], but lower than Vinyes et al. [36] and Khanali et al. [25]. Acidification is caused by the emissions of NOx, SOx, and NH3, which mainly come from the consumption of fertilizers, particularly N in this study. Thus, the studies with higher or lower acidification results are mainly caused by higher or lower N use, and studies with closer results imply that N use is also relatively similar.
In the impact category of aquatic eutrophication, the result of this study (1.92–2.39 kg PO4-eq/t) is generally equal to Zhu et al. [24], Cerutti et al. [33], Svanes and Johnsen [35], and Cheng et al. [44], but higher than Alaphilippe et al. [23], Longo et al. [32], Keyes et al. [22] and Bartzas et al. [34]; while lower than Vinyes et al. [36] and Khanali et al. [25]. A more in-depth analysis revealed that Ptot, NO3, and NH3 played a leading role in aquatic eutrophication, which was caused by the production and consumption of pesticides and fertilizers. Therefore, the studies with higher results of aquatic eutrophication imply that both pesticide and fertilizer application in apple production may be higher; which can lead to an imbalance in the distribution of species in aquatic ecosystem, and further cause adverse environmental impacts.
For the three toxic impact categories, including human toxicity, aquatic eco-toxicity, and soil eco-toxicity, the results showed that which are dramatically driven by pesticides, meanwhile some heavy metals (Cd, Cu, Pb, Zn, etc.) from the use of organic fertilizers can also bring impacts. This finding is consistent with Alaphilippe et al. [23], Zhu et al. [24], and Keyes et al. [22], which means that excessive application of organic fertilizer will lead to a gradual increase in soil eco-toxicity risk, and further reveals that apple growers should not blindly increase the amount of organic fertilizer, and it is necessary to strengthen the application of soil testing and formulated fertilization technology. In the results of LCC and net profit, we found the total environmental cost is 1275.63–1598.90 CNY to produce 1 ton of apples, of which global warming accounts for ~80%, in consist of Guo et al. [58], because the categories and numbers of six environmental impact considered by both are the same. While the contribution potential is up to ~96% in the study of Annaert et al. [31] about apple production, since the value of the total environmental cost was calculated based on three environmental impact categories: global warming, acidification, and eutrophication; however, the effects of three types of toxicity were not considered.
As for economic cost, human labor cost is the largest of all the inputs required for apple production, and this is consistent with the study of Guo et al. [58], Jirapornvaree et al. [65], and Zhen et al. [66]. Specifically, the labor cost of apple production accounts for 33.61–34.32% of the total economic cost in this study, while it is even higher in the study for tomato production by Guo et al. [58], accounting for 58.19–63.04%, which illustrates a common problem that fruit and vegetable production is labor-intensive in China. However, it has become a trend for rural laborers to move to non-agricultural sectors with higher labor remuneration, making it difficult and more expensive to hire laborers during the busy farming period [67]. This is becoming a major limiting factor for the sustainable development of agricultural products and therefore requires the attention of government departments.
In addition, this study found that the cost of organic fertilizer was the second largest contributor to the total economic cost and was the most expensive of all fertilizers, which largely discouraged its use by some farmers. However, organic fertilizers are rich in many organic acids and peptides and include rich nutrients such as N, P2O5, and K2O. The increased application of organic fertilizers in apple orchards could not only improve soil’s physical and chemical properties and organic matter content but also improve the quality of agricultural products and change the resistance of crops to drought, pests, and other diseases, thus reducing the probability of disasters and the damage caused [41]. Hence, the government should further help implement the action plan to replace chemical fertilizers with organic fertilizers in apple production areas.
Furthermore, an interesting finding is that the economic income for cooperatives and smallholder farmers is the same since the unit price is 5.65 CNY/kg for both, which is different from the result of Deng et al. [14] because the cooperatives in the study area focus on services such as training in new technologies, standardized production management, and providing information and advice, especially on helping farmers change their farming practices and supporting the adoption of more sustainable practices, such as organic fertilizer application, physical control of pests and diseases, deep soil loosening, etc. However, which are not involved in the marketing process and therefore do not impact marketing revenue. The critical point is that the apple cooperatives in the study area should be further strengthened and improved later. Because the theoretical assumptions of cooperative pricing rules suggest that cooperatives can offer higher prices [68], this is feasible and not difficult to achieve. Specifically, cooperatives can first promote quality improvements throughout the supply chain through more standardized production methods and advanced technical training; secondly, they could choose to create independent brands to enhance the visibility of their agricultural products; and thirdly, they can help farmers cope with market imperfections and diversify risk shocks [69]. Therefore, it is an essential task that government departments in the study area should strengthen the regulatory mechanism of cooperatives, standardize their operation mode, broaden their business fields, improve their scope of responsibilities, and guide them to honestly and effectively play an active role in the whole industry chain from pre-production to production and post-production.

4.2. Limitations and Future Research

As is the case with any research study, there are associated limitations. Since apple cultivation in the study area lacks irrigation water sources, water consumption data used in apple production was difficult to collect. Under this scenario, the findings are based on data excluding water consumption. Moreover, as confirmed by Alaphilippe et al. [23], Zhu et al. [24], and Cerutti et al. [47], there may be differences in the results obtained based on different FUs for the same agricultural product. While the FU of 1 ton of apples is in line with previous studies [22,32,34,44], one might question whether it is the most appropriate FU. For example, product quality is a crucial determinant in analyzing LCC and economic profitability. However, this aspect is not considered in the studies based on quantity as a FU. From a farmer’s perspective, the relevant function unit of their activities might instead be the economic benefit, which is determined largely by the produced quantity as well as the price of the product, and the latter is partially linked to the quality of the product [70]. Therefore, the types of resource inputs, environmental impact categories, and FUs should be considered more comprehensively in future studies under the objective conditions supported.
Moreover, regarding the emission factors of pesticide and fertilizer use, we specifically refer to the previous research and mainly used the average level [24,27,49,50,56,71]. However, the heterogeneity of cropping processes in different regions and types of crops may affect the relevant emission factors to some extent, which may lead to different results compared with field measurements. Hence, future studies should adopt a mixed-method approach and provide the dual dimensional measurement of the findings through survey questionnaires and on-farm experiments data to improve the accuracy of pollutant emission data metrics.
The perspectives of future research should be directed to better analyze possible new frameworks by considering the social impacts of apple production on different stakeholders combined with the social life cycle assessment (SLCA) approach. As the production of agricultural products is not only related to the issue of food security but also closely associated with the carrying capacity of the ecological environment and the stable development of society. Thus, it is a sustainable development issue of effective coordination between the economy, environment, and society [72,73,74]. Therefore, a comprehensive assessment tool that integrates LCA, LCC, and SLCA methods should be promoted and utilized to find the most practical and feasible improvements that could provide guidance for resource-saving, environmentally friendly, economic value enhancement, and social harmony in apple production areas.

5. Conclusions and Implications

There are more and more severe challenges facing agriculture in China today, and revolutionary production and management modes are needed to meet these challenges. As a new type of agricultural business entity, cooperatives are receiving more and more widespread attention. A comparison study was conducted between cooperatives and smallholder farmers from the environmental and economic perspectives of apple production, using a combination of LCA and LCC methods. Our analysis showed that cooperatives exhibited a higher net profit while having a lower resource input, environmental impact, and LCC in the study compared to smallholder farmers, so cooperatives are more conducive to sustainable apple production. Moreover, the most critical environmental hotspots in the apple production system are pesticides and fertilizers (especially N). So, the adoption of new low-carbon technologies, such as organic fertilizers instead of chemical fertilizers and physical pest control instead of pesticides, is becoming an essential task that apple growers need to perform in the longer term; it is directly related to reducing the environmental burden caused by apple production. Moreover, as for economical cost, the results showed that the employed human labor cost accounted for the most significant contributor to the total cost, mainly since apple production is a labor-intensive agricultural activity compared to field cereal production. On the one hand, there are more significant limitations in substituting labor for machinery. On the other hand, it has become a trend for rural laborers to move to non-agricultural sectors with higher labor remuneration for employment, which exacerbates the cost of hiring labor.
It is necessary for local governments and other stakeholders to adopt more practical measures to improve related practices for the sustainable development of apple production. Firstly, government departments should further improve the regulatory mechanism for the establishment and operation of cooperatives to ensure the adequate performance of different functions of cooperatives and make contributions to the healthy development of the apple industry; and smallholder farmers should be encouraged to join cooperatives for apple production with a view to improving production efficiency while reducing environmental burdens and obtaining higher economic returns; infrastructure construction should be strengthened, such as water-saving irrigation facilities in research areas, to enhance the ability of producers to resist risk shocks; in addition, rural laborers should be encouraged to participate in agricultural production by enhancing agricultural subsidies, etc.
Secondly, the agricultural technology sectors should continuously improve the extension services of new technologies to enhance farmers’ perceived value while reducing the cost of farmers’ access to new technologies, such as the application of soil testing and formulated fertilization, replacement of chemical fertilizer with organic fertilizer, installation of insect trap lights to reduce pesticide use, etc. Thirdly, cooperatives should continuously improve their business literacy to play suitable roles in technical training and production standards making; and on this basis, they should further actively create independent brands and vigorously develop the rural e-commerce industry through live streaming with goods and other means to promote apple sales, thus achieving the win-win goal of reducing environmental burdens and production costs while increasing net economic profits. Fourthly, smallholder farmers should continue to raise their environmental awareness and bring into their ability to identify and adopt environmentally friendly agricultural materials at the farming stage so as to force the upstream production and supply sectors to meet their demand preferences and thus contribute to the mitigation of environmental burden in apple production from a whole life cycle perspective. In addition, smallholder farmers should be aware of the limitations of their agricultural production. They should actively join cooperatives to improve the standardization of production and thus obtain better environmental and economic performance.

Author Contributions

Conceptualization, J.C. and D.L.; methodology, Q.W.; software, J.C.; validation, Q.W. and J.Y.; formal analysis, J.C. and Q.W.; investigation, J.C. and D.L.; resources, J.C.; data curation, D.L.; writing—original draft preparation, J.C.; writing—review and editing, J.C. and J.Y.; visualization, D.L.; supervision, J.Y.; project administration, Q.W.; funding acquisition, J.Y. All authors have read and agreed to the published version of the manuscript.

Funding

This research was funded by the National Key R&D Program of China (grant numbers 2017YFE0181100), the Northwest Agriculture and Forestry University Program (grant numbers TGZX2021-44), and the College of Economics and Management in Northwest Agriculture and Forestry University Postgraduate Scientific Research Innovation Project (grant numbers JGYJSCXXM202205).

Institutional Review Board Statement

Not applicable.

Informed Consent Statement

Informed consent was obtained from all subjects involved in the study.

Data Availability Statement

The data presented in this study are available on request from the corresponding author. The data are not publicly available due to data management.

Conflicts of Interest

The authors declare no conflict of interest.

Abbreviations

As, arsenic; Cd, cadmium; CH4, methane; CNY, Chinese Yuan; CO, carbon monoxide; CO2, carbon dioxide; COD, chemical oxygen demand; Cu, copper; FU, functional unit; GHG, greenhouse gas; HC, hydrogen carbonate; K2O, potassium fertilizer; LCA, life cycle assessment; LCC, life cycle cost; LCI, life cycle inventory; N, nitrogen fertilizer; NH3, ammonia; NH4, ammonium nitrate; NO3, nitrate; NOx, nitrogen oxide; N2O, nitrogen dioxide; Pb, lead; PM10, inhalable particle matter; P2O5, phosphate fertilizer; Ptot, total phosphate; SLCA, cocial life cycle assessment; SOx, sulfur oxides; Zn, zinc.

References

  1. Dorward, A.; Kydd, J.; Morrison, J.; Urey, I. A Policy Agenda for Pro-Poor Agricultural Growth. World Dev. 2004, 32, 73–89. [Google Scholar] [CrossRef] [Green Version]
  2. Ma, W.; Zheng, H.; Yuan, P. Impacts of Cooperative Membership on Banana Yield and Risk Exposure: Insights from China. J. Agric. Econ. 2021, 1477–9552, 12465. [Google Scholar] [CrossRef]
  3. Markelova, H.; Meinzen-Dick, R.; Hellin, J.; Dohrn, S. Collective Action for Smallholder Market Access. Food Policy 2009, 34, 1–7. [Google Scholar] [CrossRef] [Green Version]
  4. Blekking, J.; Gatti, N.; Waldman, K.; Evans, T.; Baylis, K. The Benefits and Limitations of Agricultural Input Cooperatives in Zambia. World Dev. 2021, 146, 105616. [Google Scholar] [CrossRef]
  5. Manda, J.; Khonje, M.G.; Alene, A.D.; Tufa, A.H.; Abdoulaye, T.; Mutenje, M.; Setimela, P.; Manyong, V. Does Cooperative Membership Increase and Accelerate Agricultural Technology Adoption? Empirical Evidence from Zambia. Technol. Forecast. Soc. Chang. 2020, 158, 120160. [Google Scholar] [CrossRef]
  6. Zhang, S.; Sun, Z.; Ma, W.; Valentinov, V. The Effect of Cooperative Membership on Agricultural Technology Adoption in Sichuan, China. China Econ. Rev. 2020, 62, 101334. [Google Scholar] [CrossRef]
  7. Abebaw, D.; Haile, M.G. The Impact of Cooperatives on Agricultural Technology Adoption: Empirical Evidence from Ethiopia. Food Policy 2013, 38, 82–91. [Google Scholar] [CrossRef]
  8. Fischer, E.; Qaim, M. Linking Smallholders to Markets: Determinants and Impacts of Farmer Collective Action in Kenya. World Dev. 2012, 40, 1255–1268. [Google Scholar] [CrossRef] [Green Version]
  9. Ortega, D.L.; Bro, A.S.; Clay, D.C.; Lopez, M.C.; Tuyisenge, E.; Church, R.A.; Bizoza, A.R. Cooperative Membership and Coffee Productivity in Rwanda’s Specialty Coffee Sector. Food Secur. 2019, 11, 967–979. [Google Scholar] [CrossRef]
  10. Trebbin, A. Linking Small Farmers to Modern Retail through Producer Organizations–Experiences with Producer Companies in India. Food Policy 2014, 45, 35–44. [Google Scholar] [CrossRef]
  11. Li, H.; Liu, Y.; Zhao, X.; Zhang, L.; Yuan, K. Estimating Effects of Cooperative Membership on Farmers’ Safe Production Behaviors: Evidence from the Rice Sector in China. Environ. Sci. Pollut. Res. 2021, 28, 25400–25418. [Google Scholar] [CrossRef] [PubMed]
  12. Sarkar, A.; Wang, H.; Rahman, A.; Qian, L.; Memon, W.H. Evaluating the Roles of the Farmer’s Cooperative for Fostering Environmentally Friendly Production Technologies-a Case of Kiwi-Fruit Farmers in Meixian, China. J. Environ. Manag. 2022, 301, 113858. [Google Scholar] [CrossRef] [PubMed]
  13. Yu, L.; Chen, C.; Niu, Z.; Gao, Y.; Yang, H.; Xue, Z. Risk Aversion, Cooperative Membership and the Adoption of Green Control Techniques: Evidence from China. J. Clean. Prod. 2021, 279, 123288. [Google Scholar] [CrossRef]
  14. Deng, L.; Chen, L.; Zhao, J.; Wang, R. Comparative Analysis on Environmental and Economic Performance of Agricultural Cooperatives and Smallholder Farmers: The Case of Grape Production in Hebei, China. PLoS ONE 2021, 16, e0245981. [Google Scholar] [CrossRef]
  15. Saitone, T.L.; Sexton, R.J. Agri-Food Supply Chain: Evolution and Performance with Conflicting Consumer and Societal Demands. Eur. Rev. Agric. Econ. 2017, 44, 634–657. [Google Scholar] [CrossRef]
  16. Ma, W.; Abdulai, A. Does Cooperative Membership Improve Household Welfare? Evidence from Apple Farmers in China. Food Policy 2016, 58, 94–102. [Google Scholar] [CrossRef]
  17. Wang, C.; Li, X.; Gong, T.; Zhang, H. Life Cycle Assessment of Wheat-Maize Rotation System Emphasizing High Crop Yield and High Resource Use Efficiency in Quzhou County. J. Clean. Prod. 2014, 68, 56–63. [Google Scholar] [CrossRef]
  18. Cordes, H.; Iriarte, A.; Villalobos, P. Evaluating the Carbon Footprint of Chilean Organic Blueberry Production. Int. J. Life Cycle Assess. 2016, 21, 281–292. [Google Scholar] [CrossRef]
  19. Goossens, Y.; Annaert, B.; De Tavernier, J.; Mathijs, E.; Keulemans, W.; Geeraerd, A. Life Cycle Assessment (LCA) for Apple Orchard Production Systems Including Low and High Productive Years in Conventional, Integrated and Organic Farms. Agric. Syst. 2017, 153, 81–93. [Google Scholar] [CrossRef]
  20. Shen, X.; Zhang, L.; Zhang, J. Ratoon Rice Production in Central China: Environmental Sustainability and Food Production. Sci. Total Environ. 2021, 764, 142850. [Google Scholar] [CrossRef]
  21. Coppola, G.; Costantini, M.; Fusi, A.; Ruiz-Garcia, L.; Bacenetti, J. Comparative Life Cycle Assessment of Conventional and Organic Hazelnuts Production Systems in Central Italy. Sci. Total Environ. 2022, 826, 154107. [Google Scholar] [CrossRef] [PubMed]
  22. Keyes, S.; Tyedmers, P.; Beazley, K. Evaluating the Environmental Impacts of Conventional and Organic Apple Production in Nova Scotia, Canada, through Life Cycle Assessment. J. Clean. Prod. 2015, 104, 40–51. [Google Scholar] [CrossRef] [Green Version]
  23. Alaphilippe, A.; Boissy, J.; Simon, S.; Godard, C. Environmental Impact of Intensive versus Semi-Extensive Apple Orchards: Use of a Specific Methodological Framework for Life Cycle Assessments (LCA) in Perennial Crops. J. Clean. Prod. 2016, 127, 555–561. [Google Scholar] [CrossRef]
  24. Zhu, Z.; Jia, Z.; Peng, L.; Chen, Q.; He, L.; Jiang, Y.; Ge, S. Life Cycle Assessment of Conventional and Organic Apple Production Systems in China. J. Clean. Prod. 2018, 201, 156–168. [Google Scholar] [CrossRef]
  25. Khanali, M.; Kokei, D.; Aghbashlo, M.; Nasab, F.K.; Hosseinzadeh-Bandbafha, H.; Tabatabaei, M. Energy Flow Modeling and Life Cycle Assessment of Apple Juice Production: Recommendations for Renewable Energies Implementation and Climate Change Mitigation. J. Clean. Prod. 2020, 246, 118997. [Google Scholar] [CrossRef]
  26. Mathis, M.; Blom, J.F.; Nemecek, T.; Bravin, E.; Jeanneret, P.; Daniel, O.; de Baan, L. Comparison of Exemplary Crop Protection Strategies in Swiss Apple Production: Multi-Criteria Assessment of Pesticide Use, Ecotoxicological Risks, Environmental and Economic Impacts. Sustain. Prod. Consum. 2022, 31, 512–528. [Google Scholar] [CrossRef]
  27. Liang, L. Environmental Impact Assessment of Circular Agriculture Based on Life Cycle Assessment: Methods and Case Studies; China Agricultural University: Beijing, China, 2009. [Google Scholar]
  28. Cheng, J.; Wang, Q.; Yu, J.; Yoshikawa, N. Evaluation of Environmental Efficiency of Apple Production Based on LCA and SBM Models. J. Arid Land Resour. Environ. 2022, 36, 36–43. [Google Scholar] [CrossRef]
  29. Liang, L.; Wang, Y.; Ridoutt, B.G.; Lal, R.; Wang, D.; Wu, W.; Wang, L.; Zhao, G. Agricultural Subsidies Assessment of Cropping System from Environmental and Economic Perspectives in North China Based on LCA. Ecol. Indic. 2019, 96, 351–360. [Google Scholar] [CrossRef]
  30. Wang, Y.; Zhao, G. Life Cycle Assessment of Potential Pollutant-Induced Human Capital Loss Caused by Different Agricultural Production Systems in Beijing, China. J. Clean. Prod. 2019, 240, 118141. [Google Scholar] [CrossRef]
  31. Annaert, B.; Goossens, Y.; Geeraerd, A.; Mathijs, E.; Vranken, L. Calculating Environmental Cost Indicators of Apple Farm Practices Indicates Large Differences between Growers. Int. J. Agric. Sustain. 2017, 15, 527–538. [Google Scholar] [CrossRef]
  32. Longo, S.; Mistretta, M.; Guarino, F.; Cellura, M. Life Cycle Assessment of Organic and Conventional Apple Supply Chains in the North of Italy. J. Clean. Prod. 2017, 140, 654–663. [Google Scholar] [CrossRef]
  33. Cerutti, A.K.; Bruun, S.; Donno, D.; Beccaro, G.L.; Bounous, G. Environmental Sustainability of Traditional Foods: The Case of Ancient Apple Cultivars in Northern Italy Assessed by Multifunctional LCA. J. Clean. Prod. 2013, 52, 245–252. [Google Scholar] [CrossRef] [Green Version]
  34. Bartzas, G.; Vamvuka, D.; Komnitsas, K. Comparative Life Cycle Assessment of Pistachio, Almond and Apple Production. Inf. Process. Agric. 2017, 4, 188–198. [Google Scholar] [CrossRef]
  35. Svanes, E.; Johnsen, F.M. Environmental Life Cycle Assessment of Production, Processing, Distribution and Consumption of Apples, Sweet Cherries and Plums from Conventional Agriculture in Norway. J. Clean. Prod. 2019, 238, 117773. [Google Scholar] [CrossRef]
  36. Vinyes, E.; Asin, L.; Alegre, S.; Muñoz, P.; Boschmonart, J.; Gasol, C.M. Life Cycle Assessment of Apple and Peach Production, Distribution and Consumption in Mediterranean Fruit Sector. J. Clean. Prod. 2017, 149, 313–320. [Google Scholar] [CrossRef]
  37. Martin-Gorriz, B.; Zabala, J.A.; Sánchez-Navarro, V.; Gallego-Elvira, B.; Martínez-García, V.; Alcon, F.; Maestre-Valero, J.F. Intercropping Practices in Mediterranean Mandarin Orchards from an Environmental and Economic Perspective. Agriculture 2022, 12, 574. [Google Scholar] [CrossRef]
  38. Fathollahi, A.; Coupe, S.J. Life Cycle Assessment (LCA) and Life Cycle Costing (LCC) of Road Drainage Systems for Sustainability Evaluation: Quantifying the Contribution of Different Life Cycle Phases. Sci. Total Environ. 2021, 776, 145937. [Google Scholar] [CrossRef]
  39. Xu, Q.; Yang, Y.; Hu, K.; Chen, J.; Djomo, S.N.; Yang, X.; Knudsen, M.T. Economic, Environmental, and Emergy Analysis of China’s Green Tea Production. Sustain. Prod. Consum. 2021, 28, 269–280. [Google Scholar] [CrossRef]
  40. Yoshikawa, N.; Matsuda, T.; Amano, K. Life Cycle Environmental and Economic Impact of a Food Waste Recycling-Farming System: A Case Study of Organic Vegetable Farming in Japan. Int. J. Life Cycle Assess. 2021, 26, 963–976. [Google Scholar] [CrossRef]
  41. Zhao, Z.; Yan, S.; Liu, F.; Ji, P.; Wang, X.; Tong, Y. Effects of Chemical Fertilizer Combined with Organic Manure on Fuji Apple Quality, Yield and Soil Fertility in Apple Orchard on the Loess Plateau of China. Int. J. Agric. Biol. Eng. 2014, 7, 45–55. [Google Scholar] [CrossRef]
  42. Saber, Z.; Esmaeili, M.; Pirdashti, H.; Motevali, A.; Nabavi-Pelesaraei, A. Exergoenvironmental-Life Cycle Cost Analysis for Conventional, Low External Input and Organic Systems of Rice Paddy Production. J. Clean. Prod. 2020, 263, 121529. [Google Scholar] [CrossRef]
  43. Hesampour, R.; Taki, M.; Fathi, R.; Hassani, M.; Halog, A. Energy-Economic-Environmental Cycle Evaluation Comparing Two Polyethylene and Polycarbonate Plastic Greenhouses in Cucumber Production (from Production to Packaging and Distribution). Sci. Total Environ. 2022, 828, 154232. [Google Scholar] [CrossRef] [PubMed]
  44. Cheng, J.; Wang, Q.; Yu, J. Life Cycle Assessment of Concentrated Apple Juice Production in China: Mitigation Options to Reduce the Environmental Burden. Sustain. Prod. Consum. 2022, 32, 15–26. [Google Scholar] [CrossRef]
  45. Bessou, C.; Basset-Mens, C.; Latunussa, C.; Vélu, A.; Heitz, H.; Vannière, H.; Caliman, J.-P. Partial Modelling of the Perennial Crop Cycle Misleads LCA Results in Two Contrasted Case Studies. Int. J. Life Cycle Assess. 2016, 21, 297–310. [Google Scholar] [CrossRef]
  46. Bessou, C.; Basset-Mens, C.; Tran, T.; Benoist, A. LCA Applied to Perennial Cropping Systems: A Review Focused on the Farm Stage. Int. J. Life Cycle Assess. 2013, 18, 340–361. [Google Scholar] [CrossRef] [Green Version]
  47. Cerutti, A.K.; Beccaro, G.L.; Bruun, S.; Bosco, S.; Donno, D.; Notarnicola, B.; Bounous, G. Life Cycle Assessment Application in the Fruit Sector: State of the Art and Recommendations for Environmental Declarations of Fruit Products. J. Clean. Prod. 2014, 73, 125–135. [Google Scholar] [CrossRef]
  48. Vázquez-Rowe, I.; Villanueva-Rey, P.; Moreira, M.T.; Feijoo, G. Environmental Analysis of Ribeiro Wine from a Timeline Perspective: Harvest Year Matters When Reporting Environmental Impacts. J. Environ. Manag. 2012, 98, 73–83. [Google Scholar] [CrossRef]
  49. Ge, S.; Peng, L.; Ren, Y.; Jiang, Y. Effect of Straw and Biochar on Soil Bulk Density, Cation Exchange Capacity and Nitrogen Absorption in Apple Orchard Soil. Sci. Agric. Sin. 2014, 47, 366–373. [Google Scholar] [CrossRef]
  50. Wen, M.; Zheng, W.; Zhao, Z.; Wang, G.; Zhai, B.; Wang, Z. Effects of Different Fertilizer Treatments Combined with Green Manure Intercropping on Water and Thermal Properties and Nitrate Accumulation in Soils of Apple Orchard. J. Agric. Environ. Sci. 2016, 35, 1119–1128. [Google Scholar] [CrossRef]
  51. Brentrup, F.; Küsters, J.; Kuhlmann, H.; Lammel, J. Environmental Impact Assessment of Agricultural Production Systems Using the Life Cycle Assessment Methodology. Eur. J. Agron. 2004, 20, 247–264. [Google Scholar] [CrossRef]
  52. Lu, X.; Yue, Y.; Zhao, Z.; Zhang, H.; Zhao, Q.; Cao, L. Phosphorus Loss and Migration Characteristics in Paddy Fields under Different Fertilization Treatments. Chin. J. Eco-Agric. 2014, 22, 394–400. [Google Scholar]
  53. Ji, C.; Ding, M.; Wang, B.; Wang, C.; Zhao, Y. Comparative Evaluation of Chemical and Organic Fertilizer on the Base of Life Cycle Analysis Methods. Chin. J. Soil Sci. 2012, 43, 412–417. [Google Scholar] [CrossRef]
  54. Feng, L.; Yue, T.; Yuan, Y.; Wang, Z.; Han, X. Investigation and Risk Assessment of Heavy Metals in Apple of Shaanxi, Gansu and Shandong Provinces. Farm Prod. Process. 2017, 60–65. [Google Scholar] [CrossRef]
  55. Simon, S.; Brun, L.; Guinaudeau, J.; Sauphanor, B. Pesticide Use in Current and Innovative Apple Orchard Systems. Agron. Sustain. Dev. 2011, 31, 541–555. [Google Scholar] [CrossRef] [Green Version]
  56. Van Calker, K.J.; Berentsen, P.B.M.; de Boer, I.M.J.; Giesen, G.W.J.; Huirne, R.B.M. An LP-Model to Analyse Economic and Ecological Sustainability on Dutch Dairy Farms: Model Presentation and Application for Experimental Farm “de Marke”. Agric. Syst. 2004, 82, 139–160. [Google Scholar] [CrossRef]
  57. Nguyen, T.L.T.; Hermansen, J.E. System Expansion for Handling Co-Products in LCA of Sugar Cane Bio-Energy Systems: GHG Consequences of Using Molasses for Ethanol Production. Appl. Energy 2012, 89, 254–261. [Google Scholar] [CrossRef]
  58. Guo, X.-X.; Zhao, D.; Zhuang, M.-H.; Wang, C.; Zhang, F.-S. Fertilizer and Pesticide Reduction in Cherry Tomato Production to Achieve Multiple Environmental Benefits in Guangxi, China. Sci. Total Environ. 2021, 793, 148527. [Google Scholar] [CrossRef]
  59. Wang, M.; Wu, W.; Liu, W.; Bao, Y. Life Cycle Assessment of the Winter Wheat-Summer Maize Production System on the North China Plain. Int. J. Sustain. Dev. World Ecol. 2007, 14, 400–407. [Google Scholar] [CrossRef]
  60. IPCC. Contribution of Working Group I to the Fifth Assessment Report of the Intergovernmental Panel on Climate Change; IPCC: Cambridge, UK; New York, NY, USA, 2013. [Google Scholar]
  61. Nemecek, T.; von Richthofen, J.-S.; Dubois, G.; Casta, P.; Charles, R.; Pahl, H. Environmental Impacts of Introducing Grain Legumes into European Crop Rotations. Eur. J. Agron. 2008, 28, 380–393. [Google Scholar] [CrossRef]
  62. Yadav, P.; Athanassiadis, D.; Yacout, D.M.M.; Tysklind, M.; Upadhyayula, V.K.K. Environmental Impact and Environmental Cost Assessment of Methanol Production from Wood Biomass. Environ. Pollut. 2020, 265, 114990. [Google Scholar] [CrossRef]
  63. Huijbregts, M.A.J.; Steinmann, Z.J.N.; Elshout, P.M.F.; Stam, G.; Verones, F.; Vieira, M.; Zijp, M.; Hollander, A.; van Zelm, R. ReCiPe2016: A Harmonised Life Cycle Impact Assessment Method at Midpoint and Endpoint Level. Int. J. Life Cycle Assess. 2017, 22, 138–147. [Google Scholar] [CrossRef]
  64. Yang, Q.; Zhu, Y.; Wang, J. Adoption of Drip Fertigation System and Technical Efficiency of Cherry Tomato Farmers in Southern China. J. Clean. Prod. 2020, 275, 123980. [Google Scholar] [CrossRef]
  65. Jirapornvaree, I.; Suppadit, T.; Kumar, V. Assessing the Economic and Environmental Impact of Jasmine Rice Production: Life Cycle Assessment and Life Cycle Costs Analysis. J. Clean. Prod. 2021, 303, 127079. [Google Scholar] [CrossRef]
  66. Zhen, H.; Gao, W.; Jia, L.; Qiao, Y.; Ju, X. Environmental and Economic Life Cycle Assessment of Alternative Greenhouse Vegetable Production Farms in Peri-Urban Beijing, China. J. Clean. Prod. 2020, 269, 122380. [Google Scholar] [CrossRef]
  67. Wang, Y.; Li, X.; Xin, L.; Tan, M. Farmland Marginalization and Its Drivers in Mountainous Areas of China. Sci. Total Environ. 2020, 719, 135132. [Google Scholar] [CrossRef]
  68. Jardine, S.L.; Lin, C.-Y.C.; Sanchirico, J.N. Measuring Benefits from a Marketing Cooperative in the Copper River Fishery. Am. J. Agric. Econ. 2014, 96, 1084–1101. [Google Scholar] [CrossRef]
  69. Candemir, A.; Duvaleix, S.; Latruffe, L. Agricultural Cooperatives and Farm Sustainability–a Literature Review. J. Econ. Surv. 2021, 35, 1118–1144. [Google Scholar] [CrossRef]
  70. Notarnicola, B.; Sala, S.; Anton, A.; McLaren, S.J.; Saouter, E.; Sonesson, U. The Role of Life Cycle Assessment in Supporting Sustainable Agri-Food Systems: A Review of the Challenges. J. Clean. Prod. 2017, 140, 399–409. [Google Scholar] [CrossRef]
  71. Shen, S.; Wang, F.; Xue, C.; Zhang, K. Research Advances on Effect of Organic Fertilizer on Farmland Greenhouse Gas Emissions. China Soil Fertil. 2015, 1–8. [Google Scholar] [CrossRef]
  72. De Luca, A.I.; Iofrida, N.; Strano, A.; Falcone, G.; Gulisano, G. Social Life Cycle Assessment and Participatory Approaches: A Methodological Proposal Applied to Citrus Farming in Southern Italy: A New Methodological Proposal for Social-LCA. Integr. Environ. Assess. Manag. 2015, 11, 383–396. [Google Scholar] [CrossRef]
  73. Mojo, D.; Fischer, C.; Degefa, T. Social and Environmental Impacts of Agricultural Cooperatives: Evidence from Ethiopia. Int. J. Sustain. Dev. World Ecol. 2015, 22, 1–13. [Google Scholar] [CrossRef]
  74. Petti, L.; Sanchez Ramirez, P.K.; Traverso, M.; Ugaya, C.M.L. An Italian Tomato “Cuore Di Bue” Case Study: Challenges and Benefits Using Subcategory Assessment Method for Social Life Cycle Assessment. Int. J. Life Cycle Assess. 2018, 23, 569–580. [Google Scholar] [CrossRef]
Figure 1. Locations of the apple production system in the study area of Gansu Province in China.
Agriculture 12 01281 g001
Figure 2. System boundary for a life cycle assessment of the apple production system.
Agriculture 12 01281 g002
Figure 3. Contribution of agricultural material inputs to each environmental impact potential for the cooperatives.
Agriculture 12 01281 g003
Table 1. Apple production inputs in Baishui County of Shaanxi Province in 2020.
CharacteristicsArbor Orchards
CultivarFuji
Planting density (number of trees/ha)720
Tree height (m)3.85
PruningManual
Between-row management Mowing and mulching
Irrigation systemNo irrigation
Weed, pest, and disease control Mainly chemical
Harvest methodManual with garden ladder
Lifespan (years):40
-Orchard establishmentYear 1–3 (3 years)
-Productive stage (commercialized apples)Year 4–40 (37 years)
Annual average yield over the productive stage (t/ha/year) 17.82
Cumulated commercialized yield over orchard whole lifetime (t/ha)659.34
Note: Date from the survey of 175 apple growers in Qingcheng County.
Table 2. Input/yield list for one average productive year of apple production in Qingcheng County.
ItemUnitMean (Standard Deviation)
Smallholder FarmersCooperatives
Nkg/ha414.89 (238.59)379.42 (297.60)
P2O5kg/ha336.64 (219.80)326.28 (252.08)
K2Okg/ha289.97 (203.38)262.34 (212.16)
Organic fertilizerkg/ha386.21 (389.26)372.83 (310.35)
Pesticide (a.i.)kg/ha26.53 (21.27)24.18 (15.95)
-Including copperkg/ha0.66 (0.53)0.60 (0.40)
-Including sulfurkg/ha7.96 (6.38)7.26 (4.79)
Dieselkg/ha311.60 (313.89)289.43 (320.69)
ElectricitykWh/ha2822.29 (3420.28)2145.04 (3213.26)
Human labor h/ha7774.34 (4769.67)6354.94 (3143.86)
Yieldkg/ha16,532.43 (11,084.93)19,993.50 (13,778.6753)
Note: Date from the survey of 175 apple growers and own calculations (110 are smallholder farmers and 65 are cooperatives) in Qingcheng County. N: nitrogen fertilizer; P2O5: phosphate fertilizer; K2O: potassium fertilizer; a.i.: active ingredient.
Table 3. Life cycle inventory of producing 1 ton of apples by different growers in Qingcheng County. (Unit: kg/t).
ItemSmallholder FarmersCooperatives
Agricultural Material Production SubsystemFarming
Subsystem
TotalAgricultural Material Production SubsystemFarming
Subsystem
Total
Energy depletion (MJ/t)3699.92 887.57 4587.49 2924.80 734.16 3658.96
Land use (m2/t)604.87604.87500.17500.17
Hydrogen carbonate (HC)2.41 × 10−25.58 × 10−42.46 × 10−21.89 × 10−24.65 × 10−41.94 × 10−2
Carbon monoxide (CO)0.171.21 × 10−20.18 0.13 0.01 0.14
Carbon dioxide (CO2)377.98391.54769.52 299.37 252.67 552.04
Ammonia (NH3)0.13 2.60 2.73 0.10 2.09 2.19
Nitrogen dioxide (N2O)0.01 1.06 1.07 0.01 0.85 0.86
Nitrogen oxide (NOx)1.26 0.09 1.35 1.00 0.08 1.07
Nitrate (NO3)6.33 6.33 5.11 5.11
Sulfur oxides (SOx)1.08 0.08 1.15 0.85 0.06 0.92
Methane (CH4)0.52 0.52 0.42 0.42
Total phosphate (Ptot)0.16 0.08 0.24 0.13 0.06 0.19
Ammonium nitrate (NH4)0.06 61.28 61.34 0.05 51.02 51.07
Inhalable particle matter (PM10)0.16 0.02 0.17 0.12 0.02 0.14
Chemical oxygen demand (COD)3.29 3.29 2.61 2.61
Arsenic (As)1.17 × 10−61.17 × 10−69.01 × 10−79.01 × 10−7
Copper (Cu)2.92 × 10−77.05 × 10−57.07 × 10−52.25 × 10−55.76 × 10−55.78 × 10−5
Zinc (Zn)1.37 × 10−61.44 × 10−31.45 × 10−31.06 × 10−61.18 × 10−31.18 × 10−3
Lead (Pb)4.24 × 10−66.11 × 10−46.15 × 10−43.27 × 10−64.95 × 10−44.98 × 10−4
Zinc (Zn)1.11 × 10−59.35 × 10−39.36 × 10−38.56 × 10−67.51 × 10−37.52 × 10−3
Pesticides (to air)0.18 0.18 0.14 0.14
Pesticides (to water)0.02 0.02 0.01 0.01
Pesticides (to soil)0.77 0.77 0.60 0.60
Note: “–”means no emissions.
Table 4. Characterization of per ton of apple production in pollutant emissions.
Environmental Impact CategoryPollutant EmissionEquivalent CoefficientEnvironment Impact
Potential
Smallholder FarmersCooperativesSmallholder FarmersCooperatives
Global warming (kg) CO2-eq
CO2769.52552.04 1769.52552.04
CO0.180.14 20.360.28
CH461.3451.07 281717.521429.96
N2O1.070.86 265283.55227.9
Total2770.952210.18
Acidification (kg) SO2-eq
SOx1.150.92 11.150.92
NH32.732.19 1.885.134.12
NOx1.351.07 0.70.950.75
Total7.235.79
Aquatic eutrophication (kg) PO4-eq
Ptot0.240.19 3.060.730.58
NO36.335.11 0.10.630.51
NH40.520.42 0.330.170.14
NH32.371.90 0.330.780.63
COD3.292.61 0.0220.070.06
Total2.391.92
Note: The value of CO2-eq is according to IPCC [60], SO2-eq and PO4-eq are according to Guo et al. [58].
Table 5. Characterization of per ton of apple production in human toxicity, aquatic eco-toxicity, and soil eco-toxicity.
Environmental Impact CategoryPollutant EmissionEquivalent CoefficientEnvironment Impact Potential
Smallholder FarmersCooperativesSmallholder FarmersCooperatives
Human toxicity (kg) 1,4-DCB-eq
Mancozeb 5.3 × 10−24.14 × 10−24.80.250.20
Carbendazim 4.46 × 10−23.49 × 10−2190.850.66
Chlorothalonil 3.2 × 10−22.5 × 10−28.40.270.21
Chlorpyrifos 1.0 × 10−38.0 × 10−42.12.18 × 10−31.7 × 10⁻³
Omethoate 2.07 × 10−21.62 × 10−2440.910.71
Atrazine 1.73 × 10−21.35 × 10−24.50.080.06
Total2.361.85
Aquatic eco-toxicity (kg) 1,4-DCB-eq
Mancozeb 5.3 × 10−34.1 × 10−328,000148.40114.80
Carbendazim 4.5 × 10−33.5 × 10−338,000171.00133.00
Chlorothalonil 3.2 × 10−32.5 × 10−33701.180.93
Chlorpyrifos 1.0 × 10−48.0 × 10−5640,00064.0051.20
Omethoate 2.1 × 10−31.6 × 10−31700.360.27
Atrazine 1.7 × 10−31.3 × 10−350008.506.50
As1.17 × 10−69.01 × 10−72102.46 × 10−41.89 × 10⁻⁴
Cd7.49 × 10−76.78 × 10−615001.12 × 10−31.02 × 10⁻²
Cu4.52 × 10−57.68 × 10−512005.42 × 10−29.22 × 10⁻²
Pb1.55 × 10−54.85 × 10−59.61.49 × 10−44.66 × 10⁻⁴
Zn8.43 × 10−33.20 × 10−4920.780.03
Total394.27306.83
Soil eco-toxicity (kg) 1,4-DCB-eq
Mancozeb 0.230.18163.652.85
Carbendazim 0.190.15499.417.35
Chlorothalonil 0.140.110.680.090.07
Chlorpyrifos 4.5 × 10−33.5 × 10−39304.153.24
Omethoate 8.92 × 10−26.96 × 10−20.80.070.06
Atrazine 7.43 × 10−25.8 × 10−26.60.490.38
Cd7.0 × 10–55.1 × 10−51701.19 × 10−28.67 × 10⁻³
Cu1.4 × 10–31.1 × 10−3141.96 × 10−21.54 × 10⁻²
Pb6.0 × 10−44.5 × 10−4330.020.01
Zn9.3 × 10−47.2 × 10−3250.020.18
Total17.9314.16
Note: The value of 1,4-DCB-equivalent is according to Zhu et al. [24] and Huijbregts et al. [63].
Table 6. Normalization and weighting of per ton of apple production in environmental impacts.
Environmental Impact CategoryUnitReference ValueNormalization ValueWeight ValueTotal Environmental Index
Smallholder FarmersCooperativesSmallholder FarmersCooperatives
Energy depletionMJ/t2,590,4571.77 × 10−31.41 × 10−30.152.66 × 10−42.12 × 10⁻⁴
Land usem2/t988.170.610.510.130.080.07
Global warmingkg CO2-eq/t68690.400.320.120.050.04
Acidificationkg SO2-eq/t52.260.140.110.141.94 × 10−21.55 × 10⁻²
Aquatic eutrophicationkg PO4-eq/t1.881.271.020.120.150.12
Human toxicitykg 1,4-DCB-eq/t197.211.2 × 10−29.0 × 10 − 30.141.68 × 10−31.31 × 10⁻³
Aquatic eco-toxicitykg 1,4-DCB-eq/t4.8381.6363.530.118.986.99
Soil eco-toxicitykg 1,4-DCB-eq/t6.112.932.320.090.260.21
Total9.557.44
Note: The reference value and weight value according to Liang [27] and Wang et al. [17].
Table 7. Life cycle cost and net profit per ton of apple production.
ItemCosts per UnitSmallholder Farmers (CNY/t)Cooperative (CNY/t)
Global warming0.46 CNY/kg CO2−eq1274.641016.68
Acidification38.50 CNY/kg SO2−eq278.36222.92
Aquatic eutrophication4.65 CNY/kg PO4−eq11.118.93
Human toxicity0.77 CNY/kg 1,4−DCB−eq1.821.42
Aquatic eco-toxicity0.08 CNY/kg 1,4−DCB−eq31.5424.55
Soil eco-toxicity0.08 CNY/kg 1,4−DCB−eq1.431.13
Total environmental cost 1598.901275.63
Fertilizer
N5.35 CNY/kg137.33110.00
P2O56.25 CNY/kg142.56109.81
K2O5.18 CNY/kg101.9474.13
Organic fertilizer8.55 CNY/kg245.30202.46
Pesticide
Mancozeb85 CNY/kg45.0535.18
Carbendazim90 CNY/kg40.1831.38
Chlorothalonil115 CNY/kg36.7728.71
Chlorpyrifos80 CNY/kg8.306.48
Omethoate69 CNY/kg14.3111.17
Atrazine75 CNY/kg12.9610.12
Diesel7.25 CNY/kg139.49116.15
Electricity0.5 CNY/kWh94.0871.50
Human labor (employed)9500 CNY/ha570.00475.00
Total variable cost 1588.261282.08
Insurance charge540 CNY/ha32.427
Mechanical depreciation cost25 CNY/set7575
Total fixed cost 107.4102
Total economic cost 1695.661384.08
LCC 3294.562659.71
Economic income5.65 CNY/kg56505650
Net profit 2355.442990.29
Note: The damage costs of global warming, acidification, human toxicity, and aquatic eco-toxicity were derived from Guo et al. [58] and Yadav et al. [62]. The damage costs of aquatic eutrophication and soil eco-toxicity were derived from Annaert et al. [31] and Guo et al. [58]. The economic cost and apple price data come from survey data of 175 apple farmers. The unit price of fertilizer and pesticide were calculated based on the effective substances.
Publisher’s Note: MDPI stays neutral with regard to jurisdictional claims in published maps and institutional affiliations.

