Article

Precise Monitoring of Lettuce Functional Responses to Minimal Nutrient Supplementation Identifies Aquaponic System’s Nutrient Limitations and Their Time-Course

1
Department of Agriculture Crop Production and Rural Environment, School of Agricultural Sciences, University of Thessaly, GR-38446 Volos, Greece
2
Department of Veterinary Medicine, Aristotle University of Thessaloniki, GR-54006 Thessaloniki, Greece
3
Department of Ichthyology and Aquatic Environment, School of Agricultural Sciences, University of Thessaly, GR-38446 Volos, Greece
4
Department of Animal Production, Fisheries and Aquaculture, School of Agricultural Sciences, University of Patras, GR-30200 Patras, Greece
5
ATC Automation Systems, Nikomachou 42, GR-11631 Athens, Greece
*
Author to whom correspondence should be addressed.
Agriculture 2022, 12(8), 1278; https://doi.org/10.3390/agriculture12081278
Submission received: 20 July 2022 / Revised: 18 August 2022 / Accepted: 19 August 2022 / Published: 22 August 2022
(This article belongs to the Special Issue Effects of Abiotic Stress on Horticultural Crops)

Abstract

:
In aquaponics, a closed-loop system which combines fish and crop production, essential nutrients for plant growth are often at sub-optimal concentrations. The aim of the present study was to identify system limitations and thoroughly examine the integrated response of its components to minimal external inputs, notably crop’s functional parameters, fish performance, and microorganism profile. Lettuce and red tilapia were co-cultivated under only Fe and Fe with K supplementation and their performance was evaluated against the control of no nutrient addition. Photosynthesis, the photosynthetic apparatus state, and efficiency, pigments, leaf elemental composition, and antioxidant activity of lettuce were monitored throughout the growth period, along with several parameters related to water quality, fish growth, plant productivity and bacterial community composition. Nutrient deficiency in control plants severely impacted gas exchange, PSII efficiency, and chlorophyll a content, from day 14 of the experiment, causing a significant increase in dissipation energy and signs of photoinhibition. Fe+K input resulted in 50% and two-fold increase in lettuce production compared with Fe and control groups respectively. Nutrient supplementation resulted in higher specific growth rate of tilapias, but did not affect root microbiota which was distinct from the water bacterial community. Collectively, the results emphasize the importance of monitoring crop’s functional responses for identifying the system’s limitations and designing effective nutrient management to sustain the reduced environmental footprint of aquaponics.

1. Introduction

Aquaponics is an integrated crop and fish production system, which operates according to the circular economy concept to produce food. It combines hydroponics and fish farming [1], connecting the two sub-systems through the recirculating water and the diluted nutrients. Fish metabolism and uneaten feed enriches the water with essential nutrients for plant growth. The nitrogen cycle is predominant in aquaponics, which includes the transformation of ammonia being produced by fish to nitrates, a useful nitrogen source for plants, by bacteria through the nitrification process [2]. This way, plants, fish and bacteria coexist in a balanced common system. The conversion of wastes to resources makes aquaponics a promising and environmentally friendly technique which under certain conditions may permit economic benefits compared with the conventional production systems.
The only nutrient source for plants in coupled aquaponics derives from fish feed and fish metabolic processes. According to FAO (2014) [3], a 60–70% of fish feed is eventually released from fish to water via faece, urine, and ammonia. Additionally, it is estimated that 5% of the offered fish feed is not consumed and subsequently diluted to water [4]. Based on the above estimations, Endut et al. (2010) [5] calculated the range of fish feed quantity that could meet the leafy green’s needs at 15–42 g m−2 day−1. However, the lack or the inadequate amounts of essential nutrients for the plants in commercial fish feed induce nutrient deficiencies to crops compromising their productivity and quality [6,7]. Potassium (K), iron (Fe) and calcium (Ca) are the most common nutrients being at sub-optimal levels in aquaponic systems [8]. K is a functional macronutrient affecting photosynthesis, protein synthesis, and osmotic potential, while it is crucial in regulating stomatal opening [9]. Iron deficiency reflects upon various biochemical and physiological processes of the plant, since it is an important constituent of molecular complexes involved in the photosynthetic electron transport chain and a co-factor of many enzymes, including those involved in chlorophyll (chl) biosynthesis [10,11].
Several studies have demonstrated the need for nutrient supplementation in coupled aquaponics systems [12,13,14,15]. Most of the relevant works, however, have included high rates of many macro- and micro-nutrients to ensure maximal crop productivity, targeting the values of hydroponic solutions. This approach compromises the environmental footprint of the system, nullifying its main advantage which is nutrient recovery and re-use among the three components (i.e., fish, bacteria, plants). Additionally, the closed-loop aquaponics operation is primarily based on the maintenance of an equilibrium among the above-mentioned components, which may be possibly lost in the long-term after chemical additions. Minimum external nutrient inputs would probably address the need for both achieving nutrient optimal concentrations and maintaining the equilibrium. Finding and fine-tuning the proper nutrient mixture and rate of application is definitely a multifaceted issue depending on fish and plant species involved, stock density, and system physicochemical parameters, thus requiring an extensive study of fish and plant physiology under the prevailing conditions. Regarding plants, the relevant literature is mainly restricted to growth and yield evaluation [16,17]. Although effective measures of the productivity potential of an aquaponic system, these alone are inadequate to describe the performance of the system when several variables change. Alternatively, the study of the functional responses of plants could address the above-described issues by identifying system constraints and indicating possible management practices.
The aim of the present study was a thorough assessment of the performance of a laboratory-scale aquaponic system, in terms of plant physiological and biochemical attributes, fish growth, and microorganism profile when only Fe and Fe with K supplementation are performed in comparison to the control of no such inputs. In an attempt to identify the weak points of the system and the time course of their appearance, the photosynthetic performance, status of the photosynthetic machinery, stress indicators, pigments content and antioxidant activity of lettuce (Lactuca sativa var. Romana), co-cultivated with red tilapia (Oreochromis sp.) were monitored throughout the growth period. Several water quality, fish growth, and plant productivity parameters were also assessed along with microorganisms’ groups identification in order to dissect sub-systems’ functional responses to minimal external inputs. To the best of our knowledge, the synthesis of all these responses produces the most comprehensive picture of the whole system performance reported in the aquaponics-related literature.

2. Materials and Methods

2.1. Experimental Design and Laboratory Conditions

The experiment took place at the Aquaculture Laboratory-section Aquaponics, Department of Ichthyology and Aquatic Environment, School of Agricultural Sciences, University of Thessaly, Greece. The laboratory operated in a fully controlled environment, with a climate controlling equipment (Opticlimate, model 15,000 PRO3&PRO4) continuously measuring and regulating room temperature at 20.9 ± 0.15 °C and relative humidity at 59.4 ± 0.5% throughout the experiment. Nine autonomous lab-scale closed-loop aquaponic systems were used (Figure 1) to co-cultivate lettuce and red tilapias under three treatments:
(a)
Control, incorporating only the recirculating aquaponic water with no further nutrient input,
(b)
Fe treatment, where iron was supplemented,
(c)
Fe+K treatment, where iron and potassium were added.
The iron was supplemented as chelated Fe-DTPA (GEOLIX EPE, Chelated Iron DTPA 11%) at the target concentration of 40μmol L−1 in the water and the potassium as potassium sulphate (K2SO4, HONEYWELL FLUKA) at 10 mmol L−1, following the respective targets used for hydroponics lettuce cultivation [18]. The initial nutrient addition was performed five days after the commencement of the experiment, in order to allow a period of plant equilibration in the aquaponic system before applying the treatments, to overcome potential transplantation stress. The iron and potassium level fluctuation was continually monitored once a week at the inlet point of hydroponic units. The collected water was filtered by glass fiber syringe filters (0.7 μm) and measured promptly. The iron concentrations were determined photometrically (HACH, DR3900) with iron reagents (HACH, Iron TPTZ Method 8112) and potassium was measured by a flame photometer (JENWAY, PFP7 Flame Photometer) following corresponding potassium standard curves. After calculating the amounts to be added, the corresponding iron and potassium reagents were diluted in non-chlorine water and added at the sump tank of the systems.
Three aquaponic systems per treatment were used and the experiment lasted for 45 days during December–January 2020, until the plants reached the marketable size.

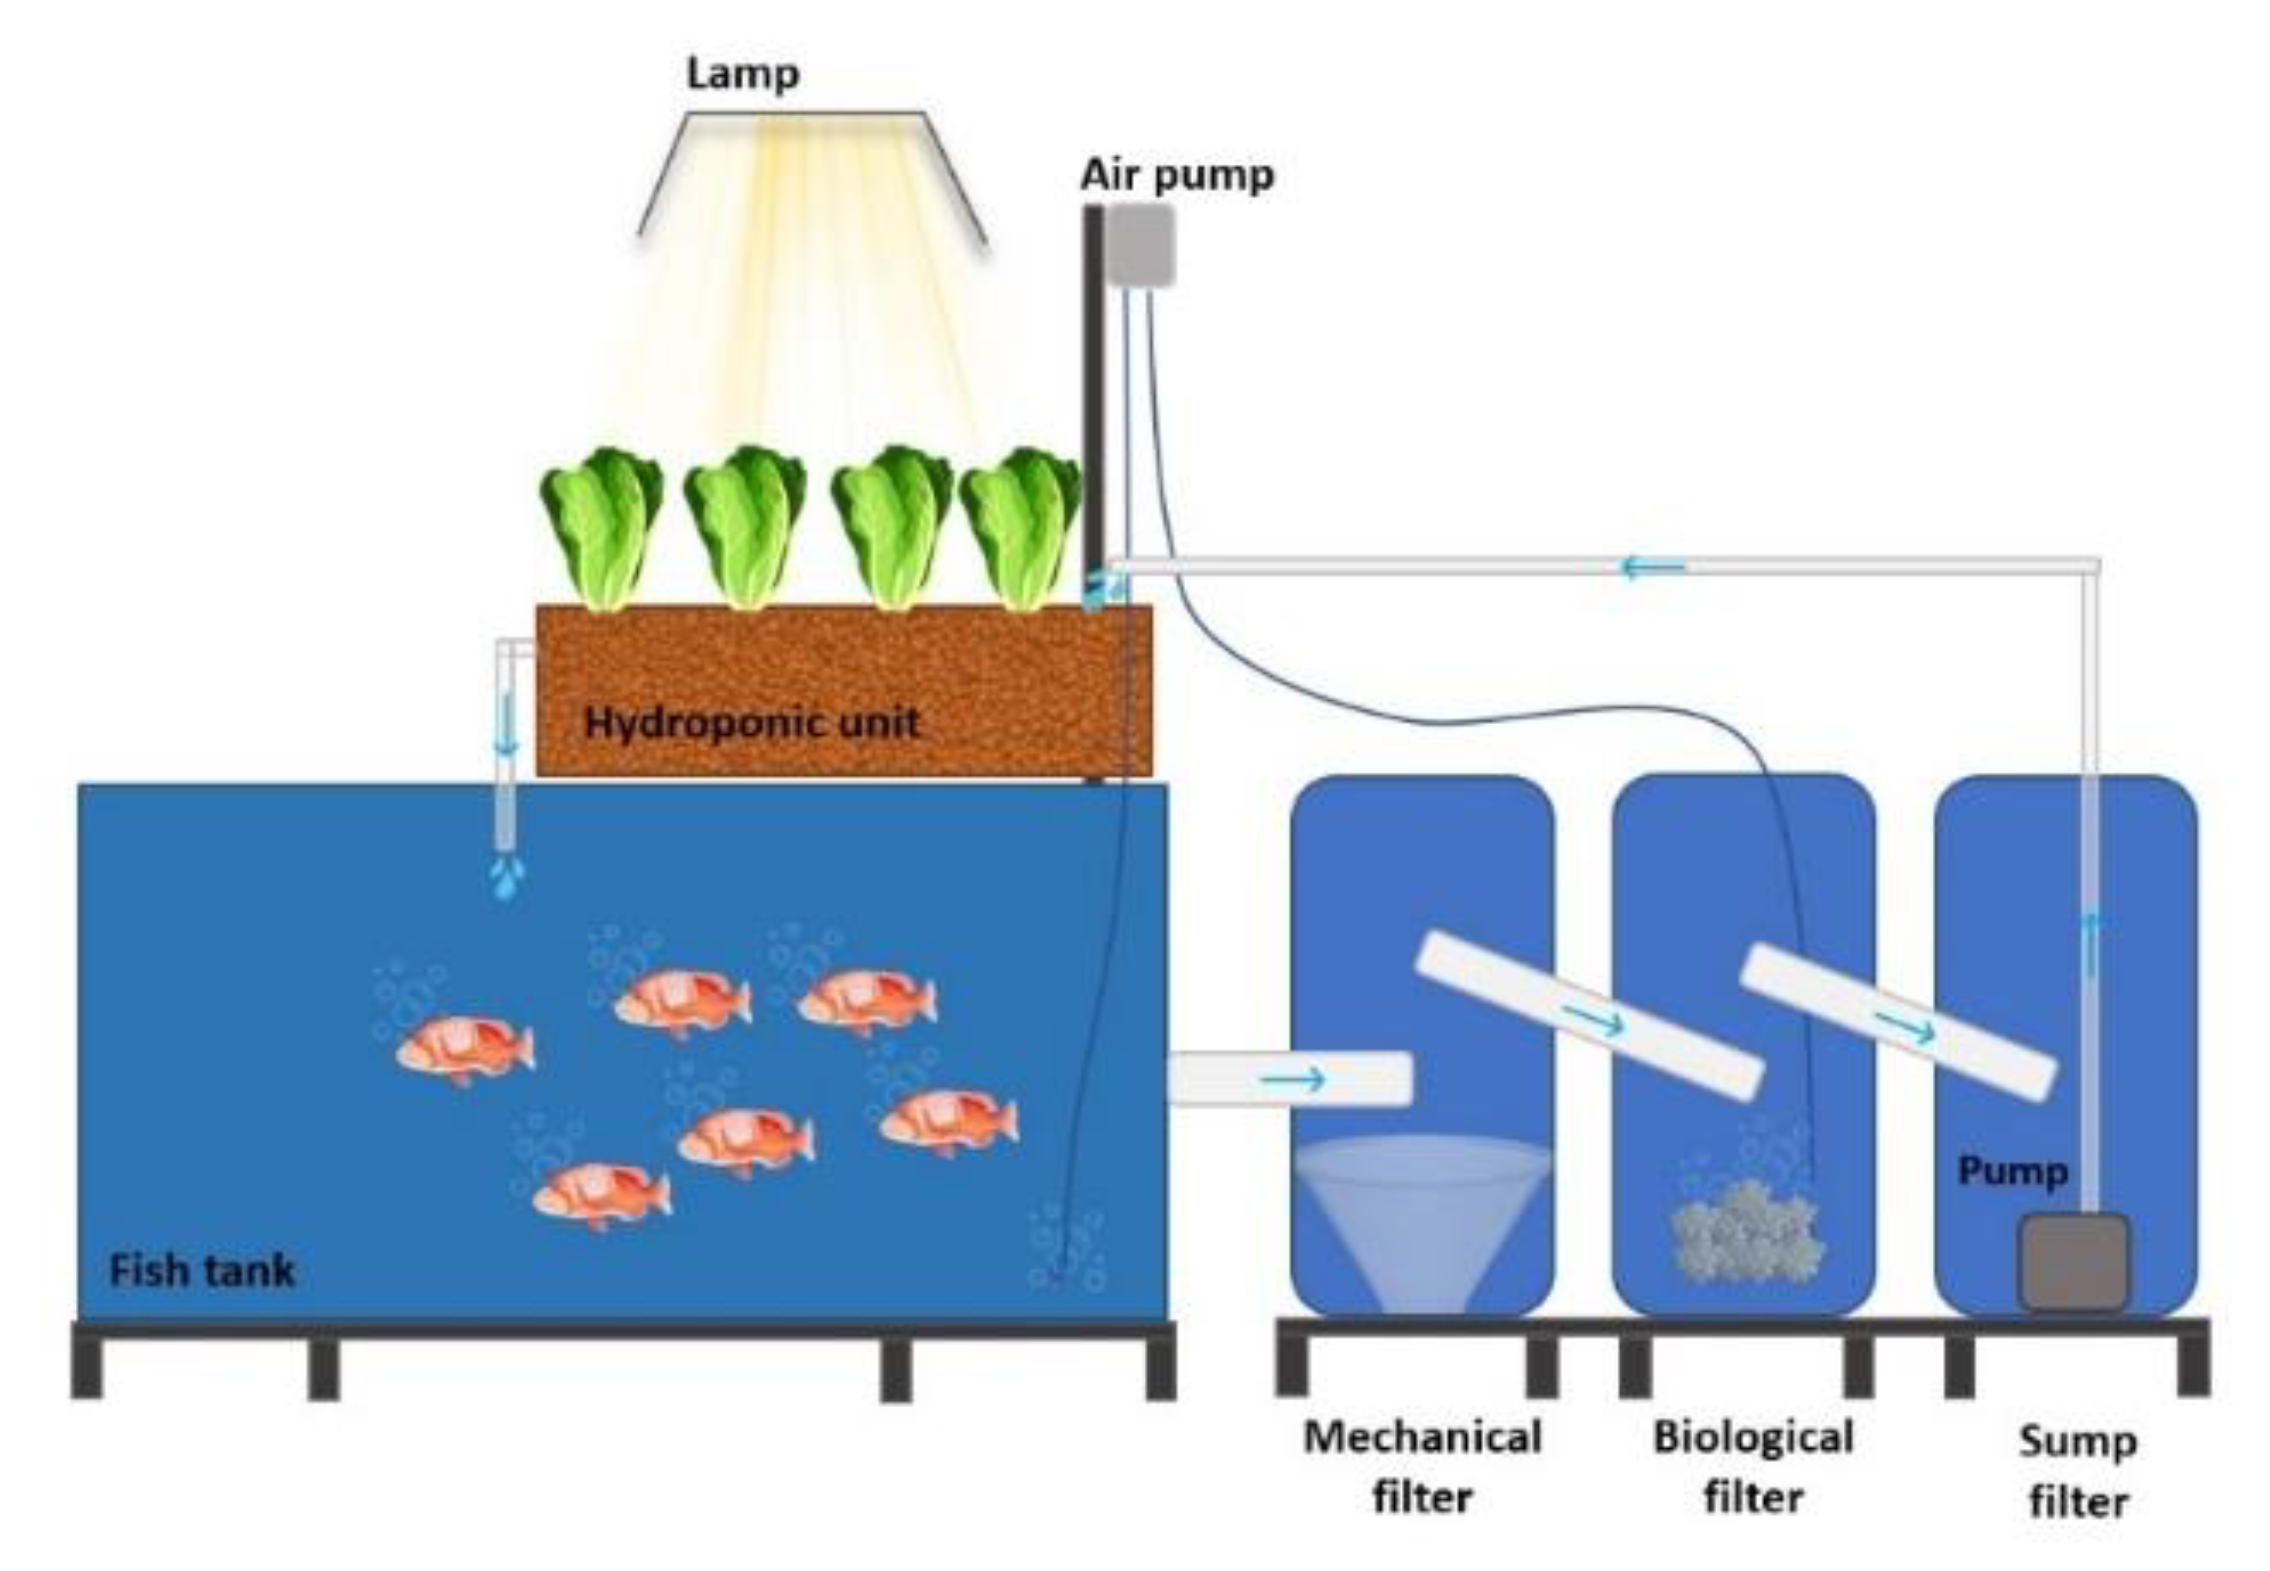
2.2. Aquaponic Systems

Each system (630 L total water volume) consisted of a fish rearing tank of 400 L water volume, and a hydroponic media bed (area of 1 m2 and depth of 20 cm) of 50 L water containing capacity, which was filled with clay pebbles (8–16 mm) as a substrate. The water flowed from the fish tank to the grow-bed through a system of consecutive filters, i.e., mechanical, biological and sump filter, placed in three interconnecting containers with a total volume of 180 L (Figure 1). The mechanical filter consisted of layers of fiberglass (10 cm height) and a coarse filter (EHEIM FIX) to withhold solid fish wastes and uneaten feed. The biological filter was made up of 10 L cylindrical substrate K1 Kaldness media (11 mm) colonised by nitrifying bacteria (PRODIBIO, Biodigest) that carried out the nitrification process. The pre-experiment set up of the biological filter lasted for one month at the end of which effective oxidation of ammonia to nitrate was obtained. A pump (HAILEA-hx-8830, 45 W, 2900 L h−1, hmax 2.3 m) was placed in the third container to ensure the continuous flow of filtered water (Q = 306 L h−1) towards to grow-bed. A bell syphon was inserted in the grow-bed for the flood/drain process, also providing aeration to plant roots. The aeration of fish tanks and biological filters was supported by air pumps (HAILEA, ACO-328, 70 L min−1), which kept dissolved oxygen (DO) at 8 mg L−1. The water temperature was kept constant in all systems during the experiment at 23 °C by heaters (AQUAEL, Comfort Zone Gold, 300 W).

2.3. Monitoring of Water Physicochemical Parameters and Nutrient Concentrations

pH was monitored daily while electrical conductivity (EC, uS cm−1) and DO (mg L−1) were recorded three times a week. The measurements were performed at the middle of fish tanks with multimeter sensors for pH and DO (HACH, HQ40d), and with a conductivity meter for EC (CRISON, CM35).
The concentration of nutrients in the water was measured on a weekly basis using the same water sample as per Fe and K determination described above. The following nutrients were determined photometrically (HACH, DR3900) with pre weighted powder reagents: NH3 (Salicylate Method, 8155), NO2 (USEPA Diazotization Method, 8507) NO3 (Cadmium Reduction Method, 8039), PO43− (USEPA PhosVer 3, Ascorbic Acid Method, 8048), and SO42− (USEPA, SulfaVer 4 Method, 8051). Also, calcium (Ca2+) and sodium (Na) absorptions measured by flame photometer (JENWAY, PFP7 Flame Photometer) and the concentrations were estimated by the corresponding standard curves.

2.4. Tilapia Rearing Conditions and Measurements

Red tilapias (Oreochromis spp.) were reproduced and reared for six months before the experiment on the premises of the Aquaponics laboratory. All experimental procedures were conducted according to the guidelines of the EU Directive 2010/63/EU regarding the protection of animals used for scientific purposes and were applied by FELASA accredited scientists (functions A–D). Before the commencement of the experiment, a total of 270 fish was acclimatized for 15 days in the systems tanks. After this period, fish were weighted and equally distributed at the nine aquaponic systems. The number of fish per system was determined using the equation of carrying capacity of an aquarium proposed by Hirayama (1974) [19]. The carrying capacity is derived from the rates of pollution and possible purification in a closed culture system or aquarium. To estimate the exact number of fish, the oxidizing capacity of the filter and the pollution load were calculated. In each system, thirty red tilapias were introduced, with 16.03 ± 0.36 g initial body weight and 9.95 ± 0.08 cm length. The water temperature was kept at 23 °C and the DO at 8 mg L−1 as described in paragraph 2.2 and the light program was set at 10Light:14Dark as analysed in paragraph 2.5. Fish were fed ad libitum six days a week and two times a day (10:00 and 16:00) with a commercial fish feed of 2 mm, which contained 47.5% crude protein, 6.5% crude fat, 2.0% crude fiber and 6.0% moisture (Tetra, Tetra discus granules). The amount of feed consumed was determined by weighting before and after daily meals (g day−1). The faeces were daily removed from the fish tanks by siphoning and the material of mechanical filter was cleaned three times a week with tap water. At the end of the experiment fish were weighted again and final biomass was assessed. During this process, fish were anesthetized with Tricaine methansulfonate (MS 222, 5 mg L−1). The survival rate (S) was calculated by the following equation:
S   ( % ) = ( F i n a l   n u m b e r   o f   f i s h I n i t i a l   n u m b e r   o f   f i s h ) × 100
Also, the specific growth rate (SGR) was calculated by the following equation:
S G R   ( % / d a y ) = ( ln ( f i n a l   w e i g h t ) ln ( i n i t i a l   w e i g h t ) Δ t ) × 100
Also, the feed conversion ratio (FCR) was calculated as follows:
F C R = C o n s u m e d   f e e d   ( g ) ( F i n a l   w e i g h t I n i t i a l   w e i g h t )   ( g )

2.5. Lettuce Growth Conditions

Lettuce seeds were germinated in seed trays containing soil and perlite (1:1, v/v) in a greenhouse. At the stage of six true leaves, the seedlings were brought indoor for a three-day acclimatization at the laboratory conditions. A total of 72 plants with equal height, number of leaves, and shape were selected and distributed at the systems. Before transplanting, roots were carefully washed with tap water to completely remove the soil, without damaging the roots. Eight individuals were planted in each grow-bed (24 plants per treatment), 20 cm apart. Plants were grown under artificial light provided by an HPS lamp of 600 W (SYLVANIA, 230 V) which was placed above each grow-bed. Care was taken in arranging the position of the plants to ensure the homogeneity of the light environment. The photosynthetically active radiation (PAR) ranged from 350–450 µmol m−2 s−1 (SKYE, PAR meter) and the photoperiod was set at 10Light:14Dark and was controlled by a timer. Foliar application of calcium (LASTING, Lasting Ca) in all plant groups was performed (1 mL/m2) twice a week to avoid calcium deficiencies.

2.6. Measurement of Plant Physiological and Biochemical Characteristics during the Experimental Period

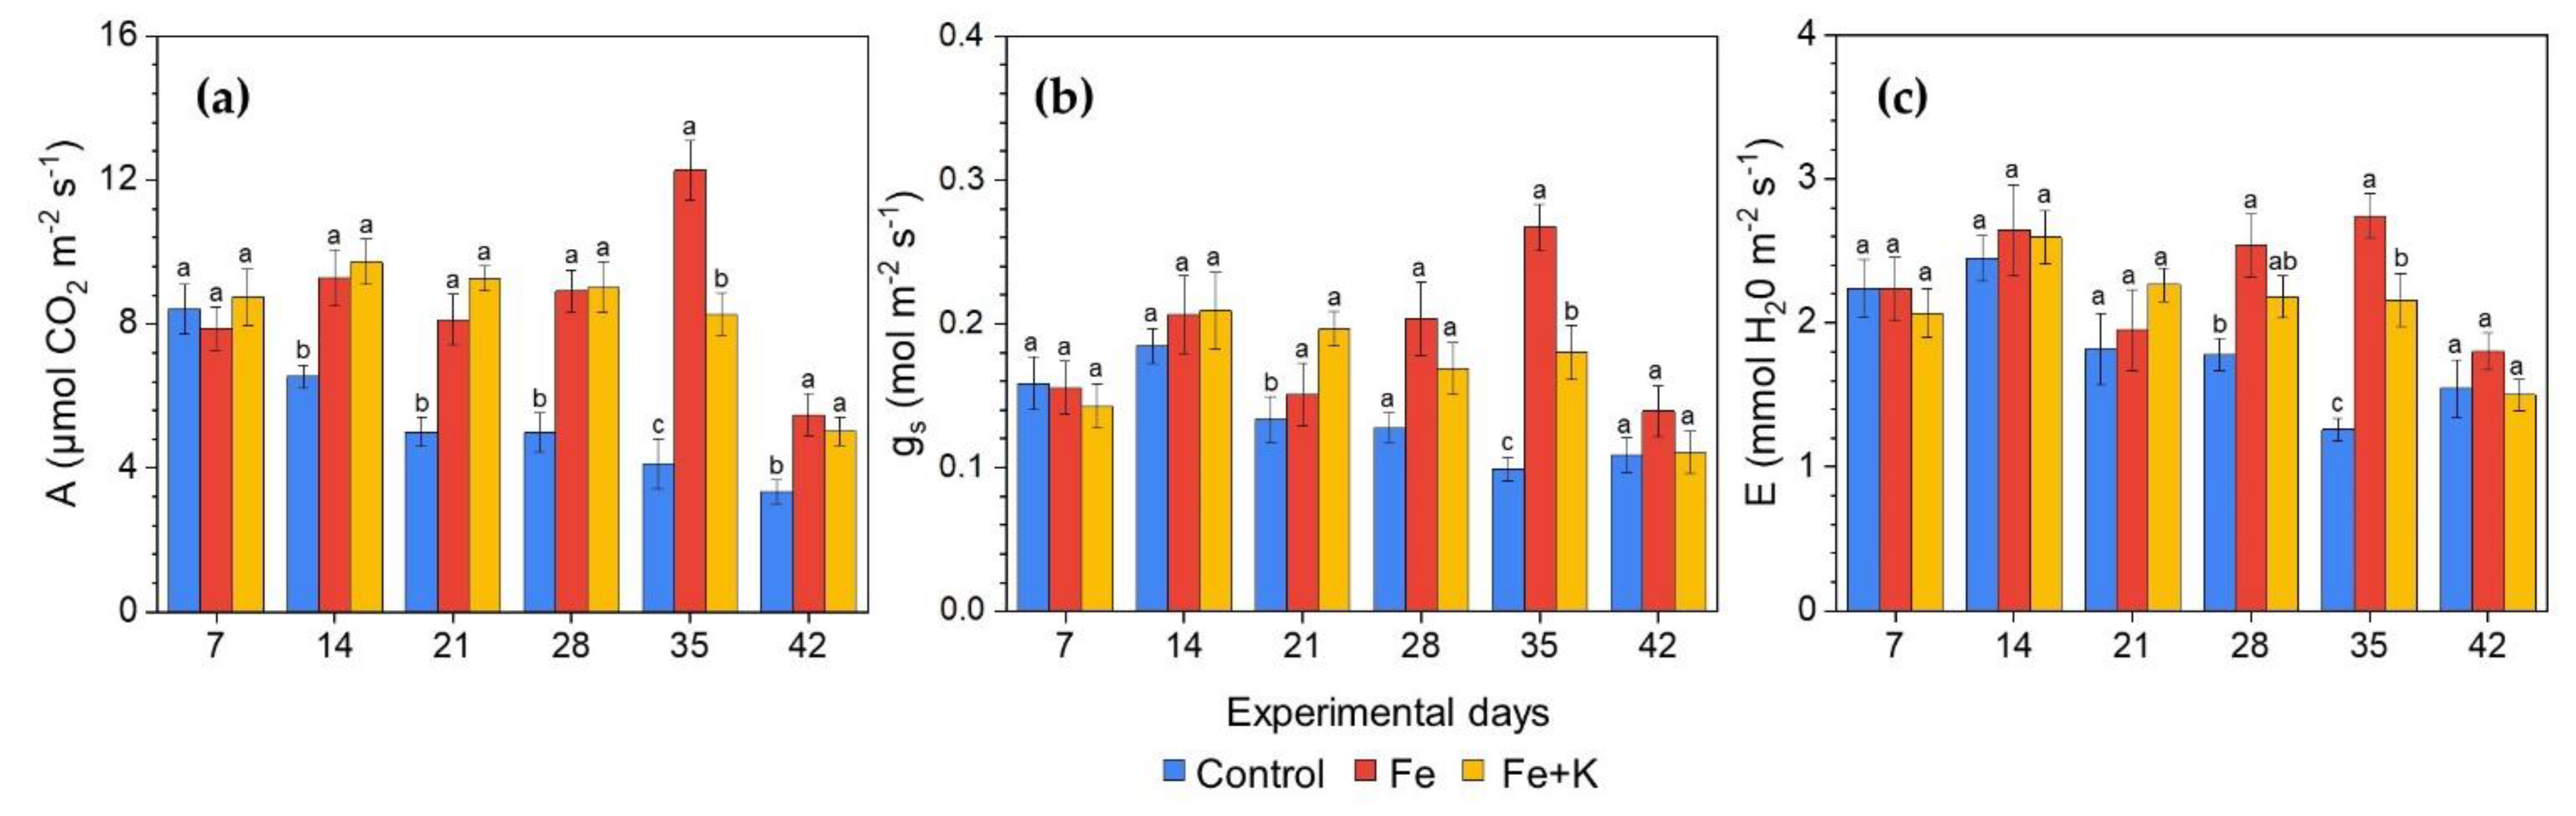
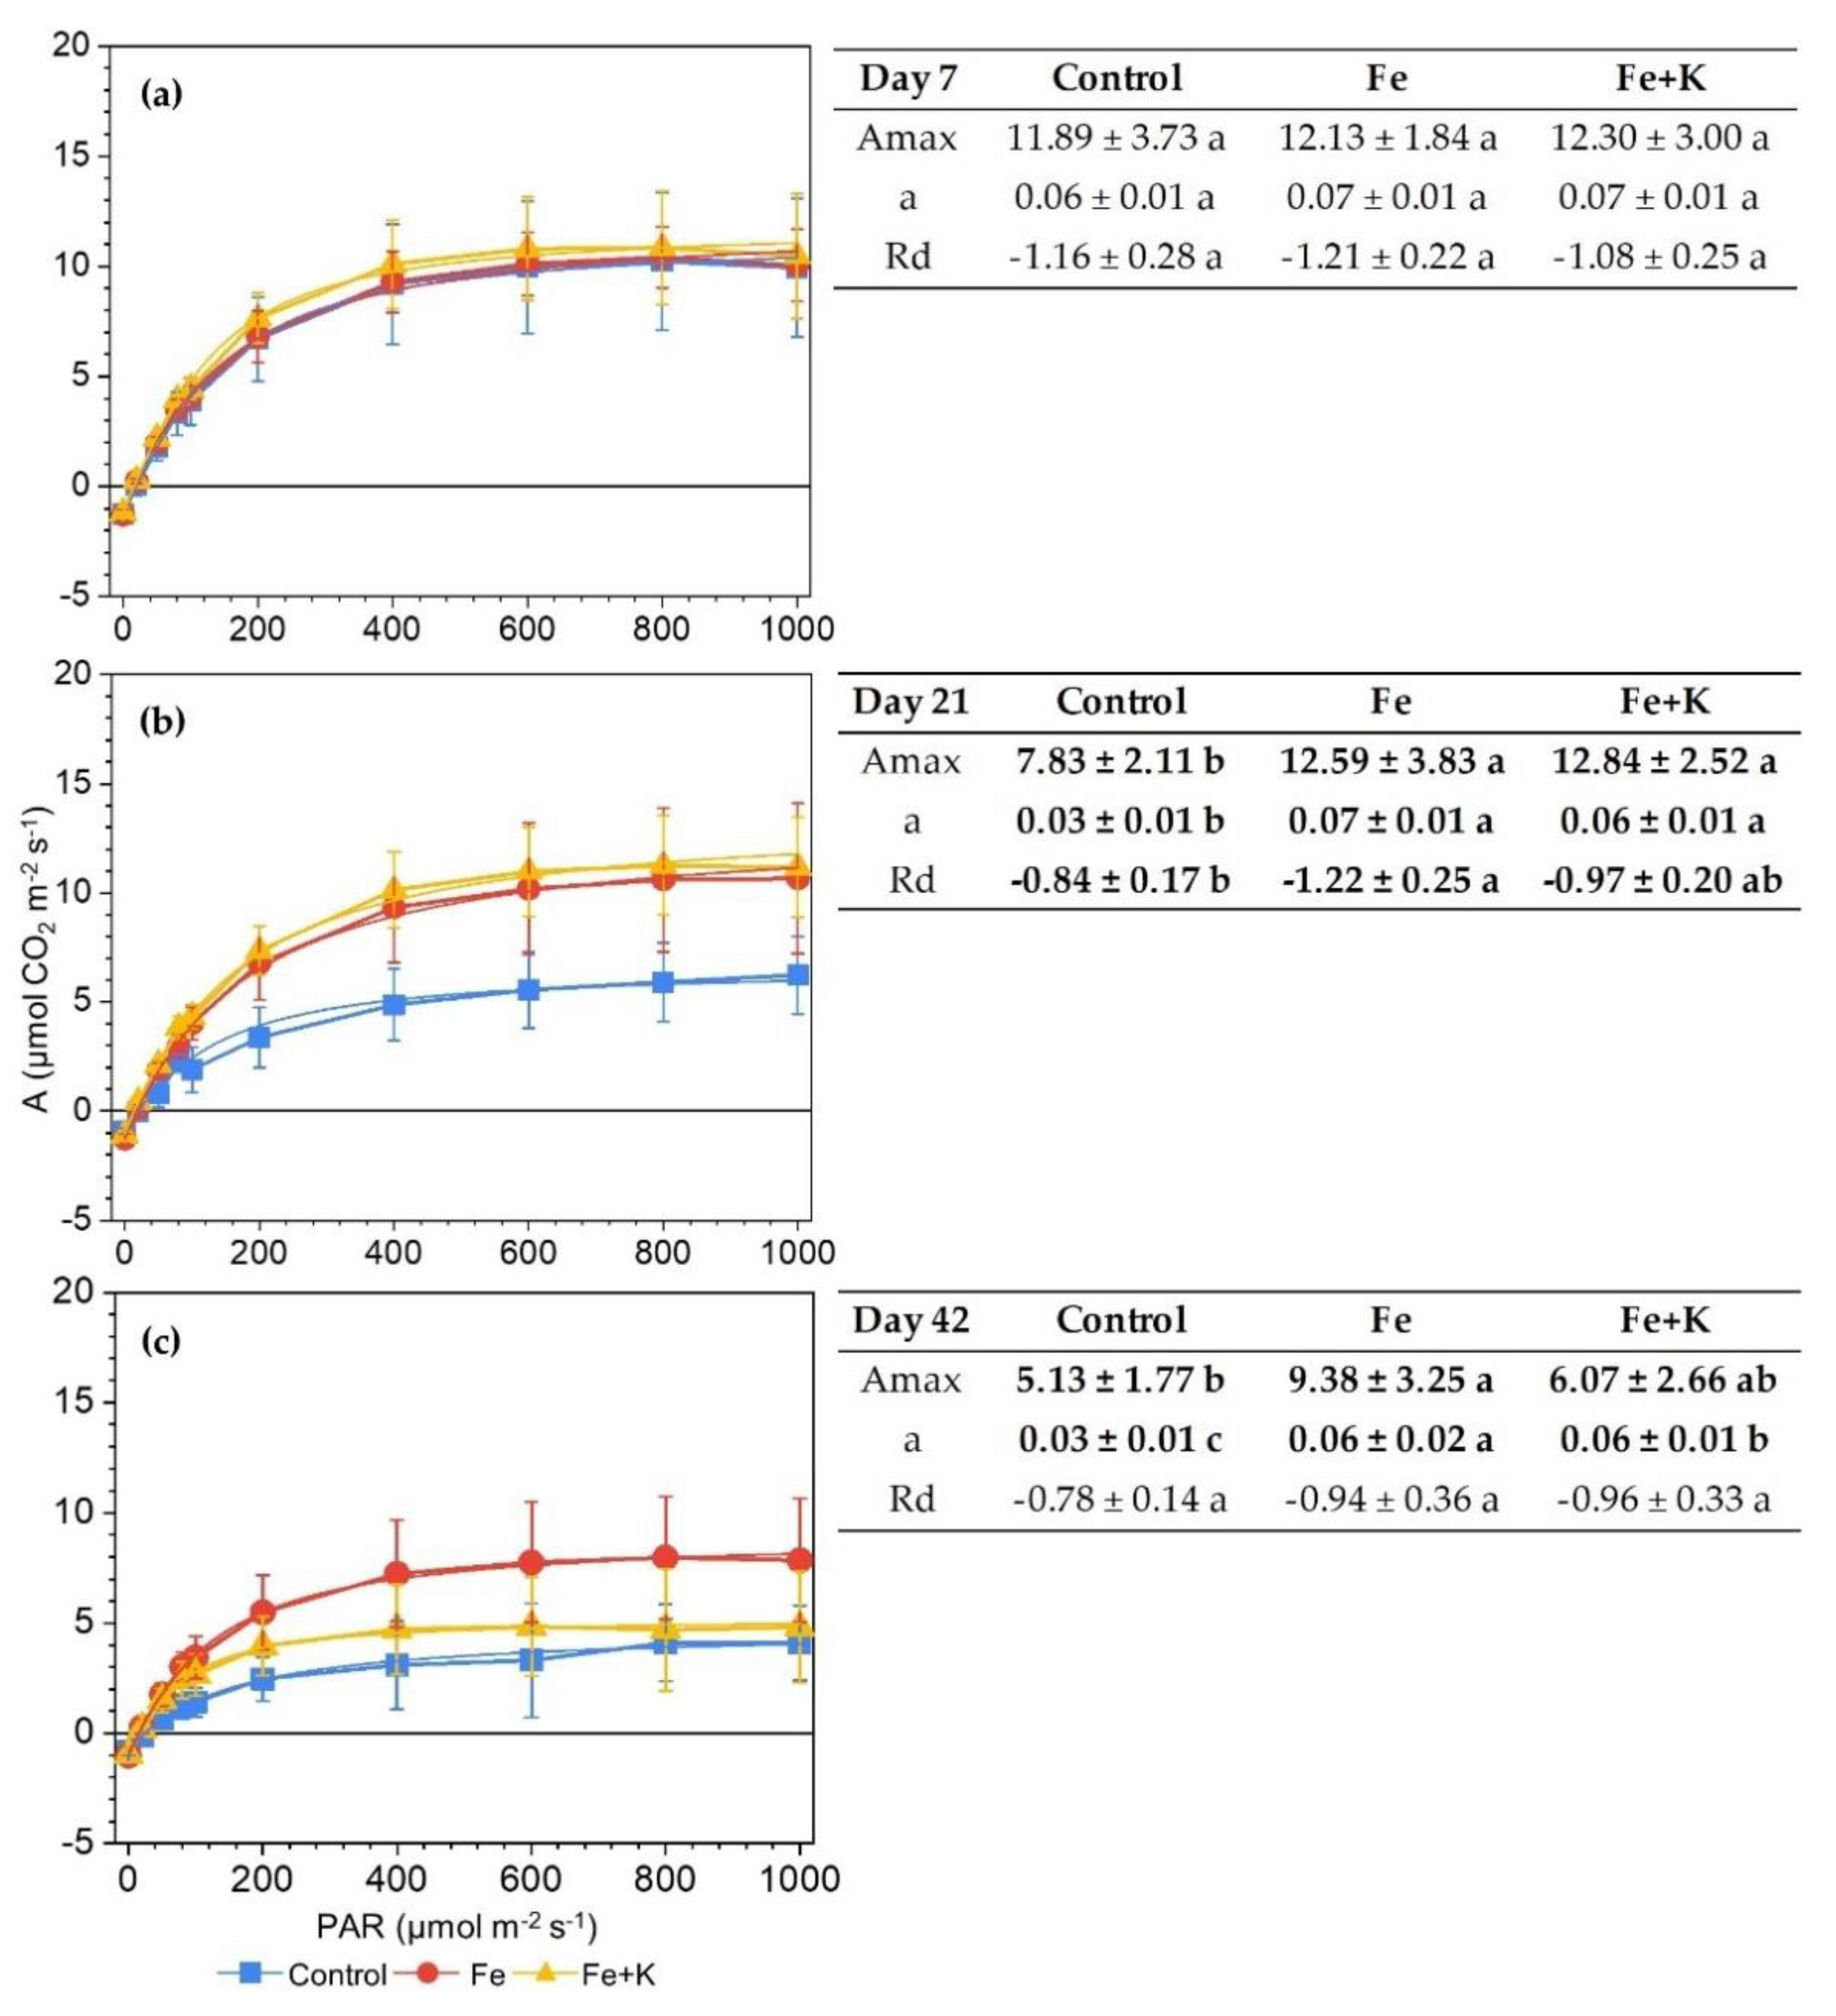
2.6.1. Gas Exchange and Light Response Curves

Gas exchange parameters were assessed on a weekly basis throughout the cultivation period with a portable photosynthesis system (LI-6400 XT, LI-COR, Lincoln, NE, USA). During the measurement the conditions inside the leaf chamber was set as follows: 450 ppm CO2 with the 6400-01 CO2 Injector; 500 μmol m−2 s−1 PAR provided by the 6400-02B LED Light Source attached to leaf chamber; 23 °C based on ambient temperature. Net assimilation rate, stomatal conductance, and transpiration rate were recorded on a mature leaf per plant for fifteen plants per treatment from 10:00 to 12:00.
The photosynthetic light response curves were performed at three time-points, i.e., at the beginning (Day 7), middle (Day 21) and end (Day 42) of the experimental period on eight leaves per treatment. The dependence of photosynthesis on PAR was measured in 10 intensity steps (1000, 800, 600, 400, 200, 100, 80, 50, 20, and 0 μmol m−2 s−1), the duration of each step being 3 min; the leaf chamber conditions were kept constant as described above. The standard protocol of taking the measurements from high to zero light intensity was followed to avoid the stomatal closure and re-opening which greatly affect the results, according to Markos and Kyparissis (2011) [20]. The data was described by the modified non-rectangular hyperbola proposed by Markos and Kyparissis (2011) [20], which permitted the assessment of maximum photosynthetic rate (Amax) and quantum yield of photosynthesis (a, mole CO2 per mole PAR incident on the surface of the leaf).

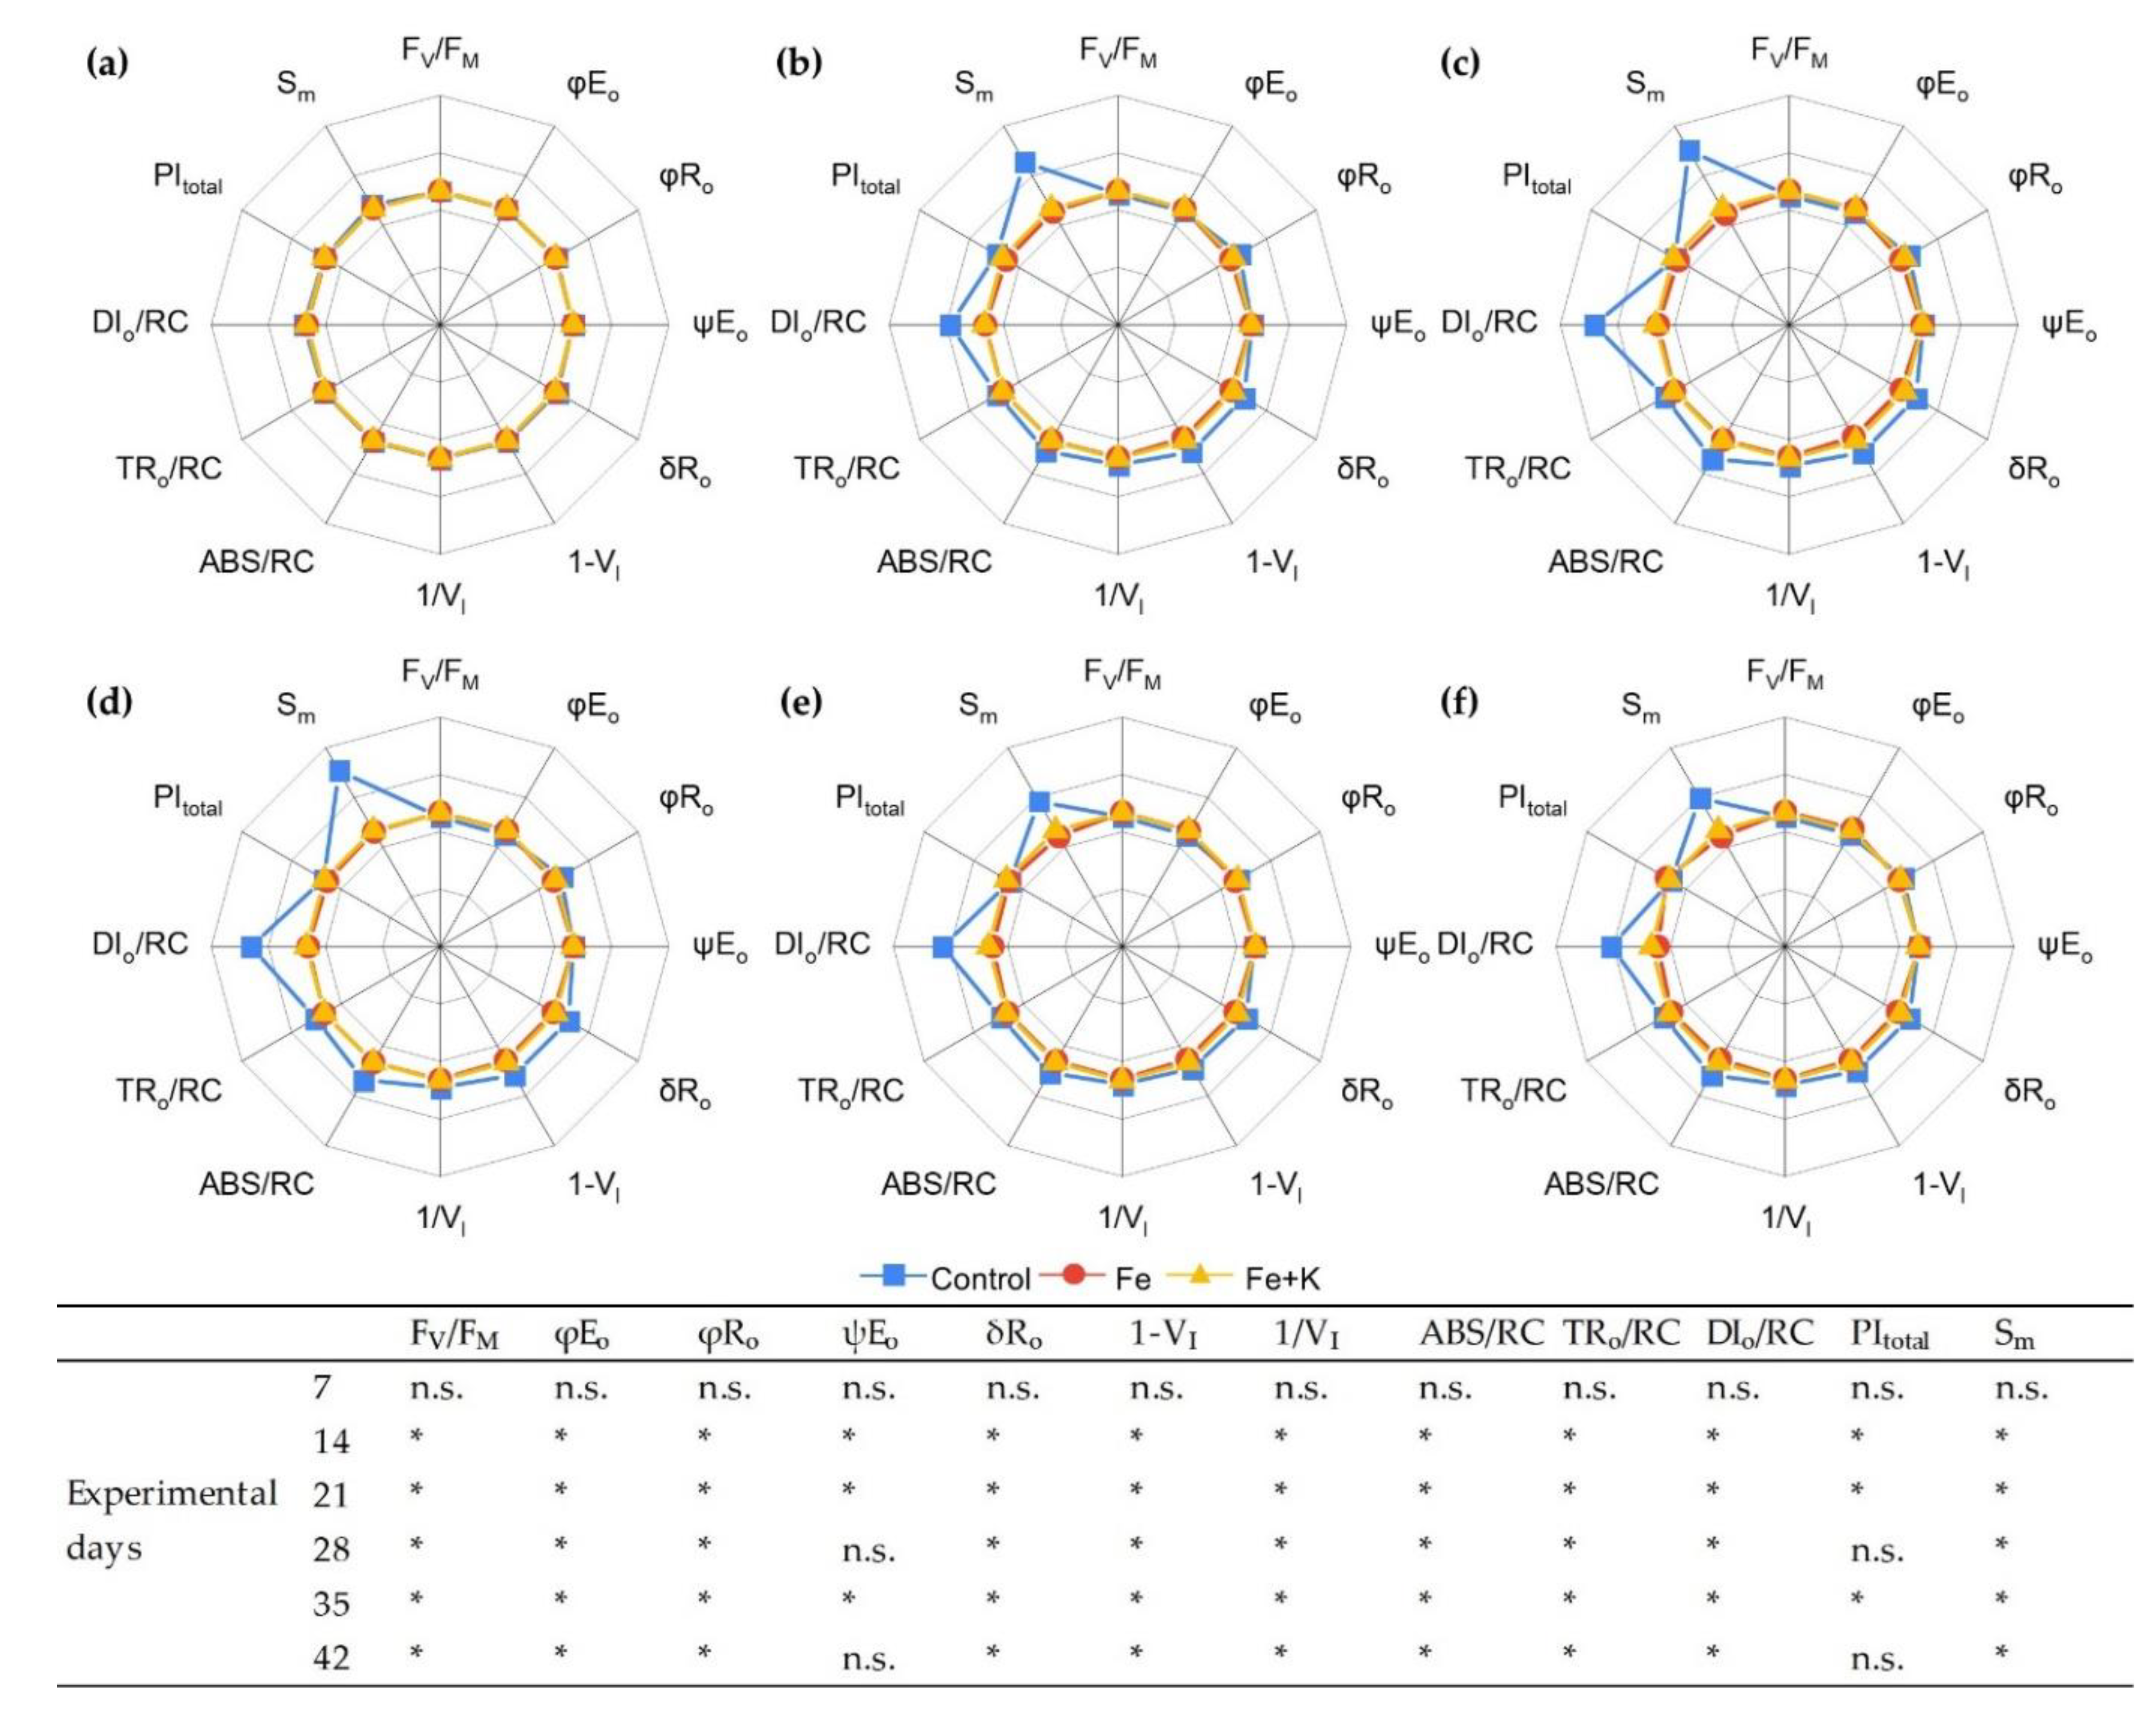
2.6.2. Fluorescence of Chlorophyll a In Vivo

Chl a in vivo fluorescence was monitored on a weekly basis with Handy PEA+ fluorimeter (Hansatech Instruments Ltd., King’s Lynn, UK) on 48 replicates per treatment (2 mature leaves per plant). All measurements took place before the opening of the lights in the morning to assess the full dark-adapted state of PSII. Chl a fluorescence transients were recorded by illuminating the leaves with 3000 μmol photons m−2 s−1 for two sec; the excitation energy was provided by a red LED array and centered at 650 nm. The fluorescence signal was recorded at T1—50 µsecs, T2—100 µsecs, T3—300 µsecs, T4—2 msecs and T5—30 msecs. The OJIP transients were analyzed with PeaPlus Software v.1-13 (Hansatech Instruments Ltd., King’s Lynn, UK). The primary data and the parameters derived according to JIP test proposed by Strasser et al. (2000) [21] are presented in Table 1.

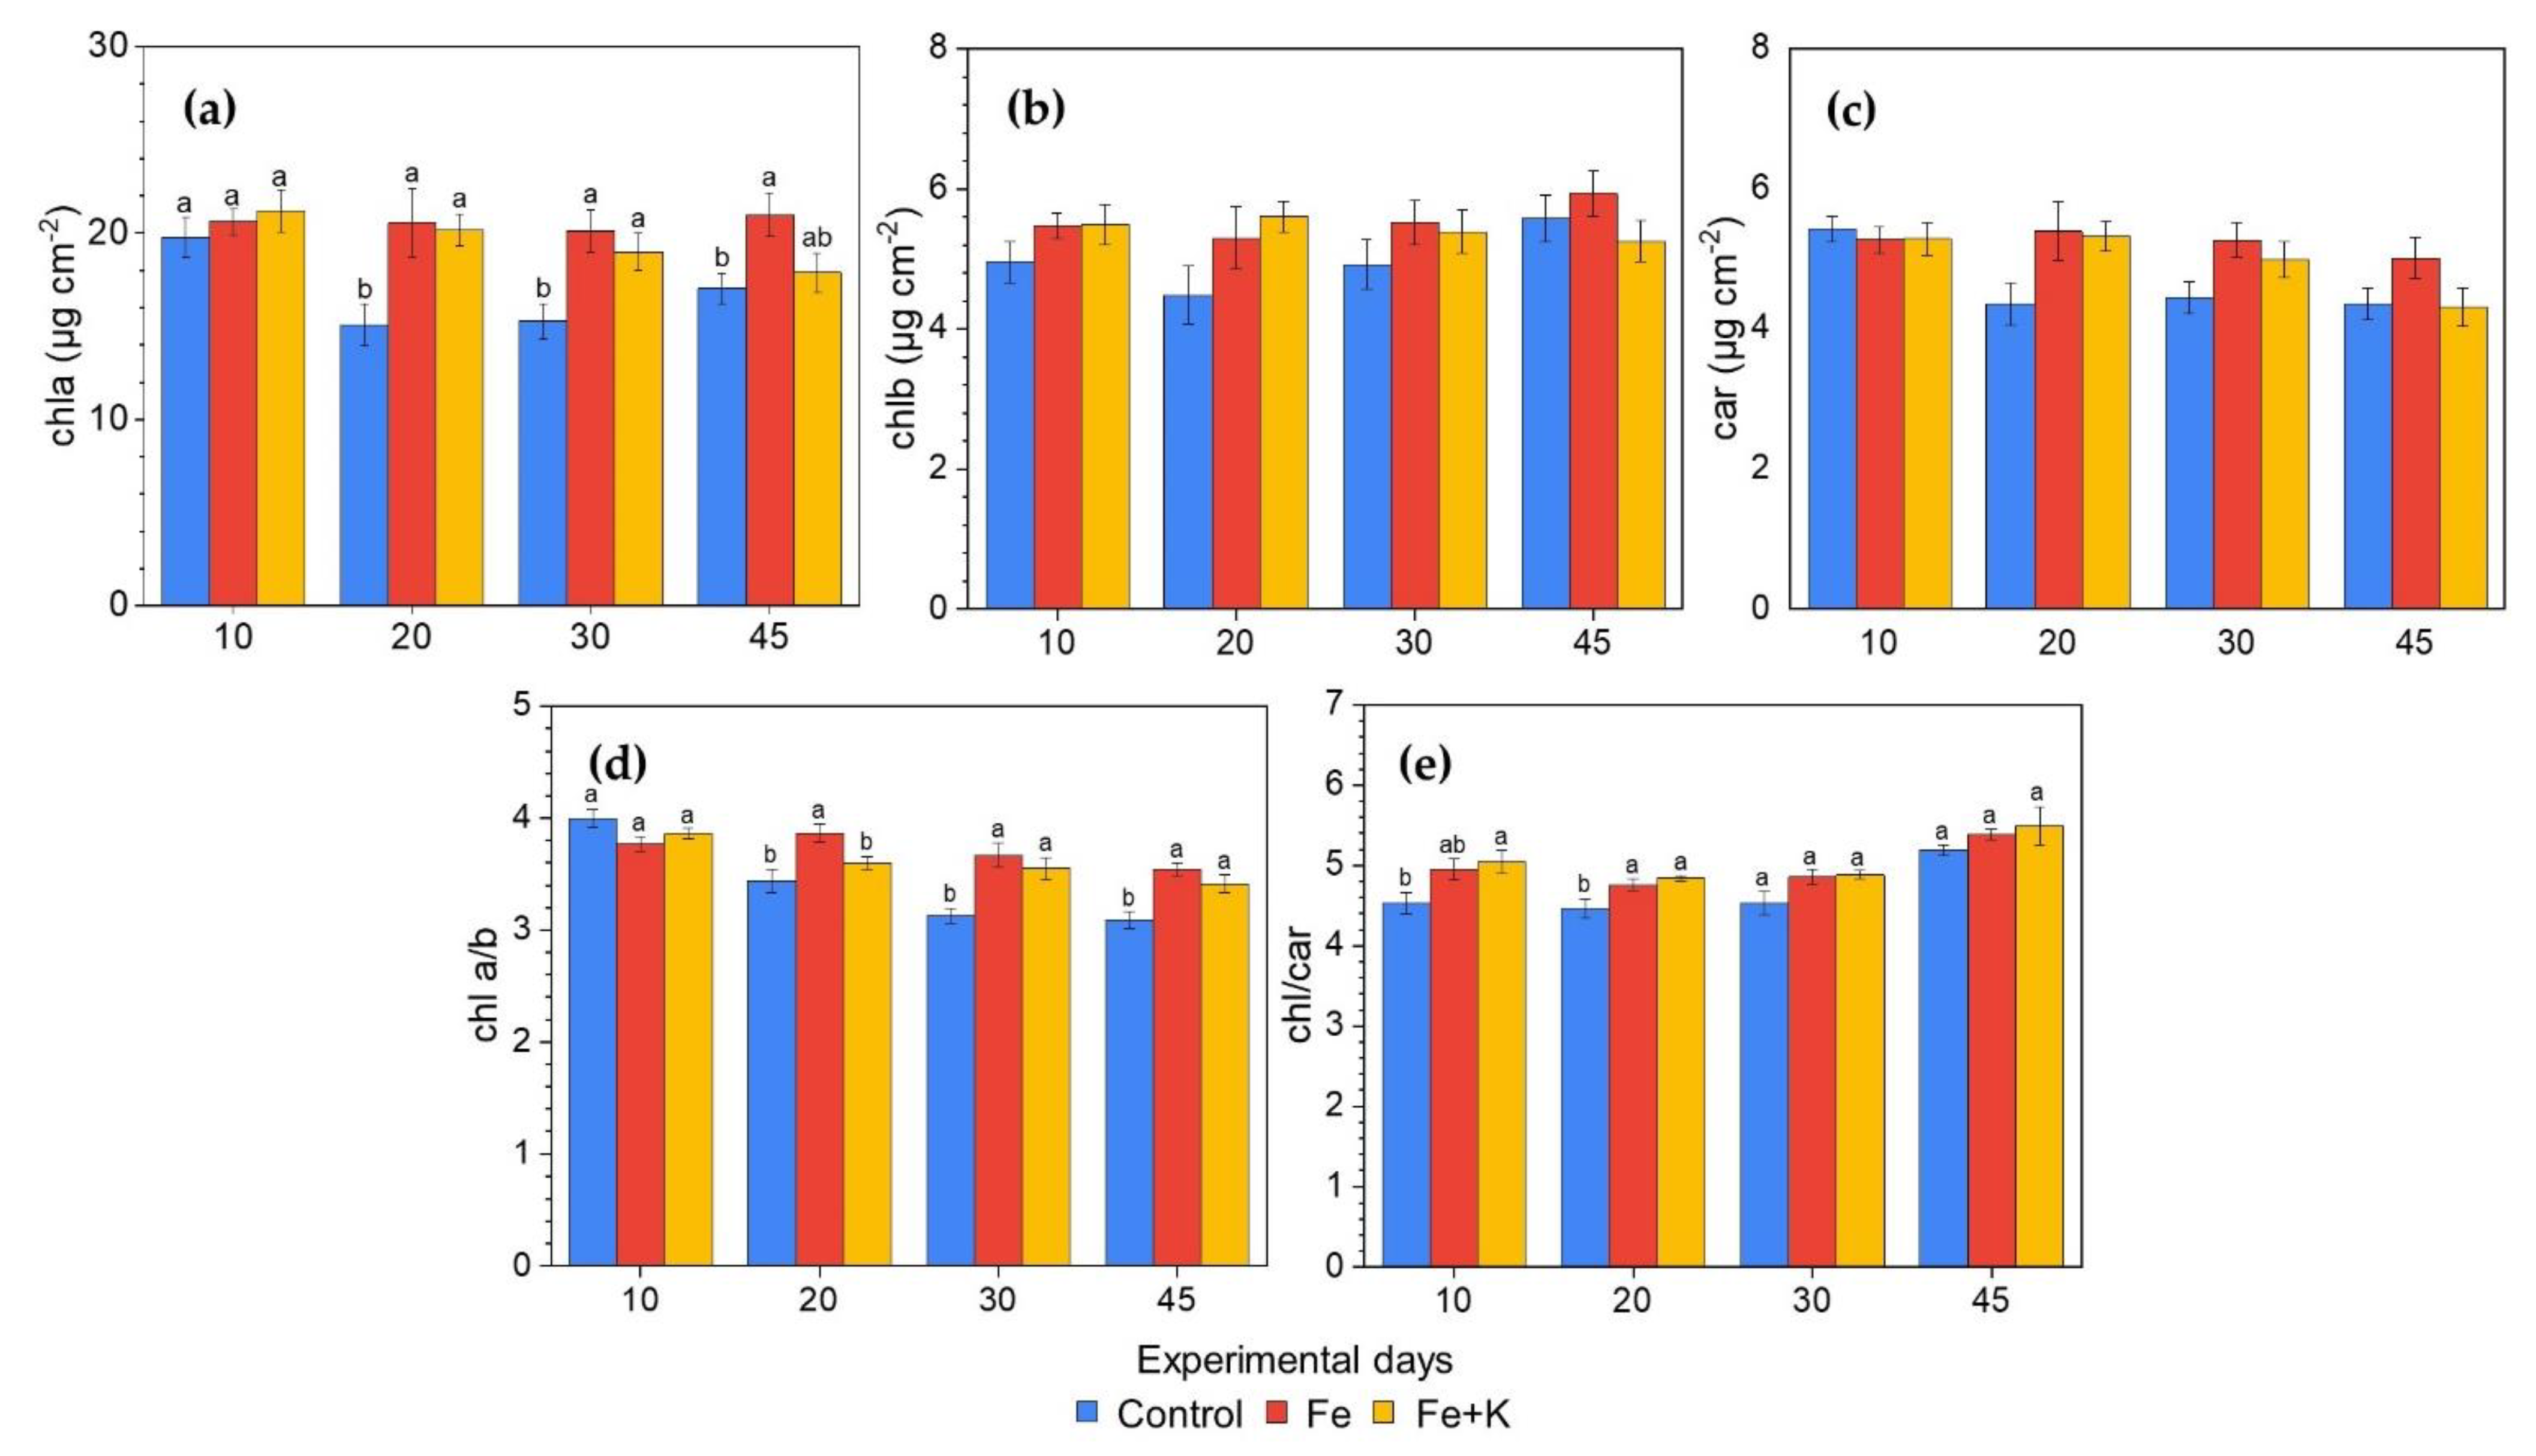
2.6.3. Photosynthetic Pigments Content

The concentrations of photosynthetic pigments in lettuce leaves were determined in 15 samples/treatment, at ten-day intervals and at the final harvest. The extraction of leaf discs was performed with 80% acetone and after centrifugation (4000 rpm for 10 min), the absorbance was read at 720, 663, 646, and 470 nm with a dual-beam spectrophotometer (SHIMATZU, UV-1900). The concentrations of chl a, chl b, and carotenoids (car) were calculated using the equations of Lichtenthaler and Wellburn (1983) [22].

2.6.4. Elemental Tissue Analysis

At the final harvest, dry leaf tissue was analyzed with ICP-OES Spectrophotometer (SPECTRO Analytical Instruments GmbH, Kleve, Germany) for macronutrient (N, P, K, Ca, Mg expressed as %DW) and micronutrient (Fe, Zn, Mn, Cu expressed as ppm DW) content. Four samples per treatment (pooled from two plants) were analyzed. The extraction was performed with two-hours digestion (at 30 °C) of 0.25 g leaf powder with 4.4 mL of a solution containing 1.94 mL concentrated sulfuric acid, 2.82 mg Se, 82.13 mg Li2SO4, and 1.94 mL 30% H2O2. Prior to the analysis, the dilution of samples with 50 mL of distilled water took place after they reached room temperature [23].

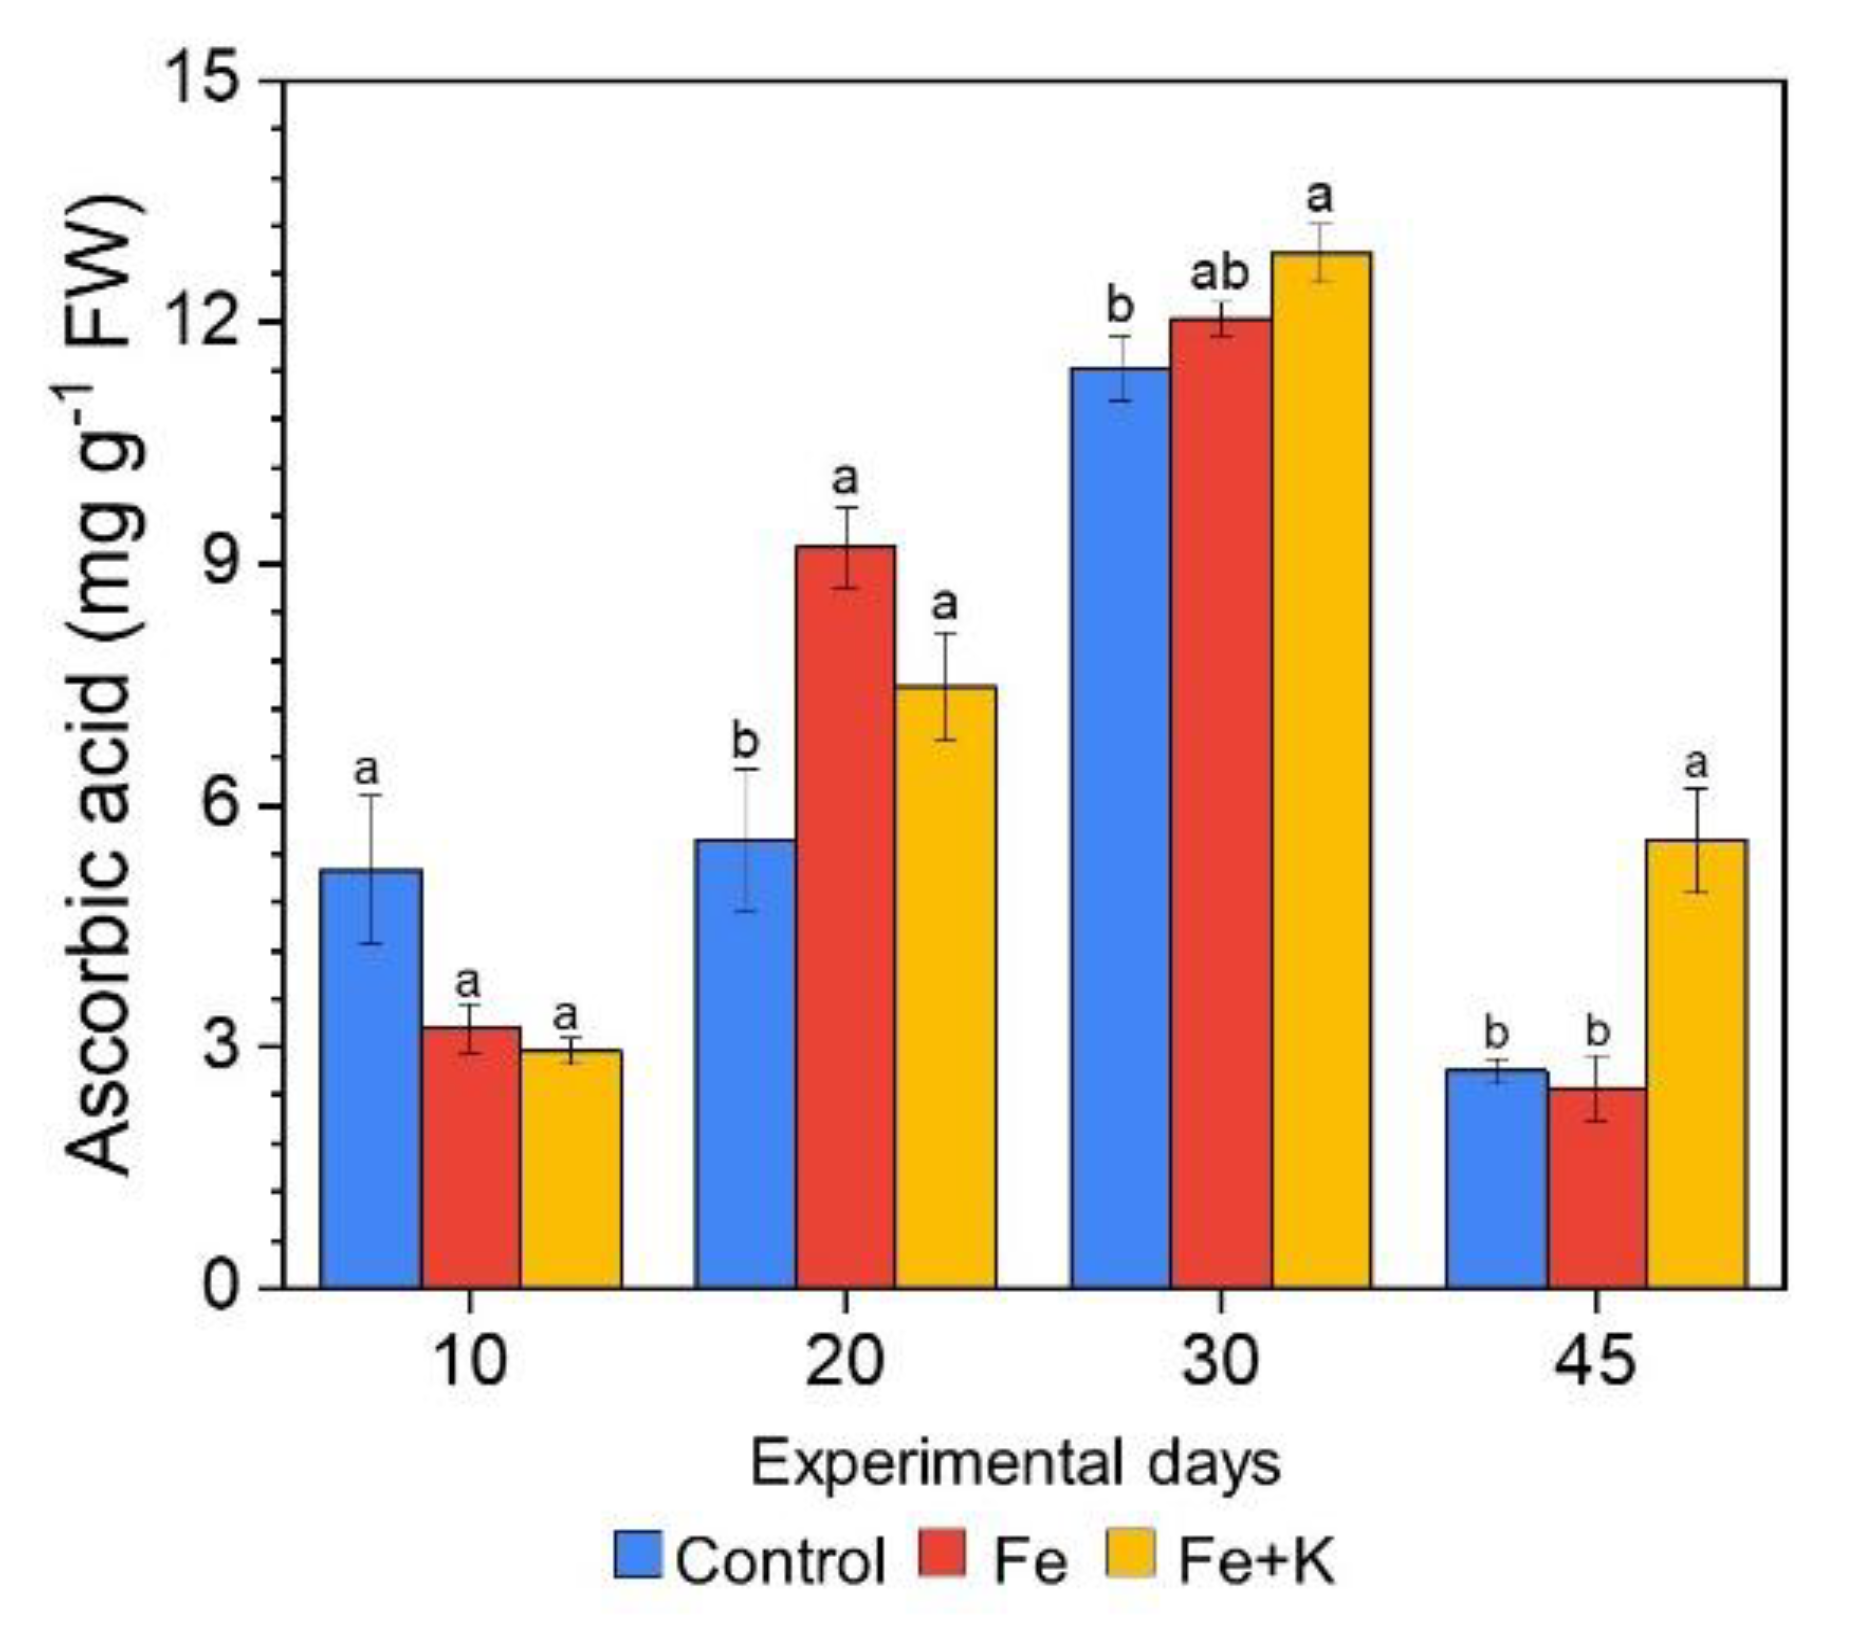
2.6.5. Antioxidant Activity

The DPPH assay (2,2-diphenyl-1-picryhydrazyl) as an indicator of leaf radical scavenging activity was performed according to Goupy et al. (1999) [24] and Hayes et al. (2011) [25] with slight modifications, on 24 samples per treatment on a ten-days basis. The extraction of freshly cut lettuce leaves (350 mg) was performed with 25 mL methanol in a mill for 30 s, followed by dark shaking (1050 rpm) for 20 min. The samples were centrifuged at 2218 xg for 10 min, and the supernatants were diluted with methanol (1:1) and analyzed immediately. The reaction of freshly prepared DPPH (100 μM, 2 mL) and sample (2 mL) took place at the dark for 30 min and after that the absorbance at 517 nm was recorded, using as control a methanol-DPPH sample. A standard curve was prepared using different ascorbic acid concentrations and the results are expressed as mg ascorbic acid g−1 fresh weight of leaves.

2.7. Plant Growth Parameters

At the final harvest, the number of leaves and their fresh weight were measured. Also, the leaf area (cm2) was estimated by image analysis with the free software ImageJ (Open-source software, ImageJ.net/ver. ImageJ 1.51j). The dry weight of leaves and roots was determined after drying at 80 °C for 48 h, and the root to shoot ratio was calculated from biomass data.

2.8. DNA Extraction and Isolation

Roots and water from the aquaponic systems were sampled for their bacterial community analysis at two time-points of the experimental period, namely at 0 and 45 days. The first sampling (Day 0) included five seedlings from the same batch of plants that were introduced to the experiment which were kept in sterilized Eppendorf at −80 °C until analysis. The second sampling (Day 45) was performed in three plants per treatment. The collected water from fish tanks (1000 mL) of all samplings was collected in sterilized glass containers, immediately filtered under low vacuum (<150 mmHg) on a polycarbonate isopore filter (0.2 μm) and stored at −80 °C until further analysis. The DNA extraction was performed by PowerSoil DNA Isolation Kit (MO BIO Laboratories Inc) according to the manufacturer’s protocol. DNA concentrations (ng/μL) were measured using a NanoDrop microvolume spectrophotometer (ThermoScientific, Waltham, MA, USA). Bacterial diversity was estimated by targeting the V3-V4 region of the 16S rRNA gene using the Klindworth et al. (2012) primers [26]. Sequencing was performed on the Illumina MiSeq 2 × 300 bp platform according to the standard protocols of the MRDNA sequencing facilities (Shallowater, TX, USA). Raw sequences were processed using the MOTHUR standard operating procedure (v.1.45.3) (https://mothur.org; accessed on 1 May 2022) [27,28] and the operational taxonomic units (OTUs) were classified with the SILVA database release 138 [29,30]. Operational taxonomic units (OTUs) were assigned on a 97% similarity level. Raw sequences can be accessed at the Sequence Read Archive (https://www.ncbi.nlm.nih.gov/sra) under BioProject number PRJNA609254 (accessed on 12 August 2022).

2.9. Statistical Analysis

Data were statistically analyzed using One-way ANOVA, followed by Tukey post hoc tests for the parameters where the ANOVA prerequisites were valid. In all other cases, the non-parametric Kruskal–Wallis test and post-hoc Dunn’s test were used. All statistical analyses were performed with JASP v.0.16 software (JASP Team 2021 Computer Software).

3. Results

3.1. Water Physicochemical and Quality Parameters

The physicochemical parameters of nutrient solution, such as pH and DO, were constant during the experimental period without differences among treatments (Table 2). EC was significantly higher in Fe+K group due to K2SO4 supplementation. Weekly measurements of water quality showed that there were no differences in ammonia, nitrate, phosphate and sodium concentrations among treatments (Table 2). As for the iron concentrations, the control group was close to zero while no differences were detected between Fe and Fe+K groups, with their values being close to the target concentration. In Fe+K treatment higher potassium, sulphate and calcium concentrations were recorded compared to the other two treatments. Since no calcium addition was performed in the water, higher Ca concentration may indicate lower plant absorption rate of this element.

3.2. Fish Growth Performance

At the beginning of the experiment, there were no statistically significant differences of fish initial weights and lengths (Table 3). Fish survival rates ranged from 88% to 90% in all treatments. Feed consumption rates were similar for the three tested treatments, while no significant differences were also recorded in FCR. There was a statistically significant increase of SGR in the Fe and Fe+K treatments compared to the control treatment.

3.3. Growth and Physiological Parameters of Lettuce

Inferior growth performance of control plants was evident at the final harvest (Table 4), whereas Fe+K treatment resulted in the maximum values of all measured parameters. Fresh and dry biomass of both aerial and root parts, as well as total leaf area were more than doubled upon Fe+K supplementation compared to control. Plants grown under Fe treatment held an intermediate position between these two extremes, showing significant differences either with Fe+K group (in fresh and dry weight of the aerial part and number of leaves) or with control group (dry weight of aerial parts and roots).
The concentration of all photosynthetic pigments followed a similar profile during the experimental period (Figure 2). High levels were recorded in the first measurement, which were stable throughout the experiment for Fe and Fe+K groups. However, control plants exhibited a decrease from day 20 onward compared to the other two treatments, with statistically significant differences only in chla. The chl a/b ratio was significantly lower in control plants, as was also the case regarding the total chls to car ratio in the first two sampling days, denoting a relatively higher chlb and car content respectively.
Treatment effects on lettuce gas exchange were already evident from the second week of the experiment (Figure 3). Control plants showed inferior performance in all measured parameters. Their photosynthetic rates showed a downward trend from day 14 until the end, while Fe and Fe+K supplementation sustained high photosynthetic rates throughout the cultivation period, except for the last measurement, without differences among the respective groups. Fe treated plants outweigh the other groups in stomatal conductance and whereby transpiration rate, though the differences with Fe+K were significant only in two measurement dates at the second half of the experiment.
The light response curves of photosynthetic rate were constructed at the beginning, middle and end of the cultivation period (Figure 4). The maximum photosynthetic rates (Amax) and quantum yields of photosynthesis (a) extracted from these curves were similar among treatments only in the first measurement at day 7. The photosynthetic performance of control plants declined progressively, whereas Fe and Fe+K plants showed stable values except for the final measurement. In the latter, Fe+K group exhibited a sharp decrease in photosynthetic response to PAR > 200 μmol m−2 s−1, unlike Fe-treated plants in which only a slight decline of both Amax and a appeared, resulting in significant differences among treatments. Dark respiration (Rd) was high in the young developing leaves of day 7 but then declined in control plants, while sustaining relatively high values in the other two groups.
Parameters of in vivo chl a fluorescence at the dark-adapted state are illustrated in Figure 5. The maximum yield of PSII photochemistry, indicated by Fv/Fm, as well as the photosynthetic performance index (PItotal) were high for all treatments in the first measurement of day 7. After that, a considerable decrease was evident in control plants, while Fe and Fe+K plants retained the initial high values throughout the experiment. Similar kinetics were followed by the corresponding PSII-related φEo, an index of quantum yield of e transport to intermediate acceptors in the photosynthetic electron transport chain. On the contrary, the PSI-related events presented an ameliorated performance in control plants from day 14 onward, compared to the other treatments. Indeed, functional parameters related to the quantum yield (φRo) and efficiency (ψRo) of e- transport in the PSI side, as well as structural parameters, such as 1—VI which is linked to the content of PSI reaction centers per active PSII centers, were significantly increased in control plants from day 14, remaining at higher levels until the end. The same pattern was followed by the energy flux indices, like ABS/RC and TRo/RC possibly denoting a decreased number of PSII active RCs. A significant enhancement of the dissipated energy in control plants was evidenced by the increased values of DIo/RC already from day 14. Finally, the relative pool size of total electron carriers, reflected in the parameter Sm, was higher in control plants from day 14 till the end of the experiment.
The nutrient composition of lettuce leaf tissues (Table 5) reveals that nitrogen, phosphorus, zinc and copper were equally absorbed by all plant groups. Potassium and iron content were directly affected by the respective supplementation, resulting in significantly lower concentrations in control tissues. Mg and Ca contents varied along treatments, being higher in Fe-treated and control plants and lower in the Fe+K group. Finally, Mn content of leaves was three-fold higher in both plant groups that received external input.
The antioxidant activity of lettuce leaves changed considerably over time (Figure 6) in all plant groups. Leaves of mature plants sampled at day 20 and even more significantly at day 30 showed two-fold increases of their scavenging capacity when compared to day 10. Interestingly, at the end of the experiment, the values of ascorbic acid equivalents dropped to the levels of the first measurement. Concerning the among-treatment differences, the antioxidant capacity of control plants was significantly suppressed compared to Fe+K plants in all sampling days, except of the first measurement at day 10.

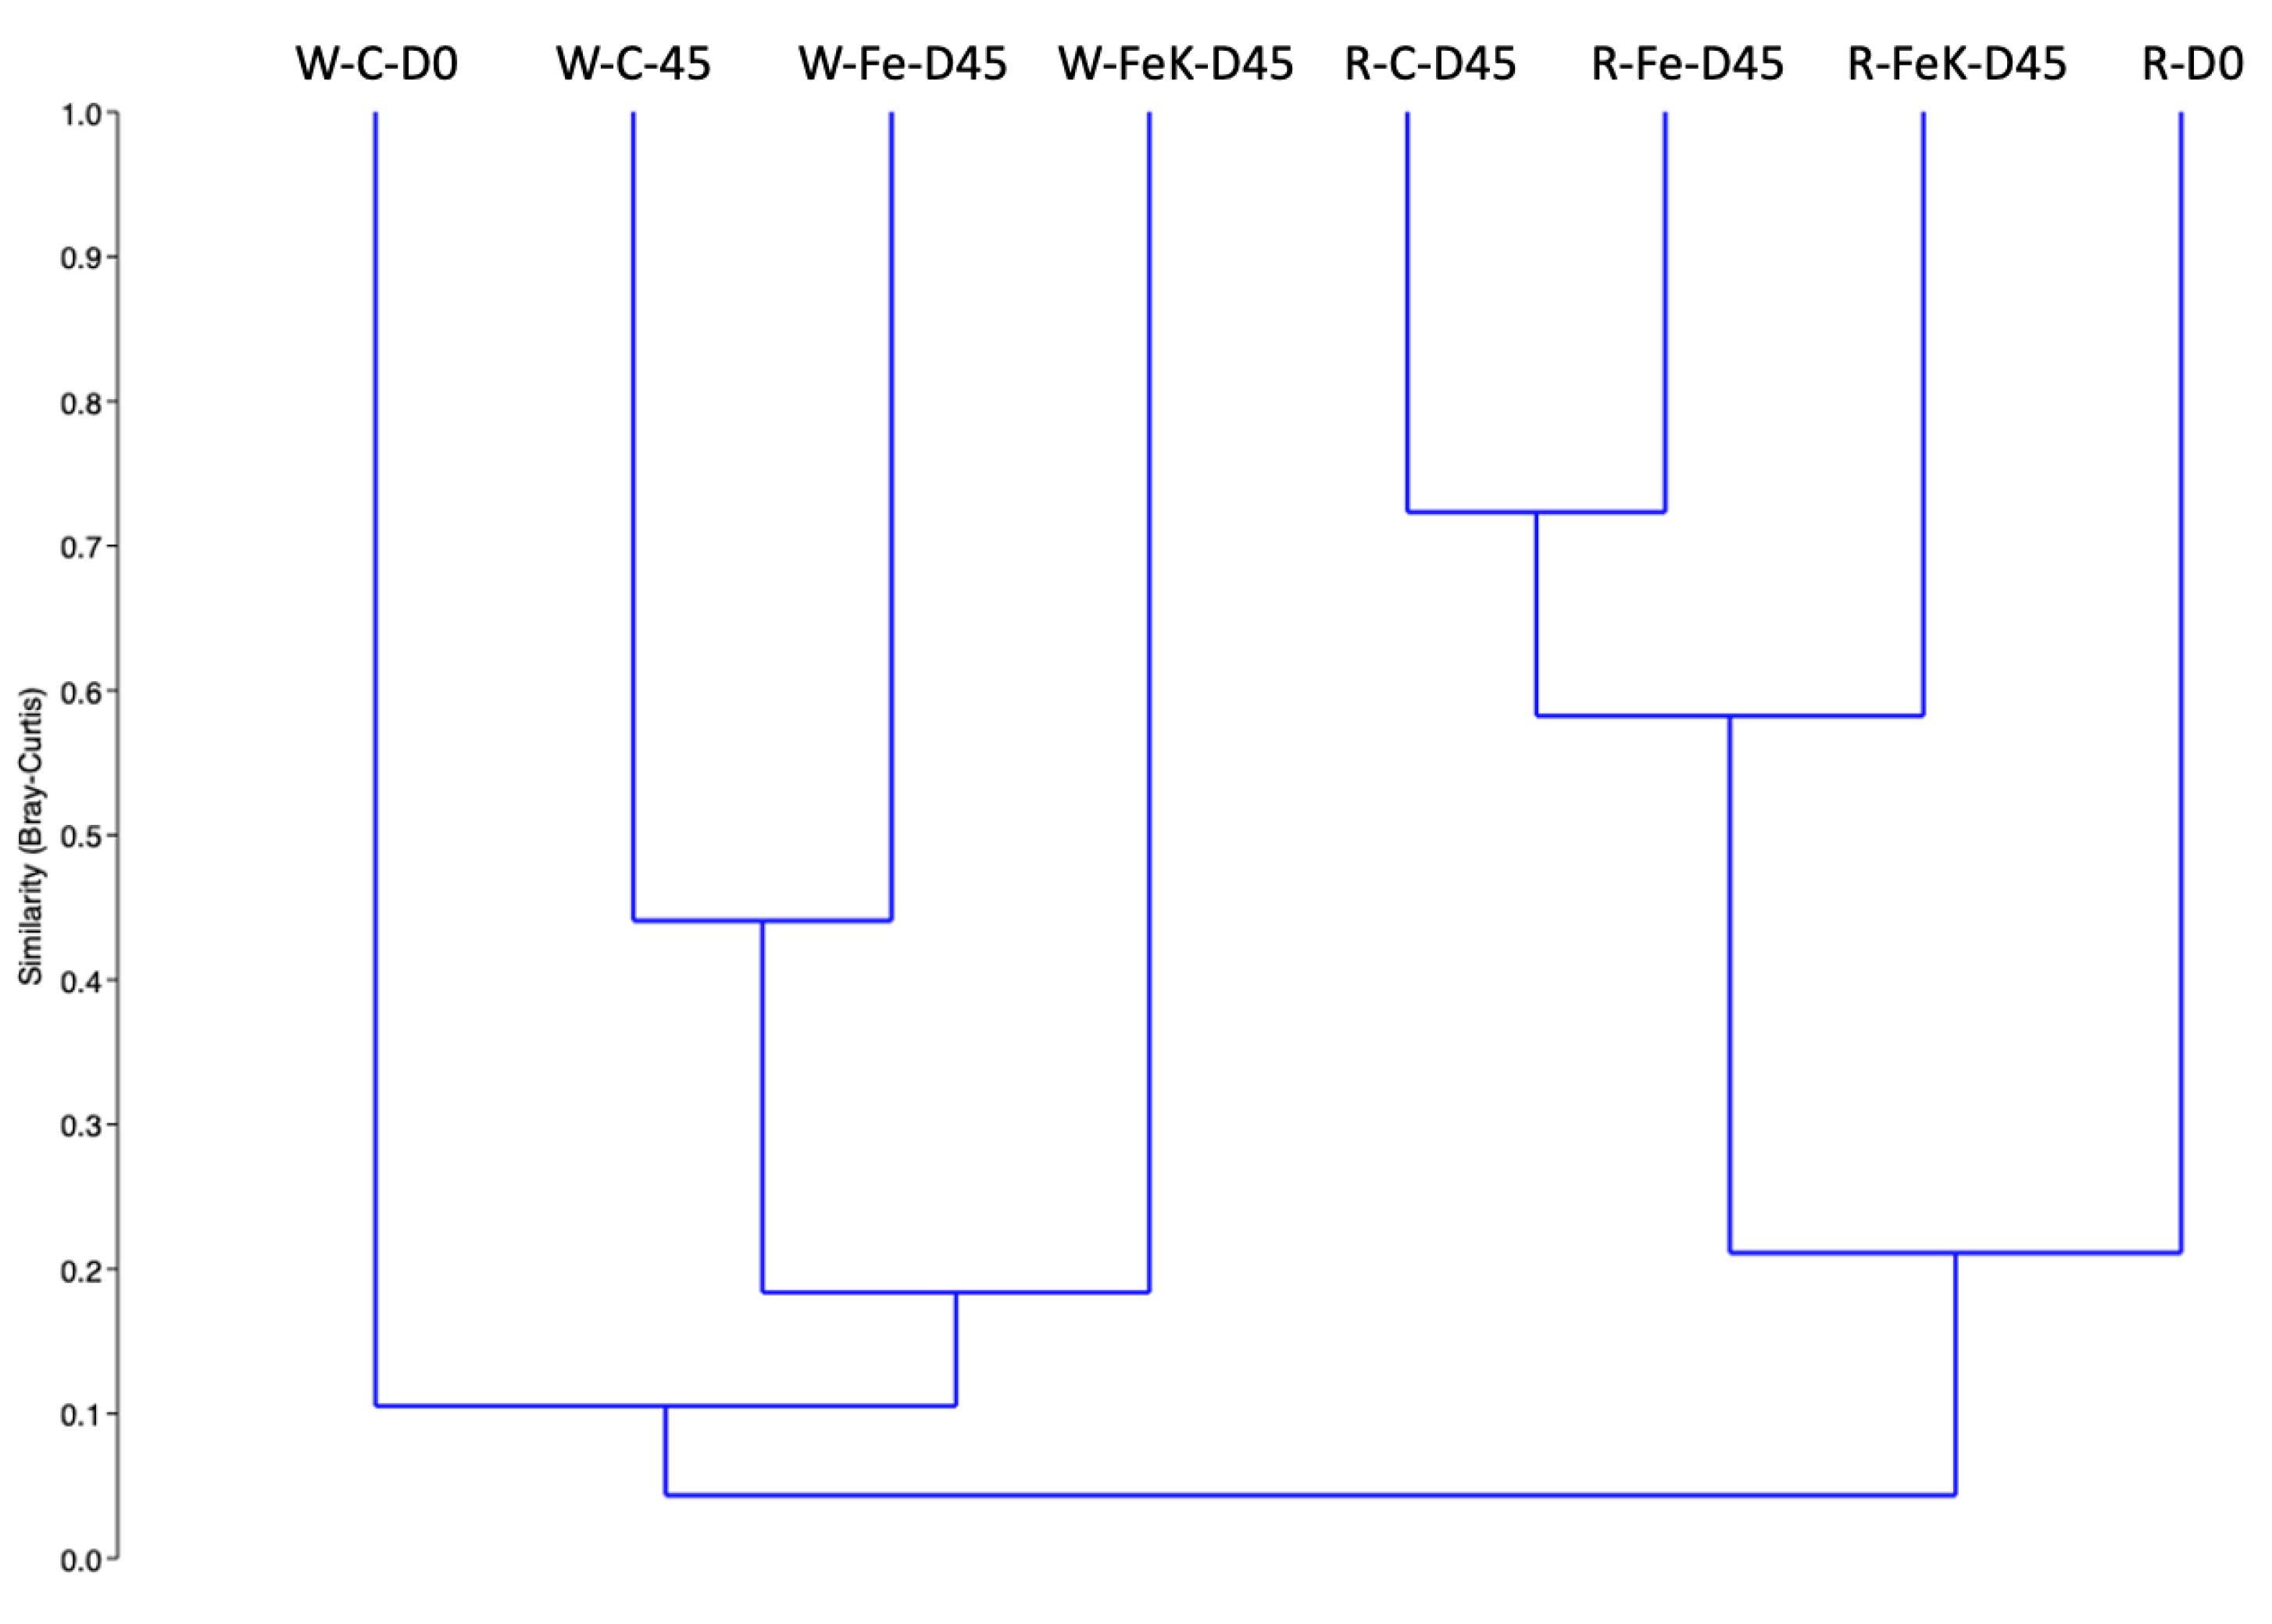
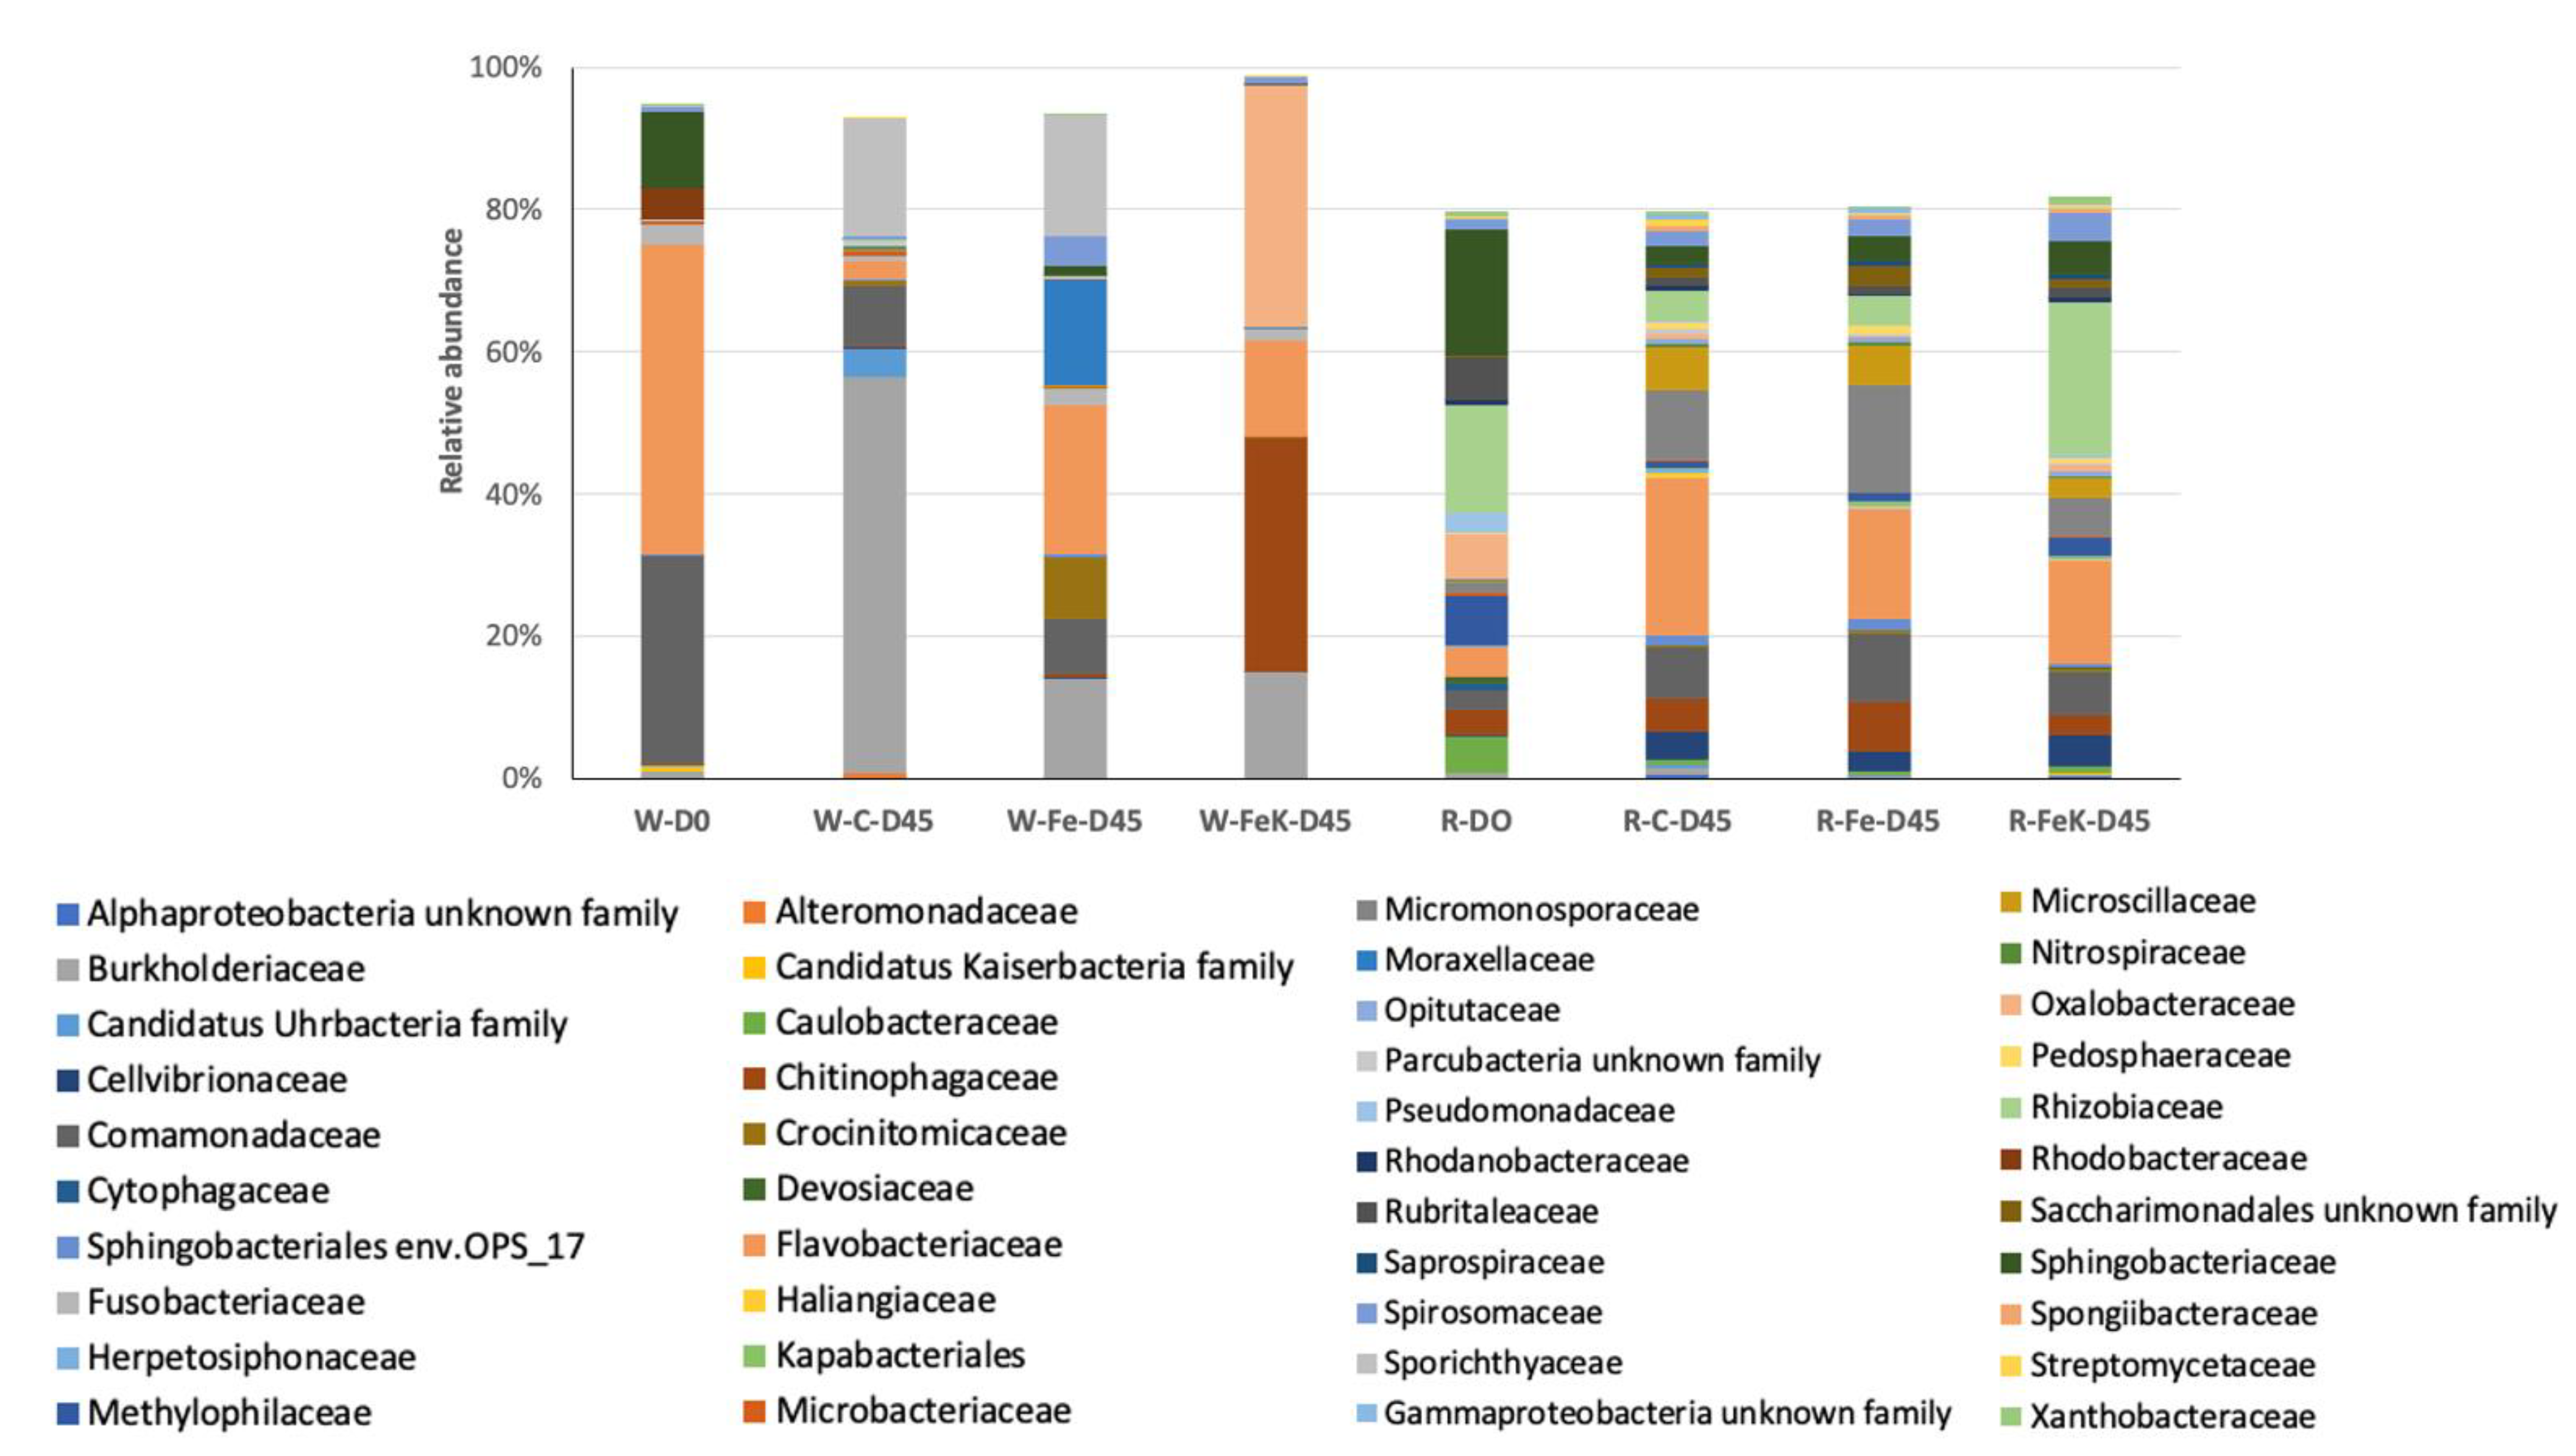
3.4. Root and Water Bacterial Community Analysis

The bacterial community of the water samples had lower number of OTUs (215–394) compared to the root samples (581–845) (Table 6). Simpson 1-D diversity was also higher in the root samples, and this was reflected also in the higher number of OTUs dominating the same samples. Despite Flavobacterium and Rhizobiaceae related OTUs dominating several of the samples (Table 6), the overall bacterial community structure of the water samples was distinct from those of the root samples (Figure 7). Regarding the root samples, the bacterial community composition at the end of the experiment was more similar among the three treatments compared to the initial sample. Control and Fe-treated samples had the highest similarity (ca. 72%), and these two treatments were ca. 60% similar to the Fe + K treatment (Figure 8). These similarities were reflected on the bacterial families’ composition. The families that dominated these samples were the Flavobacteriaceae, Rhizobiaceae, Micromonosporaceae, Chtinophagaceae, and Sphingobacteriaceae.

4. Discussion

The combined production of two different organisms, crops and fish, with distinct environmental requirements for optimal growth necessitates some compromises in the physicochemical ambient conditions. Especially pH and temperature optima greatly differ between crops and fish. A pH range of 7.5–8.0 is considered optimal for fish growth as well as for the nitrification process that transforms the waste nutrients produced by fish metabolism into suitable forms for plants [1]. Nutrient absorption by plants is effective at much lower pH values, i.e., 5.5–6.0 [31]. In the present study, the system was left to mature and succeed to reach equilibrium, resulting in pH values close to 7.0 without significant differences among treatments. Temperature was constantly kept at 23 °C as a compromise between the 28 °C required by tilapia and 15–22 °C which is best for lettuce production [32,33]. Water DO was kept constant at levels favorable for fish and bacteria (7.0–8.0 mg L−1), while plant root aeration was ensured by the media bed which is reported to maintain better growth conditions than deep water culture (DWC) or nutrient film technique (NFT) methods [34]. Fe+K treated plants faced an increased EC by 1.7 times compared to the other two groups, as was expected mainly due to enhanced sulphates resulting from potassium sulphate supplementation [35].
In a closed-loop aquaponic system, nitrogen for plants nutrition derives mainly from fish excretions. It is estimated that total excretions of fish consist of 30–65% nitrogen and 40% phosphorus, with the exact percentages depending on the composition of fish feed in RAS systems [36]. Ammonia, which is the major waste produced by fish metabolism, is toxic as it affects the central nervous system of fish, causing convulsions and death at 2.79 mg NH3 L−1 [37]. In the present study, the ammonia levels were kept close to zero ranging from 0.06 to 0.08 mg/L, whereby ensuring non-stress conditions for fish growth. Nitrates derived from the nitrification process were found close to 100 mg L−1, higher than the levels reported by Rafiee et al. (2019) [7] in a lettuce-tilapia system (75 mg L−1), and the frequently published nitrate-nitrogen concentrations for leafy greens being in the range of 42.2–63.5 mg L−1 [12,13]. Calcium concentrations in the water were 5.6–8.0 times lower than the suggested for aquaponics which is 180 mg L−1 [38], so we proceeded to a bi-weekly calcium spraying in all treatments to avoid deficiencies. While other nutrients were adequate for all treatments, sodium content slightly exceeded the critical level of 90 mg L−1 for lettuce [39], beyond which toxicity symptoms and K deficiency through Na/K antagonism for absorption by roots may arise [31], yet without any signs of toxicity found in our plants. Finally, chemical analysis of the re-circulating water revealed that Fe and K supplementation that started five days after the experiment commencement provided plant roots with sufficient levels according to widely used in hydroponics and aquaponics concentrations of 59.5–430 mg L−1 and 2.2–5.0 mg L−1 respectively [12,31,39].
Tilapia and catfish are the most widely used species in aquaponics systems because of their tolerance in a range of abiotic conditions and high nutrient inputs often tested in aquaponics [1,7,40]. Red tilapia of the present study was significantly favored by nutrient supplementation presenting higher SGR compared to control, which reached 2.72% day−1 in Fe+K group. This result is comparable with the 2.58% day−1 reported by Silva et al. (2020) [40], while Rafiee et al. (2019) [7] found lower SGR of 1.84 ± 0.13% day−1, with all three experiments following the same feeding protocol. Potassium and iron external input did not affect either food consumption and FCR or the survival rate, which reached 90% in all treatments. A recent study of our group on a tilapia-rocket system showed that similar iron and potassium supplementation neither impact growth of red tilapia nor cause histopathological alterations in fish gills, liver, and midgut [41]. The daily amount of fish feed offered and consumed by fish was 21.85–24.2 g m−2 day−1 without significant differences among treatments, an amount that is sufficient for lettuce nutritional requirements, according to Lennard (2012) [42] who stated that 13 g of fish feed m−2 day−1 for tilapia cover the needs of 25 lettuce plants m−2 [42].
Lettuce is the favorite species in the aquaponics-related literature [34]. Nevertheless, the outcome of the published experiments is considerably variable, since lettuce growth performance depends on multiple factors like environmental conditions, paired fish species, fish stocking density, planting density, and fish feeding- and growth-related factors. All this variation challenges comparisons and general conclusions. In this experiment, the nutrient solutions composition differentially affected lettuce growth attributes. Addition of Fe and K favored the accumulation of fresh and dry biomass as well as the number of leaves and total leaf area. Fe+K was the most effective input, yielding in increases of leaf fresh weight and aerial and root dry weight of 2.1–2.2 times compared with control, and additionally in 90% and 50% higher total leaf area over control and Fe group respectively. The total yield of lettuce under the control, Fe and Fe+K treatments was estimated at 1.2, 1.5 and 2.6 kg m−2 respectively. A similar yield of lettuce (Lactuca sativa cv. ‘Integral’) at 2.3 kg m−2 has been reported by Pantanella et al. (2012) [38], which reached 2.8 kg m−2 under higher fish stocking density. Nozzi et al. (2018) [43] succeeded even higher lettuce yields with daily additions of iron, potassium and phosphorous in the aquaponics water, which resulted in 6.13 kg m−2 compared to hydroponics of 5.65 kg/m2 or plain aquaponic solution of 4.00 kg m−2. The foliar application of potassium (K2SO4) had beneficial effects on mint, radish, parsley and coriander plants, which were found to reach higher yields, and accumulate more iron in their tissues [9].
Although numerous studies have considered the growth performance of lettuce in aquaponics systems due to its high economic value [44], studies of plant functional responses are almost absent. Although lettuce yield evaluation may give a direct picture of aquaponics productivity, it may not adequately describe the system performance when dynamic variables change, hence cannot identify limitations and weak points. The present study reports an in-depth physiological evaluation of plants grown under the inevitable for aquaponics deficiency of essential nutrients, like Fe and K. Iron content in leaf tissues is strongly related to the chls concentration, since Fe is a structural factor of many enzymes involved in chls biosynthesis [45]. In fact, a linear relationship between Fe and chl content is evident in hydroponics, unlike the more complex soil cultivation [46]. Therefore, Fe deficiency when mild is reflected in declined chlorophyll content, but in more severe cases results in interveinal chlorosis up to necrotic spots. Fe supplementation in the present experiment significantly increased the concentration of chla compared to control plants. Nevertheless, the latter did not show any visible symptoms of Fe deficiency-induced chlorosis, though Fe content of their leaves was 40% lower than the other two treatments. The concentration of secondary pigments remained unaffected by nutrient inputs. K and Fe shortage directly impaired all photosynthetic pigments, fully corroborating previous studies [47,48,49], yet not to the same extent. Chla biosynthesis was more susceptible than chlb and car in control lettuce plants resulting in declined chla/b and chls/car ratios which denote a higher relative chlb and car content respectively. This result is indicative of a need to amplify the light harvesting capacity of control plants as a possible mechanism to counteract the decrease of chla. The differential effect of Fe deficiency on pigment content of pear leaves was emphasized by Morales et al. (2000) [47], where the decreased chls/car was attributed to a relative enrichment in xanthophylls, linked to their role in thermal dissipation of excess energy. Roosta et al. (2018) [48] working with lettuce, also reported that Fe deficiency was more effective in decreasing chla concentration compared to chlb and car, while in an earlier work with aquaponics-grown peppers Roosta and Mohsenian (2012) [50] reported that Fe addition triggered chl and car biosynthesis but did not affect chlb.
Gas exchange parameters and chl a fluorescence were determined on a weekly basis, permitting a detailed monitoring of treatment effects on the photosynthetic machinery. The second week of the experiment implementation was crucial for CO2 assimilation performance of control plants, as evidenced from both light curves and measurements at ambient conditions. A shift to lower values was observed at that time-point and retained until the end of the experiment. On the contrary, Fe and Fe+K groups sustained high and similar photosynthetic rates, until the last measurement, in which a reduction was observed possibly linked with lower gs, or age-related events. The inferiority of control plants in all the above attributes is linked to both K and Fe deficiency. Low photosynthetic rates evidenced in control plants may be associated with the observed chlorophyll decrease and reduced PSII photochemical efficiency. Moreover, several processes and characteristics not evaluated in the present work, such as the decline of Rubisco carboxylation efficiency or down-regulation of Rubisco gene expression, along with reductions in the number of photosynthetic units per area and poor chloroplast ultrastructure may account for the impaired photosynthesis according to the relevant literature [46,49]. Photosynthesis was affected more than transpiration, which is quite common under Fe-deficiency [46], ruling out that stomatal limitations play a crucial role.
Fe and K deficiency-mediated reductions in PSII photochemical efficiency was a significant effect in control lettuce plants and should be considered an important factor in shaping the gas exchange profile. Monitoring of the photosynthetic apparatus performance revealed pronounced changes of quantum yields, efficiency of electron transport and energy fluxes in control plants compared with Fe and Fe+K groups, the latter showing a comparable picture. The overall performance of photochemical activity (PItotal) was decreased in control plants, a result that should be further analyzed into PSII and PSI-related effects because PItotal is a product of four components. The maximum yield of PSII photochemistry, indicated by Fv/Fm, and the quantum yield of electron transport through PSII to intermediate acceptors (φEo) started declining significantly in control plants already from D14 of the experiment. These data reveal progressively increasing limitations in linear electron flow along PSII. Contrarily to the PSII-related depression, the PSI-related parameters of control plants showed interesting increases. The apparent increase of δRo, i.e., the efficiency with which an electron moves from QB to the PSI end-electron acceptors, along with the better relative yield of PSI final acceptors (1/VΙ) and the yield of PSI reaction centers indicate a well-working, unaffected by nutrient deficiencies PSI. Analogous results were found in tomato experiencing Fe and K deficiency and were ascribed to a decrease in the ratio between number of active PSII and PSI reaction centers [51]. All the above-analyzed findings collectively point to a PSII inferiority in control lettuce plants, in terms of both yield of electron transport and excitation energy capture by open PSII reaction centers, the latter possibly connected with chl loss after the first days of the experiment. Relevant studies in an attempt to explain the reduced PSII activity strongly suggest that Fe and K deficiency induces photoinhibitory damage to PSII [48,51]. The energy fluxes measured in control lettuce plants may be seen in this frame. Over the course of the experiment, control plants doubled the absorbed energy, displayed a 50% increase in trapped energy, but concomitantly underwent a significant five-fold increase in dissipated energy, all expressed per RC. The increased ABS/RC has been linked to inactivated PSII RCs which result in the enhancement of energy dissipation under nutrient deficiencies [47,48,51]. Following the concept of these authors, all the above-described reductions in chl content, photosynthetic rate and PSII efficiency may be considered as down-regulation mechanisms of control plants to protect their gradually declining photosynthetic apparatus from photo-oxidative damage. Moreover, a parallel sink-source feedback mechanism may exist between photochemical performance and sink demand under nutrient deficiency. The observed biomass reduction of control plants compared to Fe and Fe+K groups denotes lower demand for assimilates, which may be associated with down-regulation of photosynthesis.
Nutrient composition of lettuce leaves confirmed the lower content of Fe and K in control plants. The level of deficiency was apparently above the threshold for chlorosis symptoms, low enough however to impede the photosynthetic process and compromise growth. The targeted Fe and K enrichment ameliorated both processes and was reflected in leaf content. Lettuce is a not a highly demanding plant in terms of nutrient supplementation. Delaide et al., (2016) [12] reported that a four-fold increase in NO3–N concentration in hydroponics water compared with aquaponics resulted in similar lettuce yield in both treatments. Nevertheless, foliar application of K, Mg, Fe, Mn, Zn, and Cu was reflected in increased concentrations, which alleviated nutrient deficiencies in leaves of aquaponics-grown tomatoes [14]. Fe input has been proved to significantly improve growth through enhanced Fe, K, Ca, and Mg leaf content in aquaponics-grown peppers [50]. Data obtained from the current experiment partially corroborate these results, since increased Ca and Mg leaf concentrations were obtained only in the Fe group and not in the Fe+K group. The Mn content of lettuce leaves was lower in Fe-deficient control plants, contrarily to the well documented antagonistic relationship between Fe and Mn. These metals, as well as Fe-Zn and Fe-Cu compete for metal transporters and binding proteins, hence the Fe-deficiency was expected to result in enhanced Zn, Cu and particularly Mn concentrations in control plants [52]. However, the elemental analysis of lettuce leaves did not confirm any of these directions. In fact, Zn and Cu content remained unaffected, while Mn showed a remarkable three-fold increase in Fe-enriched groups. Although analogous results were obtained for foliar Fe application in soil grown soybean [53], the measurements of the present experiment does not allow a plausible explanation, confirming that the crosstalk among the three metals is a complex, multi-level phenomenon.
Both Fe- and K-deficiency are connected with oxidative damage due to accumulation of reactive oxygen species (ROS) [54,55]. The antioxidant defense mechanisms of plants, including non-enzymatic and enzymatic components may combat the detrimental effects of ROS on photosynthetic machinery and membrane integrity. In the present study, the antioxidant activity of all lettuce groups during the experimental period showed a pronounced uptrend particularly until day 30, possibly reflecting a developmental pattern. Slight but statistically significant decreases were recorded in control plants compared to the other treatments at this period, which started at day 20. Previous works on nutrient deficiency emphasise that a prolonged period of nutrient limitation favours ROS accumulation because their generation rate exceeds their scavenging rate due to insufficient antioxidant activity [11,55]. Notably, the Fe deficiency-imposed oxidative damage is more prominent since Fe is a co-factor or central constituent of major antioxidant enzymes [54]. Combined Fe and K shortage potentiated the inefficiency of antioxidant defence in control lettuce, while Fe group also faced the effects of K limitation, resulting in statistically significant reduction of antioxidant activity in the end compared with Fe+K group. It is noteworthy that the time-point of day 20 coincides with the beginning of photosynthetic decline in control plants and the associated photosynthetic machinery impairments. Both of these processes may be well connected with the antioxidant profile of this plant group, since under conditions of damaged light reaction systems molecular O2 serves as alternative acceptor of electrons and light energy that cannot be utilised in photochemistry, substantially increasing ROS generation.
Roots’ bacterial communities were clearly separated from the water bacterial communities, suggesting that the plants during the experimental period selected for specific bacteria. In this selection, the Fe and Fe+K treatments seemed to have little effect on the roots’ microbiota as these samples were grouped together based on their microbiota structure and relative abundance. Some of the dominant OTUs at the end of the experiment belonged to bacterial families, e.g., Flavobacteriaceae and Rhizobiaceae, reported previously in lettuce-associated aquaponics experiments [56,57] and are considered typical residents of the plant rhizosphere [58].

5. Conclusions

The concept of minimal nutrient supplementation in aquaponics systems introduced in the present study revealed that although Fe addition sustains high photosynthetic rates and capacity and a functional photosynthetic apparatus without stress symptoms, the complemented K addition is necessary to ensuring improved lettuce yield. Control plants of no external inputs suffered Fe, K, and Mn deficiency, which significantly impaired all the biochemical and physiological parameters measured, i.e., gas exchange, efficiency of photosynthetic apparatus, pigment content, antioxidant activity, and growth. The crucial time-point for the appearance of these changes was the 14th day of the experiment, with photosynthesis and chl fluorescence being the first processes to be affected. This early stress indication confirms the significance of studying plant’s functional responses and their role in identifying system limitations and weak points. The dynamic changes of crop performance monitored in the present study provide practical implications for nutrient management in recirculating aquaponics systems when a dual target has been set, i.e., to sustain the reduced ecological footprint while improving crop production.

Author Contributions

Investigation and formal analysis E.T.; investigation K.A.K.; methodology N.V. and P.K.; funding acquisition, N.K., E.M. and E.L.; writing—original draft preparation E.L.; writing—review and editing E.M., N.K., K.A.K. and E.L.; conceptualization E.L. All authors have read and agreed to the published version of the manuscript.

Funding

The work was co-financed by the European Union and Greek national funds through the Operational Program Competitiveness, Entrepreneurship and Innovation, under the call RESEARCH—CREATE—INNOVATE (project code:T1EDK-01153) as well as the Hellenic Foundation for Research and Innovation (HFRI) under the HFRI PhD Fellowship grant (Fellowship Number: 528) for E. Tsoumalakou. The implementation of the doctoral thesis was co-financed by Greece and the European Union (European Social Fund-ESF) through the Operational Programme “Human Resources Development, Education and Lifelong Learning” in the context of the Act “Enhancing Human Resources Research Potential by undertaking a Doctoral Research” Sub-action 2: IKY Scholarship Programme for PhD candidates in the Greek Universities.

Institutional Review Board Statement

All experimental procedures were conducted according to the guidelines of the EU Directive 2010/63/EU regarding the protection of animals used for scientific purposes and were applied by FELASA accredited scientists (functions A–D). The experimental protocol was approved by the Ethics Committee and conducted at the registered experimental facility (EL-43BIO/exp-01) of the Laboratory of Aquaculture, Department of Ichthyology and Aquatic Environment, University of Thessaly (n. 18399/2019).

Informed Consent Statement

Not applicable.

Data Availability Statement

Not applicable.

Conflicts of Interest

The authors declare no conflict of interest.

References

  1. Rakocy, J.E.; Bailey, D.S.; Shultz, R.C.; Thoman, E.S. Update on Tilapia and Vegetable Production in the UVI Aquaponic System. In New Dimensions on Farmed Tilapia, Proceedings of the Sixth International Symposium on Tilapia in Aquaculture, Manila, Philippines, 12–16 September 2004; Creative Unlimited: Cham, Switzerland, 2004. [Google Scholar]
  2. Delaide, B.; Delhaye, G.; Dermience, M.; Gott, J.; Soyeurt, H.; Jijakli, M.H. Plant and Fish Production Performance, Nutrient Mass Balances, Energy and Water Use of the PAFF Box, a Small-Scale Aquaponic System. Aquac. Eng. 2017, 78, 130–139. [Google Scholar] [CrossRef]
  3. FAO. The State of World Fisheries and Aquaculture; Food and Agricultural Organization: Rome, Italy, 2014. [Google Scholar]
  4. Robaina, L.; Pirhonen, J.; Mente, E.; Sánchez, J.; Goosen, N. Fish Diets in Aquaponics. In Aquaponics Food Production Systems; Goddek, S., Joyce, A., Kotzen, B., Burnell, G.M., Eds.; Springer International Publishing: Cham, Switzerland, 2019; pp. 333–352. ISBN 978-3-030-15942-9. [Google Scholar]
  5. Endut, A.; Jusoh, A.; Ali, N.; Wan Nik, W.B.; Hassan, A. A Study on the Optimal Hydraulic Loading Rate and Plant Ratios in Recirculation Aquaponic System. Bioresour. Technol. 2010, 101, 1511–1517. [Google Scholar] [CrossRef] [PubMed]
  6. Graber, A.; Junge, R. Aquaponic Systems: Nutrient Recycling from Fish Wastewater by Vegetable Production. Desalination 2009, 246, 147–156. [Google Scholar] [CrossRef]
  7. Rafiee, G.R.; Ros Saad, C.; Kamarudin, M.S.; Ismail, M.R.; Sijam, K. Effects of Supplementary Nutrient in an Aquaponic System for Production of Ornamental Red Tilapia (Oreochromis sp.) and Lettuce (Lactuca Sativa var Longifolia). Surv. Fish. Sci. 2019, 5, 65–75. [Google Scholar] [CrossRef]
  8. Rakocy, J.E. Aquaponics:Integrating Fish and Plant Culture. Aquac. Prod. Syst. 2012, 1, 344–386. [Google Scholar]
  9. Roosta, H.R. Effects of Foliar Spray of K on Mint, Radish, Parsley and Coriander Plants in Aquaponic System. J. Plant Nutr. 2014, 37, 2236–2254. [Google Scholar] [CrossRef]
  10. Kasozi, N.; Tandlich, R.; Fick, M.; Kaiser, H.; Wilhelmi, B. Iron Supplementation and Management in Aquaponic Systems: A Review. Aquac. Rep. 2019, 15, 100221. [Google Scholar] [CrossRef]
  11. Molassiotis, A.; Tanou, G.; Diamantidis, G.; Patakas, A.; Therios, I. Effects of 4-Month Fe Deficiency Exposure on Fe Reduction Mechanism, Photosynthetic Gas Exchange, Chlorophyll Fluorescence and Antioxidant Defense in Two Peach Rootstocks Differing in Fe Deficiency Tolerance. J. Plant Physiol. 2006, 163, 176–185. [Google Scholar] [CrossRef]
  12. Delaide, B.; Goddek, S.; Gott, J.; Soyeurt, H.; Jijakli, M. Lettuce (Lactuca Sativa L. var. Sucrine) Growth Performance in Complemented Aquaponic Solution Outperforms Hydroponics. Water 2016, 8, 467. [Google Scholar] [CrossRef]
  13. Nicoletto, C.; Maucieri, C.; Mathis, A.; Schmautz, Z.; Komives, T.; Sambo, P.; Junge, R. Extension of Aquaponic Water Use for NFT Baby-Leaf Production: Mizuna and Rocket Salad. Agronomy 2018, 8, 75. [Google Scholar] [CrossRef] [Green Version]
  14. Roosta, H.R.; Hamidpour, M. Mineral Nutrient Content of Tomato Plants in Aquaponic and Hydroponic Systems: Effect of Foliar Application of Some Macro- and Micro-Nutrients. J. Plant Nutr. 2013, 36, 2070–2083. [Google Scholar] [CrossRef]
  15. Vandam, D.; Anderson, T.; de Villiers, D.; Timmons, M. Growth and Tissue Elemental Composition Response of Spinach (Spinacia Oleracea) to Hydroponic and Aquaponic Water Quality Conditions. Horticulturae 2017, 3, 32. [Google Scholar] [CrossRef] [Green Version]
  16. Buzby, K.M.; Waterland, N.L.; Semmens, K.J.; Lin, L.-S. Evaluating Aquaponic Crops in a Freshwater Flow-through Fish Culture System. Aquaculture 2016, 460, 15–24. [Google Scholar] [CrossRef] [Green Version]
  17. Ru, D.; Liu, J.; Hu, Z.; Zou, Y.; Jiang, L.; Cheng, X.; Lv, Z. Improvement of Aquaponic Performance through Micro- and Macro-Nutrient Addition. Environ. Sci. Pollut. Res. 2017, 24, 16328–16335. [Google Scholar] [CrossRef]
  18. Sonneveld, C.; Straver, N. Nutrient Solutions for Vegetables and Flowers Grown in Water or Substrates. Voedingspoloss. Glas. 1994, 8, 33. [Google Scholar]
  19. Hirayama, K. Water Control by Filtration in Closed Culture Systems. Aquaculture 1974, 4, 369–385. [Google Scholar] [CrossRef]
  20. Markos, N.; Kyparissis, A. Ecophysiological Modelling of Leaf Level Photosynthetic Performance for Three Mediterranean Species with Different Growth Forms. Funct. Plant Biol. 2011, 38, 314–326. [Google Scholar] [CrossRef] [PubMed]
  21. Strasser, R.J.; Srivastava, A.; Tsimilli-Michael, M. The Fluorescence Transient as a Tool to Haracterize and Screen Photosynthetic Samples. In Probing Photosynthesis: Mechanisms, Regulation and Adaptation; Taylor & Francis: Abingdon, UK, 2000; pp. 445–483. ISBN 978-0-12-384905-2. [Google Scholar]
  22. Lichtenthaler, H.K.; Wellburn, A.R. Determinations of Total Carotenoids and Chlorophylls a and b of Leaf Extracts in Different Solvents. Biochem. Soc. Trans. 1983, 11, 591–592. [Google Scholar] [CrossRef] [Green Version]
  23. Avdouli, D.; Max, J.F.J.; Katsoulas, N.; Levizou, E. Basil as Secondary Crop in Cascade Hydroponics: Exploring Salinity Tolerance Limits in Terms of Growth, Amino Acid Profile, and Nutrient Composition. Horticulturae 2021, 7, 203. [Google Scholar] [CrossRef]
  24. Goupy, P.; Hugues, M.; Boivin, P.; Amiot, M.J. Antioxidant Composition and Activity of Barley (Hordeum Vulgare) and Malt Extracts and of Isolated Phenolic Compounds. J. Sci. Food Agric. 1999, 79, 1625–1634. [Google Scholar] [CrossRef]
  25. Hayes, J.E.; Allen, P.; Brunton, N.; O’Grady, M.N.; Kerry, J.P. Phenolic Composition and in Vitro Antioxidant Capacity of Four Commercial Phytochemical Products: Olive Leaf Extract (Olea Europaea L.), Lutein, Sesamol and Ellagic Acid. Food Chem. 2011, 126, 948–955. [Google Scholar] [CrossRef]
  26. Klindworth, A.; Pruesse, E.; Schweer, T.; Peplies, J.; Quast, C.; Horn, M.; Glöckner, F.O. Evaluation of General 16S Ribosomal RNA Gene PCR Primers for Classical and Next-Generation Sequencing-Based Diversity Studies. Nucleic Acids Res. 2013, 41, e1. [Google Scholar] [CrossRef] [PubMed]
  27. Schloss, P.D.; Westcott, S.L.; Ryabin, T.; Hall, J.R.; Hartmann, M.; Hollister, E.B.; Lesniewski, R.A.; Oakley, B.B.; Parks, D.H.; Robinson, C.J.; et al. Introducing Mothur: Open-Source, Platform-Independent, Community-Supported Software for Describing and Comparing Microbial Communities. Appl. Environ. Microbiol. 2009, 75, 7537–7541. [Google Scholar] [CrossRef] [PubMed] [Green Version]
  28. Schloss, P.D.; Gevers, D.; Westcott, S.L. Reducing the Effects of PCR Amplification and Sequencing Artifacts on 16S RRNA-Based Studies. PLoS ONE 2011, 6, e27310. [Google Scholar] [CrossRef] [PubMed] [Green Version]
  29. Quast, C.; Pruesse, E.; Yilmaz, P.; Gerken, J.; Schweer, T.; Yarza, P.; Peplies, J.; Glöckner, F.O. The SILVA Ribosomal RNA Gene Database Project: Improved Data Processing and Web-Based Tools. Nucleic Acids Res. 2013, 41, D590–D596. [Google Scholar] [CrossRef]
  30. Yilmaz, P.; Parfrey, L.W.; Yarza, P.; Gerken, J.; Pruesse, E.; Quast, C.; Schweer, T.; Peplies, J.; Ludwig, W.; Glöckner, F.O. The SILVA and “All-Species Living Tree Project (LTP)” Taxonomic Frameworks. Nucleic Acids Res. 2014, 42, D643–D648. [Google Scholar] [CrossRef] [Green Version]
  31. Sonneveld, C.; Voogt, W. Plant Nutrition of Greenhouse Crops; Springer: Dordrecht, NY, USA, 2009; ISBN 978-90-481-2531-9. [Google Scholar]
  32. Cai, J.; Leung, P.; Luo, Y.; Yuan, X.; Yuan, Y. Food and Agriculture Organization of the United Nations. In Improving the Performance of Tilapia Farming under Climate Variation: Perspective from Bioeconomic Modelling; FAO: Rome, Italy, 2018; ISBN 978-92-5-130162-3. [Google Scholar]
  33. Somerville, C.; Cohen, M.; Pantanella, E.; Stankus, A.; Lovatelli, A. Food and Agriculture Organization of the United Nations. In Small-Scale Aquaponic Food Production: Integrated Fish and Plant Farming; FAO: Rome, Italy, 2014; ISBN 978-92-5-108533-2. [Google Scholar]
  34. Maucieri, C.; Nicoletto, C.; Junge, R.; Schmautz, Z.; Sambo, P.; Borin, M. Hydroponic Systems and Water Management in Aquaponics: A Review. Ital. J. Agron. 2018, 13, 1–11. [Google Scholar] [CrossRef] [Green Version]
  35. Rakocy, J.E.; Masser, M.P.; Losordo, T. Recirculating Aquaculture Tank Production Systems: Aquaponics-Integrating Fish and Plant Culture; SRAC Publication: Washington, DC, USA, 2006. [Google Scholar]
  36. Schneider, O.; Sereti, V.; Eding, E.H.; Verreth, J.A.J. Analysis of Nutrient Flows in Integrated Intensive Aquaculture Systems. Aquac. Eng. 2005, 32, 379–401. [Google Scholar] [CrossRef]
  37. Randall, D.J.; Tsui, T.K.N. Ammonia Toxicity in Fish. Mar. Pollut. Bull. 2002, 45, 17–23. [Google Scholar] [CrossRef]
  38. Pantanella, E.; Cardarelli, M.; Colla, G.; Rea, E.; Marcucci, A. Aquaponics vs. Hydroponics: Production and Quality of Lettuce Crop. Acta Hortic. 2012, 927, 887–893. [Google Scholar] [CrossRef]
  39. Resh, H.M. Hydroponic Food Production: A Definitive Guidebook for the Advanced Home Gardener and the Commercial Hydroponic Grower, 7th ed.; CRC Press: Boca Raton, FL, USA, 2013; ISBN 978-1-4398-7867-5. [Google Scholar]
  40. da Silva, M.A.; de Alvarenga, R.; da Costa, F.F.B.; Turra, E.M.; Alves, G.F.D.O.; Manduca, L.G.; de Sales, S.C.M.; Leite, N.R.; Bezerra, V.M.; Moraes, S.G.D.S.; et al. Feeding Management Strategies to Optimize the Use of Suspended Feed for Nile Tilapia (Oreochromis Niloticus) Cultivated in Bioflocs. Aquac. Res. 2020, 51, 605–615. [Google Scholar] [CrossRef]
  41. Stathopoulou, P.; Tsoumalakou, E.; Levizou, E.; Vanikiotis, T.; Zaoutsos, S.; Berillis, P. Iron and Potassium Fertilization Improve Rocket Growth without Affecting Tilapia Growth and Histomorphology Characteristics in Aquaponics. Appl. Sci. 2021, 11, 5681. [Google Scholar] [CrossRef]
  42. Lennard, W. Aquaponic System Design Parameters: Fish to Plant Ratios (Feeding Rate Ratios). Aquaponic Solut. 2012, 3, 1–11. [Google Scholar]
  43. Nozzi, V.; Graber, A.; Schmautz, Z.; Mathis, A.; Junge, R. Nutrient Management in Aquaponics: Comparison of Three Approaches for Cultivating Lettuce, Mint and Mushroom Herb. Agronomy 2018, 8, 27. [Google Scholar] [CrossRef] [Green Version]
  44. Yang, T.; Kim, H.-J. Nutrient Management Regime Affects Water Quality, Crop Growth, and Nitrogen Use Efficiency of Aquaponic Systems. Sci. Hortic. 2019, 256, 108619. [Google Scholar] [CrossRef]
  45. Marschner, H.; Marschner, P. (Eds.) Marschner’s Mineral Nutrition of Higher Plants, 3rd ed.; Elsevier: London, UK; Academic Press: Waltham, MA, USA, 2012; ISBN 978-0-12-384905-2. [Google Scholar]
  46. Larbi, A.; Abadía, A.; Abadía, J.; Morales, F. Down Co-Regulation of Light Absorption, Photochemistry, and Carboxylation in Fe-Deficient Plants Growing in Different Environments. Photosynth. Res. 2006, 89, 113–126. [Google Scholar] [CrossRef] [Green Version]
  47. Morales, F.; Belkhodja, R.; Abadía, A.; Abadía, J. Photosystem II Efficiency and Mechanisms of Energy Dissipation in Iron-Deficient, Field-Grown Pear Trees (Pyrus Communis L.). Photosynth. Res. 2000, 63, 9–21. [Google Scholar] [CrossRef] [Green Version]
  48. Roosta, H.R.; Estaji, A.; Niknam, F. Effect of Iron, Zinc and Manganese Shortage-Induced Change on Photosynthetic Pigments, Some Osmoregulators and Chlorophyll Fluorescence Parameters in Lettuce. Photosynthetica 2018, 56, 606–615. [Google Scholar] [CrossRef]
  49. Zhao, D.; Oosterhuis, D.M.; Bednarz, C.W. Influence of Potassium Deficiency on Photosynthesis, Chlorophyll Content, and Chloroplast Ultrastructure of Cotton Plants. Photosynthetica 2001, 39, 103–109. [Google Scholar] [CrossRef]
  50. Roosta, H.R.; Mohsenian, Y. Effects of Foliar Spray of Different Fe Sources on Pepper (Capsicum Annum L.) Plants in Aquaponic System. Sci. Hortic. 2012, 146, 182–191. [Google Scholar] [CrossRef]
  51. Kalaji, H.M.; Oukarroum, A.; Alexandrov, V.; Kouzmanova, M.; Brestic, M.; Zivcak, M.; Samborska, I.A.; Cetner, M.D.; Allakhverdiev, S.I.; Goltsev, V. Identification of Nutrient Deficiency in Maize and Tomato Plants by in Vivo Chlorophyll a Fluorescence Measurements. Plant Physiol. Biochem. 2014, 81, 16–25. [Google Scholar] [CrossRef] [PubMed]
  52. Rai, S.; Singh, P.K.; Mankotia, S.; Swain, J.; Satbhai, S.B. Iron Homeostasis in Plants and Its Crosstalk with Copper, Zinc, and Manganese. Plant Stress 2021, 1, 100008. [Google Scholar] [CrossRef]
  53. Moosavi, A.A.; Ronaghi, A. Influence of Foliar and Soil Applications of Iron and Manganese on Soybean Dry Matter Yield and Iron-Manganese Relationship in a Calcareous Soil. Aust. J. Crop Sci. 2011, 5, 1550–1556. [Google Scholar] [CrossRef]
  54. Kabir, A.H.; Debnath, T.; Das, U.; Prity, S.A.; Haque, A.; Rahman, M.M.; Parvez, M.S. Arbuscular Mycorrhizal Fungi Alleviate Fe-Deficiency Symptoms in Sunflower by Increasing Iron Uptake and Its Availability along with Antioxidant Defense. Plant Physiol. Biochem. 2020, 150, 254–262. [Google Scholar] [CrossRef]
  55. Patel, M.; Fatnani, D.; Parida, A.K. Potassium Deficiency Stress Tolerance in Peanut (Arachis Hypogaea) through Ion Homeostasis, Activation of Antioxidant Defense, and Metabolic Dynamics: Alleviatory Role of Silicon Supplementation. Plant Physiol. Biochem. 2022, 182, 55–75. [Google Scholar] [CrossRef] [PubMed]
  56. Kasozi, N.; Kaiser, H.; Wilhelmi, B. Effect of Bacillus spp. on Lettuce Growth and Root Associated Bacterial Community in a Small-Scale Aquaponics System. Agronomy 2021, 11, 947. [Google Scholar] [CrossRef]
  57. Schmautz, Z.; Graber, A.; Jaenicke, S.; Goesmann, A.; Junge, R.; Smits, T.H.M. Microbial Diversity in Different Compartments of an Aquaponics System. Arch. Microbiol. 2017, 199, 613–620. [Google Scholar] [CrossRef]
  58. Ling, N.; Wang, T.; Kuzyakov, Y. Rhizosphere Bacteriome Structure and Functions. Nat. Commun. 2022, 13, 836. [Google Scholar] [CrossRef]
Figure 1. Schematic side view of one lab-scale aquaponic system used in the experiment. The arrows indicate the water flow inside the system.
Agriculture 12 01278 g001
Figure 2. Concentration of photosynthetic pigments and their ratios during the experimental period (Mean ± SEM, n = 15). (a) chla; (b) chlb; (c) car; (d) chl a to b ratio; (e) total chls to car ratio. Different letters indicate significant differences among treatments at each experimental day (p < 0.05) and the absence of letters in (b,c) denotes no significant differences in any experimental day.
Agriculture 12 01278 g002
Figure 3. Gas exchange measurements during the experimental period. (a) photosynthetic rate (A); (b) stomatal conductance (gs); (c) transpiration rate (E) (Mean ± SEM, n = 15). Different letters indicate significant differences among treatments at each experimental day (p < 0.05).
Agriculture 12 01278 g003
Figure 4. Photosynthetic light-response curves of lettuce (a) Day 7; (b) Day 21; (c) Day 42 (Mean ± SD, n = 8) and their respective maximum photosynthetic rates (Amax), quantum yield of photosynthesis (a) and dark respiration (Rd) at the side tables. Means in a row followed by different letters are significantly different (p < 0.05).
Agriculture 12 01278 g004
Figure 5. Spider plots of JIP parameters deduced from chl a fluorescence OJIP transient curves in lettuce (mean values, n = 48) for 6 experimental days. (a) Day 7; (b) Day 14; (c) Day 21; (d) Day 28; (e) Day 35; (f) Day 42. Values are normalized to the values of Fe+K treatment. The statistical results for each parameter and day are presented in the bottom table. Since there were no significant differences between Fe and Fe+K groups, all the sings refer to differences of control plants with the other two groups (n.s. means non-significant differences and the asterisk indicates differences at p < 0.001).
Agriculture 12 01278 g005
Figure 6. DPPH radical scavenging activity of lettuce leaves during the experimental period, expressed as ascorbic acid equivalents (Mean ± SEM, n = 6). Different letters indicate significant differences among treatments at each experimental day (p < 0.05).
Agriculture 12 01278 g006
Figure 7. Clustering of the water and root bacterial community composition. W: water; R: root; C: control; Fe: iron; K: potassium; D0: the first sampling just before the commencement of the experiment; D45: the second sampling at the 45th day of the experiment.
Agriculture 12 01278 g007
Figure 8. The most dominant bacterial families (cumulative relative abundance ≥80% in the averaged sample). W: water; R: root; C: control; Fe: iron; K: potassium; D0: the first sampling just before the commencement of the experiment; D45: the second sampling at the 45th day of the experiment.
Agriculture 12 01278 g008
Table 1. The selected parameters derived from the fast OJIP fluorescence induction with their explanations and equations.
ParametersExplanations
Fo = F50μsThe initial value of the fluorescence. This is the first reliable fluorescence value after the illumination
F300μs, FJ, FIThe fluorescence values at 300 μs, 2 ms and 30 ms respectively
FMThe maximum value of fluorescence. This is the maximum level of OJIP curve
AreaArea between from fluorescence induction (OJIP) curve to maximal fluorescence FM
Sm = Area − FVNormalized total complementary area above the OJIP transient
FV = FM − FοVariable chl fluorescence
FV/FMMaximal quantum yield of PSII photochemistry
Mo = 4 (F300 μs− Fο)/(FM − Fο)The initial slope (in ms−1) of relative variable chl fluorescence curve (for Fo = F50μs)
VJ = (F2 ms − Fο)/(FM − Fο)Relative variable fluorescence at 2 ms—point J of OJIP curve
VI = (F30 ms − Fο)/(FM − Fο)Relative variable fluorescence at 30 ms—point I of OJIP curve
φPo = TRο/ABS = FV/FM = 1 − Fο/FMMaximum quantum yield of primary photochemistry (at t = 0)
φEo = ETο/ABS = φPo·ψEο = 1 − FJ/FMQuantum yield of electron transport to intermediate acceptors
φRo = φPο·ψEο·δRο = 1 − FI/FMQuantum yield of electron transport to final acceptors
ψEο = ETο/TRο = 1 − VJProbability that a trapped exciton moves an electron into the electron transport chain to intermediate acceptors
δRo = REο/ETο = (1 − VI)/(1 − VJ)Probability that a trapped exciton moves an electron into the electron transport chain from intermediate receptors to final acceptors of PSI
1 − VIYield of reactive centers of PSI
1/VIRelative yield of final acceptors e of PSI
ABS/RC = (Mo/VJ)·FM/(FM − Fo)Absorption flux (for PSII antenna chls) per reaction center (RC)
TRo/RC = Mo/VJTrapped energy flux per RC
DIo/RC = (Mo/VJ)·(Fo/FV)Dissipated energy flux per RC
PItotal = (RC/ABS)·(φPo/1 − φPo)
(ψEο/1 − ψEο)·(δRo/1 − δRo)
Index of total photosynthetic efficiency
Table 2. Water physicochemical and quality parameters during the experimental period, expressed as Mean ± SEM (n = 117 for pH, n = 60 for O2 and EC, n = 21 for NH3, NO2, NO3, PO43−, SO42−, Fe, K, Ca2+, Na). Different superscripts in a row denote statistically significant differences among treatments (p < 0.05).
ControlFeFe+K
pH7.04 ± 0.04 a7.01 ± 0.05 a7.08 ± 0.04 a
O2 (mg L−1)8.22 ± 0.09 a8.05 ± 0.08 a8.05 ± 0.08 a
EC (μS cm−1)924.35 ± 25.35 b950.29 ± 25.61 b1628.44 ± 61.85 a
NH3 (mg L−1)0.06 ± 0.01 a0.07 ± 0.01 a0.08 ± 0.01 a
NO2 (mg L−1)0.04 ± 0.004 a0.03 ± 0.004 a0.03 ± 0.004 a
NO3 (mg L−1)111.09 ± 11.89 a100.64 ± 11.05 a95.11 ± 10.22 a
PO43− (mg L−1)41.64 ± 2.44 a38.81 ± 2.03 a45.41 ± 3.41 a
SO42− (mg L−1)41.13 ± 1.74 b44.17 ± 1.38 b319.62 ± 28.25 a
Fe (mg L−1)0.11 ± 0.04 b1.67 ± 0.17 a1.65 ± 0.17 a
K (mg L−1)10.65 ± 1.45 b9.81 ± 1.35 b278.99 ± 25.99 a
Ca2+ (mg L−1)22.57 ± 1.92 b24.34 ± 2.37 b32.09 ± 2.92 a
Na (mg L−1)96.46 ± 6.74 a101.67 ± 6.36 a91.15 ± 5.29 a
Table 3. Growth parameters of red tilapia (Mean ± SEM, n = 90). Different superscripts in a row denote statistically significant differences among treatments (p < 0.05).
ControlFeFe+K
Initial weight (g)15.97 ± 0.61 a16.06 ± 0.62 a16.07 ± 0.63 a
Initial lenght (cm)9.98 ± 0.14 a9.93 ± 0.15 a9.95 ± 0.15 a
Final weight (g)52.32 ± 1.62 a57.23 ± 2.15 a57.48 ± 2.11 a
Final lenght (cm)14.42 ± 0.14 a14.73 ± 0.17 a14.72 ± 0.18 a
SGR (% day−1)2.55 ± 0.04 b2.67 ± 0.05 a2.73 ± 0.04 a
Daily feed consumption (g day−1)21.84 ± 0.68 a23.30 ± 0.74 a24.22 ± 0.68 a
FCR0.93 ± 0.04 a0.86 ± 0.04 a0.84 ± 0.04 a
Survival (%)90.00 a88.89 a88.89 a
Table 4. Growth parameters of lettuce measured at the final harvest (Mean ± SEM, n = 24). Different superscripts in a row denote statistically significant differences among treatments (p < 0.05).
Lettuce Growth Performance (Mean ± SEM)ControlFeFe+K
Aerial part fresh weight (g)148.98 ± 20.14 b190.35 ± 21.97 b322.99 ± 42.51 a
Aerial part dry weight (g)6.77 ± 0.71 c9.18 ± 0.95 b14.26 ± 1.65 a
Root dry weight (g)1.19 ± 0.35 b2.05 ± 0.57 a2.65 ± 0.66 a
Root to shoot ratio0.15 ± 0.03 a0.19 ± 0.03 a0.17 ± 0.02 a
Number of leaves32.54 ± 1.50 b34.83 ± 1.53 b41.96 ± 1.88 a
Leaf area (cm2)2230.80 ± 275.15 b2809.52 ± 320.01 ab4205.98 ± 527.83 a
Table 5. Nutrient composition of lettuce leaves at the final harvest (Mean ± SEM, n = 4). Different superscripts in a row denote statistically significant differences among treatments (p < 0.05).
ControlFeFe+K
%N3.39 ± 0.22 a3.28 ± 0.03 a3.39 ± 0.26 a
P0.70 ± 0.05 a0.77 ± 0.04 a0.76 ± 0.02 a
K6.87 ± 0.28 b5.93 ± 0.22 b7.56 ± 0.53 a
Ca1.46 ± 0.11 a1.36 ± 0.10 a1.20 ± 0.12 b
Mg0.37 ± 0.04 b0.43 ± 0.01 a0.30 ± 0.02 c
ppmFe54.70 ± 6.52 b82.99 ± 7.02 a90.01 ± 15.00 a
Zn19.14 ± 2.30 a23.01 ± 1.56 a23.63 ± 2.47 a
Mn7.00 ± 0.68 b24.44 ± 1.35 a23.96 ± 2.86 a
Cu5.31 ± 0.26 a5.59 ± 0.68 a7.04 ± 1.76 a
Table 6. Alpha diversity data of water and root bacterial communities. W: water; R: root; C; control; Fe: iron; K: potassium; D0: the first sampling just before the commencement of the experiment; D45: the second sampling at the 45th day of the experiment.
TreatmentNo. of OTUsSimpson 1-D ± SDRelative Abundance of the Most Abundant OTUNo. of Dominant OTUs *
W-D03940.73Flavobacterium sp.
41.7%
4
W-C-D453670.65Polynucleobacter sp.
55.6%
3
W-Fe-D453790.89Flavobacterium sp.
18.5%
8
W-FeK-D452150.74Oxalobacteraceae
34.0%
3
R-D05810.98Rhizobiaceae
8.3%
67
R-C-D458450.96Flavobacterium sp.
12.0%
91
R-Fe-D457910.95Actinoplanes sp.
15.0%
75
R-FeK-D456760.97Rhizobiaceae
11.0%
78
* Cumulative relative abundance ≥80% in the averaged sample.
Publisher’s Note: MDPI stays neutral with regard to jurisdictional claims in published maps and institutional affiliations.

