Article

Effect of Water Deficit on Growth and Photoassimilate Partitioning in Leersia hexandra and Luziola peruviana

by
Renan Souza Silva
1,
Ananda Scherner
2,
Cristiane Jovelina Da-Silva
1,
Edinalvo Rabaioli Camargo
3,
Roque Mauricio Palacios-Zuñiga
3,
Fabio Schreiber
4,
Luciano do Amarante
5,
José Maria Barbat Parfitt
6 and
Luis Antonio de Avila
7,*
1
Plant Physiology Graduate Program, Federal University of Pelotas (UFPel), Campus Universitário, S/N, Capão do Leão 96160-000, Brazil
2
BioPhero, Lersø Parkallé 42, 4th Floor, 2100 Copenhagen, Denmark
3
Crop Protection Graduate Program, Federal University of Pelotas (UFPel), Capão do Leão 96160-000, Brazil
4
Syngenta, Av. das Nações Unidas, 17007-Várzea de Baixo, São Paulo 04729, Brazil
5
Chemical Sciences, Pharmaceutical and Food Center (UFPel), Campus Universitário, S/N, Capão do Leão 96160-000, Brazil
6
Brazilian Agricultural Research Corporation (Embrapa), Campus Universitário, S/N, Capão do Leão 96010-971, Brazil
7
Department of Crop Protection, Federal University of Pelotas (UFPel), Campus Universitário, S/N, Capão do Leão 96160-000, Brazil
*
Author to whom correspondence should be addressed.
Agriculture 2022, 12(8), 1261; https://doi.org/10.3390/agriculture12081261
Submission received: 22 June 2022 / Revised: 2 August 2022 / Accepted: 16 August 2022 / Published: 19 August 2022
(This article belongs to the Section Crop Protection, Diseases, Pests and Weeds)

Abstract

:
Minimum tillage in rice production is increasing in southern Brazil, reaching 60% of the total planted area. Compared to conventional tillage, in this system there is an increase in the occurrence of perennial weeds, such as Luziola peruviana and Leersia hexandra, which are amphibious plants, as they can occur in both flooded environments and aerobic conditions. These weeds are controlled in burn-down before rice planting by glyphosate applications, the efficacy of which depends on the soil moisture. This study aimed to evaluate the effect of different soil moisture regimes in L. hexandra and L. peruviana growth and photoassimilate partitioning. Both species were assessed under soil moisture regimes of flooded, saturated, 7 kPa, 15 kPa, 40 kPa, and 100 kPa (experiment 1) and flooded, saturated, and 7 kPa (experiment 2). Plants were sampled immediately after drainage (3 months after transplant) and 1 and 2 weeks after drainage. The results showed that as soil moisture levels decreased, growth and development parameters were negatively affected in both species. Photoassimilate partitioning was affected by water regime and differences were observed between species. The total soluble sugars and starch content decreased in the leaves, and sucrose concentration increased in the roots following drainage. Soil drainage affects the growth and alters carbohydrate partitioning of these weeds, increasing the sugar storage in roots. The agronomic impact of these findings is that this behavior may affect herbicide transport in phloem and may affect herbicide efficacy.

Graphical Abstract

1. Introduction

Weed infestation in paddy fields is one of the main limiting factors of rice (Oryza sativa L.) production, especially when weeds are adapted to flooded soils [1]. In these areas, the most important weeds in Brazil are Oryza sativa L. (weedy rice) [2,3] and Echinochloa spp. [4,5]. The use of herbicides is the most used method due to its advantages, including its being easy to use, convenient, and efficient [6].
The Clearfield system was introduced in Brazil in the early 2000s and was an alternative for weedy rice control. However, the continuous use of the system resulted in the selection of weedy rice-resistant populations to the imidazolinone herbicides [7]. With the increase in the use of the minimum-tillage rice production as an alternative to control these species, the area of which reached 61% in last year’s growing season in Brazil [8], there was an increase in the presence of perennial grasses like Luziola peruviana Juss. (Peruvian water grass) [9,10] and Leersia hexandra Sw. (rice cut-grass) [9,10,11]. These species occur in southern Brazil, inhabiting lowland areas and canals of irrigation and drainage [9]. Their presence in the irrigation and drainage canals reduces water flow due to the high amount of biomass they produce [10]. Weed control in irrigation canals is a difficult task, and many times in the presence of perennial grasses species [12], heavy machinery is needed to clean the ditches, which makes the process costly and slow. Thus, glyphosate (5-enolpyruvylshikimate-3-phosphate synthase inhibitor) becomes an alternative for cleaning canals, as it is a relatively cheap and accessible herbicide. As a broad-spectrum product, it also controls other unwanted plants in the area, in addition to not having residual activity [13].
Controlling L. peruviana and L. hexandra in the rice field is challenging, because it is essential to sow rice with this weed entirely controlled by the burn-down application. Recent studies, however, indicate that the high soil moisture and the low air temperature decrease herbicide efficacy in these weeds [10]. It is well known that plants subjected to severe water deficit have physiological responses (such as reduced stomatal conductance and high rates of temperature inside plant cells) that cause morphological changes, such as an increase in cuticle thickness and a decrease in leaf area, to avoid more significant losses due to transpiration, in addition to possible reductions in plant weight [14]. Hence, a severe water deficit leads to a distinct reduction in the leaf relative water content and values of the total plant biomass and photosynthetic rate with diminished water-use efficiency [15] As there is variation in water consumption according to the species studied, the severe water stress for one species can become moderate for others that have better water-use efficiency [16]. If it is moderate, the water deficit should still cause a metabolic change, reducing the stomatal aperture to avoid more significant losses due to transpiration, which results in less conductance and thus less carbon dioxide assimilation [17].
The water deficit also causes changes in the transport of assimilates in plants, resulting in sugar concentration partitioning [18]. Photoassimilate partitioning is an alternative the plant uses to overcome the lower assimilation of carbon dioxide in drought situations. Plants under these conditions tend to modify the solute potential of different organs, increasing water absorption [19]. Through the partitioning of sugars, aiming to alter the water potential of poorly hydrated cells, plants can translocate phloem-mobile herbicides and increase weed-control efficiency. This information is known for other plants, and it is essential to know if this happens in this weed and can explain its behavior in the field.
Studies on the water regime’s influence on perennial plants’ control with glyphosate have been carried out [16]. Previous studies with these perennial grasses, however, just evaluated the glyphosate efficiency of control in different doses and the variation in water content in the soil. Results indicated that field capacity best helped to control the plants [10,11]. It is not well understood why these weeds are better controlled under drained soil than in flooded conditions. Thus, we hypothesize that water deficit negatively affects growth and increases photoassimilate translocation to roots in Leersia hexandra and Luziola peruviana, and this behavior might explain why glyphosate is more efficient in these conditions. To test this, we conducted two experiments to evaluate the effect of water regimes on growth and photoassimilate partitioning of L. hexandra and L. peruviana.

2. Material and Methods

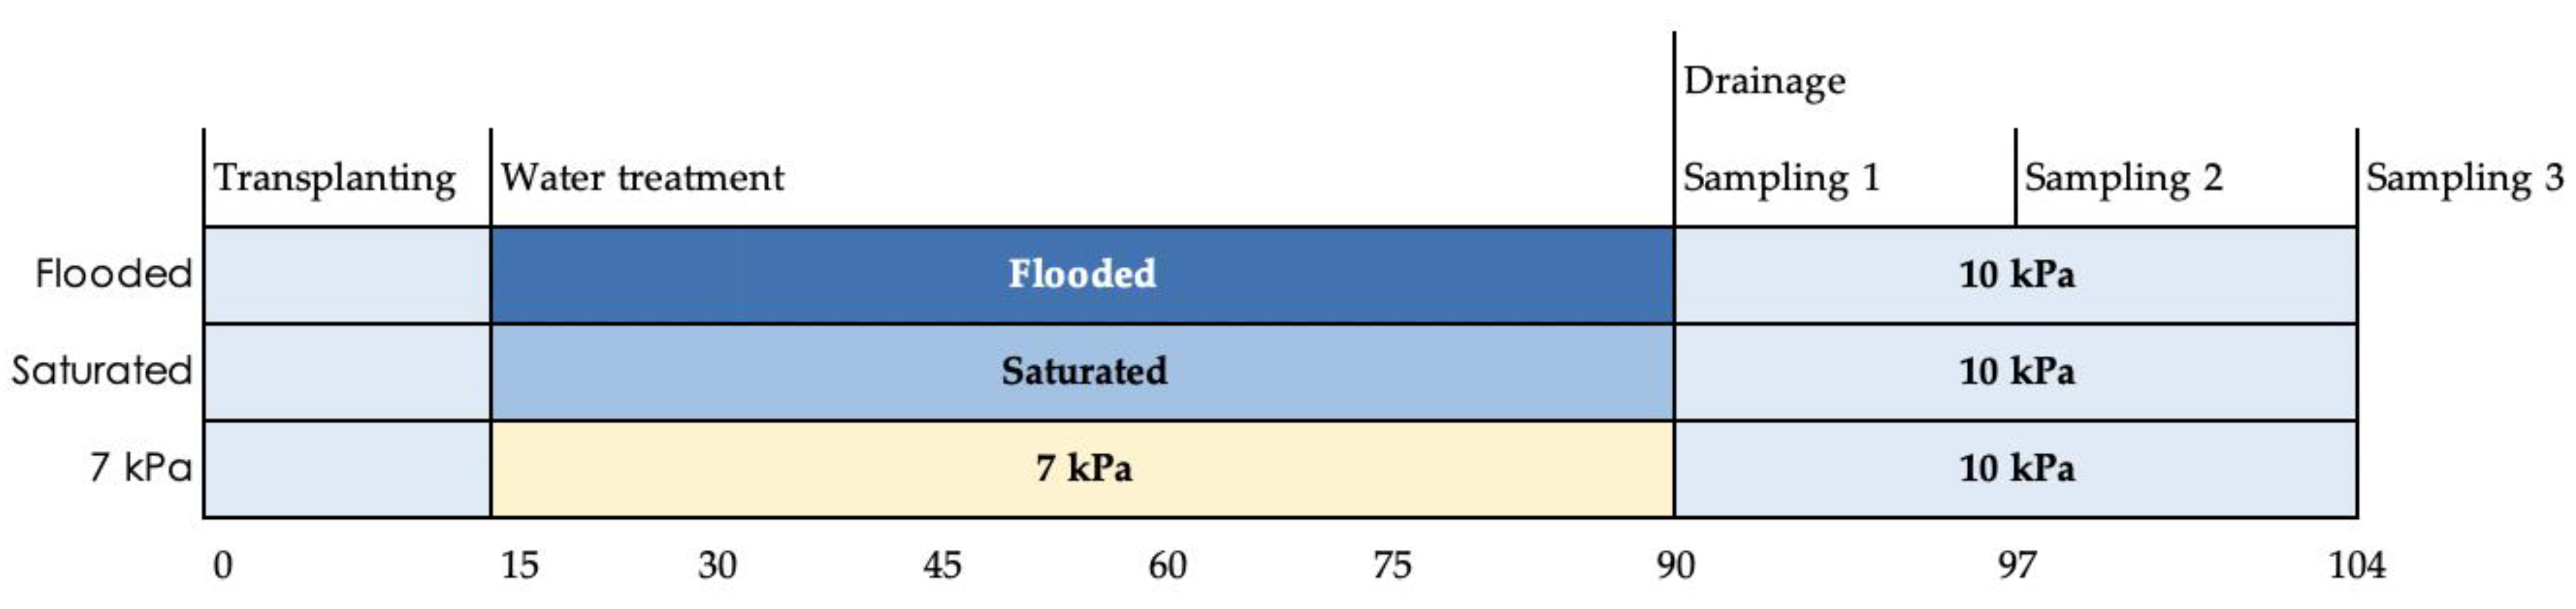
2.1. Experiments 1 and 2—Effect of Soil Water Content on Weed Growth

For each species (species were not compared), one experiment was carried out in a greenhouse in the Estação Experimental Terras Baixas—Embrapa Clima Temperado (31°48′ S, 52°24′ W) in the 2017/18 growing season and repeated in the 2018/19 growing season with some modification. The experimental design was organized in a randomized block design with four replications. The treatment consisted of six soil moisture levels (flooded, saturated, 7 kPa, 15 kPa, 40 kPa, and 100 kPa) [20].
The experimental units were 2.8 L pots filled with sieved soil. The soil was an albaqualf from a lowland area, collecting the top layer (10 cm depth). Soil moisture was stabilized to the desired levels twice a day before the transplant. A ruler maintained the water depth flood up to 2 cm. The condition of saturated soil was obtained by filling the soil pores with water. The other moisture levels were configured to be recorded hourly (including during the night) in a monitor data logger. The soil moisture values were determined based on the resistance of the sensors to the water passage from the tension values. As the tension changes with water content, the resistance changes as well. Soil water is an electrical conductor, thereby providing a relative indication of the soil moisture status. The electrical resistance was measured using a sensor (Watermark, Irrometer Company, Riverside, CA, USA). The sensor consists of a pair of electrodes embedded with a granular matrix. A current is applied to the sensor to obtain a resistance value. These values were measured hourly, thus providing the force (suction) necessary to extract water from the soil. With these measurements, it is possible to estimate the water content in the soil, and therefore this method indirectly determines the soil moisture.
Weed plants were transplanted by transferring stolons collected from Embrapa Clima Temperado during January and September 2018. Twelve stakes of equal height (2.5 cm) were transplanted with nodes buried in the soil. Half the initial density of plants was left in the middle of the experiment evaluations. Sixteen plants were measured per treatment, 4 per replicate, and the same plants were always evaluated, being considered just green leaves and tillers. Evaluations of plant length, number of leaves, and tiller number were performed on 2, 4, 6, 8, 10, 12, 14, 16, 18, 20, 22, 24, 26, 28, 30, and 32 days after node transplant (DAT). All length evaluations were performed using a ruler. The length of leaves was measured to the end of the longest branch. At the end of the experiment (June 2018 and January 2019), all the plants were collected (shoot and root) and dried in a forced-air oven (60 °C) until a constant mass was obtained. Then, the total dry weight of plants was determined, and this value was divided by the number of plants to obtain the total dry weight per plant. Evaluation at 32 DAT was used for statistical analysis, and the other sampling timing is included in this manuscript as supplemental material.

2.2. Experiments 3 and 4—Effect of Soil Water Content on Carbohydrate Partitioning

For each species (species were not compared), an experiment was conducted in the same greenhouse in a randomized block design in a factorial arrangement with four replicates in the 2017/18 growing season and repeated in the 2018/19 growing season. The treatments included in factor A consisted of three soil moisture levels the plants were submitted to from transplanting to 90 days after transplanting [flooded, saturated, and drained soil at 7 kPa (considered water deficit)]. After the 90th day, all treatments were drained to 10 kPa corresponding to field capacity (Figure 1). Factor B consisted of sampling time (first—90 days after transplanting; second—97 days after transplanting; and third—104 days after transplanting).
The soil used in the experiment was collected as described previously. Subsequently, 5 L-capacity pots were filled with the soil for all treatments. Soil moisture was stabilized to the desired levels, and pots were irrigated twice a day. A water depth flood and the saturated soil were performed as in experiments 1 and 2. The other moisture levels were recorded hourly in a monitor data logger (Watermark) using electric sensors.
Leaf samples were collected from the upper third of the plants. Root samples (excluding dark roots, with advanced oxidation) were washed with distilled water before being weighed, and after weighing, all the material was stored at −80 °C until analysis.

2.3. Carbohydrate Extraction

Metabolite quantification was performed according to previous methodology [21]. Leaves and roots (0.5 g) were macerated in nitrogen and 8 mL of MCW solution (methanol:chloroform:ultrapure water 12:5:3). The samples were left for 24–48 h in darkness. After this period, the samples were transferred to falcon tubes and 2 mL of MCW was added, then centrifuged at 600× g for 30 min. The supernatant was collected and transferred to a new falcon tube, then 3 mL of ultrapure water and 2 mL of chloroform were added for each 8 mL collected. The resulting solution was shaken vigorously and again centrifuged at the same rotation previously described. The superior portion of the solution was collected and incubated at 40 °C. With the volume of the bottles reduced by half, the solutions were frozen at −80 °C for subsequent analysis.

2.4. Total Soluble Sugar Quantification

The total soluble sugars were quantified based on methodology previously described [21]. A sample of leaves and roots from metabolic extraction was kept in tubes in an ice bath and diluted in distilled water until 500 µL was completed, separately. Then, 1.5 mL of a 0.15% (v/v) anthrone solution was added, prepared in concentrated sulfuric acid (H2SO4). After 15 min, the solutions were stirred vigorously and incubated in a water bath at 90 °C for 15 min. Subsequently, the samples were left in the dark without cover until they reached room temperature. Finally, the absorbance was determined at 620 nm. The results were obtained based on an established glucose standard curve.

2.5. Starch Quantification

Starch quantification was carried out as per previous methodology [21]. The precipitate obtained from metabolite extraction was resuspended and homogenized in 10 mL of 10% trichloroacetic acid. After 24 h, the homogenate was centrifuged at 600× g for 30 min. The precipitate was resuspended in 10 mL of 30% (v/v) perchloric acid (PCA) and subjected to continuous agitation in an orbital shaker for 30 min to digest the starch, and was then centrifuged at 600× g for 30 min. Finally, the supernatant was collected, and the starch content was quantified for total soluble sugar quantification.

2.6. Sucrose Quantification

Aliquots of the leaves and roots samples were diluted to 200 µL as per the methodology in [22]. Afterward, 200 µL of 15% potassium hydroxide (KOH) was added. The tubes were covered and incubated in a water bath at 100 °C for 10 min. Then, the tubes were removed from the water bath, uncovered, and expected to reach room temperature. After that, 3 mL of anthrone (0.15% in 70% H2SO4) was added. The tubes were covered, shaken, and incubated in a water bath at 40 °C for 15 min. The absorbance of the samples was measured at 620 nm. The results were obtained based on an established sucrose standard curve.

2.7. Data Analysis

The analysis of growth data was performed using the R statistical software [23] and ggplot2 package [24]. Data normality was tested by the Lilliefors test. A one-way ANOVA was performed to check the significance level of the soil moisture content on the 32nd day after the transplant. Tukey’s test was performed for result comparison. Bar graphs were plotted with 95% confidence intervals for data visualization.
For biochemical data, a two-way ANOVA was used to check the significance level of individual and interactive effects, and then a multiple-comparison procedure was used to compare harvest treatments and soil moisture content from the Holm–Sidak method (p ≤ 0.05).
Data repeated in each experiment in two growing seasons were subjected to analysis for comparison of growing seasons. The growing seasons were tested for data normality and compared by a two-way ANOVA, and if no significant differences were observed, the growing seasons were combined.

3. Results and Discussion

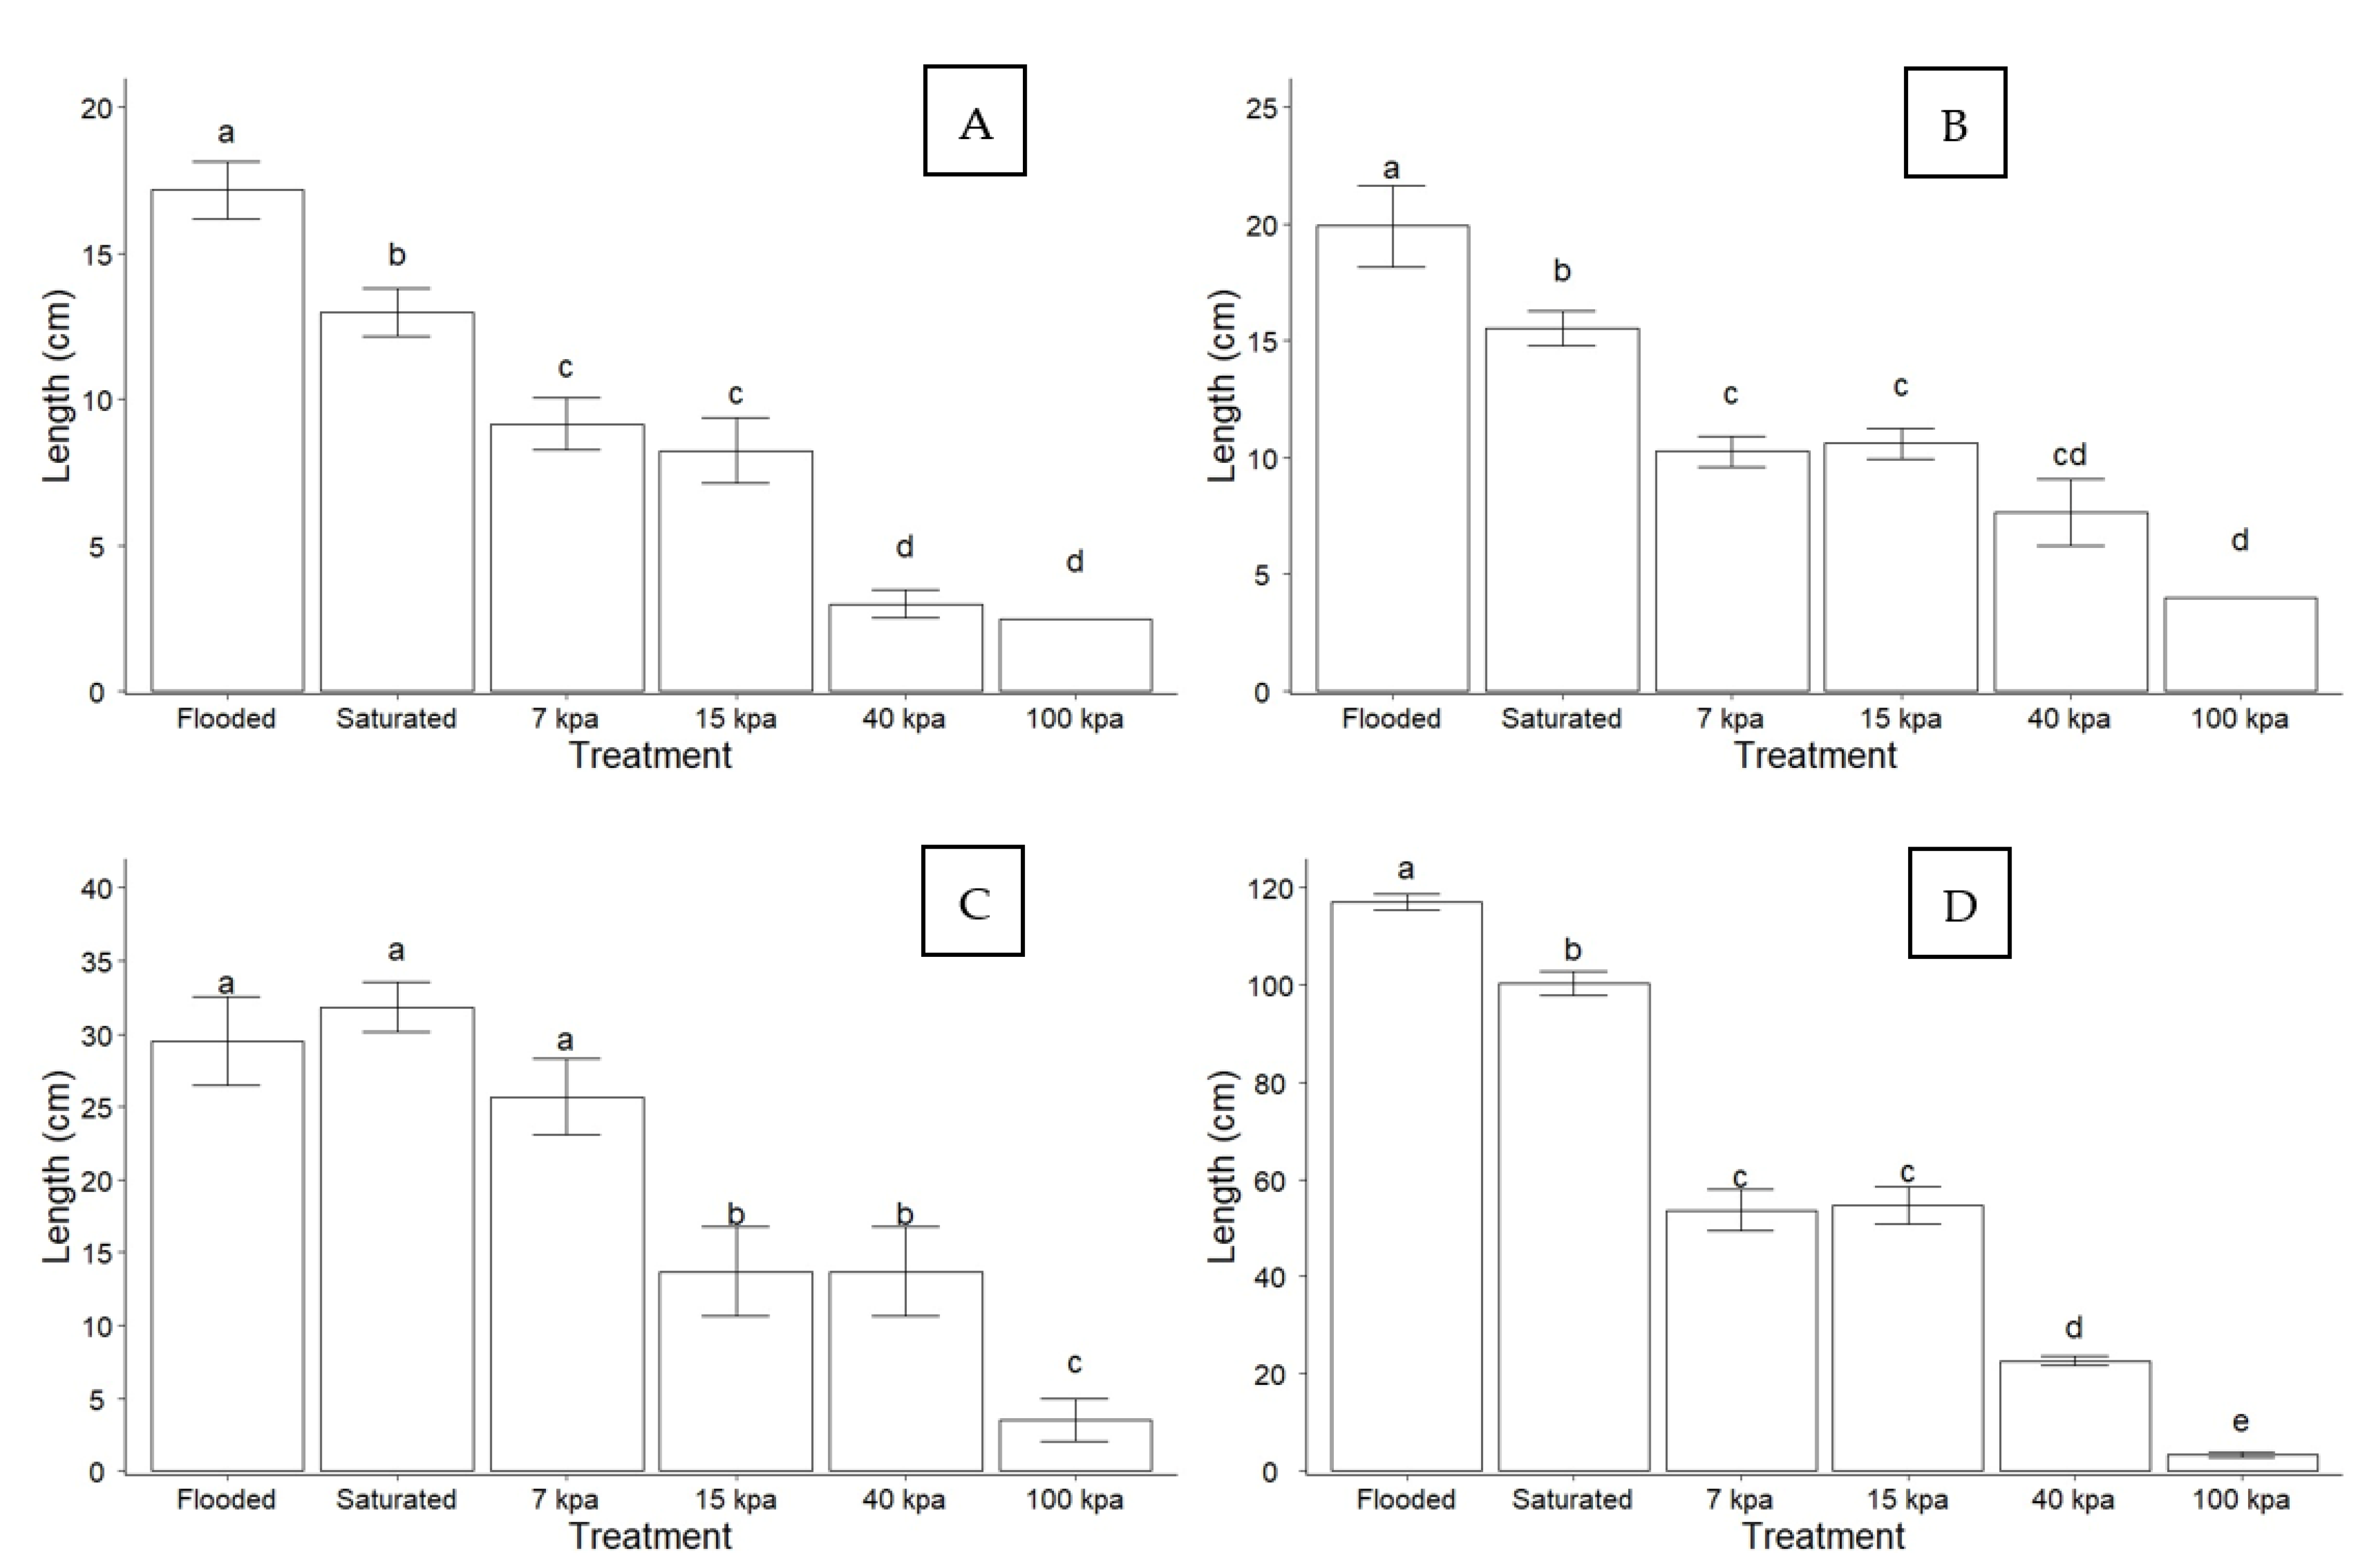
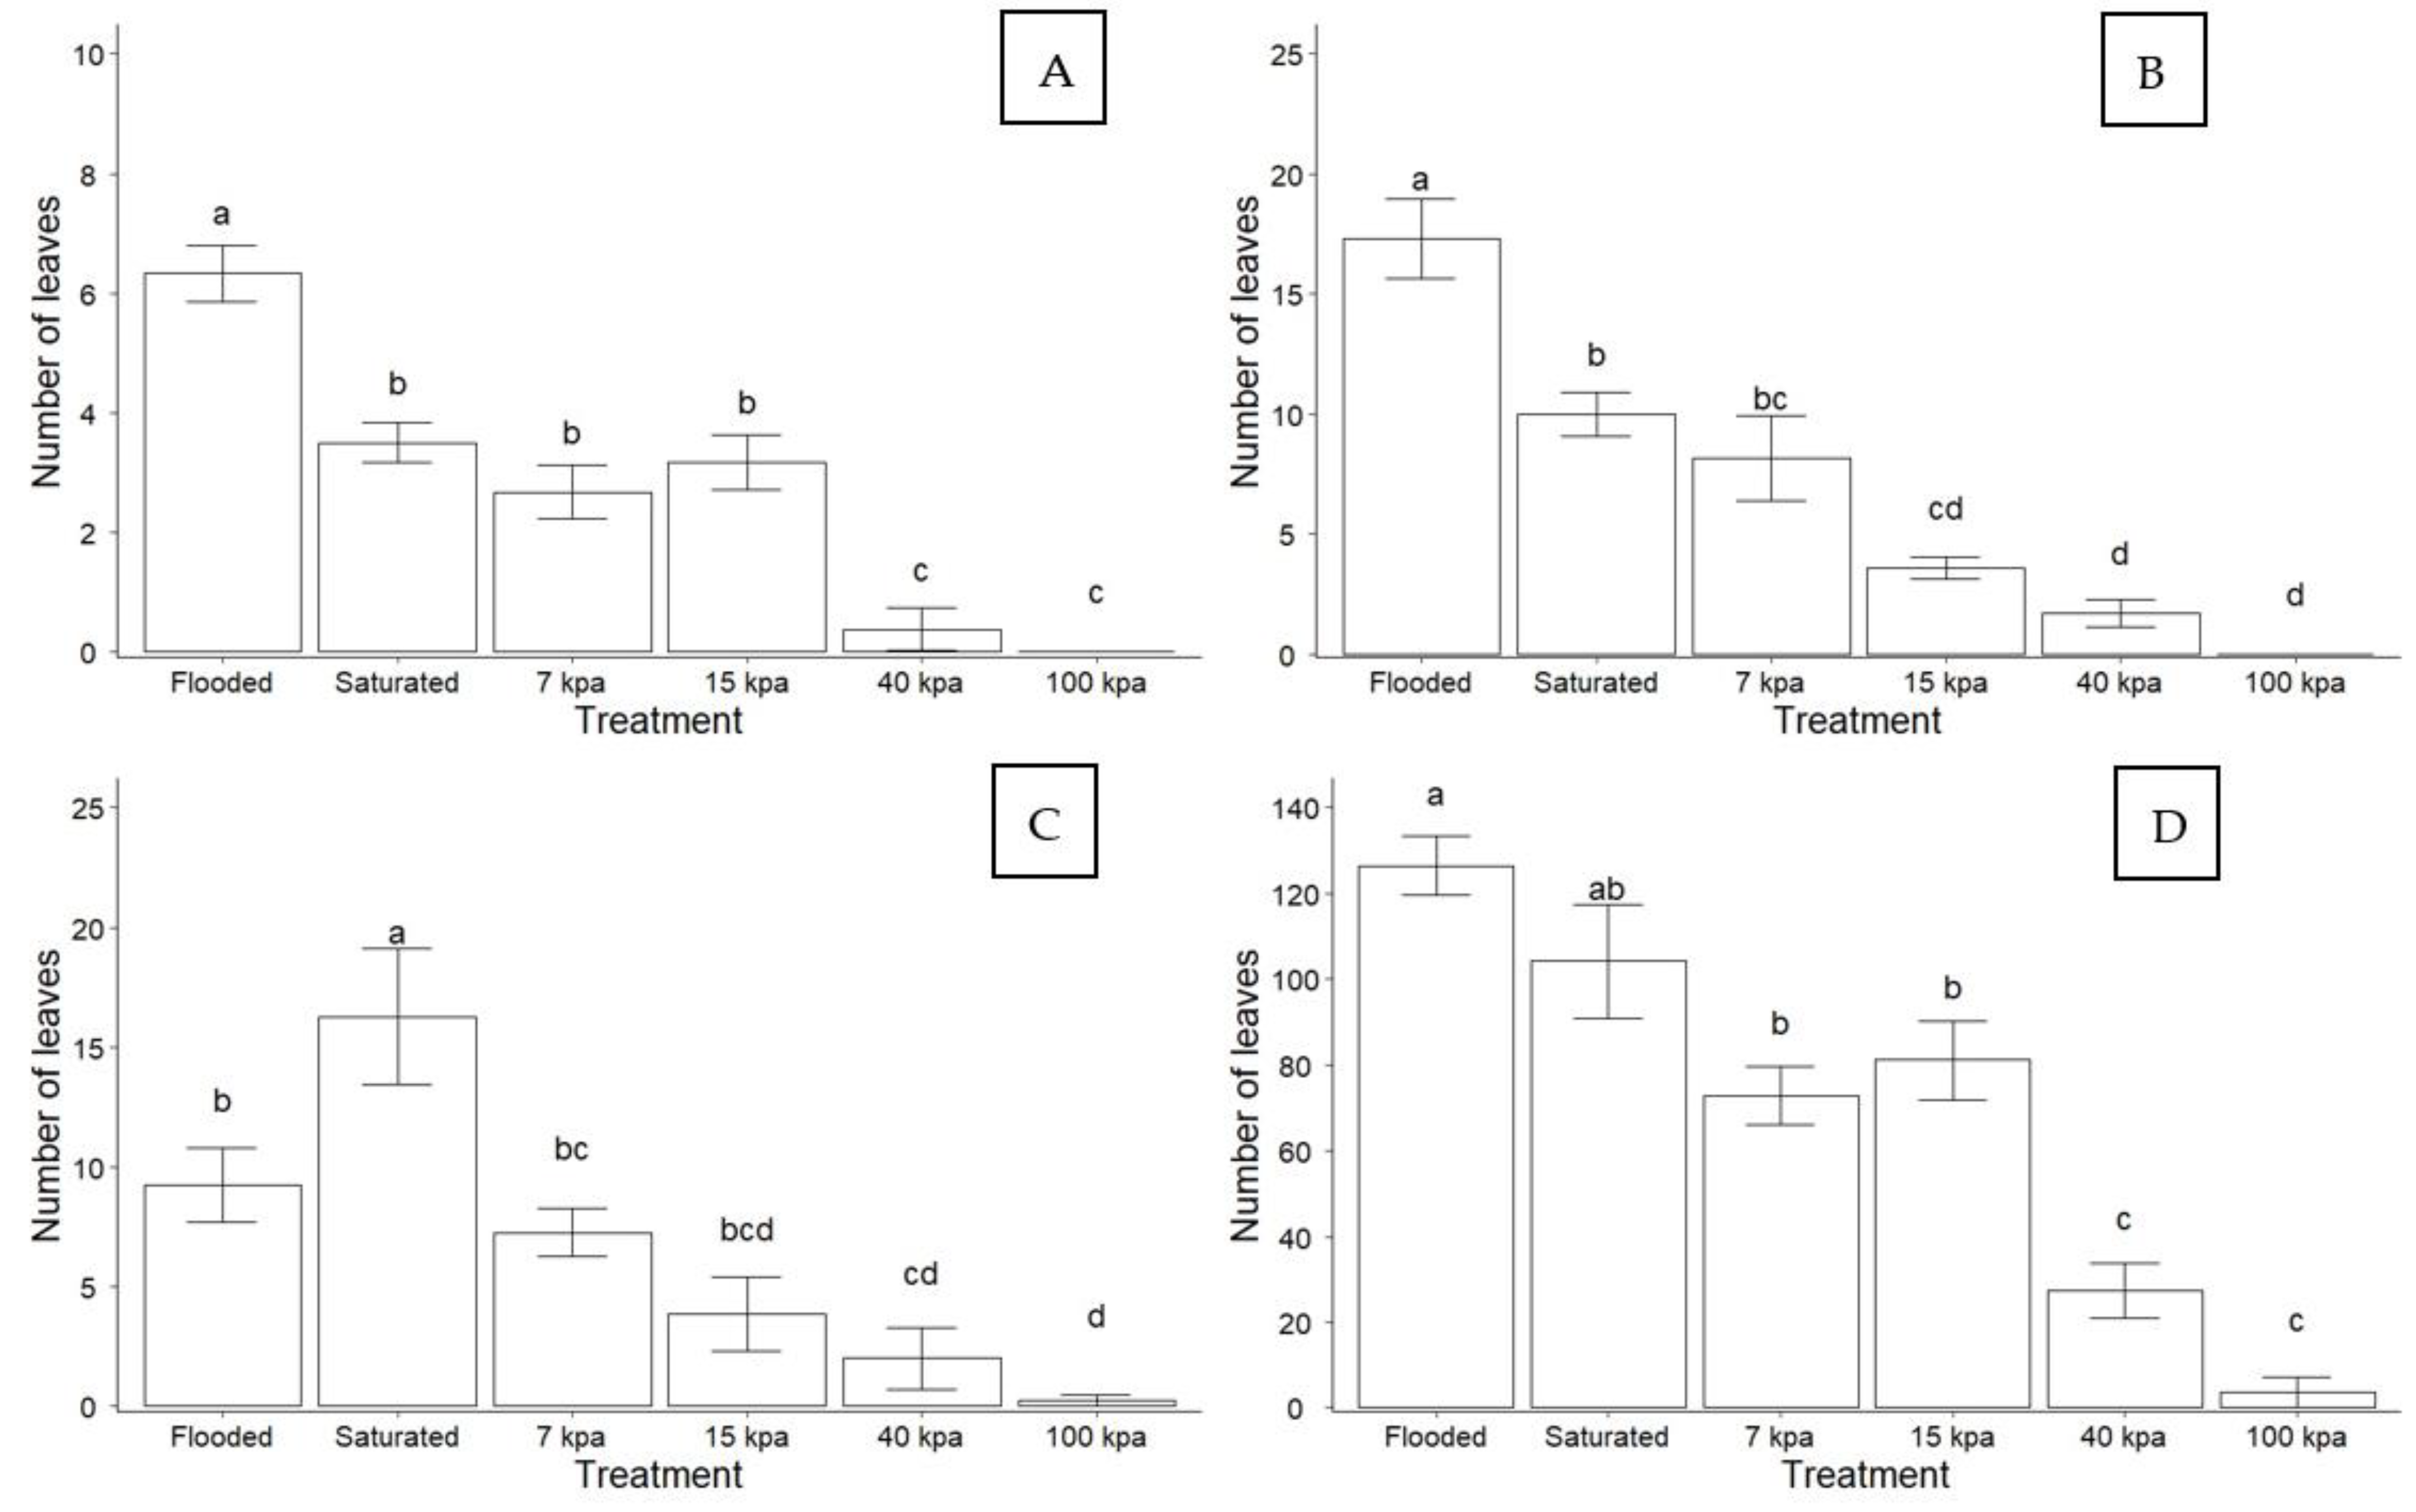
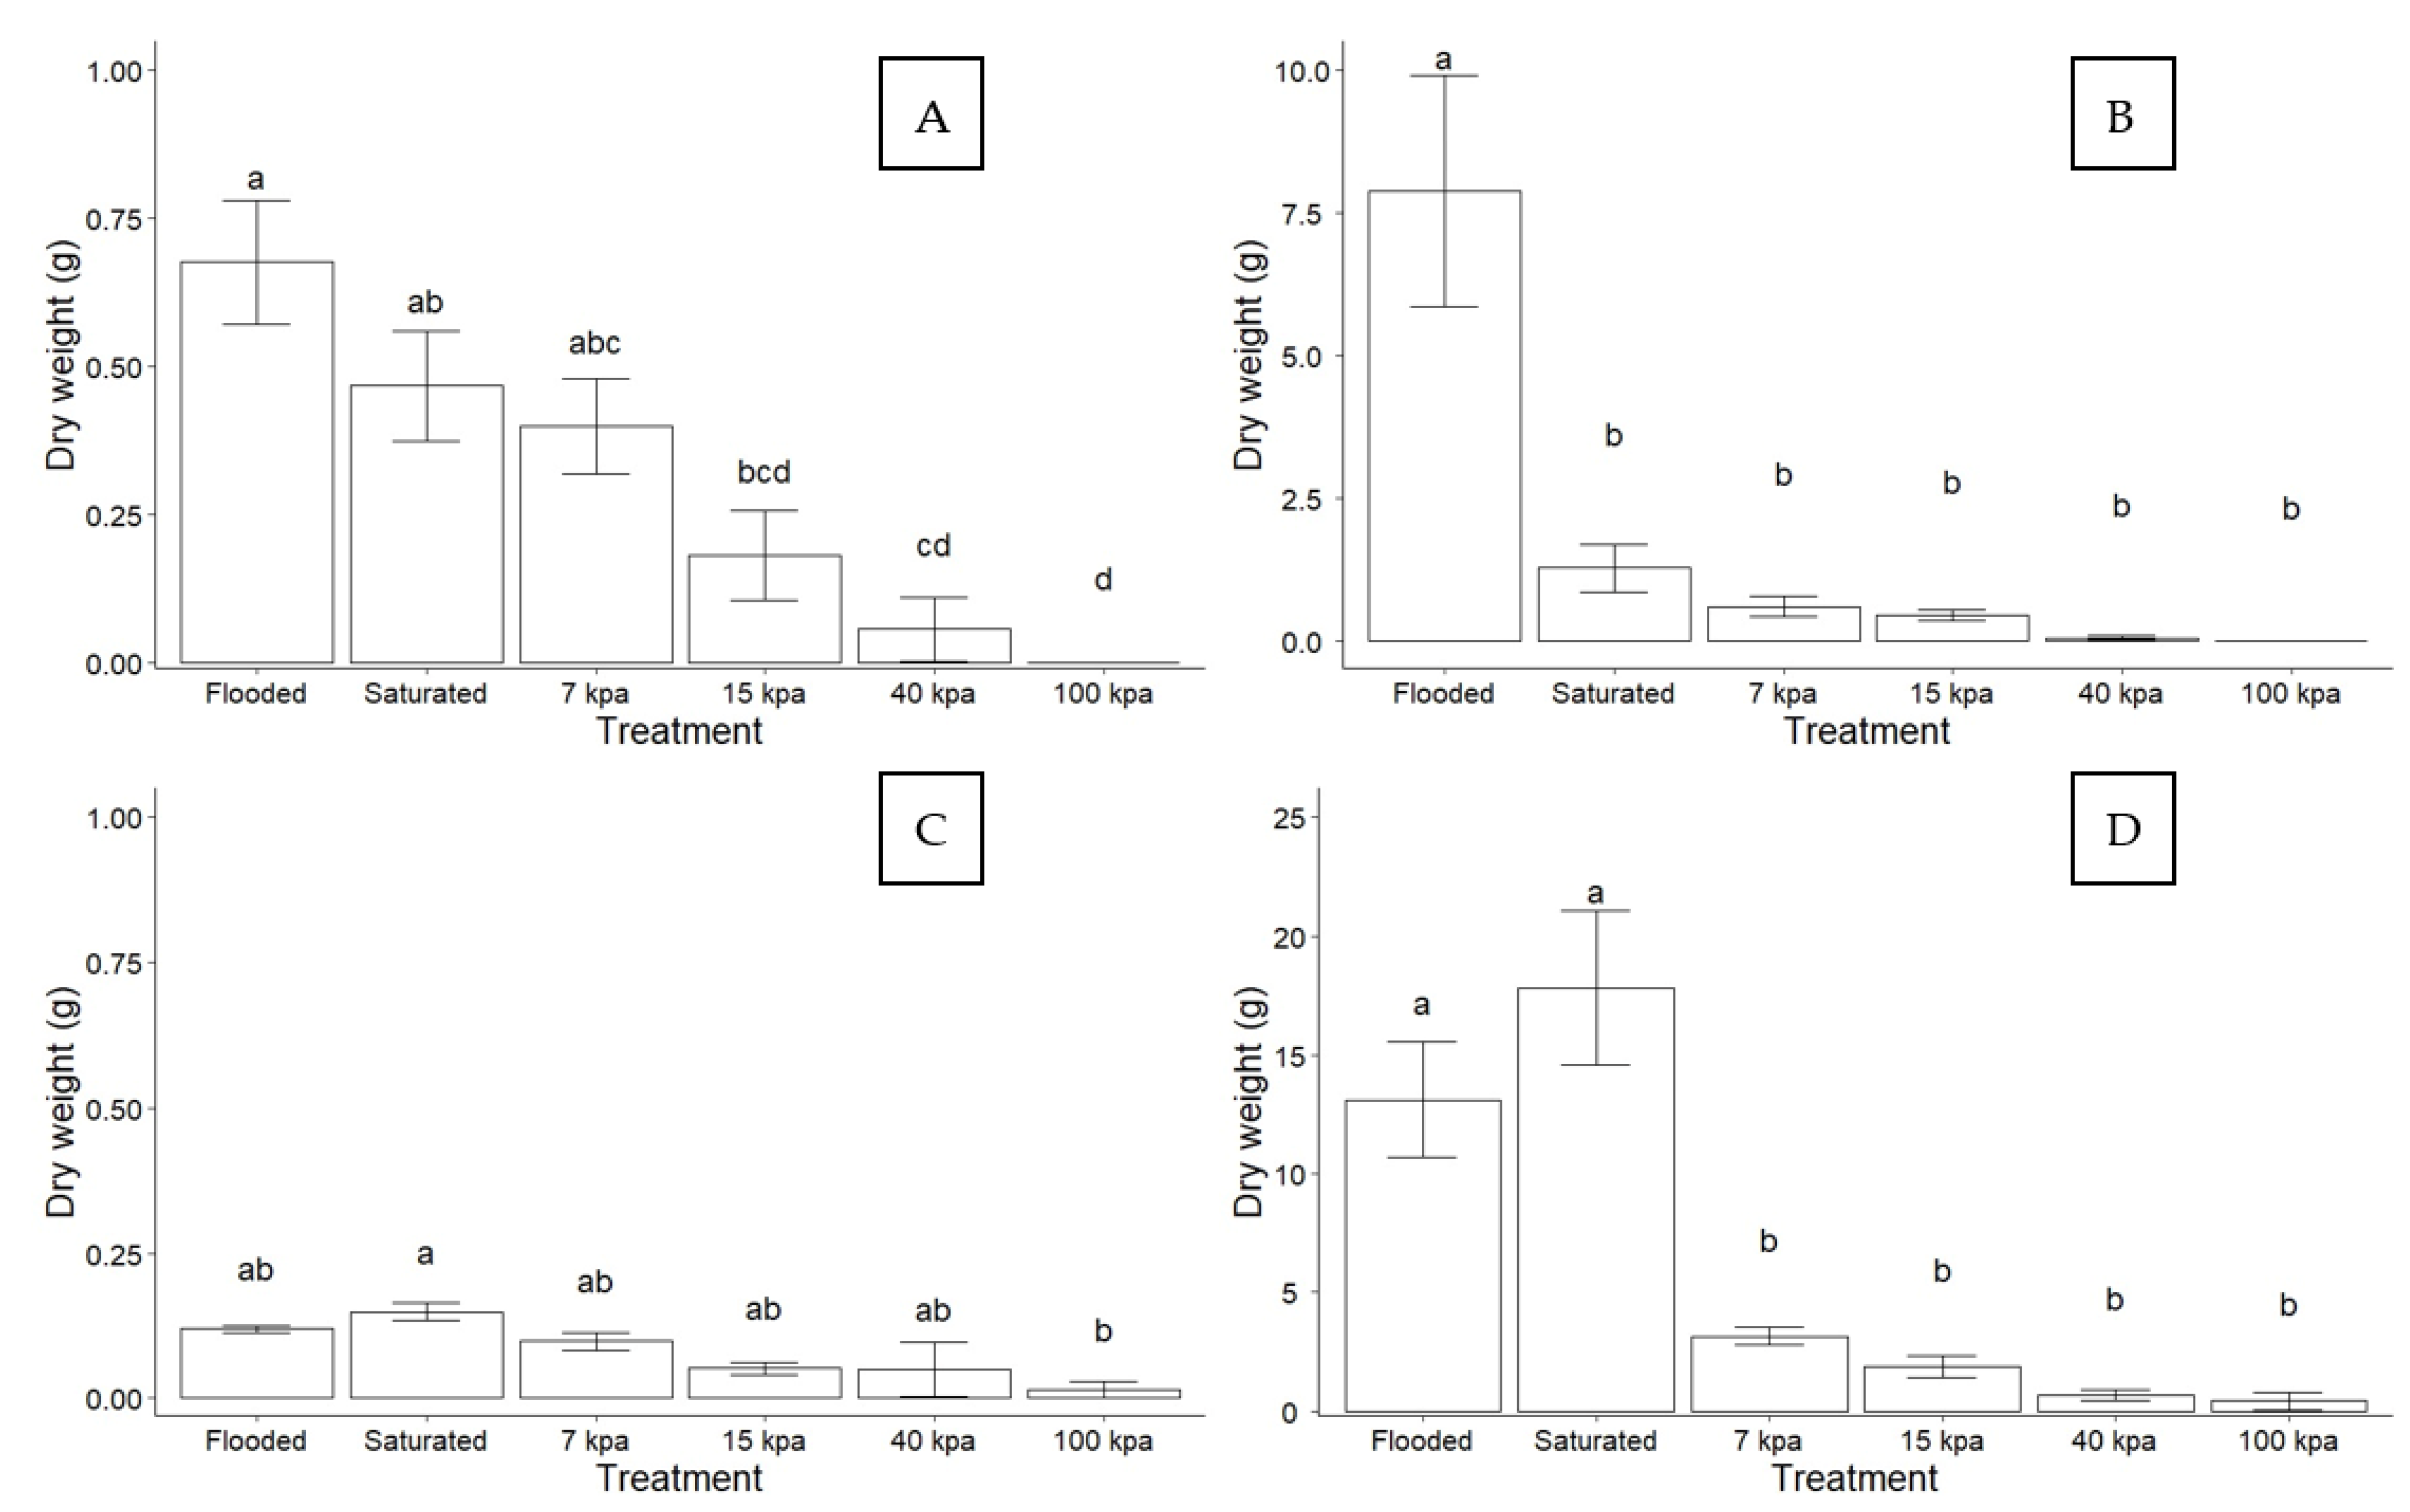
3.1. Effect of Soil Water Content on Plant Growth

For plant length, there was interaction of growing season and soil moisture. At the end of the experiment (32 DAT), the longest plants for both species in both growing seasons were observed in the flooded treatment and the shorter plants were observed at 40 and 100 kPa treatments (Figure 2). A reduction in leaf biomass of plants 21 days after inducing water stress was observed [25]. The decline in growth and development seemed to be the initial and most likely effect of water deficit in the plants, due to reducing cell turgor [26]. Water stress results in a decrease in the rate of relative expansion and cell proliferation, and even moderate water stress can affect cell growth [27]. Plants use morphoanatomical adjustments to increase leaf resistance against dehydration, leading to reduction in photosynthesis rates with consequent adverse effects on growth parameters [28,29]. The plants subjected to 100 kPa treatment were the shortest, presumably due to higher water restrictions. Severe water stress promotes negative regulation of the metabolic process in many species, which reduces the content of ribulose 1.5-bisphosphate, inhibiting photosynthesis and carbon assimilation [28]. Water deficit applied for an extended period induces a decrease in stomatal conductance followed by a decline in carbon assimilation and leads to a decrease in the activity of the RuBisCo [29].
Regarding the total number of leaves, there was interaction between growing season and soil moisture (Figure 3). Under the flooded treatment, plants presented more leaves compared to the other treatments. The treatments of 40 kPa had fewer leaves followed by the 7 kPa and 15 kPa treatments. In general, these results showed a similar trend on what was observed for plant height, as normally taller plants have more leaves than shorter ones. Other important aspects that may have affected the total number of leaves on plants under moderate water deficit is an increase in the leaf senescence rate observed for 15 days (Supplemental Materials) compared to plants of the same age in well-hydrated pots [30]. A moderate water deficit does not directly limit photosynthesis by the pairing activity of rubisco and ribulose activase [31]. An increase and posterior decrease in the number of leaves with the 40 kPa treatment was observed (Supplemental Materials). This effect is observed in plants as a response to water stress through hydraulic signals due to the decline in water absorption by the most water potential, turgidity, and increase in the number of leaves [32]. Hence, a severe water deficit leads to a distinct reduction in the relative water content of the leaves and the values of total plant biomass and photosynthetic rate with a diminished water-use efficiency [33].
Regarding the number of tillers (Figure 4), there was interaction between growing season and soil moisture content. Plants under flooded conditions presented more tillers compared to the other treatments. The 7 kPa, 15 kPa, 40 kPa, and 100 kPa treatments led to the lowest number of tillers. The highest (20 tillers) number of tillers in L. peruviana in the 2018/19 growing season was observed in the saturated treatment (Figure 4D). A significant difference was detected between the flooded and saturated treatments at the end of the evaluation period (32 DAT). The saturated, 7 kPa, and 15 kPa treatments did not differ statistically. On the other hand, the 15 kPa and 40 kPa treatments were statistically different. The 40 kPa and 100 kPa treatments resulted in the lowest tillers, most likely due to extreme water deficits. Very high tensions resulted in a reduction in the values of production components, such as the number of tillers [34]. Finally, under water stress, the plants had dead tillers and underdeveloped reproductive tissue [35].
The dry weight per plant (Figure 5) was affected by growing season and soil moisture content. In this analysis, in general, the highest values were detected in the saturated and flooded treatments. The 7 kPa and 15 kPa treatments did not differ statistically. Finally, the dry weight per plant analysis in the 2017/18 and 2018/19 growing seasons of L. hexandra and L. peruviana showed the lowest dry weight per plant in the 40 and 100 kPa. A reduction in the dry weight of plants in tensions of 40 kPa (a water deficit tension) is expected, considering that water is related to the process of cell turgor, which promotes cell growth [36]. Indeed, a decrease in the shoot dry weight of plants due to the lower water availability is a typical response [37]. Physiologically, a severe water deficit leads to a decline in photosynthesis, causing in general a dysfunction of metabolism in many plants [38].

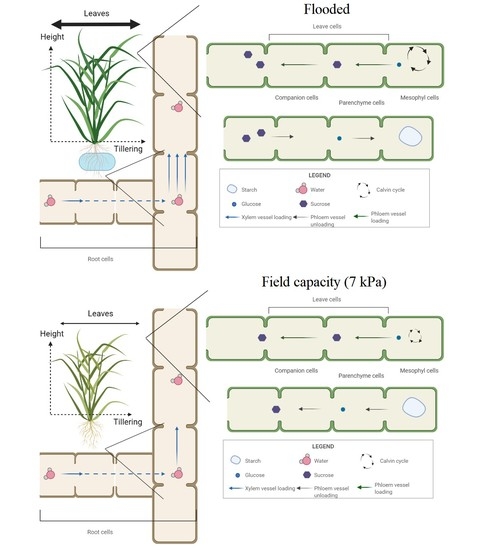
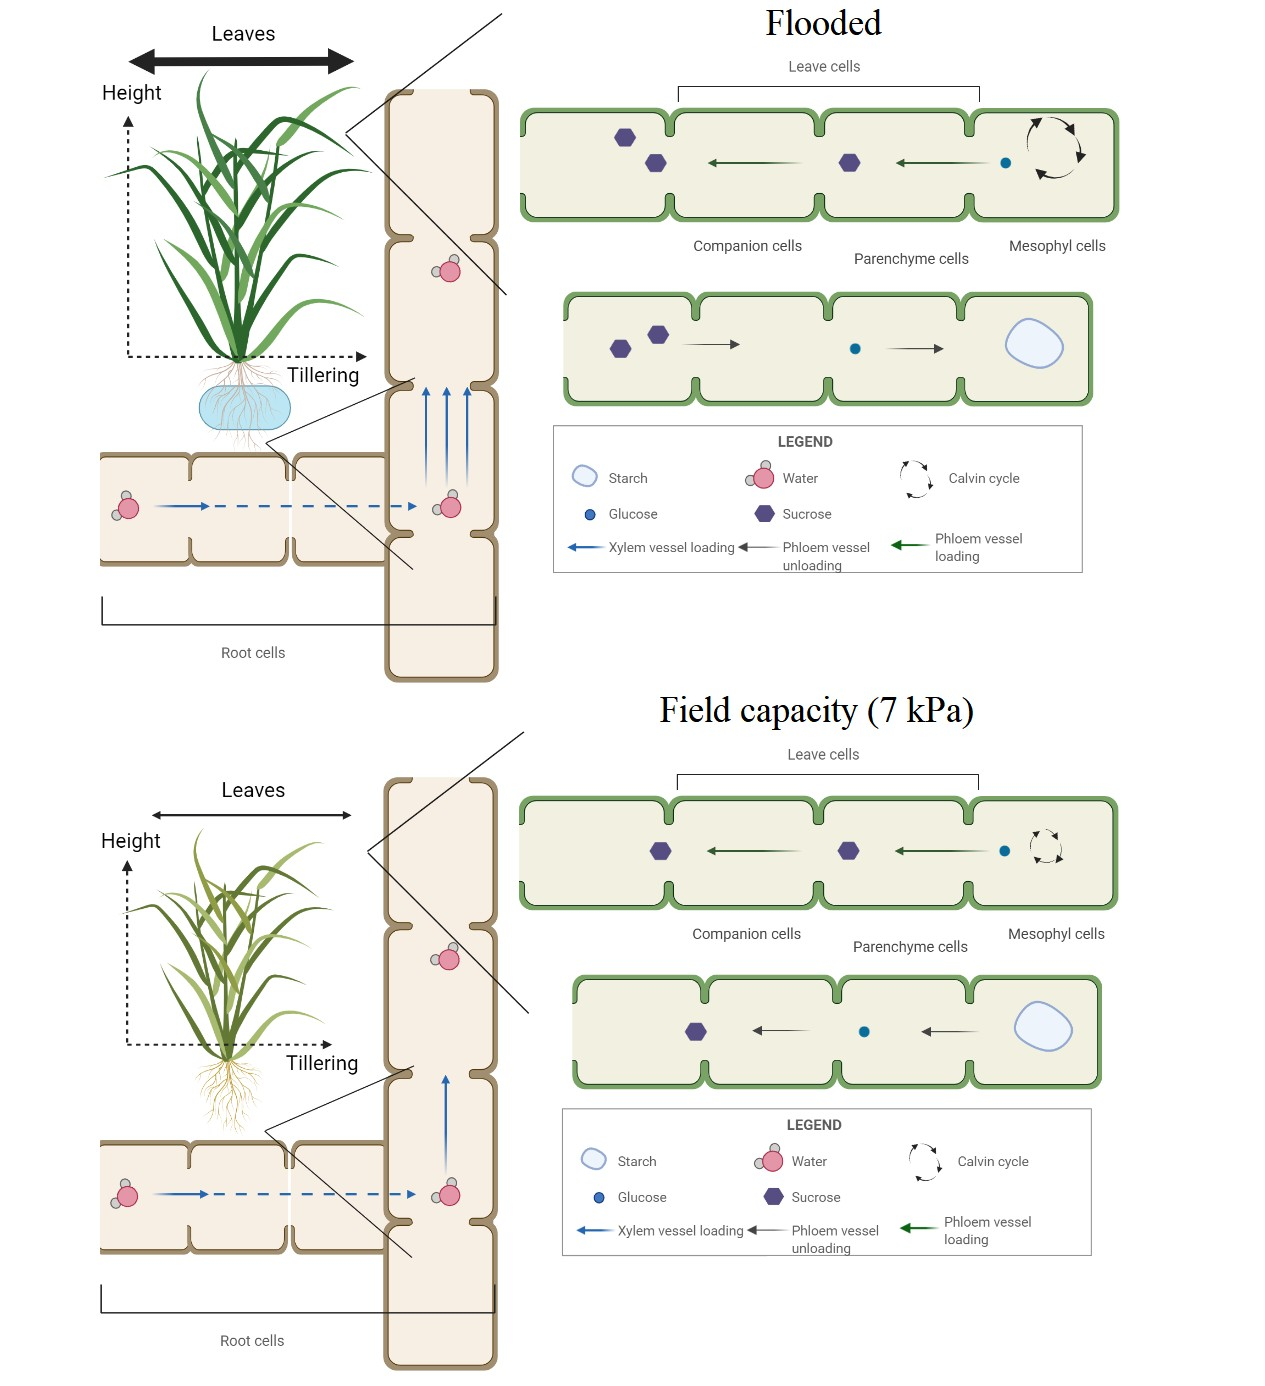
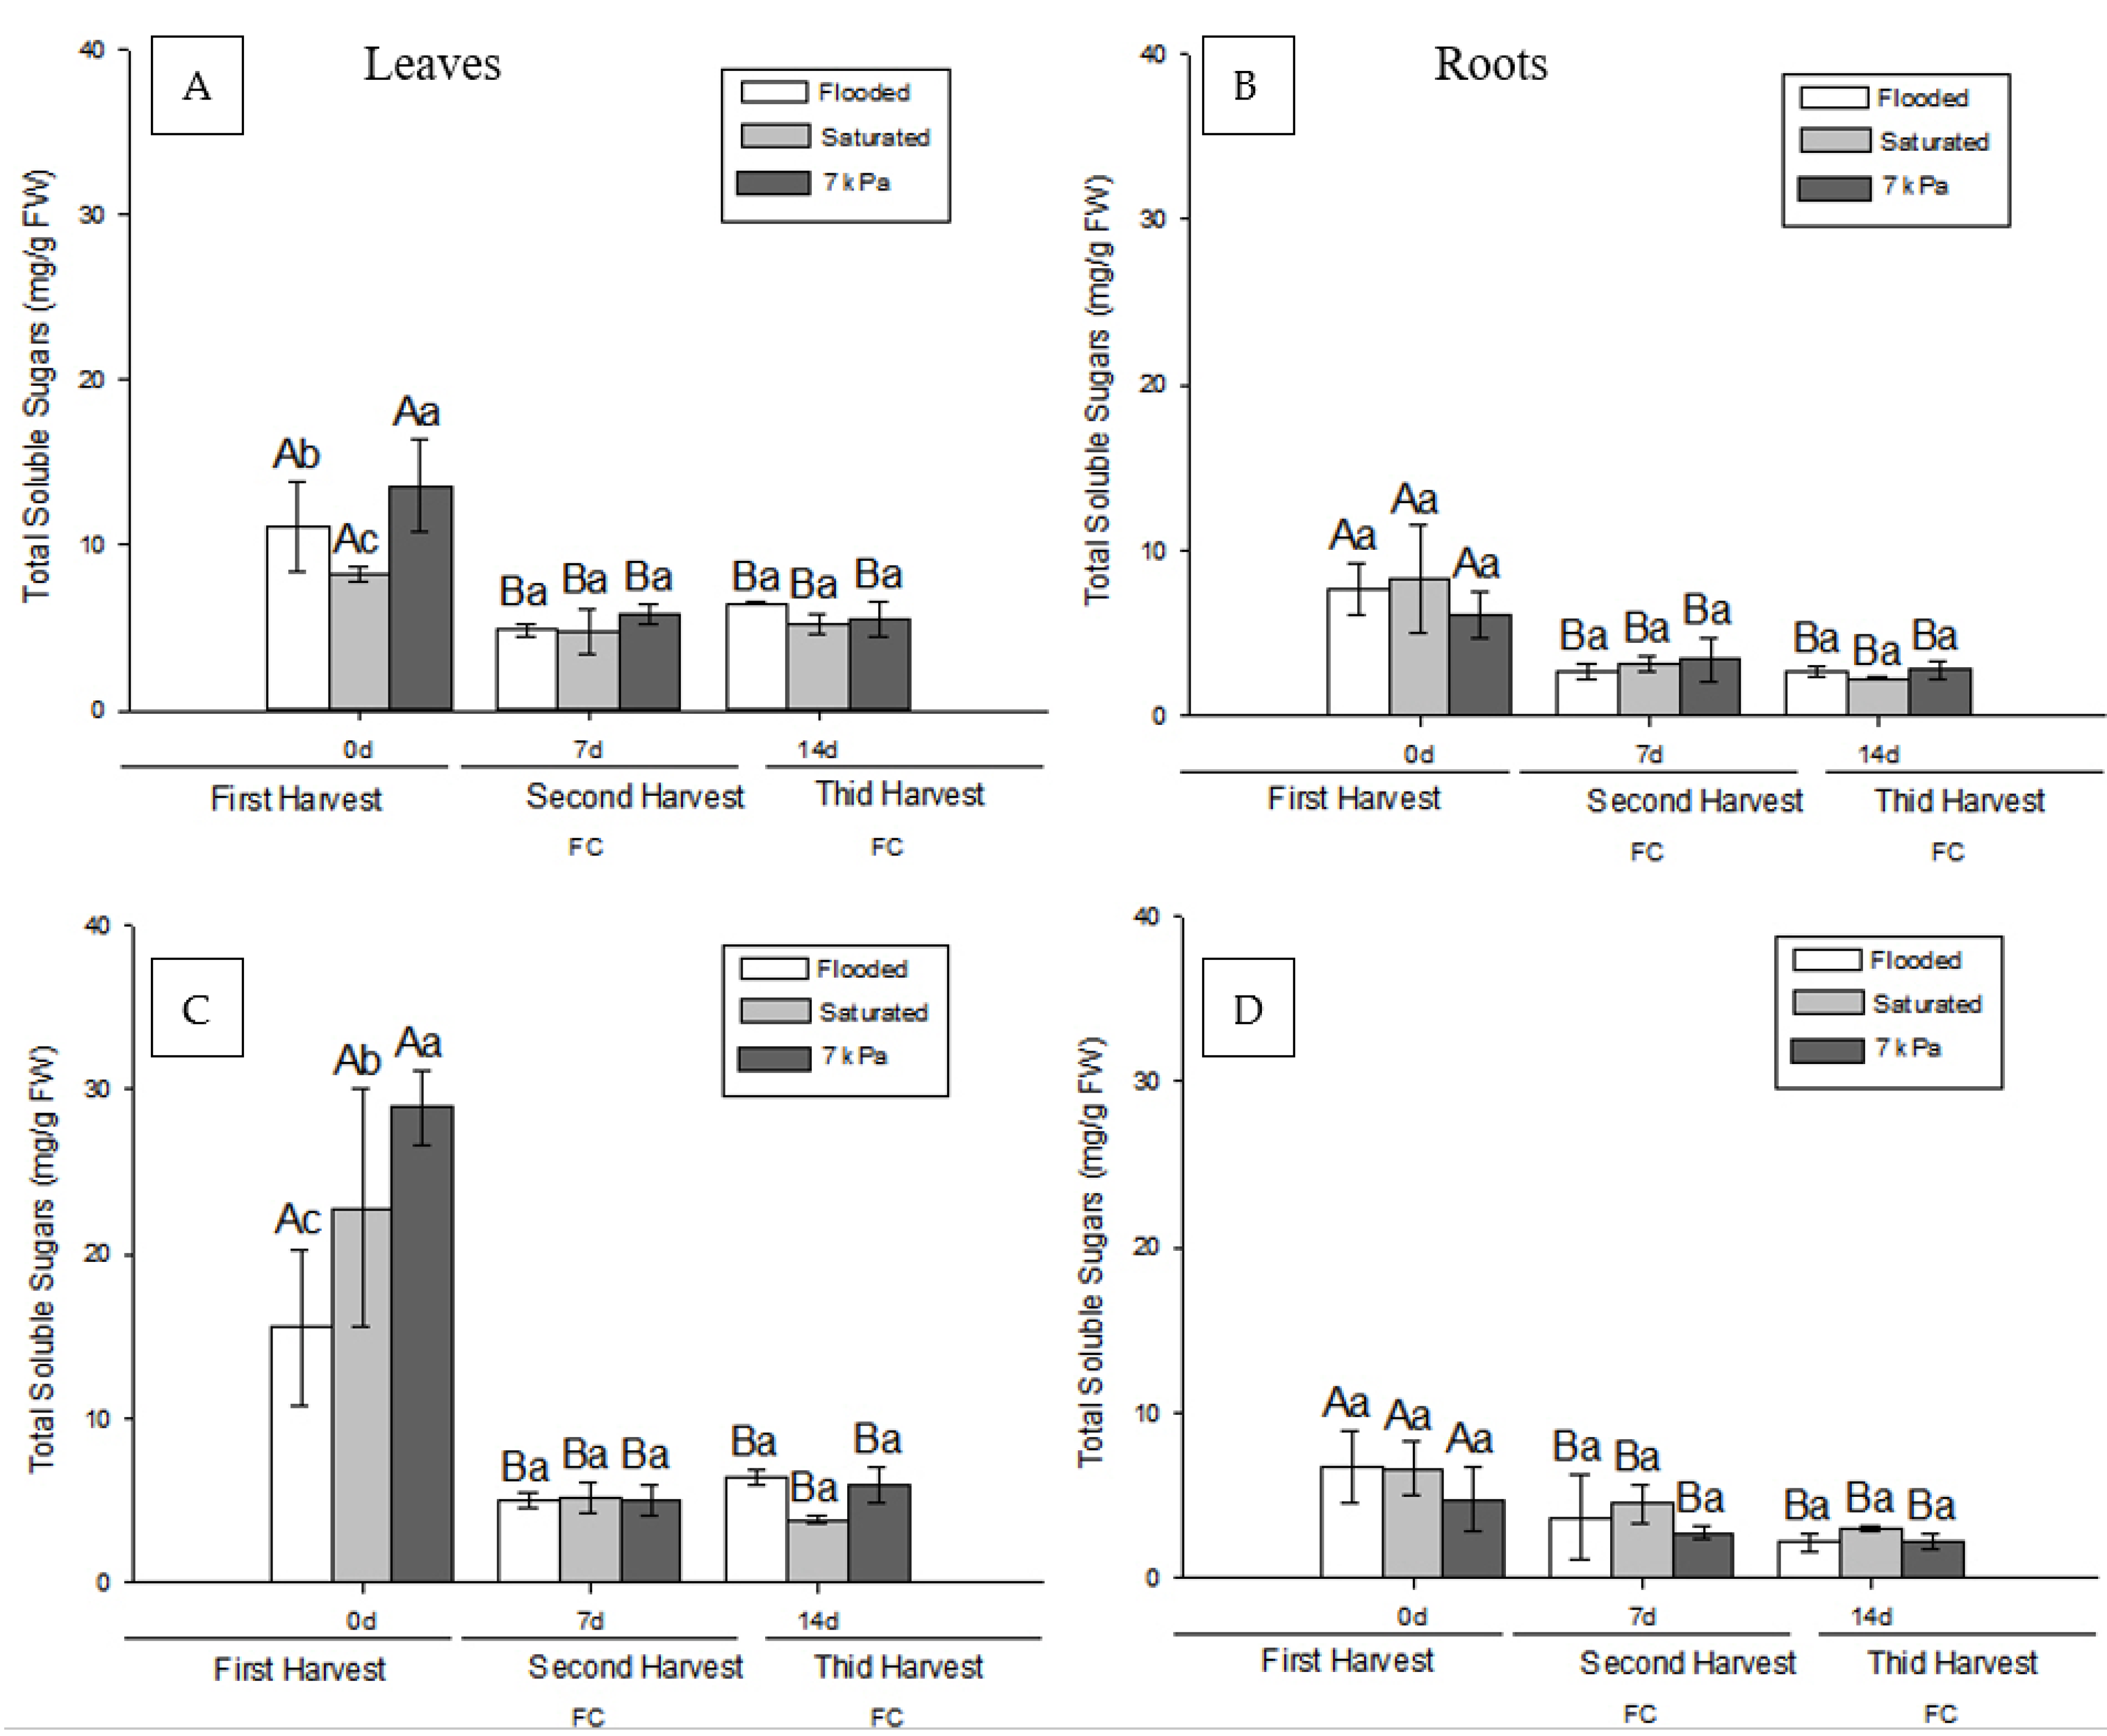
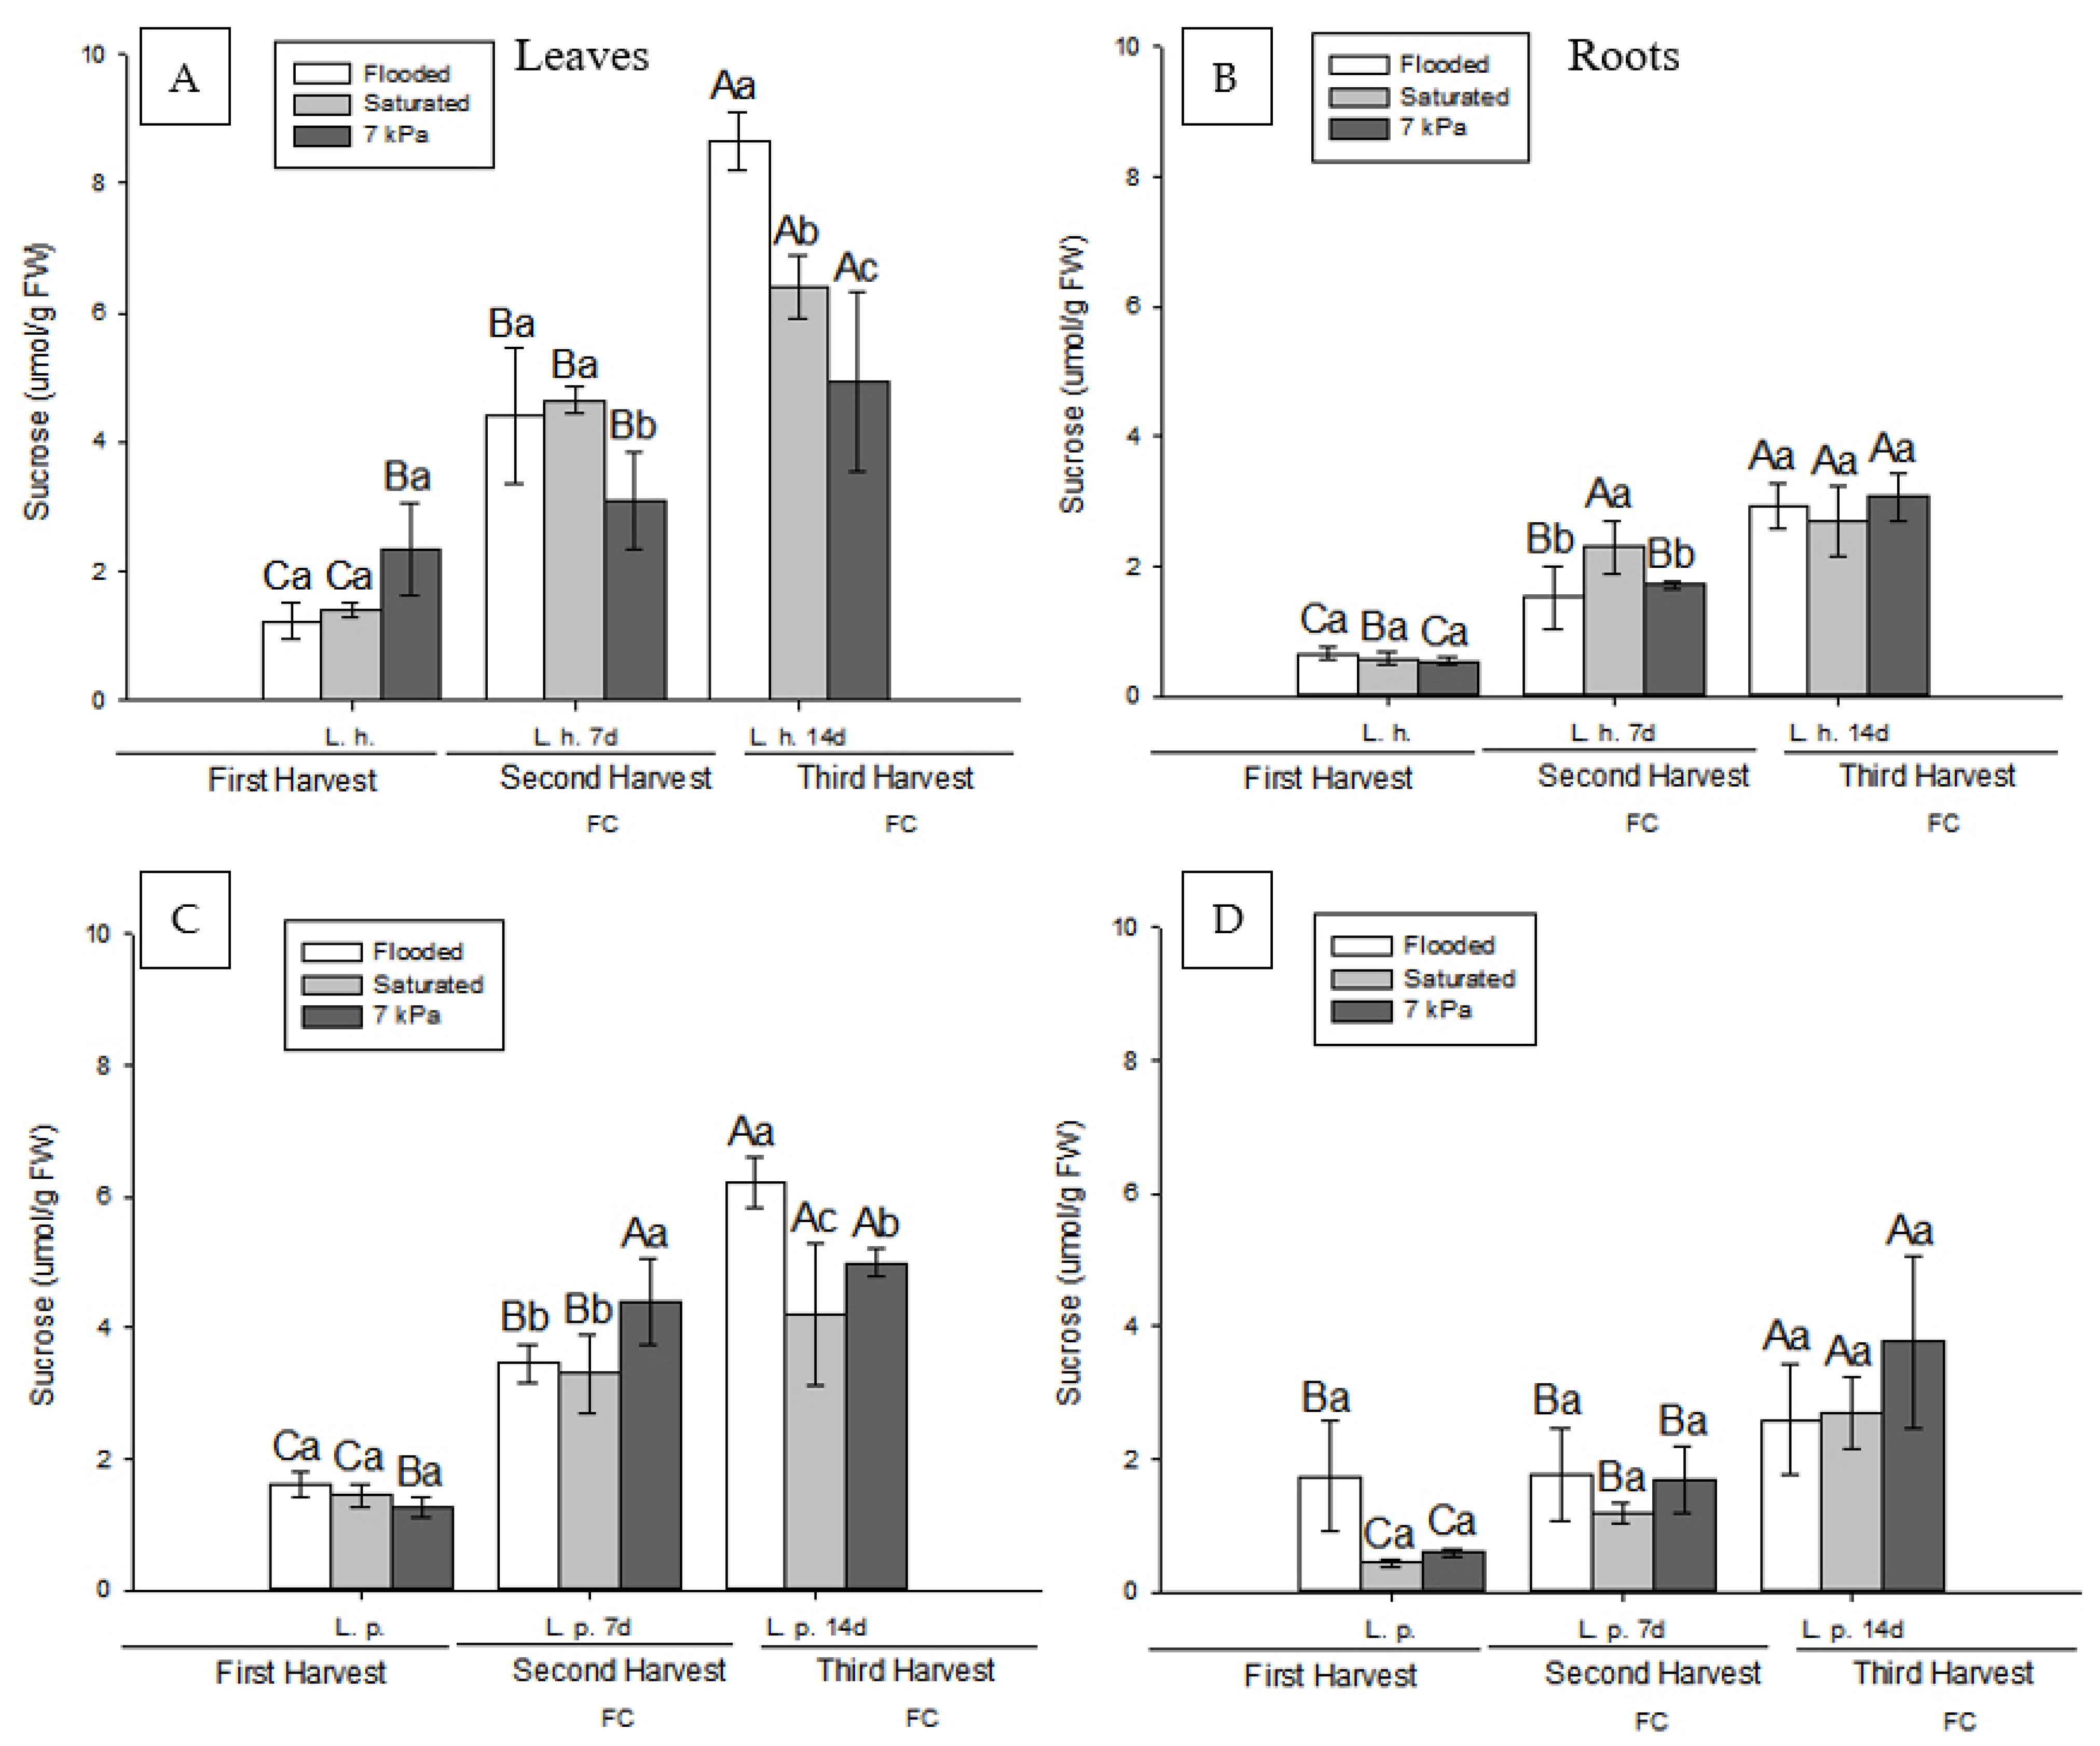
3.2. Effect of Soil Drainage on Plant Photoassimilate Partitioning

The concentration of total soluble sugars in L. hexandra and L. peruviana reduced with 7 days of water deficit in roots and leaves (Figure 6A–D). From the second to the third harvest, there was no statistical difference between species and tissues (7–14 days of water deficit). In the third harvest, compared to the first harvest, there was a reduction in of total soluble sugar concentration in the treatments in the two species and tissue types. A reduction in the concentration of total soluble sugars and photosynthesis in leaves occurs due to decreased hydraulic conductivity in the xylem. Consequently, the concentration of sugars increases in the phloem, creating a concentration gradient in the culms of the plants, which causes less activity in the Calvin cycle for the formation of trioses-P [39]. Both species had the highest total soluble sugar concentration at 7 kPa treatment. At the first harvest, in the saturated and flooded soil, it was the lowest total soluble sugar concentration in L. hexandra and L. peruviana, respectively. There was no difference in soil moisture contents in the second and third harvests.
The sucrose concentration increased during the 7 days’ water deficit in the leaves of L. hexandra and L. peruviana except in the 7 kPa in L. hexandra plants (Figure 7A,C). Sucrose content in the leaves increased with the drainage in L. hexandra from the second to the third collection (7–14 days of water deficit) except in the 7 kPa in L. peruviana plants. In both species at 14 days of water deficit, the levels of total soluble sugars in the leaves were highest in the flood treatment and lowest in 7 kPa and saturated soil. In the two species, the sucrose content increased in roots from second to third harvest (7–14 days in water deficit) except for the saturated soil in L. hexandra plants (Figure 7B,D). The sucrose content increased at 7 days of water deficit in both species except for the flooded treatment in L. peruviana. The highest sucrose values were found in roots in L. hexandra at 7 days of water deficit in the saturated treatment, probably aiming to increase the turgor of the cells and thus increase water absorption by the root hairs through the osmotic potential difference by the roots [40]. In addition, the roots had the sucrose increased in water deficit (Figure 7B,D), indicating an excellent sucrose movement from the shoot to the roots. This movement could modify the solute potential, allowing water entry into the roots [41]. Plants under water deficit have an increase in the reserve tissue sugars to reduce the osmotic potential and the turgor of cells, and thus, due to the difference in water potential, improve organ hydration [42]. Considering aspects involving glyphosate efficiency, the absorption and translocation of this herbicide might increase due to photoassimilate partitioning. This could lead to significant implications for the integrated management of these plants, given that the movement of glyphosate following the photoassimilate route generates valuable information about the better condition for the product application.
Starch concentration in the shoots decreased with water deficit in L. hexandra from the first to the second and third harvests at the 7 kPa treatment (Figure 8A). There was no significant reduction in starch with soil drainage in the harvests in L. peruviana leaves (Figure 8B). The only difference between the starch content in different soil moisture content was at 14 days of water deficit in the 7kPa treatment in L. hexandra (Figure 8A). The starch content in the roots (Figure 7B) of L. hexandra reduced with the water deficit course from the first to the third harvest. In the two species, the drainage decreased the starch content over time (Figure 8B,D). In the first harvest, flooded plants of L. peruviana showed the highest starch value in the roots. The starch content in the roots of L. peruviana corroborates the hypothesis that the plant can form a more significant amount of starch in the roots under high soil moisture content to replace soluble sugars [43]. The starch granule comprises straight and branched chain glycans broken down into glucose and maltose by specific enzymes. Glucose is a soluble sugar that can be a component of sucrose (the primary transport sugar in plants). When there is no water restriction, the shoot, acting as a vital source, increases the more significant formation of sugars from starch partitioning to the roots [44].

4. Conclusions

The decrease in soil moisture levels negatively affected the growth and development of L. peruviana and L. hexandra. The highest values of length, number of leaves, and tillers were found in L. peruviana. In general, the decrease in total soluble sugars and starch in the shoots and the increase in sucrose concentration in the roots with drainage indicates a movement of this sugar by the phloem. This phenomenon can occur in the drained field where the weed becomes stressed and inverts the sucrose transport to the roots. The agronomic impact of these findings is that this behavior may affect herbicide transport in phloem and may affect herbicide efficacy.

Supplementary Materials

The following supporting information can be downloaded at: https://www.mdpi.com/article/10.3390/agriculture12081261/s1. Figure S1. Plant length (cm) of Leersia hexandra (A,C) and Luziola peruviana (B,D) at different soil moisture levels in 2017/18 (A,B) and 2018/19 (C,D) growing seasons. Smoothing lines represent the observed values (n = 16) with confidence intervals (p ≤ 0.05). A confidence interval has been added around the linear trend; Figure S2. Number of leaves of Leersia hexandra (A,C) and Luziola peruviana (B,D) at different soil moisture levels in 2017/18 (A,B) and 2018/19 (C,D) growing seasons. Smoothing lines represent the observed values (n = 16) with confidence intervals (p ≤ 0.05). A confidence interval has been added around the linear trend; Figure S3. Number of tillers of Leersia hexandra (A,C) and Luziola peruviana (B,D) at different soil moisture levels in 2017/18 (A,B) and 2018/19 (C,D) growing seasons. Smoothing lines represent the observed values (n = 16) with confidence intervals (p ≤ 0.05). A confidence interval has been added around the linear trend.

Author Contributions

Conceptualization, L.A.d.A., E.R.C., A.S., F.S. and R.S.S.; methodology, F.S., J.M.B.P., L.A.d.A. and R.S.S.; software, R.M.P.-Z. and R.S.S.; validation, L.A.d.A., L.d.A. and R.S.S.; formal analysis, R.S.S.; investigation, L.A.d.A. and R.S.S.; resources, L.A.d.A. and E.R.C.; data curation, R.S.S. and R.M.P.-Z.; writing—original draft preparation, L.A.d.A. and R.S.S.; writing—review and editing, L.A.d.A., C.J.D.-S., L.d.A. and R.S.S.; visualization, L.A.d.A. and E.R.C.; supervision, L.A.d.A., E.R.C. and A.S.; project administration, L.A.d.A. and E.R.C.; funding acquisition, L.A.d.A. and E.R.C. All authors have read and agreed to the published version of the manuscript.

Funding

This study was funded in part by the Coordenação de Aperfeiçoamento de Pessoal de Nível Superior (CAPES) Finance Code 001; and Conselho Nacional de Desenvolvimento Científico e Tecnológico (CNPq) with the Research Fellowship of Luis Antonio de Avila/N.Proc. 310830/2019-2.

Institutional Review Board Statement

Not applicable.

Informed Consent Statement

Not applicable.

Data Availability Statement

The data presented in this study are available on request from the corresponding author.

Acknowledgments

The authors are grateful to the researchers André Andres and Germani Concenço for all the support from EMBRAPA-ETB.

Conflicts of Interest

The authors declare no conflict of interest.

References

  1. Ziska, L.H.; Gealy, D.R.; Burgos, N.; Caicedo, A.L.; Gressel, J.; Lawton-Rauh, A.L.; Avila, L.A.; Theisen, G.; Norsworthy, J.; Ferrero, A.; et al. Weedy (Red) Rice. An Emerging Constraint to Global Rice Production. Adv. Agron. 2015, 129, 181–228. [Google Scholar] [CrossRef]
  2. Villa, S.C.C.; Marchezan, E.; Massoni, P.F.S.; Santos, F.M.; Avila, L.A.; Machado, S.L.O.; Telo, G.M. Controle de arroz-vermelho em dois genótipos de arroz (Oryza sativa) tolerantes a herbicidas do grupo das imidazolinonas. Planta Daninha 2006, 24, 549–555. [Google Scholar] [CrossRef]
  3. Menezes, V.G.; Mariot, C.H.P.; Kalsing, A.; Freitas, T.F.S.D.; Grohs, D.S.; Matzenbacher, F.D.O. Associação de glyphosate e imidazolinonas no controle de arroz-vermelho em arroz Clearfield. Ciência Rural 2013, 43, 2154–2159. [Google Scholar] [CrossRef]
  4. Galon, L.; Agostinetto, D.; Moraes, P.V.D.; Tironi, S.P.; Dal Magro, T. Estimativa das perdas de produtividade de grãos em cultivares de arroz (Oryza sativa) pela interferência do capim-arroz (Echinochloa spp.). Planta Daninha 2007, 25, 697–707. [Google Scholar] [CrossRef]
  5. Agostinetto, D.; Galon, L.; Moraes, P.V.D.; Rigoli, R.P.; Tironi, S.P.; Panozzo, L.E. Competitividade relativa entre cultivares de arroz irrigado e biótipo de Capim-Arroz (Echinochloa spp.). Planta Daninha 2008, 26, 757–766. [Google Scholar] [CrossRef]
  6. Pacanoski, Z.; Glatkova, G. The Use of Herbicides for Weed Control in Direct Wet-Seeded Rice (Oryza sativa L.) in Rice Production Regions in the Republic of Macedonia. Plant Protection Science. Plant Protect. Sci. 2009, 45, 113–118. [Google Scholar] [CrossRef]
  7. Ulguim, A.R.; Fruet, B.L.; Merotto Junior, A.; Silva, A.L. Status of Weed Control in Imidazolinone-Herbicide Resistant Rice in Rio Grande Do Sul. Adv. Weed Sci. 2021, 39. [Google Scholar] [CrossRef]
  8. IRGA: Instituto Rio Grandense de Arroz. Censo da Lavoura Orizícola. 2021. Available online: https://irga.rs.gov.br/upload/arquivos/202109/27151231-boletim-de-resultados-da-safra-2020-2021-compressed.pdf (accessed on 20 May 2022).
  9. Scherner, A.; Avila, L.A.D.; Schreiber, F.; Kruse, N.D.; Agostinetto, D.; Pinto, J.J.O.; Pestana, R.R. Suscetibilidade de duas Gramas-boiadeiras a diferentes formulações de glyphosate. Ciência Rural 2014, 44, 400–406. [Google Scholar] [CrossRef]
  10. Scherner, A.; Avila, L.; Schreiber, F.; Kruse, N.D.; Fernando, J.A.; Garcia, É.N. Susceptibility of Peruvian Watergrass and Rice Cutgrass to Glyphosate under Soil Moisture Variations. Crop Prot. 2017, 98, 1–7. [Google Scholar] [CrossRef]
  11. Marchezan, M.G.; Avila, L.A.; Schaedler, C.E.; Amarante, L.; Scherner, A.; Schreiber, F. Alterações Bioquímicas de Plantas Daninhas Em Resposta Ao Estresse Causado Por Herbicidas e Submersão Total de Plantas. Planta Daninha 2017, 35. [Google Scholar] [CrossRef]
  12. Amato, C.G.; Sponchiado, M.; Schwarzbold, A. Estrutura de uma Comunidade de Macrófitas Aquáticas em um Açude de Contenção (São Jerônimo, RS). Rev. Bras. Biociências 2007, 5, 828–830. [Google Scholar]
  13. Senseman, S.A.; Armbrust, K. Weed Science Society of America. Herbicide Handbook; Weed Science Society of America: Lawrence, MA, USA, 2007; ISBN 1891276565. [Google Scholar]
  14. Singer, S.D.; Zou, J.; Westlake, R.J. Abiotic Factors Influence Plant Storage Lipid Accumulation and Composition. Plant Sci. 2016, 243, 1–9. [Google Scholar] [CrossRef]
  15. Rodrigues, T.F.; da Cunha, F.F.; da Silva, G.H.; Condé, S.B.; Silva, F.C.D.S. Water Use of Different Weed Species Using Lysimeter and NDVI. Adv. Weed Sci. 2021, 39, e021233767. [Google Scholar] [CrossRef]
  16. Le, D.; Morell, M. Influence of Water Regimes and Herbicides for Control Purple Nutsedge (Cyperus rotundus). Adv. Weed Sci. 2021, 39, e20210085. [Google Scholar] [CrossRef]
  17. Rodrigues, J.; Inzé, D.; Nelissen, H.; Saibo, N.J.M. Source–Sink Regulation in Crops under Water Deficit. Trends Plant Sci. 2019, 24, 652–663. [Google Scholar] [CrossRef]
  18. Fàbregas, N.; Fernie, A.R. The Metabolic Response to Drought. J. Exp. Bot. 2019, 70, 1077–1085. [Google Scholar] [CrossRef]
  19. Imadi, S.R.; Gul, A.; Dikilitas, M.; Karakas, S.; Sharma, I.; Ahmad, P. Water Stress: Types, Causes, and Impact on Plant Growth and Development. In Water Stress and Crop Plants: A Sustainable Approach; Wiley: Hoboken, NJ, USA, 2016; Volume 2, pp. 343–355. ISBN 9781119054450. [Google Scholar]
  20. Barbat Parfitt, J.M.; Andres, A.; Concenço, G.; Teló, G.M.; Schreiber, F.; da Silva, J.T.; Moisinho, I.S.; Timm, P.A. Rice and Barnyardgrass: Water Stress and Initial Establishment. Am. J. Plant Sci. 2017, 08, 3110–3119. [Google Scholar] [CrossRef]
  21. Graham, D.; Smydzuk, J. Use of Anthrone in the Quantitative Determination of Hexose Phosphates. Anal. Biochem. 1965, 11, 246–255. [Google Scholar] [CrossRef]
  22. Van Handel, E. Direct Microdetermination of Sucrose. Anal. Biochem. 1968, 22, 280–283. [Google Scholar] [CrossRef]
  23. R Development Core Team. R: A Language and Environment for Statistical Computing; Version 4.0.5; R Foundation for Statistical Computing: Vienna, Austria, 2021; p. 55. ISBN 3-900051-07-0. Available online: https://www.r-project.org/ (accessed on 1 December 2021).
  24. Wickham, H. Ggplot2—Elegant Graphics for Data Analysis, 2nd ed.; Springer: New York, NY, USA, 2017; 260p, ISBN 978-3-319-24275-0. [Google Scholar]
  25. Lee, B.R.; Kim, K.Y.; Jung, W.J.; Avice, J.C.; Ourry, A.; Kim, T.H. Peroxidases and Lignification in Relation to the Intensity of Water-Deficit Stress in White Clover (Trifolium Repens L.). J. Exp. Bot. 2007, 58, 1271–1279. [Google Scholar] [CrossRef]
  26. Borrajo, C.I.; Sánchez-Moreiras, A.M.; Reigosa, M.J. Morpho-Physiological Responses of Tall Wheatgrass Populations to Different Levels of Water Stress. PLoS ONE 2018, 13, e0209281. [Google Scholar] [CrossRef] [PubMed]
  27. Gratani, L.; Varone, L.; Crescente, M.F.; Catoni, R.; Ricotta, C.; Puglielli, G. Leaf Thickness, and Density Drive the Responsiveness of Photosynthesis to Air Temperature in Mediterranean Species according to Their Leaf Habitus. J. Arid Environ. 2018, 150, 9–14. [Google Scholar] [CrossRef]
  28. Alderotti, F.; Brunetti, C.; Marino, G.; Centritto, M.; Ferrini, F.; Giordano, C.; Tattini, M.; Moura, B.B.; Gori, A. Coordination of Morpho-Physiological and Metabolic Traits of Cistus incanus L. to Overcome Heatwave-Associated Summer Drought: A Two-Year on-Site Field Study. Front. Ecol. Evol. 2020, 8, 576296. [Google Scholar] [CrossRef]
  29. Brunetti, C.; Loreto, F.; Ferrini, F.; Gori, A.; Guidi, L.; Remorini, D.; Centritto, M.; Fini, A.; Tattini, M. Metabolic Plasticity in the Hygrophyte Moringa Oleifera Exposed to Water Stress. Tree Physiol. 2018, 38, 1640–1654. [Google Scholar] [CrossRef]
  30. Pic, E.; Teyssendier de la Serve, B.; Tardieu, F.; Turc, O. Leaf Senescence Induced by Mild Water Deficit Follows the Same Sequence of Macroscopic, Biochemical, and Molecular Events as Monocarpic Senescence in Pea. Plant Physiol. 2002, 128, 236–246. [Google Scholar] [CrossRef]
  31. Perdomo, J.A.; Capó-Bauçà, S.; Carmo-Silva, E.; Galmés, J. Rubisco and Rubisco Activase Play an Important Role in the Biochemical Limitations of Photosynthesis in Rice, Wheat, and Maize under High Temperature and Water Deficit. Front. Plant Sci. 2017, 8, 490. [Google Scholar] [CrossRef]
  32. Lipiec, J.; Doussan, C.; Nosalewicz, A.; Kondracka, K. Effect of Drought and Heat Stresses on Plant Growth and Yield: A Review. Int. Agrophysics 2013, 27, 463–477. [Google Scholar] [CrossRef]
  33. Zhang, D.; Du, Q.; Zhang, Z.; Jiao, X.; Song, X.; Li, J. Vapour Pressure Deficit Control in Relation to Water Transport and Water Productivity in Greenhouse Tomato Production during Summer. Sci. Rep. 2017, 7, 43461. [Google Scholar] [CrossRef]
  34. Xu, Q.; Ma, X.; Lv, T.; Bai, M.; Wang, Z.; Niu, J. Effects of Water Stress on Fluorescence Parameters and Photosynthetic Characteristics of Drip Irrigation in Rice. Water 2020, 12, 289. [Google Scholar] [CrossRef]
  35. Alou, I.N.; Steyn, J.M.; Annandale, J.G.; van der Laan, M. Growth, Phenological, and Yield Response of Upland Rice (Oryza sativa L. Cv. Nerica 4®) to Water Stress during Different Growth Stages. Agric. Water Manag. 2018, 198, 39–52. [Google Scholar] [CrossRef]
  36. Mauad, M.; Crusciol, C.A.C.; Filho, H.G. Produção de Massa Seca e Nutrição de Cultivares de Arroz de Terras Altas Sob Condição de Déficit Hídrico e Adubação Silicatada. Semin. Cienc. Agrárias 2011, 32, 939–948. [Google Scholar] [CrossRef]
  37. Zhang, H.; Xiong, Y.; Huang, G.; Xu, X.; Huang, Q. Effects of Water Stress on Processing Tomatoes Yield, Quality and Water Use Efficiency with Plastic Mulched Drip Irrigation in Sandy Soil of the Hetao Irrigation District. Agric. Water Manag. 2017, 179, 205–214. [Google Scholar] [CrossRef]
  38. Gao, Y.; Xia, J.; Chen, Y.; Zhao, Y.; Kong, Q.; Lang, Y. Effects of Extreme Soil Water Stress on Photosynthetic Efficiency and Water Consumption Characteristics of Tamarix Chinensis in China’s Yellow River Delta. J. For. Res. 2017, 28, 491–501. [Google Scholar] [CrossRef]
  39. Sharma, S.; Joshi, J.; Kataria, S.; Verma, S.K.; Chatterjee, S.; Jain, M.; Pathak, K.; Rastogi, A.; Brestic, M. Regulation of the Calvin Cycle under Abiotic Stresses: An Overview. In Plant Life Under Changing Environment; Elsevier: Amsterdam, The Netherlands, 2020; pp. 681–717. [Google Scholar]
  40. Nobel, P.S. Physicochemical and Environmental Plant Physiology, 5th ed.; Elsevier: Amsterdam, The Netherlands, 2020; 659p, ISBN 9780128191477. [Google Scholar]
  41. Durand, M.; Mainson, D.; Porcheron, B.; Maurousset, L.; Lemoine, R.; Pourtau, N. Carbon Source–Sink Relationship in Arabidopsis Thaliana: The Role of Sucrose Transporters. Planta 2018, 247, 587–611. [Google Scholar] [CrossRef]
  42. Traversari, S.; Francini, A.; Laura Traversi, M.; Emiliani, G.; Sorce, C.; Sebastiani, L.; Giovannelli, A.; Laura, M. Can Sugar Metabolism in the Cambial Region Explain the Water Deficit Tolerance in Poplar? Running Title: Sugar Metabolism Regulates Water Deficit Tolerance in Poplar. J. Exp. Bot. 2018, 69, 4083–4097. [Google Scholar] [CrossRef]
  43. Brunner, I.; Herzog, C.; Dawes, M.A.; Arend, M.; Sperisen, C. How Tree Roots Respond to Drought. Front. Plant Sci. 2015, 6, 547. [Google Scholar] [CrossRef]
  44. Dien, D.C.; Mochizuki, T.; Yamakawa, T. Effect of Various Drought Stresses and Subsequent Recovery on Proline, Total Soluble Sugar and Starch Metabolisms in Rice (Oryza Sativa L.) Varieties. Plant Prod. Sci. 2019, 22, 530–545. [Google Scholar] [CrossRef]
Figure 1. Timeline of experiments 3 and 4.
Agriculture 12 01261 g001
Figure 2. Leersia hexandra (A,C) and Luziola peruviana (B,D) plant length (cm) at 32 days after transplant as affected by different soil moisture levels in the 2017/18 (A,B) and 2018/19 (C,D) growing seasons. Bar graphs represent the average values (n = 16) and error bars represent the 95% confidence internals. Lowercase letters compare means by Tukey’s test (p ≤ 0.05).
Agriculture 12 01261 g002
Figure 3. Leersia hexandra (A,C) and Luziola peruviana (B,D) number of leaves evaluated at 32 days after transplanting as affected by different levels of soil moisture levels of the 2017/18 (A,B) and 2018/19 (C,D) growing seasons. Bar graphs represent the average values (n = 16) and the error bars represent the 95% confidence intervals. Lowercase letters compare soil moisture content by Tukey’s test (p ≤ 0.05).
Agriculture 12 01261 g003
Figure 4. Leersia hexandra (A,C) and Luziola peruviana (B,D) number of tillers evaluated at 32 days after transplanting as affected by different soil moisture levels on the 2017/18 (A,B) and 2018/19 (C,D) growing season. Bar graphs represent the average values (n = 4). Bar graphs represent the average values (n = 16) and error bars represent the 95% confidence intervals. Lowercase letters compare soil moisture content by Tukey’s test (p ≤ 0.05).
Agriculture 12 01261 g004
Figure 5. Total dry weight per plant (%) of Leersia hexandra (A,C) and Luziola peruviana (B,D) evaluated at 32 days after transplanting as affected by soil moisture levels content in 2017/18 (A,B) and 2018/19 (C,D) growing seasons. Bar graphs represent the average values (n = 4) and error bars represent the 95% confidence intervals. Lowercase letters compare soil moisture content by Tukey’s test (p ≤ 0.05).
Agriculture 12 01261 g005
Figure 6. Total soluble sugar content in leaves (A,C) and roots (B,D) of Leersia hexandra (L. h.) (A,B) and Luziola peruviana (L. p.) (C,D) during the 2019/20 growing season with 3 months of cultivation, before and after drainage to field capacity (FC). Uppercase letters compare harvest treatments, and lowercase letters compare soil moisture content by multiple-comparison procedures with the Holm–Sidak method (p ≤ 0.05). Bar graphs represent the average of treatments (n = 3) and error bars represent the 95% confidence intervals.
Agriculture 12 01261 g006
Figure 7. Sucrose content in leaves (A,C) and roots (B,D) of Leersia hexandra (L. h.) (A,B) and Luziola peruviana (L. p.) (C,D) during the 2019/20 growing season, in plants with 3 months of cultivation, before and after draining to field capacity (FC). Uppercase letters compare harvest treatments, and lowercase letters compare soil moisture content by multiple-comparison procedures with the Holm–Sidak method (p ≤ 0.05). Bar graphs represent the average of treatments (n = 3) and error bars represent the 95% confidence intervals.
Agriculture 12 01261 g007
Figure 8. Starch content in leaves (A,C) and roots (B,D) of Leersia hexandra (L. h.) (A,B) and Luziola peruviana (L. p.) (C,D) during the 2019/20 growing seasons in plants with 3 months of cultivation, before and after drainage until field capacity (FC). Uppercase letters compare harvest treatments, and lowercase letters compare soil moisture content by multiple-comparison procedures with the Holm–Sidak method (p ≤ 0.05). Bar graphs represents the average of treatments (n = 3) and error bars represent the 95% confidence intervals.
Agriculture 12 01261 g008
Publisher’s Note: MDPI stays neutral with regard to jurisdictional claims in published maps and institutional affiliations.

