Article

A Dead Broiler Inspection System for Large-Scale Breeding Farms Based on Deep Learning

1
College of Engineering, China Agriculture University, Beijing 100082, China
2
College of Engineering, Jiangxi Agriculture University, Nanchang 330045, China
3
Agricultural Facilities and Equipment Research Institute, Jiangsu Academy of Agriculture Sciences, Nanjing 210014, China
*
Author to whom correspondence should be addressed.
Agriculture 2022, 12(8), 1176; https://doi.org/10.3390/agriculture12081176
Submission received: 28 June 2022 / Revised: 20 July 2022 / Accepted: 3 August 2022 / Published: 7 August 2022
(This article belongs to the Special Issue The Application of Machine Learning in Agriculture)

Abstract

:
Stacked cage is the main breeding method of the large-scale farm in China. In broiler farms, dead broiler inspection is a routine task in the breeding process. It refers to the manual inspection of all cages and removal of dead broilers in the broiler house by the breeders every day. However, as the total amount of broilers is huge, the inspection work is not only time-consuming but also laborious. Therefore, a dead broiler inspection system is constructed in this study to replace the manual inspection work. It mainly consists of an autonomous inspection platform and a dead broiler detection model. The automatic inspection platform performs inspections at the speed of 0.2 m/s in the broiler house aisle, and simultaneously collects images of the four-layer broilers. The images are sent to a server and processed by a dead broiler detection model, which was developed based on the YOLOv3 network. A mosaic augment, the Swish function, an spatial pyramid pooling (SPP) module, and complete intersection over union (CIoU) loss are used to improve the YOLOv3 performance. It achieves a 98.6% mean average precision (intersection of union (IoU) = 0.5) and can process images at 0.007 s per frame. The dead broiler detection model is robust to broilers of different ages and can adapt to different lighting conditions. It is deployed on the server with a human–machine interface. By observing the processing results using the human–machine interface, the breeders could directly find the cage position of dead broilers and remove them, which could reduce the workload of breeders and promote the intelligent development of poultry breeding.

1. Introduction

The broiler breeding industry is an essential part of animal husbandry. With the increase in the global population, the demand for poultry products is increasing. China is a country with a large population, poultry products in China has always been in a high demand. Unlike Europe and the United States, intensive breeding is still the dominant poultry breeding method in China. In recent years, agriculture in China has been developing towards mechanization, automation, and intelligence. Smart farming is an emerging concept that refers to managing farms using technologies such as the Internet of Things (IoT), robotics, drones, and artificial intelligence (AI) to increase the quantity and quality of products while optimizing the human labor required by production [1]. In the poultry breeding house, most of the breeding process has been automated, such as feeding, drinking, and manure cleaning. However, there are still some breeding processes that need to be mechanized and automated, such as the monitoring and management of the environment, the weighing of poultry, and the detection of sick and dead poultry individuals [2].
Death and disease are the crucial issues in broiler breeding. In large-scale and intensive broiler breeding farms, the frequent occurrence of poultry diseases and death will lead to substantial economic losses and welfare problems. According to our experience, dead broilers will rot and stink after a certain amount of time, which may give rise to the cross-infection of disease in the broiler flock and reduce broiler welfare. Infected broilers are simply slaughtered to prevent the spread of disease and further economic damage. Therefore, reducing the negative impact of the dead broiler and such a disease outbreak has drawn significant attention [3]. Removing the dead broilers from the flock in time can minimize the spread of disease and constrain the economic costs as much as possible. In a large-scale broiler farm, broiler breeders need to observe each cage and manually remove dead broilers on the basis of their breeding experience every day. As there are thousands of cages within a poultry house, the inspection work is time-consuming and laborious [4]. Especially in a stacked-cage broiler house, it is dangerous for the breeders to inspect the broiler cages in the third and fourth layers. Moreover, the small particles and irritant gas produced by broilers and manure are harmful to the breeders. Therefore, replacing the manual inspection work with automation is vital in reducing economic losses and improving farmers’ welfare.
In recent years, machine learning and digital image processing have been widely used in the study of animal behavior [5,6,7,8,9]. Researchers have utilized machine learning and image analysis schemes to identify the health of chickens. Some researchers have used the supervised classifiers to classify the 2D posture shape descriptors and mobility features of the walking broilers to analyze broiler lameness or Newcastle disease [10,11,12,13]. Accordingly, other researchers have analyzed the posture of broilers based on the skeleton feature for the early detection of sick broilers, and developed a sick-broiler detection method based on deep learning [14,15,16]. Furthermore, the broiler chicken flocks’ activity levels and optical flow changes have been found to correlate significantly with leg disease in broiler chickens flocks [17,18,19,20]; the activity level and optical flow of flocks can also be used in the disease prediction.
There are also some existing studies which have utilized machine learning methods to identify dead broiler chickens. Zhu et al. [21] used the support vector machines (SVM) classifier to classify the extracted features of chicken cockscomb and leg to identify dead chickens. Li et al. [22] designed and constructed a chicken inspection robot to monitor the chickens in the farm. The chicken inspection robot could walk in the corridor of the chicken house and monitor chickens’ health and behavior with similar methods in real time. Bao et al. [23] proposed a sensor detection method to detect sick and dead chickens: by fastening a foot ring on each chicken, the three-dimensional displacement of chickens was analyzed with a machine-learning classification method to detect the dead and sick chickens in the flocks. Liu et al. [24] developed a small removal system for dead chickens for a Taiwanese poultry house, which could walk in the flat chicken house and collect dead chickens automatically. It had dimensions of 1.038 × 0.36 × 0.5 m and could remove two dead chickens in a single operation. The system identified the dead chickens through deep learning based on the YOLOv4 network, and achieved a good precision. The existing studies mainly focused on the detection of dead chickens in flat breeding and single-layer-cage breeding. The extension to death detection in stacked-cage broilers remained unclear. As stacked cage is the main method of broiler breeding in China, and it is also the place where automation is most urgently needed, it is necessary to realize the automatic detection of dead broilers in a stacked-cage broiler breeding house. This study aims to develop a method to detect dead broilers in an intensive stacked-cage broiler house automatically. An autonomous inspection platform was developed in this study, which could walk in the broiler house and capture images for each of the cages. A broiler detection model based on the improved-YOLOv3 was deployed on the server to process the images and identify the dead broilers in the flocks. The detection results were stored in an excel format and could be checked in the human–machine interface. With this method, the breeding staff could check the results to know the position of dead broilers without observing the cages one by one, which could further reduce the labor burden of the breeders.

2. Materials and Methods

2.1. Autonomous Inspection Platform

2.1.1. Configuration of the Platform

In order to automatically collect images of the broiler flocks, an autonomous inspection platform was designed for the stacked-cage broiler house. It could automatically navigate and capture images in the poultry house. The structure of the platform is illustrated in Figure 1. It has a total length, width, and height of 53, 47, and 310 cm and is mainly composed of a walking system with camera sensors mounted on it.
As the autonomous inspection platform mainly walks in the cement aisle of the broiler house, the walking system is designed as a wheeled self-propelled vehicle. For stability and to implement steering in the aisle, the vehicle adopts two 8-inch pneumatic tires as driving wheels and two 4-inch universal wheels. Two DC servo motors (MD60, Wheeltec Co., Ltd, Guangzhou, China) are used as the drive and controlled by a motor drive module (WSDC2412D, Wheeltec Co., Ltd, Guangzhou, China). To control the vehicle, a computer (Dell OptiPlex 7090MFF, Dell Inc., Xiamen, China), motor controller (STM32, STMicroelectronics, Shanghai, China), and magnetic navigation sensor (D-MNSVimah6-X16, Guangzhou LENET Technology Co., Ltd, Guangzhou, China) are mounted on the platform. A 24-V battery is used to provide power for the entire system. Voltage transformers convert the voltage of the 24-V battery to the voltage required by the other components. The magnetic navigation sensor is installed under the front of the vehicle to read the magnetic strip for navigation and positioning. Others are placed in the body of the vehicle. As the main task of the platform is image acquisition, a hollow carbon fiber mast with an internal diameter of 52 mm and an external diameter of 60 mm is fixed on the vehicle. Four charge coupled device (CCD)cameras (Sony XCG-CG240C, Sony Corporation, Shanghai, China) tilted down 60 degrees horizontally are then attached on the mast by connectors which are 3D printed. Table 1shows the parameters of the camera and lens. The heights of the cameras are set to 93.5, 171.5, 244.0, and 308.5 cm separately to monitor four layers of the broilers at the same time. They are adjusted manually to ensure the quality of images.

2.1.2. Software and Control Procedure

The industrial computer, with an Ubuntu 18.04 and Robot Operation System 2 (ROS), is the control center of the platform, which can be remote-controlled through the wireless router (Huawei AX3pro, Huawei Device Co., Ltd, Guangzhou, China). The ROS is used to receive, process, and send data with all peripherals. Figure 2 shows a computation graph of the ROS. Nodes are contained in the ellipse shapes. Each node in the graph is responsible for a single module purpose, such as the camera_capture_node for controlling the camera and the meg_sensor node for controlling the magnetic sensor. Message exchange between the nodes is realized by publishing and subscribing topics. In this graph, topics between two nodes are displayed on their links. Take the vehicle_control_node as an example, the vehicle_control_node subscribes the odom topic from the motion control node to acquire the odometer data, and subscribes the meg_strip topic from the meg_sensoring node to confirm the magnetic sensor data. The robot_node subscribes the tape_info topic, which includes the waypoint data. The interpretation of each node and topic is shown in Table 2.
Figure 3 illustrates the flowchart of the inspection procedure. After turning the switch on at the start point, the magnetic navigation sensor identifies the magnetic guide strip laid in advance on the aisle. While driving, the platform drives from one waypoint to another along the magnetic strip, the industrial computer receives and processes feedback from the magnetic navigation sensor and determines whether it has reached an image capture waypoint according to the waypoint list. If an image capture waypoint is detected, the platform will stop and capture images of the broiler flock, otherwise, the platform will continue to drive. If the platform detects the last waypoint in the aisle, the platform will turn in place and inspect the broiler flocks on the other side. Eventually, the platform returns to the original position. In multiple-channel inspection, the same procedure is used but with additional steps for two 90-degree turns.

2.2. Dead Broiler Detection Model

2.2.1. YOLOv3 Network Structure

YOLOv3 [25] is a one-staged object detection network, it has the advantage of a fast detection speed and ease of deployment. Figure 4 shows the structure of the YOLOv3 network. The structure of the YOLOv3 network can be divided into three parts: backbone, neck, and head. YOLOv3 uses the darknet-53 network as its backbone to extract features, which mainly consists of several convolution (conv) and residual (res) modules. Each conv layer contains a convolution operation (conv2d), batch normalization (BN) operation, and leaky rectified linear unit (Leaky ReLU)operation; two conv layers and a shortcut operation constitute the res layer. In the neck part, a feature pyramid network (FPN) is selected. The FPN structure mainly utilizes two up-sampling operations to fuse the features generated by the backbone. It will generate three feature maps with different scales to the detection head. The height, width, and channel of the feature maps are 19 × 19 × 21, 38 × 38 × 21, and 76 × 76 × 21, respectively. In the detection head, the YOLOv3 network predicts boxes at three different scales on these feature maps. The object loss and classification loss of the predicted and target boxes are calculated with the binary cross-entropy loss function; the coordinate loss is calculated with a mean square error loss function.

2.2.2. Improvement of the YOLOv3 Network

Mosaic enhancement: Mosaic enhancement refers to the random selection of four images for zooming and stitching, which not only enriches the dataset but also reduces the consumption of graphic processing unit (GPU) computing.
Swish: An activation function was the function added to the neural network which has a significant effect on the training dynamics and task performance. Sigmoid, Tanh, rectified linear unit (ReLU), Leaky ReLU, and parametric rectified linear unit (PReLU) are generally used activation functions in convolutional neural network (CNN). In the YOLOv3 network, the LReLU was used as the activation function to solve the gradient disappearance problem of the ReLU function. The graph of the LReLU is plotted in Figure 5a. In this study, Swish was selected instead of the LReLU activation function [26]. The Swish function is defined as below:
σ ( χ ) = χ * σ ( β χ ) = χ 1 + e β χ
where σ ( z ) = ( 1 + exp ( z ) ) 1 is the sigmoid function and β is either a constant or a trainable parameter. If β = 1, Swish is equivalent to the sigmoid-weighted linear unit. If β = 0, Swish becomes the scaled linear function. As β → ∞, the sigmoid component approaches a 0–1 function. The graph of the Swish is plot in Figure 5b. Swish is smooth and nonmonotonic. It could achieve a stronger performance than ReLU, LReLU, or PReL.
SPP: The SPP module was first proposed by He et al. [27]. In this study, the structure of the SPP module is a concatenation of max-pooling outputs with kernel size k × k, where k = {1; 5; 9; 13}, and the stride is equal to 1, which could effectively increase the receptive field and distinguish the most significant context features. The SPP module reduces the information loss in the up-sampling process of the network and integrates features of different sizes, which can improve the model’s ability to identify objects of different sizes.
CIoU loss: In the YOLOv3 network, the binary cross-entropy loss function is used to calculate the classification and confidence loss, and the mean square error loss function is employed to calculate the center coordinates’ loss and width and height coordinate loss. In this study, CIoU loss is used to replace the original loss function [28]. The CIoU loss considers the overlap area, central point distance, and aspect ratio of the bounding boxes, which could lead to a faster convergence and better performance, as presented in Equations (2)–(4).
L o s s C I O U = 1 IoU + d 2 c 2 + α v
v = 4 π 2 ( arctan w g t h g t arctan w h ) 2
α = v ( 1 IoU ) + v
where IoU is the intersection and union ratio of the predicted box and the target box, c is the diagonal length of the smallest enclosing box covering two boxes. W, h are the width and height of the predicted box, w g t , h g t are the width and height of the target box, and d is the box center distance of the predicted box and target box.

2.2.3. Model Training and Evaluation

All experiments were performed on an Intel(R) Core (TM) i7-9700k 3.60GHz CPU (16 GB RAM) with a GeForce RTX 2080GPU (8 GB VRAM). The software environment was Windows 10, Cuda 10.2, and Pytorch 1.6. Since the broiler was similar to the bird of the MS COCO data set, we exploited the pretrained weight on the MS COCO data set to apply transfer learning, significantly reducing the training time and improving the detection accuracy. The training set had a batch size of 4, an initial learning rate of 0.01, and 300 epochs.
To evaluate the model’s detection performance, this work utilizes the precision (P), recall (R), average precision (AP), and mean average precision (mAP) evaluation indexes, defined in Equations (5)–(8). Precision is the proportion of correctly predicted samples in the predicted positive samples, recall is the proportion of predicted positive samples in the positive samples, and average precision is the area under the P-R curve with recall as the abscissa and precision as ordinate [29].
P = T P F P + TP
R = TP TP + FN
AP = 0 1 P ( R ) d R
m AP = A P C
where TP is the number of positive samples correctly predicted, FP is the number of positive samples wrongly predicted, FN is the number of negative samples wrongly predicted, and C is the number of classes.

2.2.4. Experimental Environment

Experiment was conducted in Minhe Farming Co., Ltd., Yantai City, Shandong Province, China. The broilers were reared in stacked-cage houses, with 1632 sets of cages. The broiler house adopted four overlapping layers, up and down, comprising eight layers. Each cage was 240 cm long, 150 cm wide, and 37 cm high and was equipped with an incandescent lamp, feeding trays, nipple drinkers, and conveyor-type manure cleaning devices. The light intensity inside the cage ranged from 1.2 to 18.0 lux. Screw feeders automatically supplied food in the feeding trays, and a water pipe supplied water to the nipple drinkers throughout the day. About 70 broilers of the Ross308 breed were reared in each cage.

2.2.5. Dataset

The dataset was collected from 1 October to 30 October 2020 and 1 August to 30 August 2021. From 1 October to 30 October 2020, the images were manually collected from the cages on the first and second layer of the first floor between 07:00 and 10:00 every morning. Equipment included a Sony camera with a fixed focus lens, a 12 V lithium battery, a tripod, and a laptop computer. The camera was fixed on the tripod and powered by a 12-V battery. The image acquisition software “XCCamViewer” was used to control and adjust the camera. The equipment was set up in a quarter of the broiler cage to capture images of broiler flocks. During this period, the experiment mainly collected images with dead broilers as the training dataset. From 1 August to 30 August 2021, the autonomous inspection platform inspected the broiler house and captured images at each image acquisition waypoint. Figure 6 shows the image acquisition waypoint in the aisle, each waypoint was located in a quarter of the cages. The platform simultaneously collected images of four layers of cages in the selected aisle. Images collected during this period were used to supplement and validate the dead broiler detection model.
A total of 1310 images (1920 × 1200 pixels) in jpg format were selected for annotation, among which 626 images were selected from manual collection and 694 images from autonomous inspection platform collection. Images were manually annotated utilizing the “LabelImg” tool (Version 1.8.0) The dead broilers were labeled as “dead” and the remaining ones as “live”. Data augmentation involved vertically and horizontally flipping and randomly changing the brightness, contrast, and saturation to enhance the model’s recognition ability and decrease over-fitting. Eventually, the dataset was increased to 4493 and divided into a training, validation, and test set (ratio of 8:1:1).

3. Results and Discussion

3.1. Evaluation of the Autonomous Inspection Platform Performance

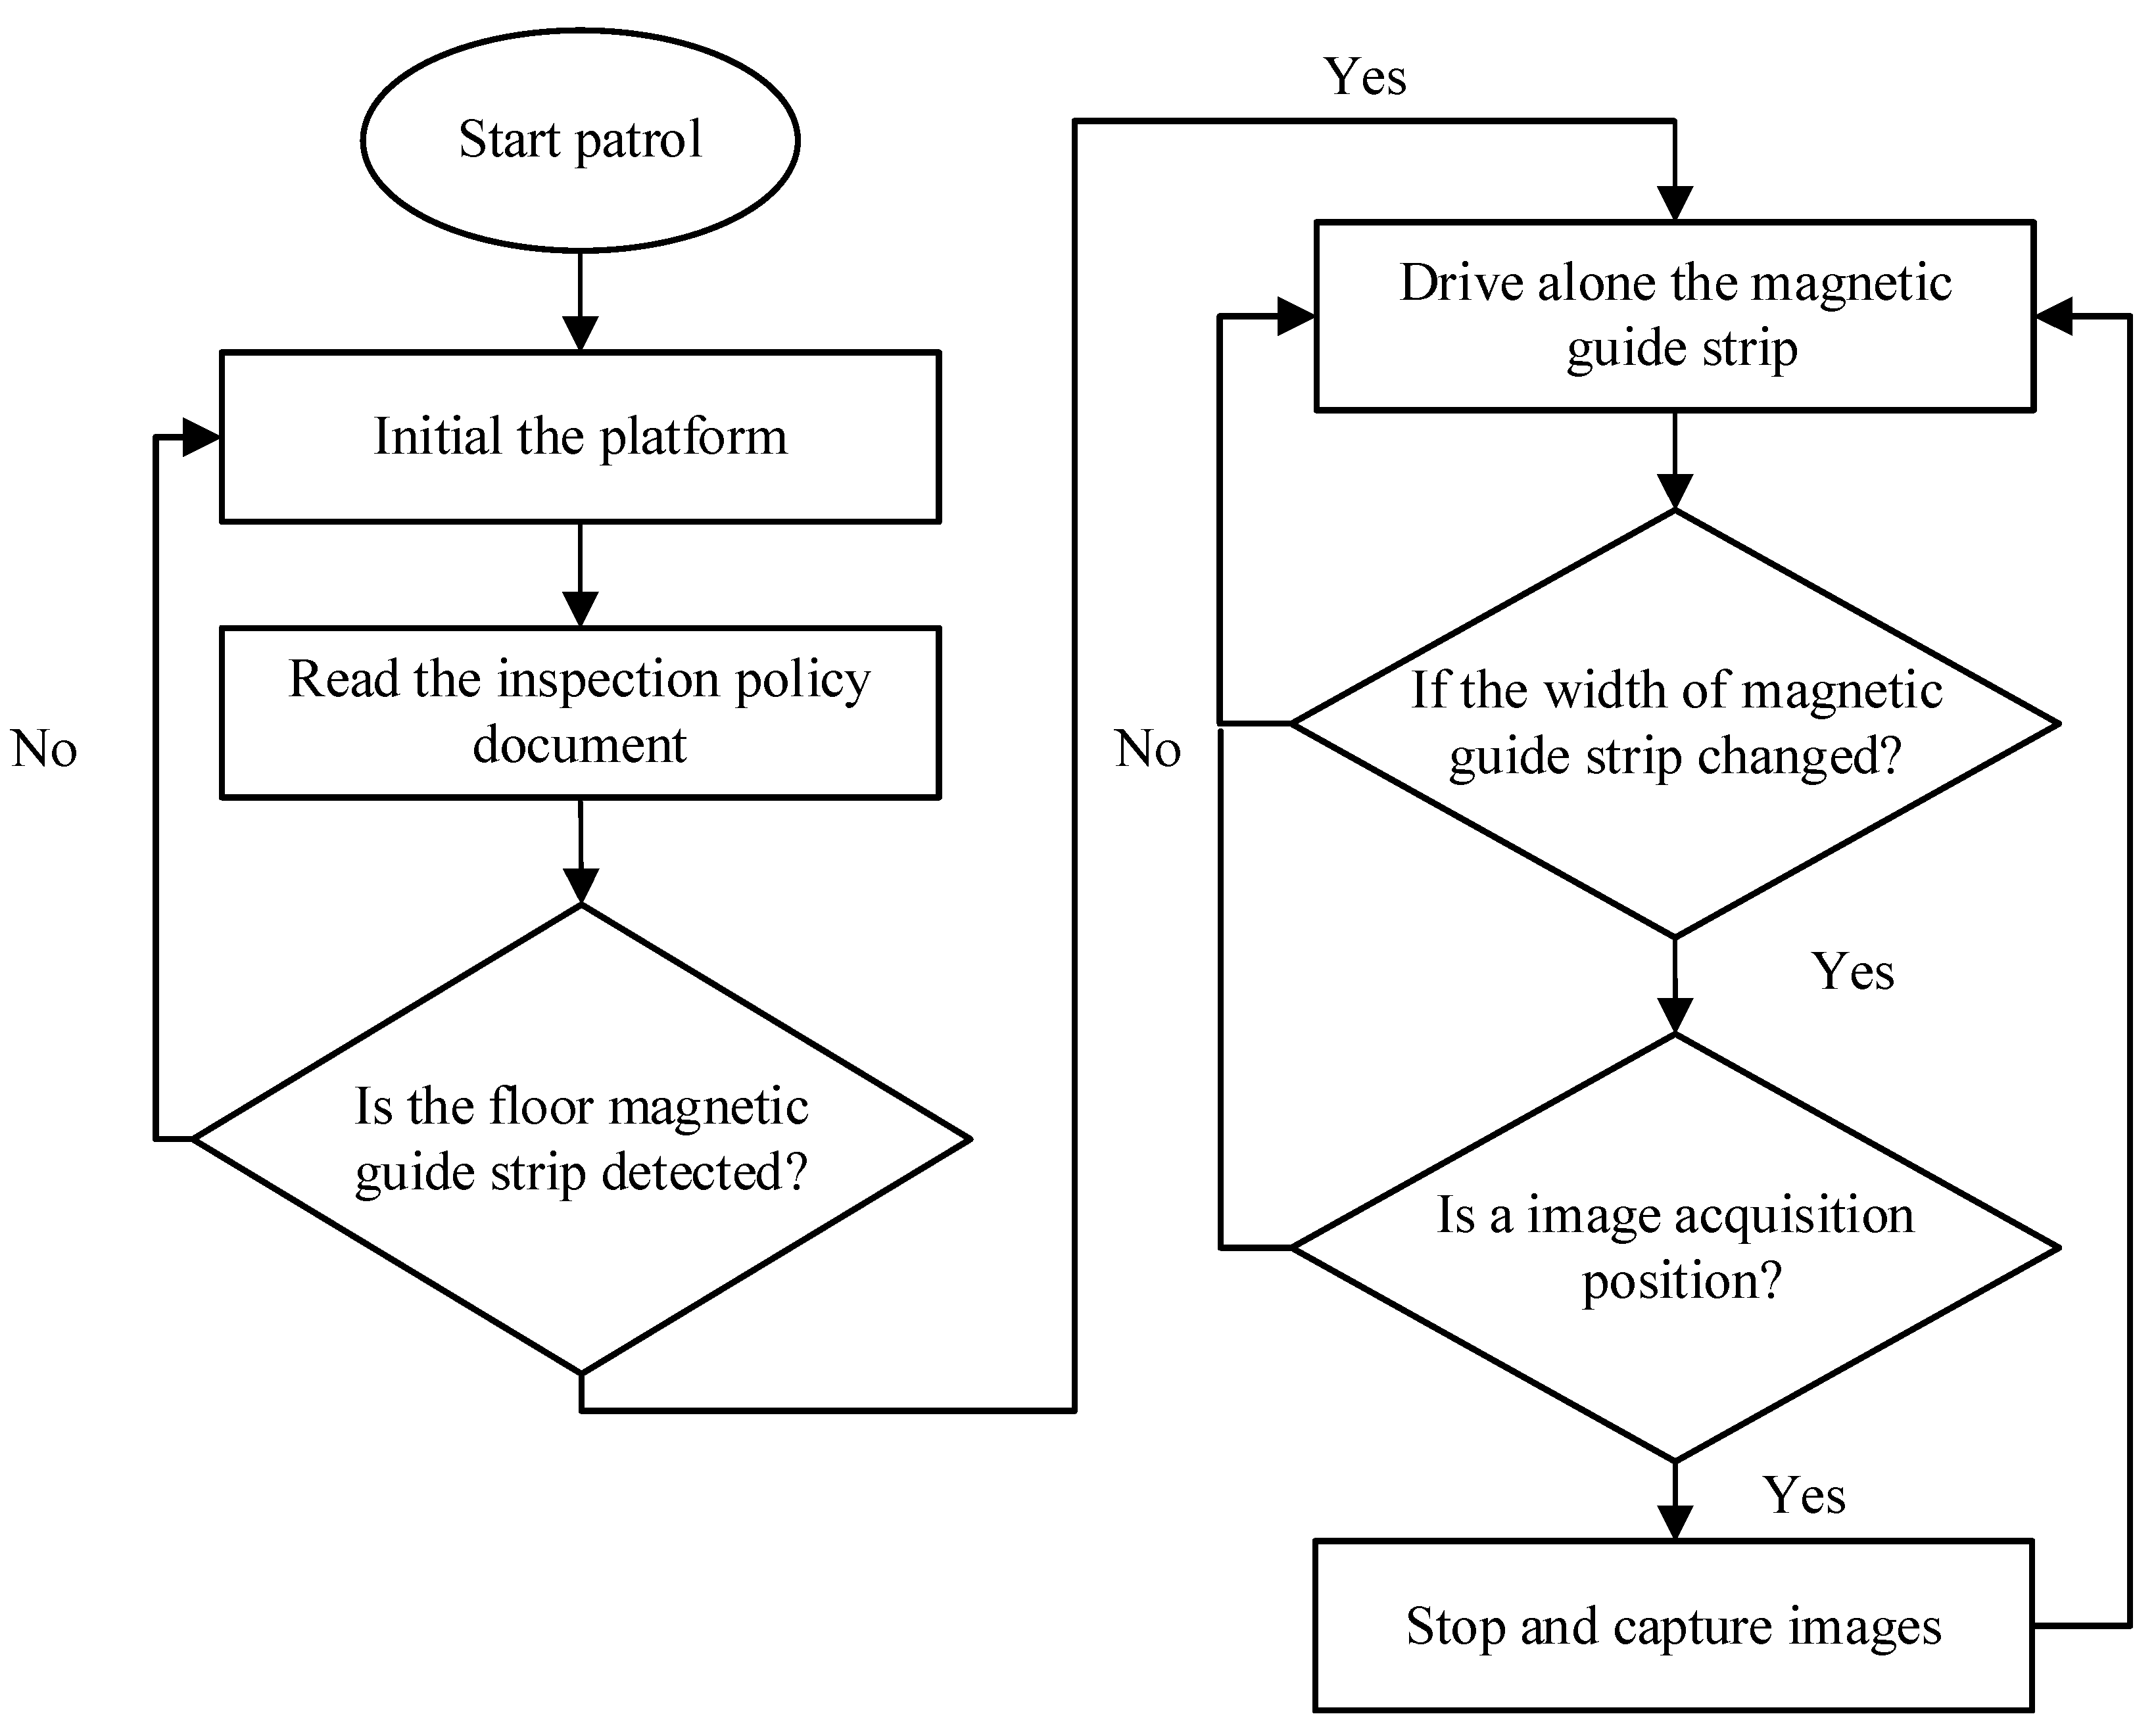
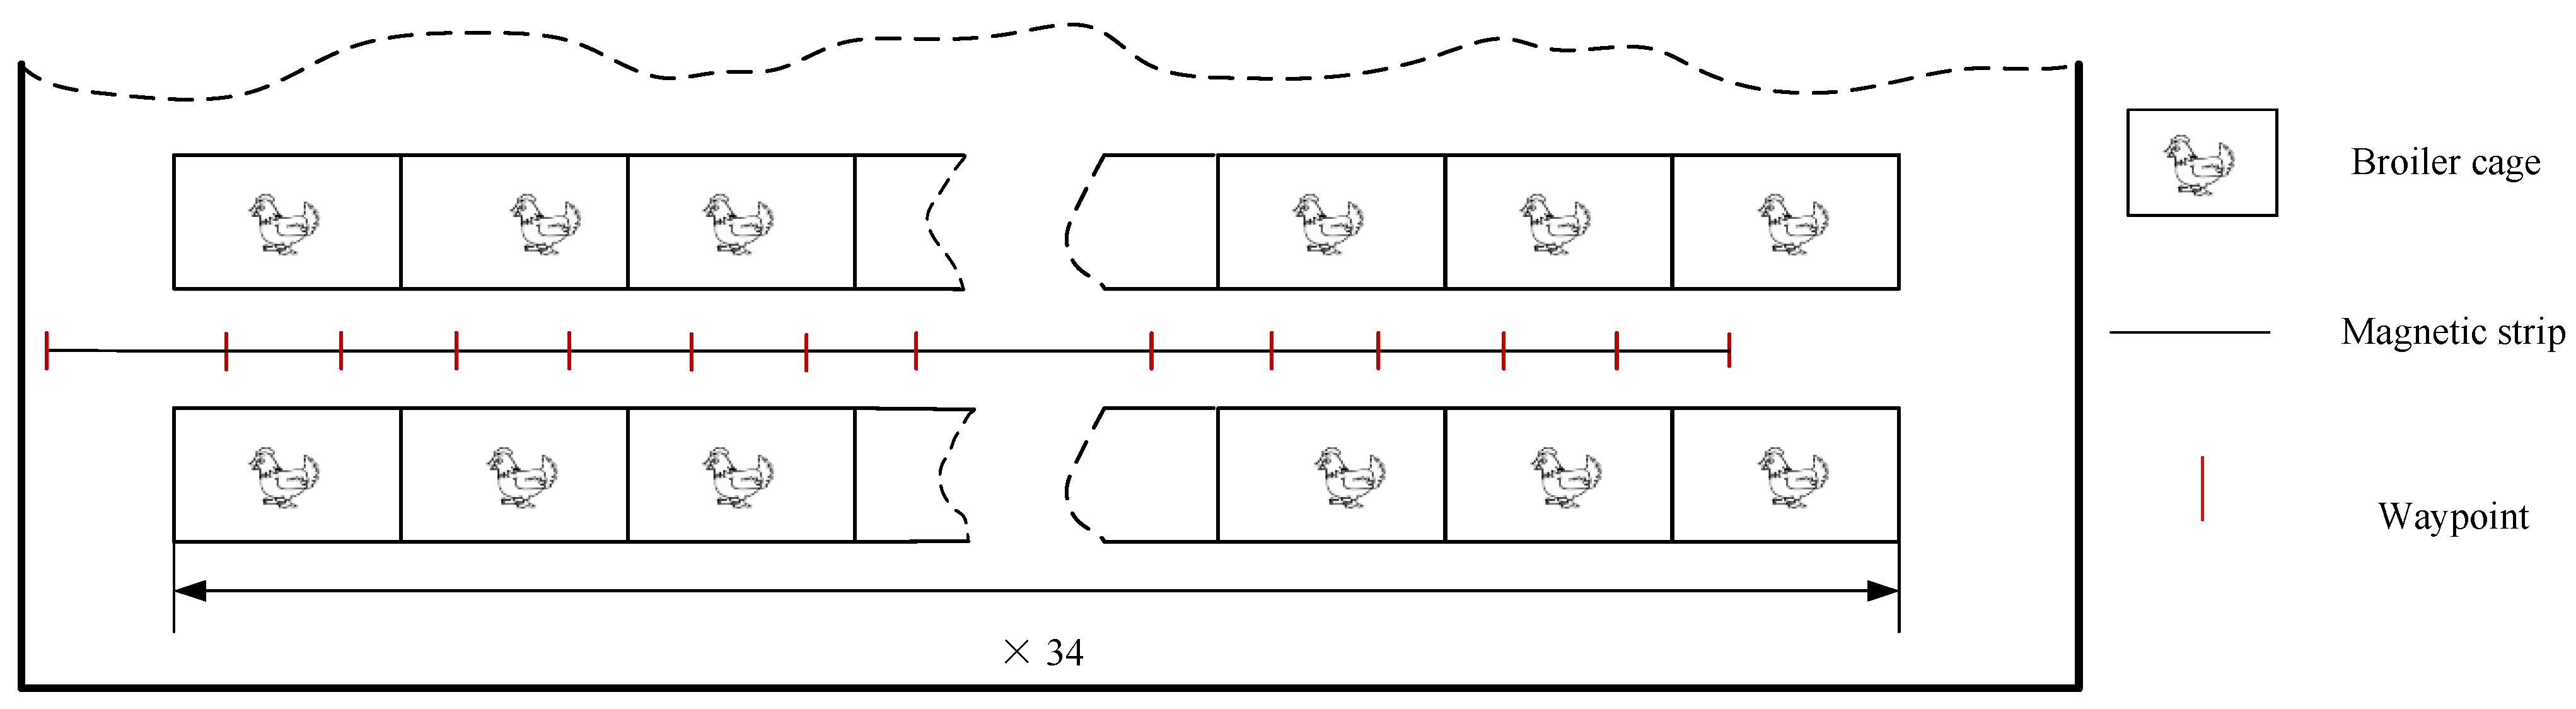
The walking speed of the platform is of great importance for the inspection work. A high inspection speed will cause the inaccurate positioning of the platform, blurred images, and even disturbing the broiler flocks, which is not expected. However, a lower speed is also not desired. As the inspection time is limited, a lower speed will lead to the inefficiency of the platform. Thus, a suitable inspection speed of the platform is very important for stable driving and image acquisition. After several experiments in the broiler house, the walking speed of the platform was determined to be 0.2 m/s, which was equivalent to a quarter of the walking speed of people. During the inspection, the platform stopped at a quarter of each cage, and each camera captured three images at an interval of 5 s. Therefore, it took 38 s to capture images of four layers of cages simultaneously, and a total of 24 images were captured by the four cameras.
The accuracy of the magnetic navigation has a great impact on the quality of the image and the position of the platform. Unqualified images and incorrect position information may lead to a poor and invalid detection result. Hence, a parking experiment was conducted to test the navigation performance. The platform started from a starting point and drove along the magnetic strip, parking at a distance of 60, 120, 180, or 240 cm away. Offsets of the platform were recorded manually and are shown in Table 3. The front and rear offsets of the platform are shown in the left part, ranging from a minimum of 0.6 cm to a maximum of 3.7 cm, with an average offset of 2.1 cm. Statistical inference did not show any difference in offset between position distances (p-value > 0.7). All the offsets were positive in this experiment, this was due to the inertia of the platform causing the platform to move forward a certain distance when parked. The left and right offsets are shown in the right part of Table 3, where the minimum offset was 0.3 cm, the maximum offset was 2.3 cm, and the average offset was 1.26 cm, with no significant difference in the left and right offset between different position distances (p > 0.7). The left and right offset is due to the magnetic navigation of the platform. When the platform is driving along the magnetic strip, the magnetic navigation sensor constantly corrects the direction of the platform, so the platform will produce left and right offsets when parked.

3.2. Evaluation of the Dead Broiler Detection Model

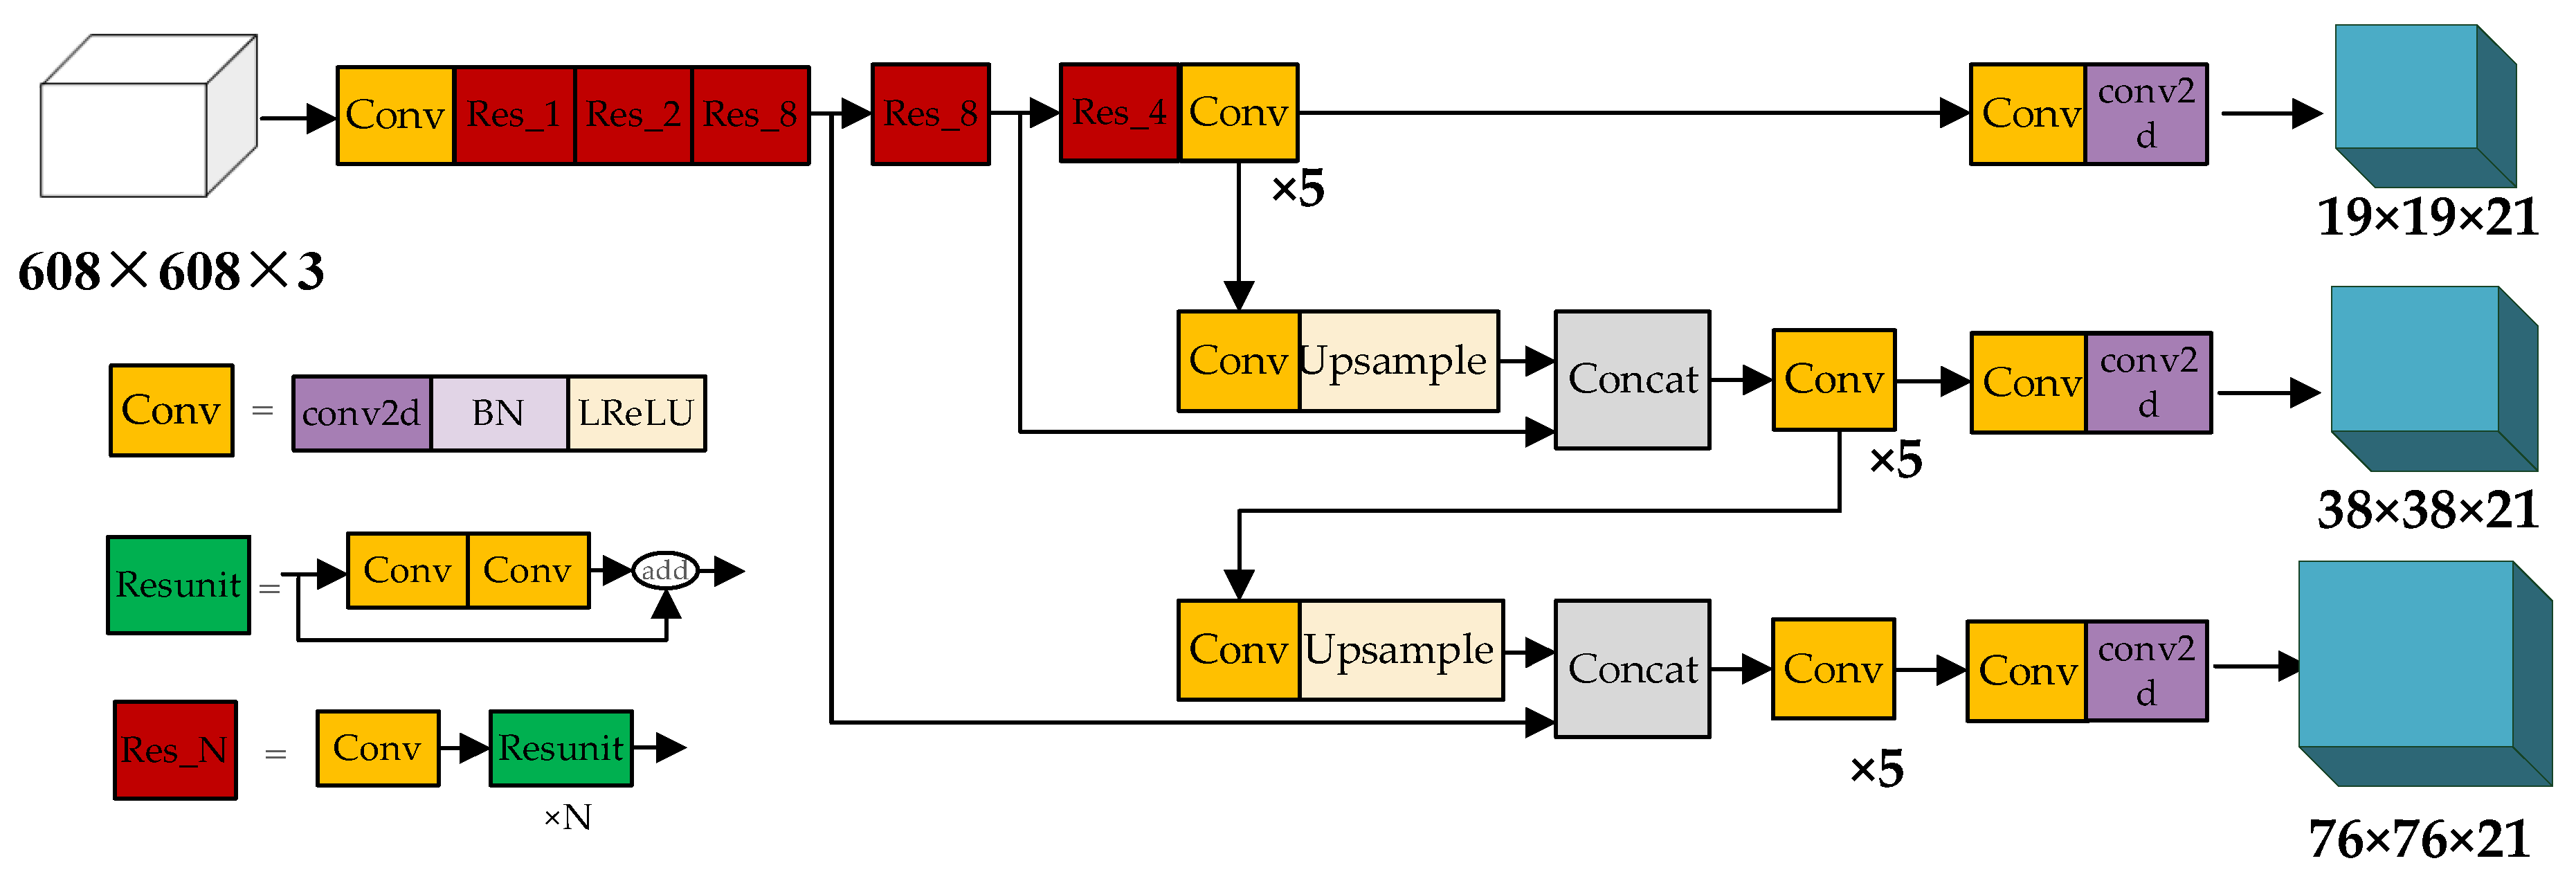
3.2.1. Evaluation of Improved-YOLOv3 Models

Table 4 presents the precision, recall, and mAP of the YOLOv3 and improved-YOLOv3 models. The precision, recall, and average precision of the improved-YOLOv3 model on dead broilers were 97.0%, 97.0%, and 98.2%, higher than those of YOLOv3 by 22.4%, 3.5%, and 5.5%, respectively. The precision, recall, and average precision of the improved-YOLOv3 model on live broilers were 93.1%, 96.7%, and 99.0%, which were 16.5%, 3.4%, and 8.7% higher than those of the YOLOv3 model. Processing an image with the improved-YOLOv3 model only took 0.007 s, which was faster than the YOLOv3 model. 
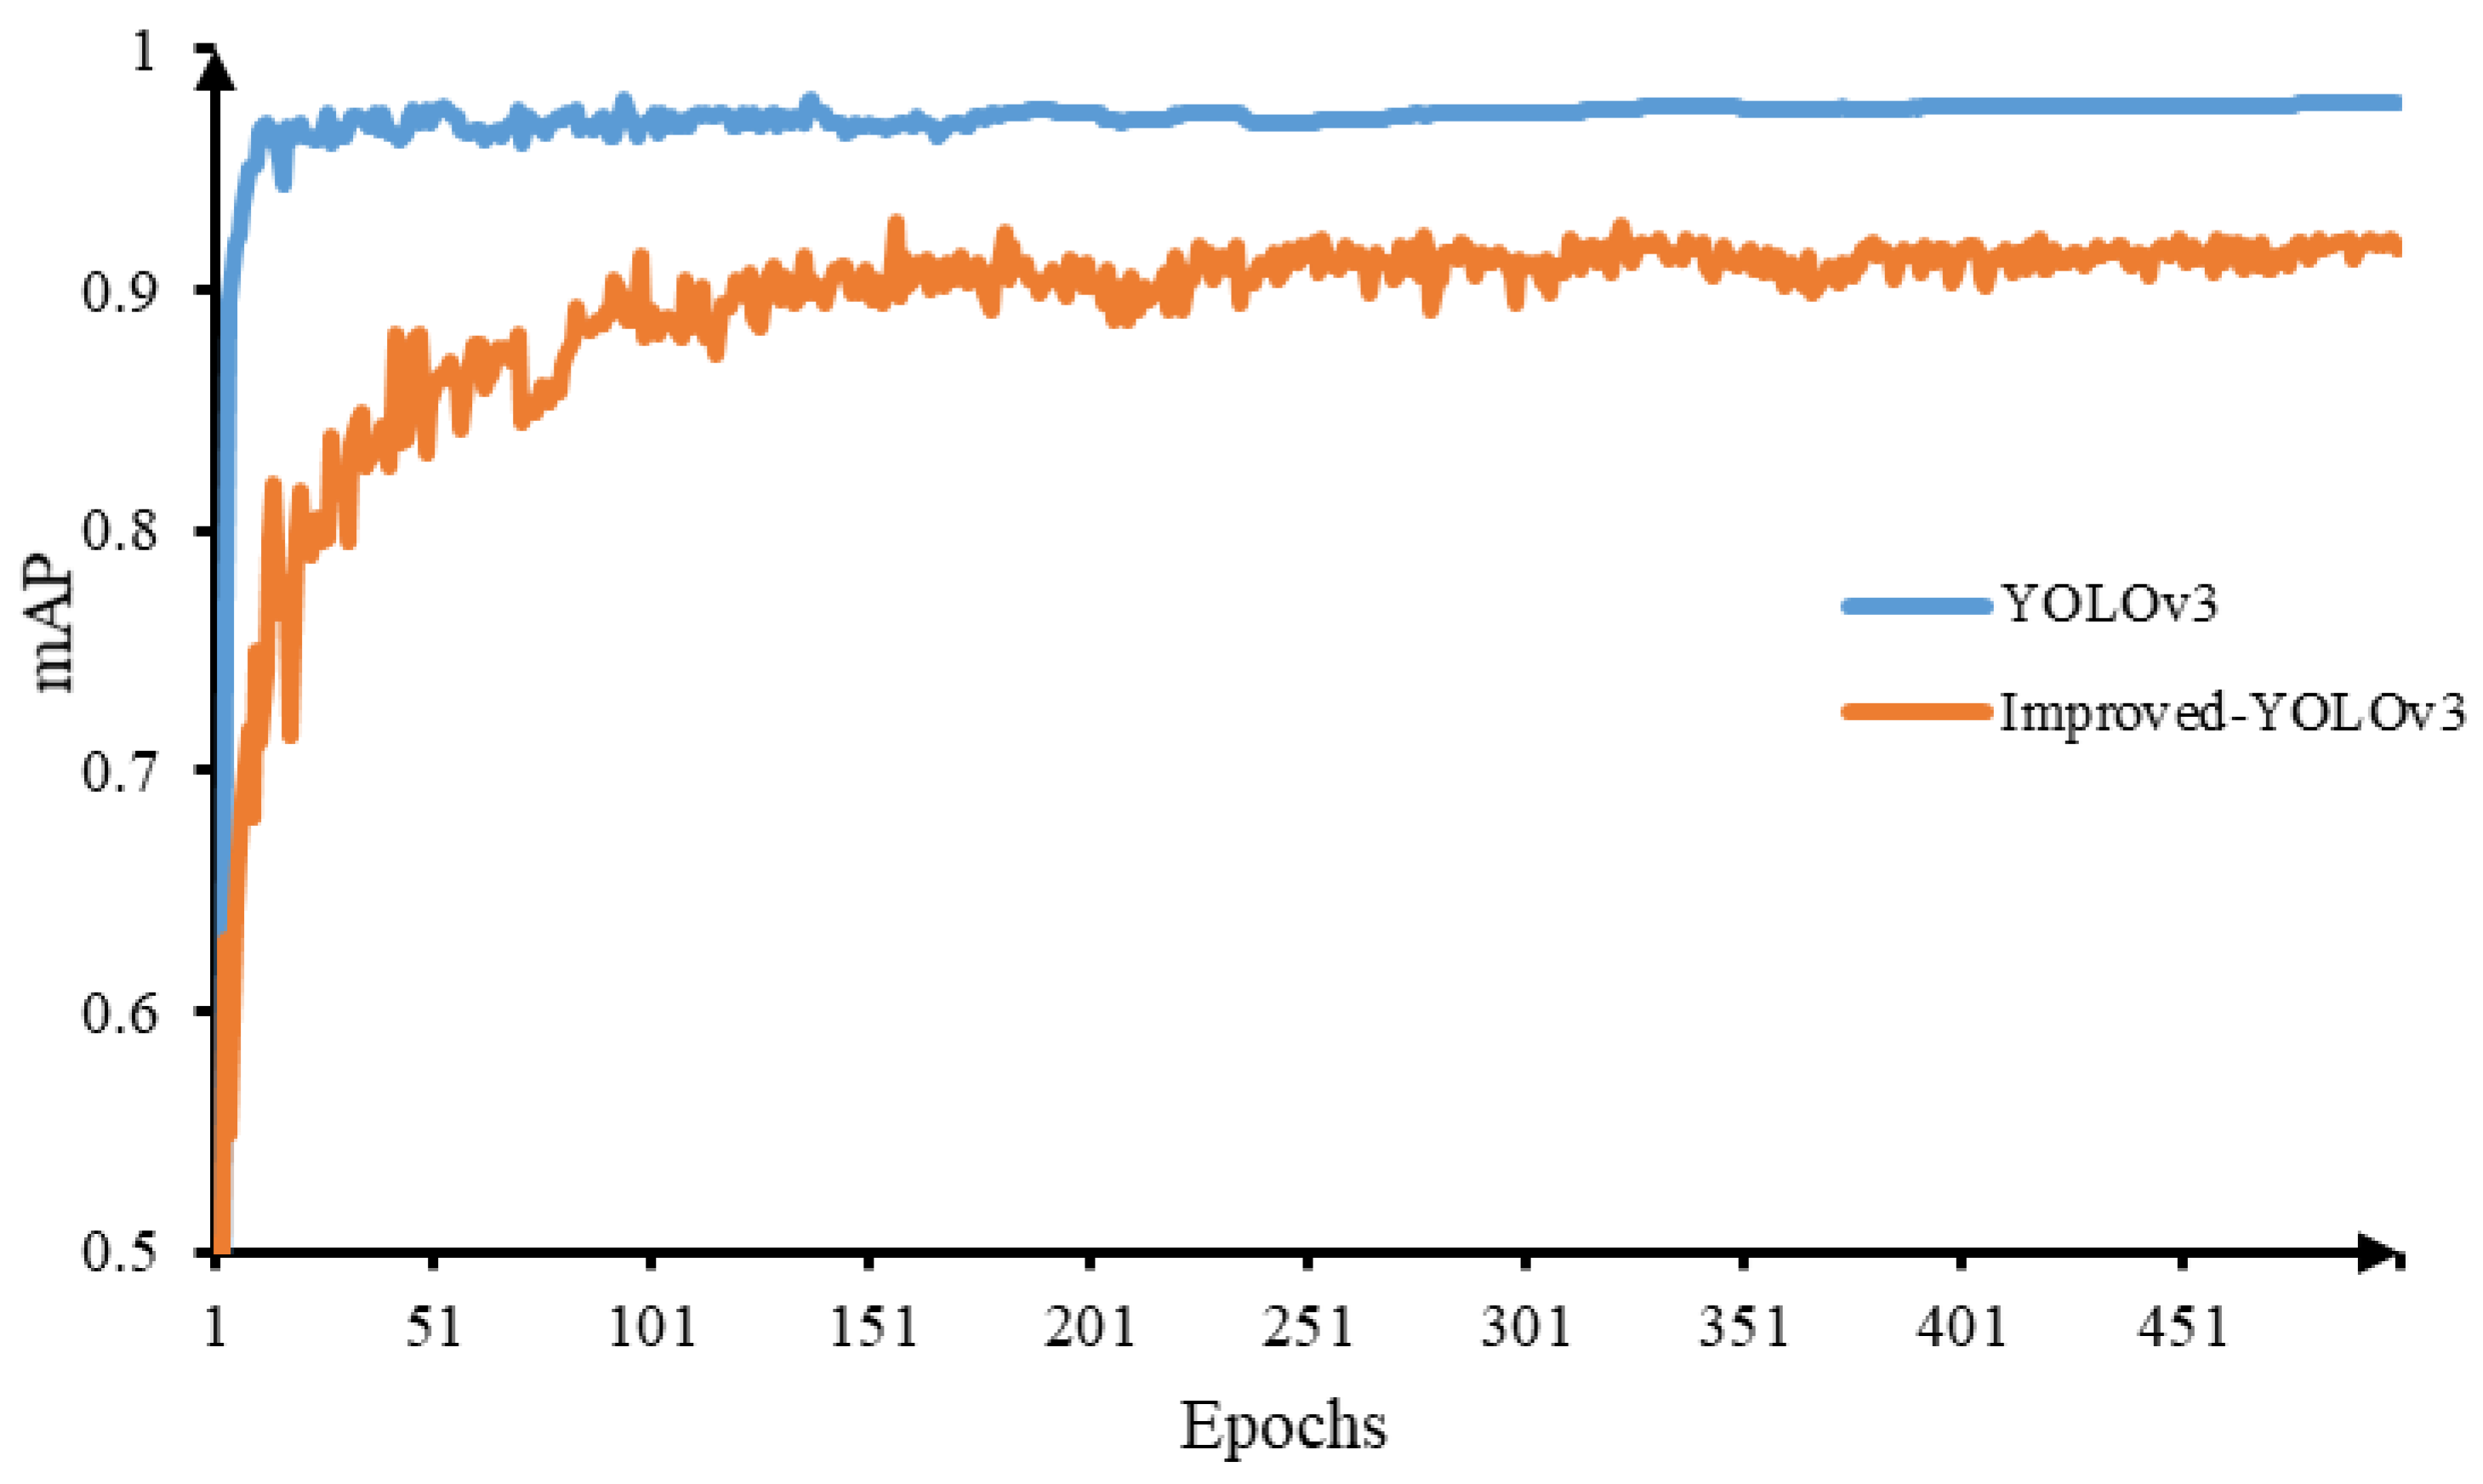
Figure 7 shows the mAP curve of the improved-YOLOv3 and YOLOv3 models; the improved-YOLOv3 model converged at about 25 epochs and had a faster convergence rate than the YOLOv3 model. In addition, the improved-YOLOv3 model achieved a mAP of 98.6%, higher than that of the YOLOv3 model. The faster convergence rate and higher index could be attributed to the improvement of the activation function and loss function, which led to an overall improvement of the model.

3.2.2. Evaluation of the Detection Effect of Broilers at Different Growth Stages

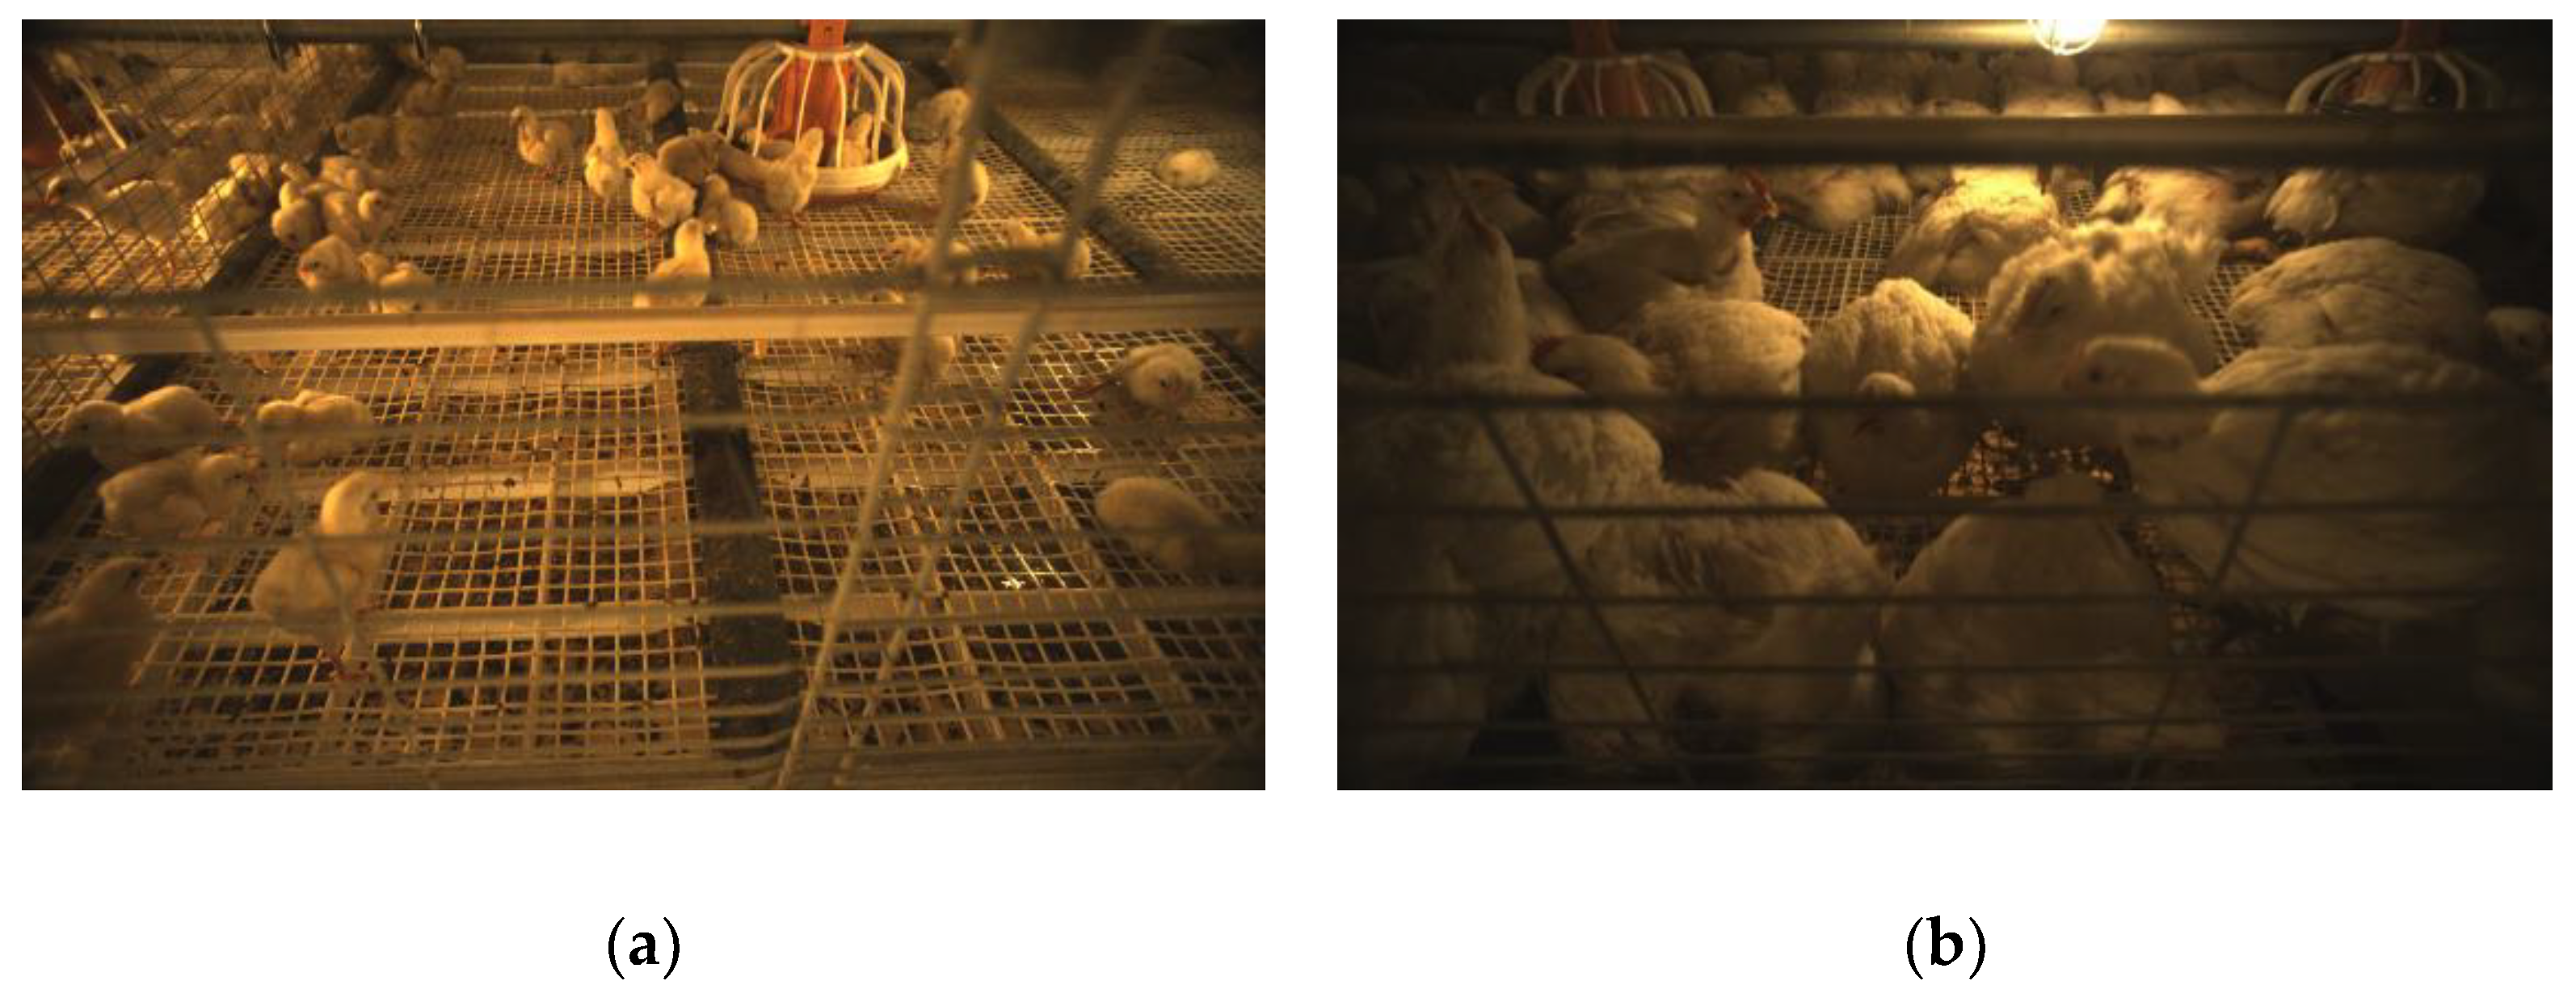
Figure 8 shows the broilers at 6 days old and 36 days old. In the breeding process, the appearance of the broilers changes greatly with the increase in age. In order to test the detection performance of the model on broilers of different ages, a total of 222 images from 6 to 40 days were selected and tested by the developed model. As shown in Table 5, the improved-YOLOv3 model achieved a better detection performance on broilers in different growth stages than YOLOv3, and could correctly identify dead broilers of different ages. With the increase in age, the AP of the improved-YOLOv3 model for dead broilers decreased gradually. This might be explained by two factors. Firstly, in the early inspection work of the autonomous inspection platform, the young broilers would stay away from the platform due to the fear of unfamiliar things, which exposed the dead broilers at the edge of cage. Since there were few broilers in each image, and occlusion between chickens is rare, the model could easily identify the dead broilers in the early stage (Figure 8a). As the experiment processed, the broilers acclimated to the environment and no longer exhibited avoidance behavior. Thus, the background of the dead broiler in an image became more complicated. Secondly, as the space of the broiler cage was limited, the broilers crowded each other, causing some dead broilers to be occluded by others (Figure 8b). It was difficult for the model to identify the full features of broilers, which led to the missing of dead broilers. As for the detection of live broilers, the AP of the improved-YOLOv3 model of live broilers did not change significantly with broiler age. This may be attributed to the number of live broiler samples (40,000) in the dataset which were sufficient to make the model robust to the live broilers

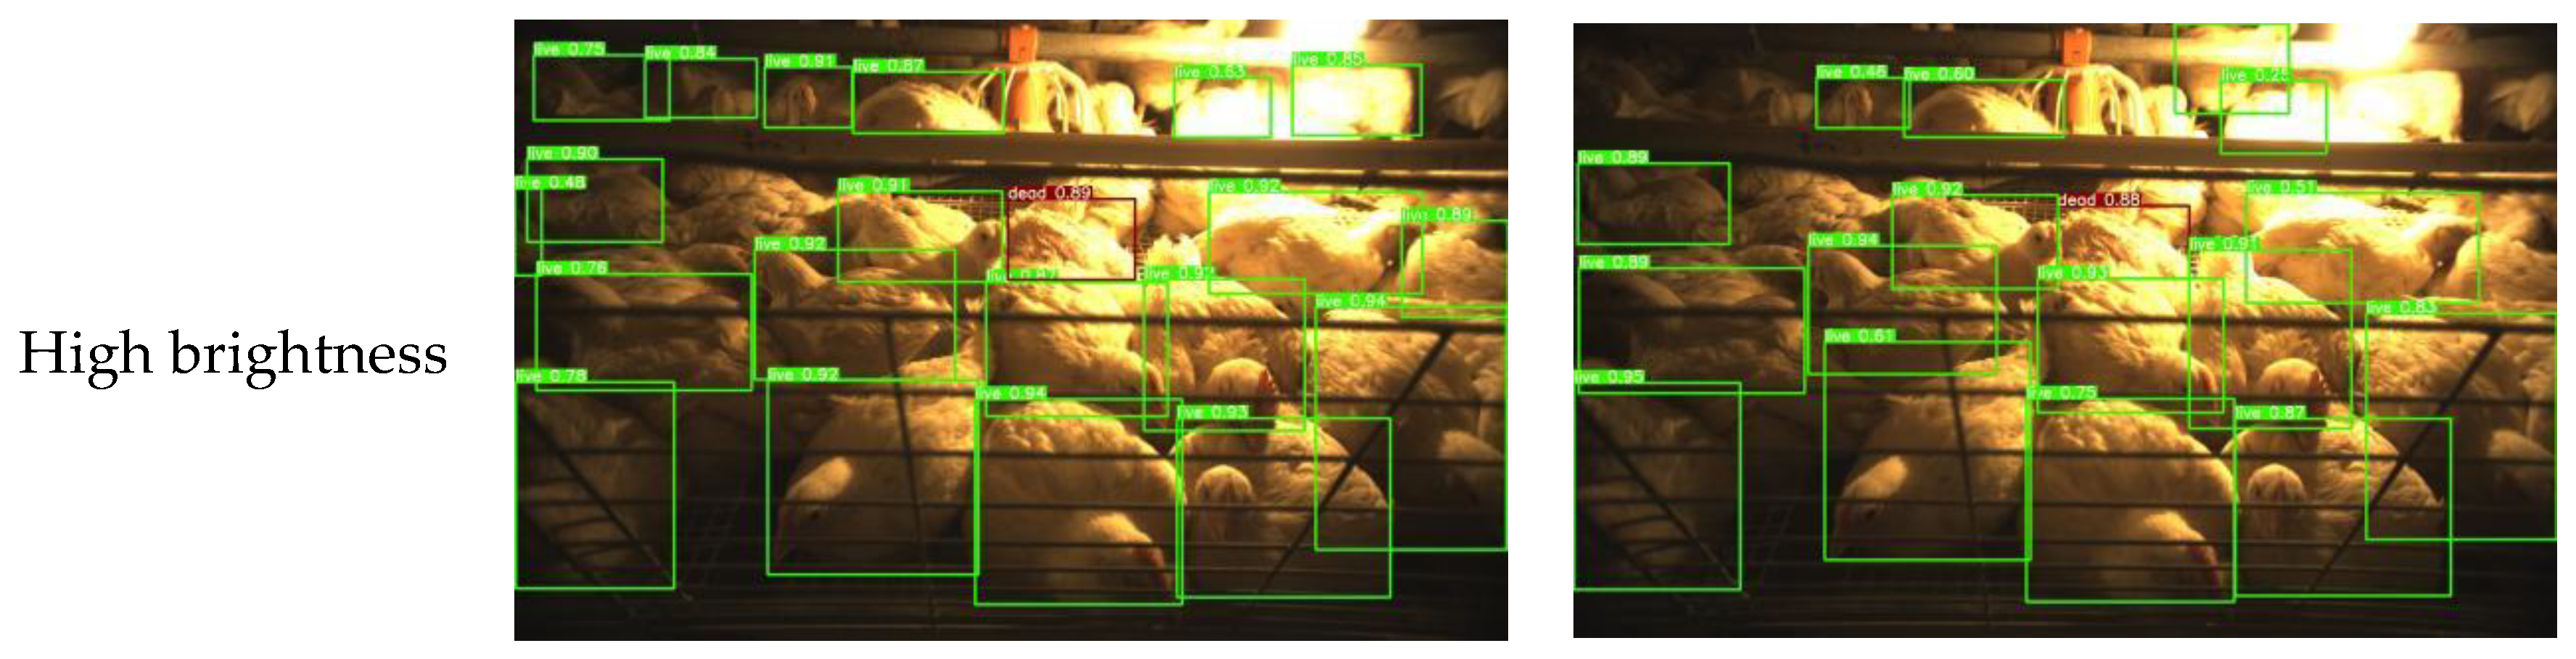
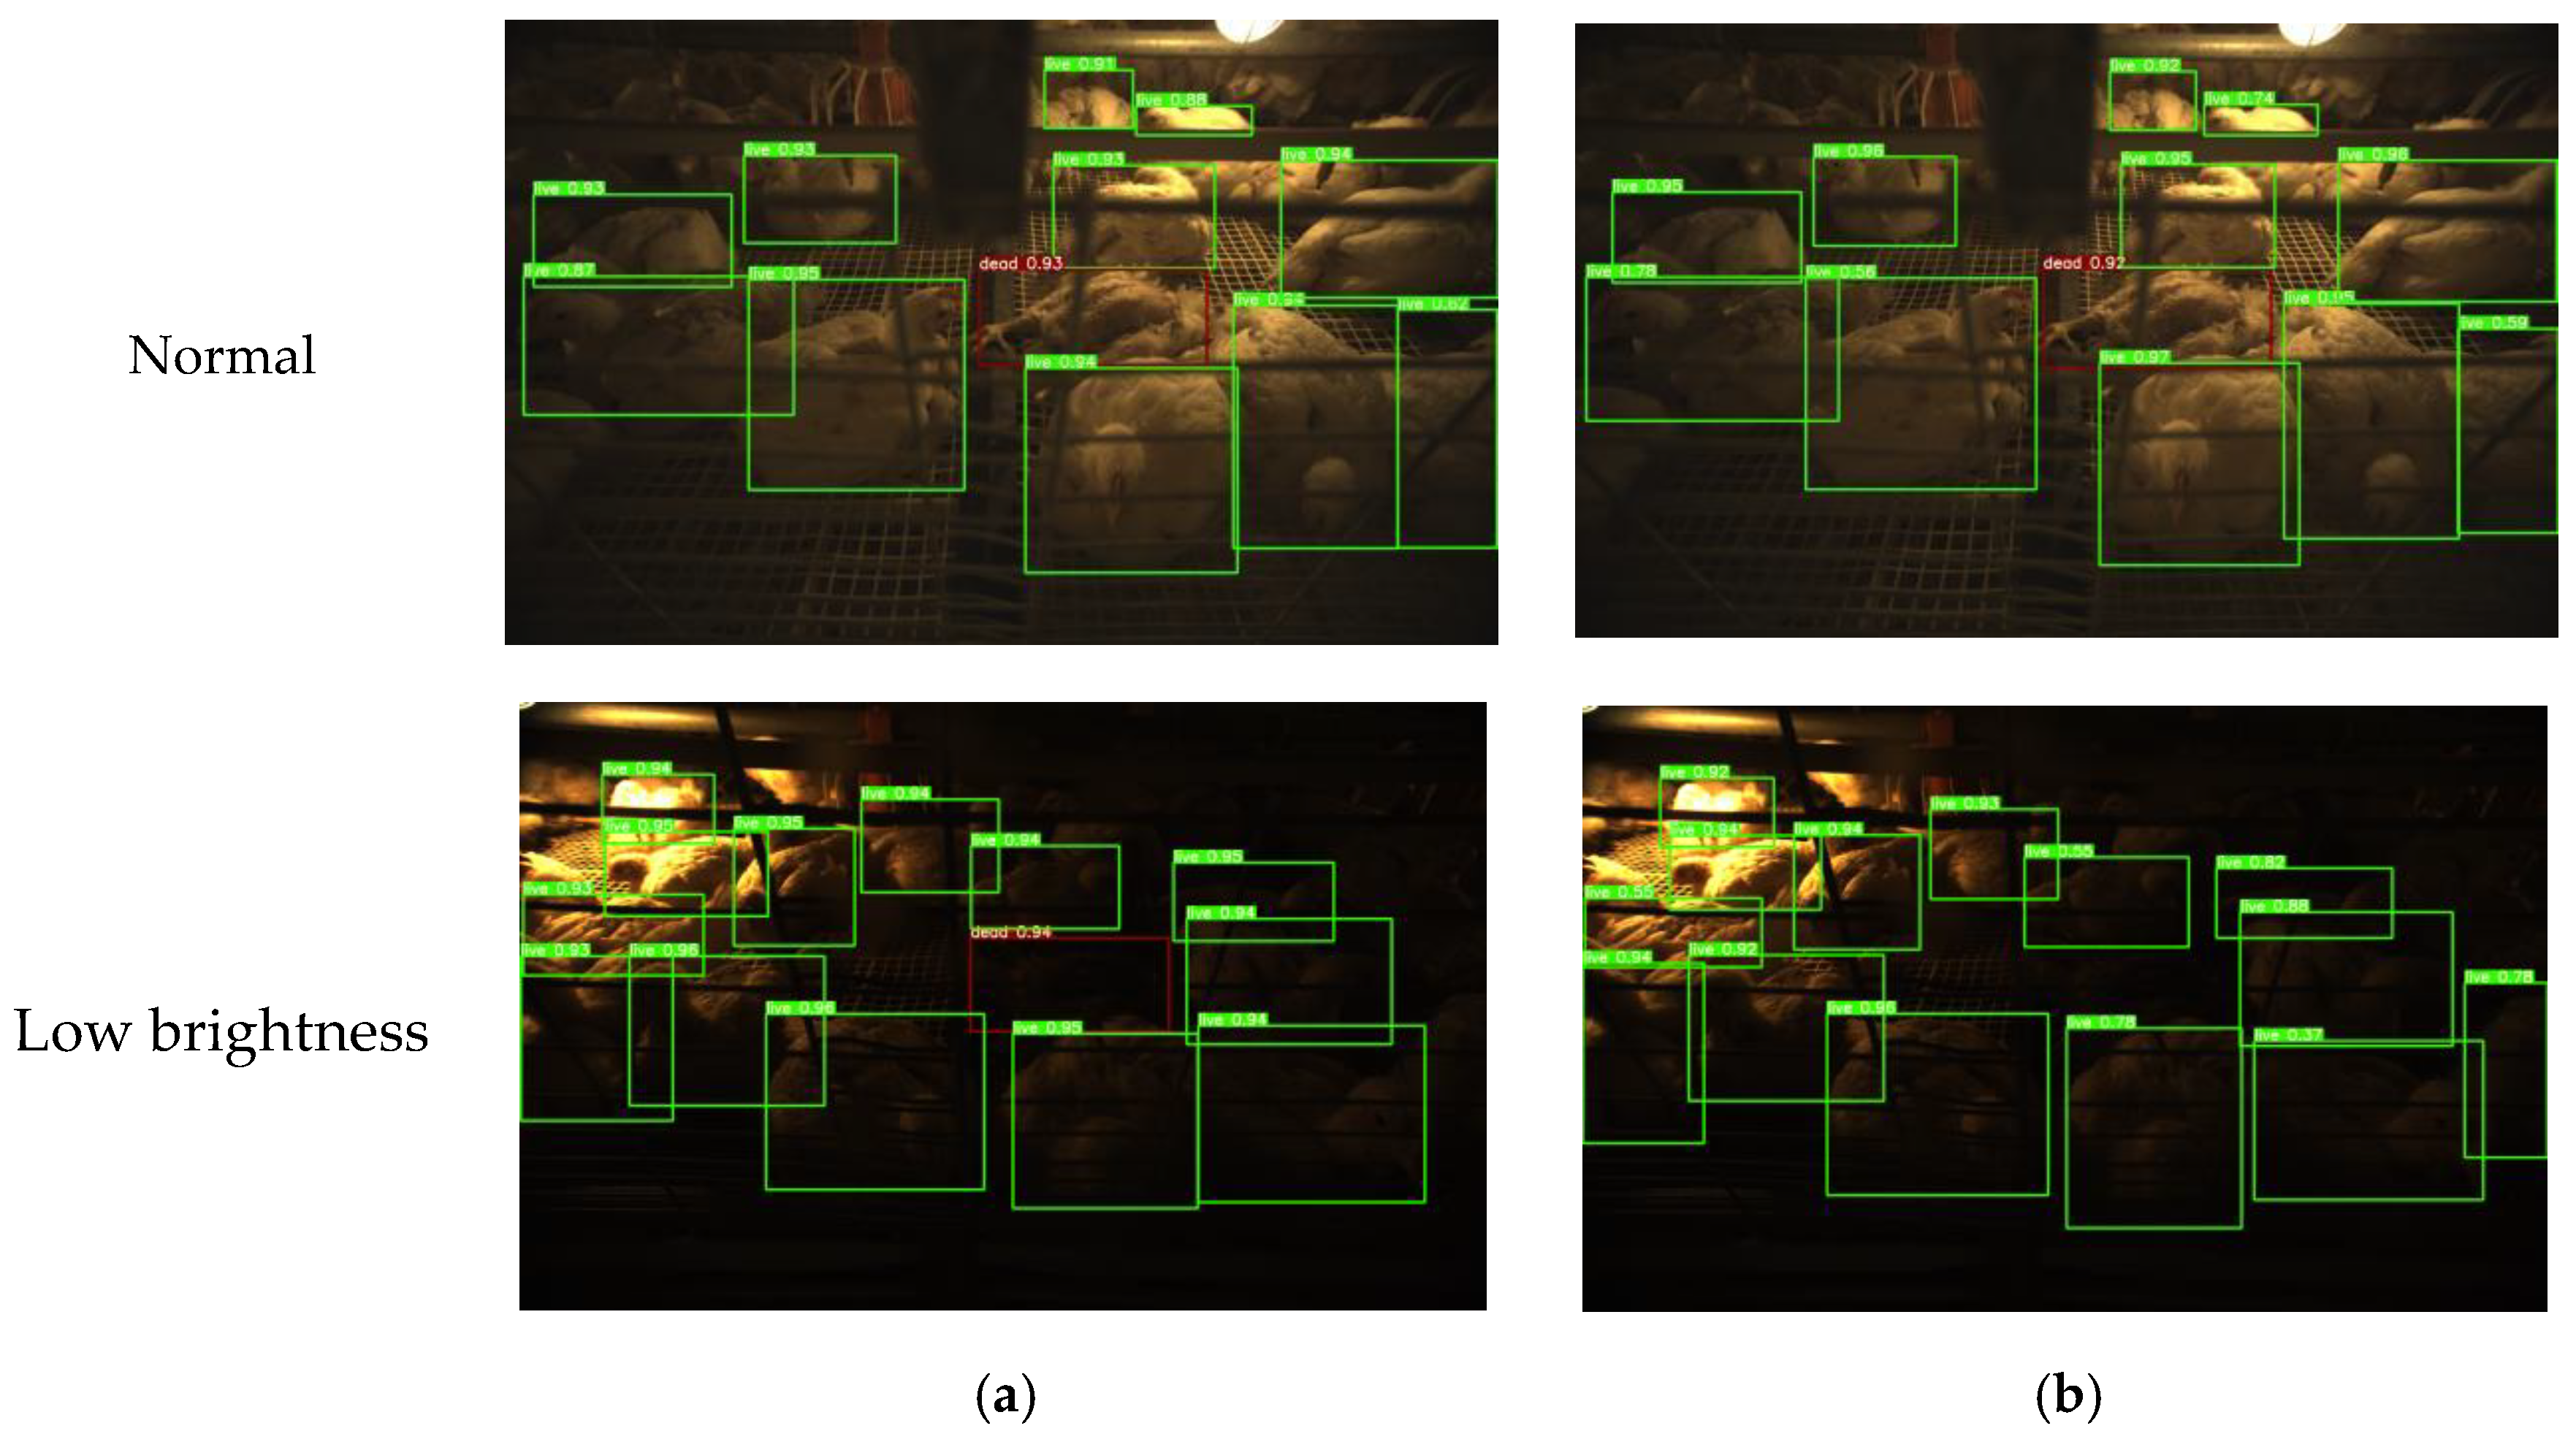
3.2.3. Evaluation of Model Performance under Different Light Conditions

In this study, the stacked-cage broiler house used incandescent lamps to provide light for the broilers. Incandescent lamps were installed in the center of the broiler cage, which made the light intensity high in the center of the cage and low at the edges of the cage. In addition, due to the properties of the incandescent lamps and the pecking behavior of broilers, the brightness of an incandescent lamp decreases over time, which results in variations in light intensity in different cages. Therefore, the brightness of the collected images was also varied, which required the model to have a good adaptability to images with different light intensities. Test images with different brightness were randomly selected in this section. The detection performance of the improved-YOLOv3 model and YOLOv3 model was tested on these images.
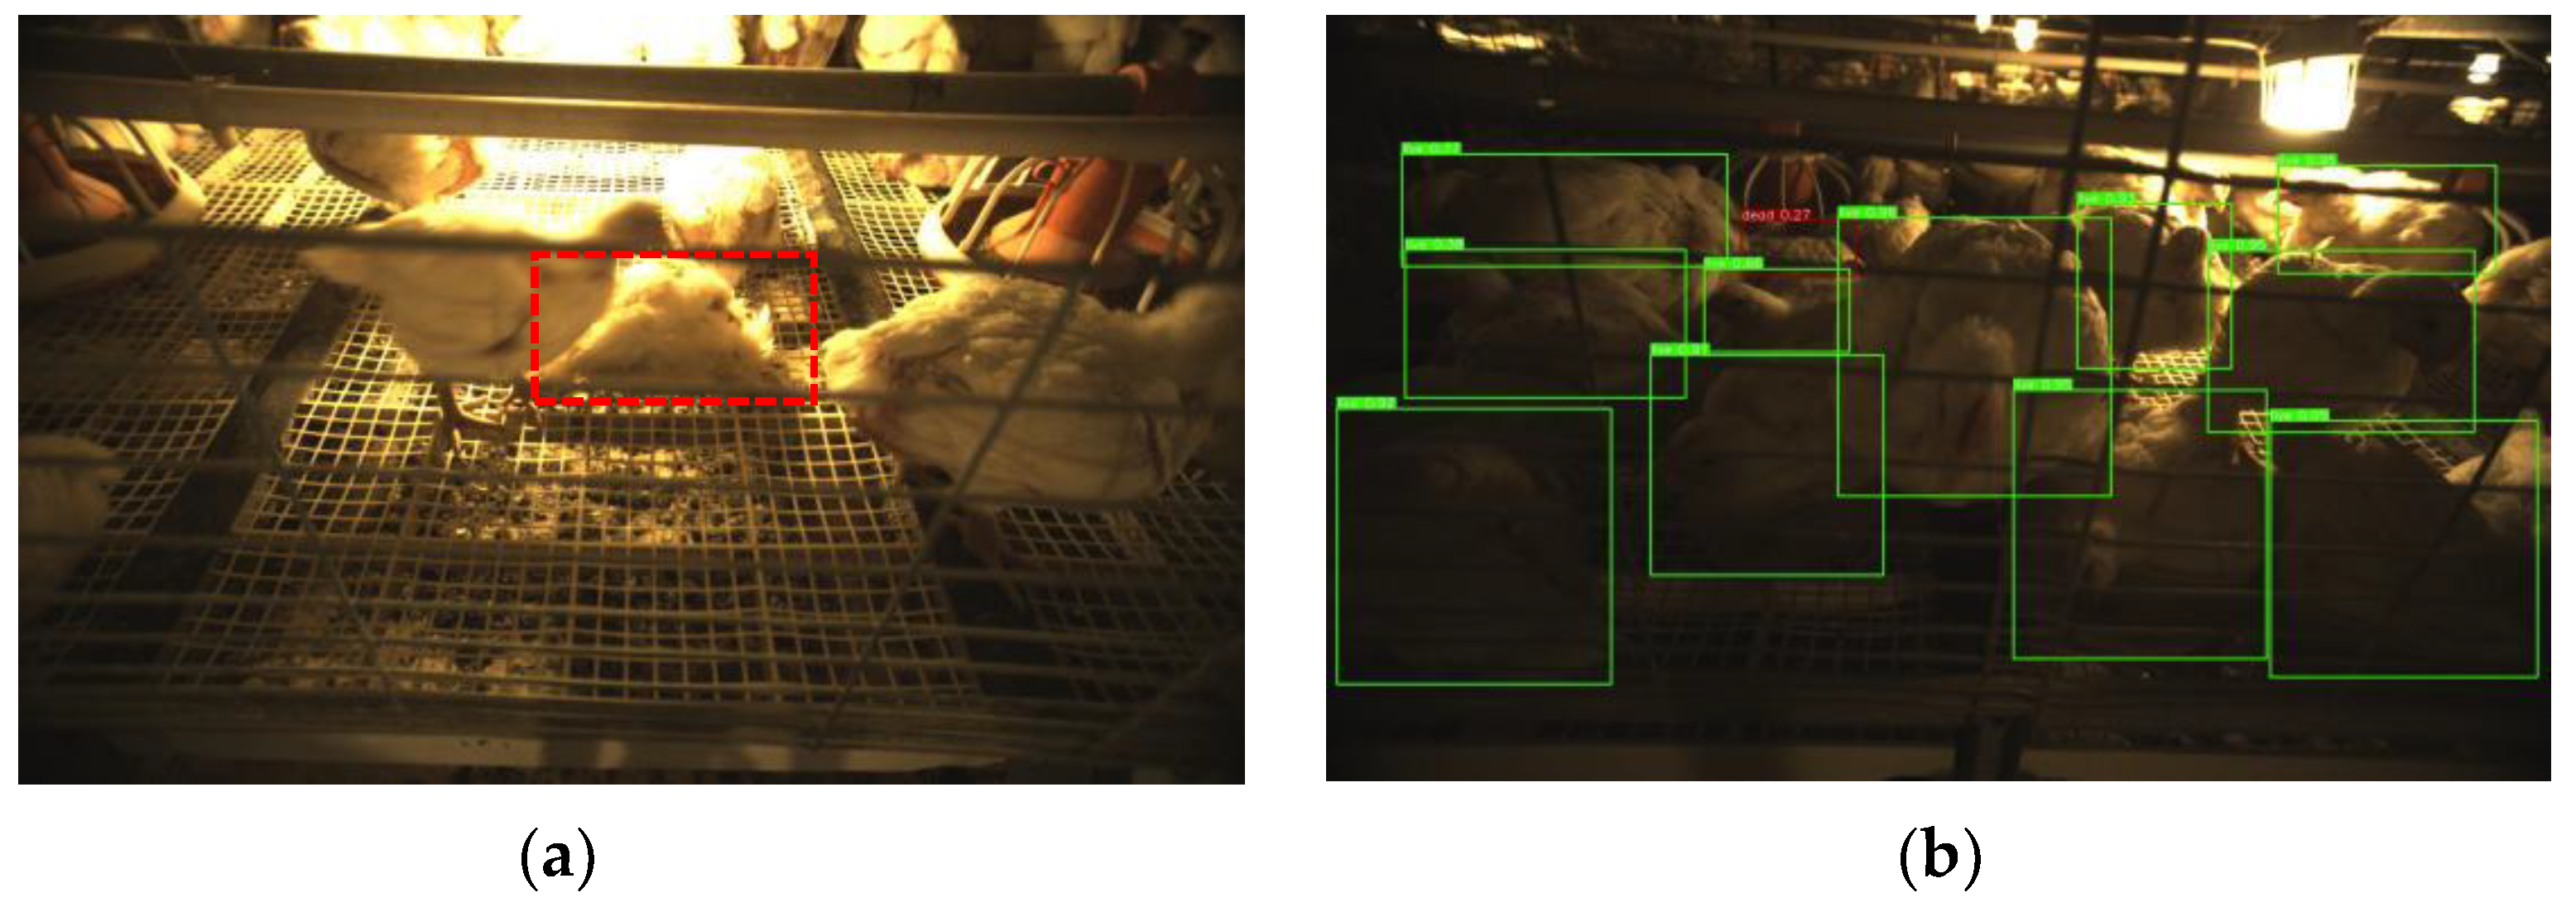
As shown in Figure 9, the dead broilers were located in the center of the image and labeled by the red anchor boxes. Color and shape were the main features that distinguished broilers from the background. Too high or too low of a brightness can change the original features of the image to a certain extent, and affect the detection result. As shown in Figure 8, the improved-YOLOv3 model successfully identified the dead broilers in both high and low brightness images, while the YOLOv3 model missed dead broilers in the low brightness images, which indicated the effectiveness of the improvement. For the high brightness images, the improved-YOLOv3 model identified 19 live broilers, while the YOLOv3 model only identified 15 live broilers, missing the broilers in the upper side. This was likely due to the fact that the broilers in the upper side were relatively small; the SPP module in the improved-YOLOv3 model could reduce the distortion in the up-sampling operation and fuse the features of different size, which improved the detection ability of the model to objects of different sizes. Thus, it could achieve a better performance on the high brightness images. Additionally, the broilers of the improved-YOLOv3 model showed a higher confidence compared with the YOLOv3 model. This may be because the mosaic enhancement enriched the background of the detected object, which means more samples with a high brightness were generated by the dataset. Thus, the improved-YOLOv3 model was robust to different brightness and could identify the dead broiler in a low brightness image.

3.3. Evaluation of the Dead Broiler Detection System

3.3.1. Analysis of the Detection Result of the Dead Broiler Detection System

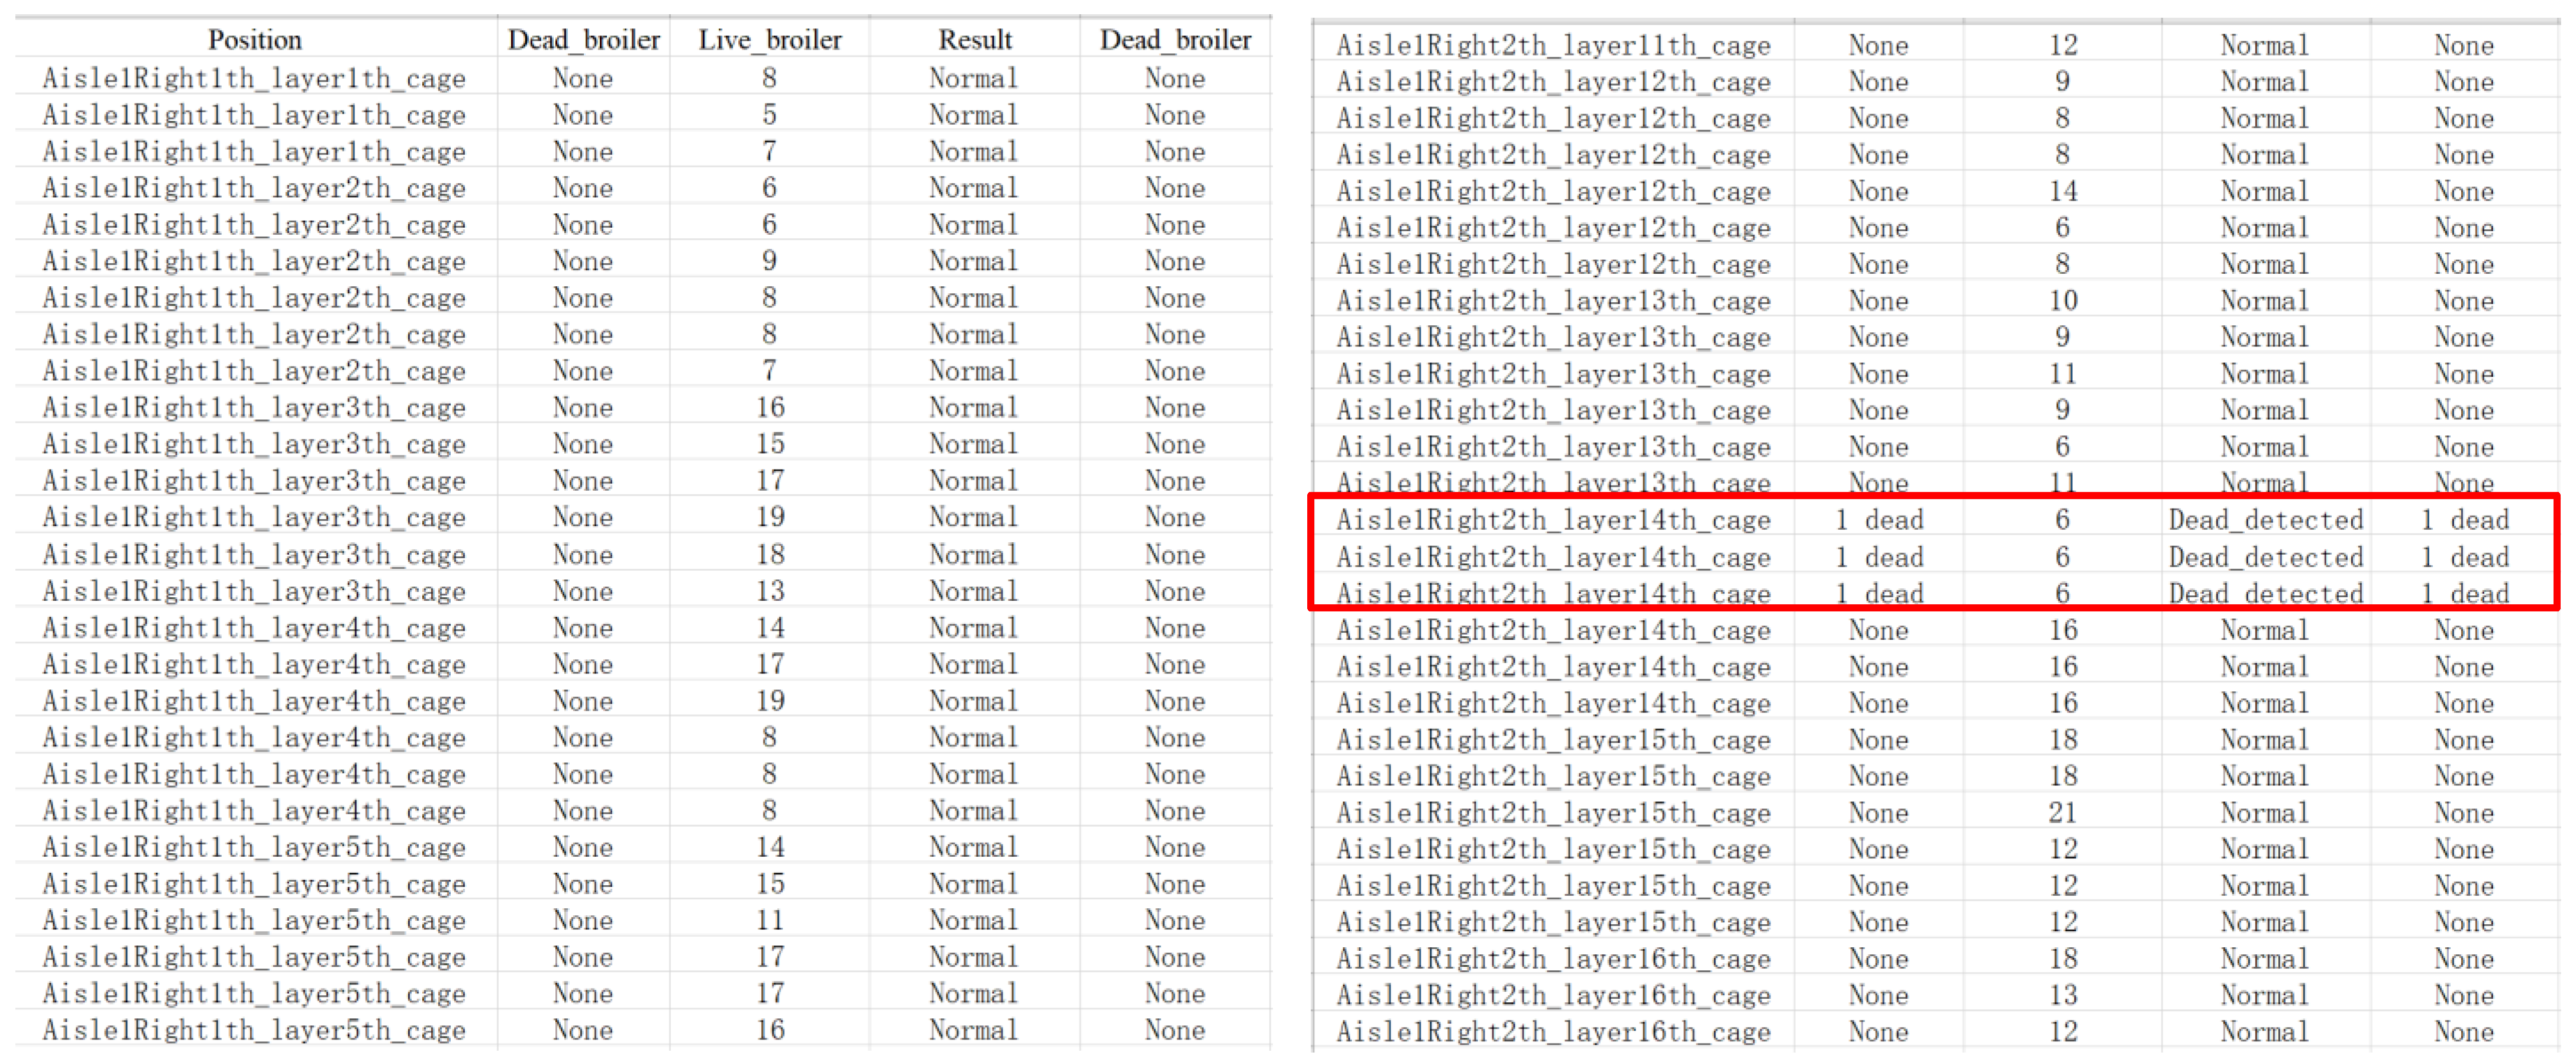
The dead broiler detection model was employed on the sever in the broiler house, and a human–machine interface was developed using pyqt5 and Python language. By using the human–machine interface, the operator can easily process the image with the developed broiler detection model and determine the location of the dead broilers. Figure 10 shows part of the processing result. The detection result of the dead broiler is marked by the red rectangle. The first column shows the position of the dead broiler in the broiler house, the second and third columns show the number of dead and live broilers detected by the model, the fourth column shows if any dead broilers are detected. Breeders only need to look up the results from the fourth column and then find the corresponding location of dead broilers from the first column.
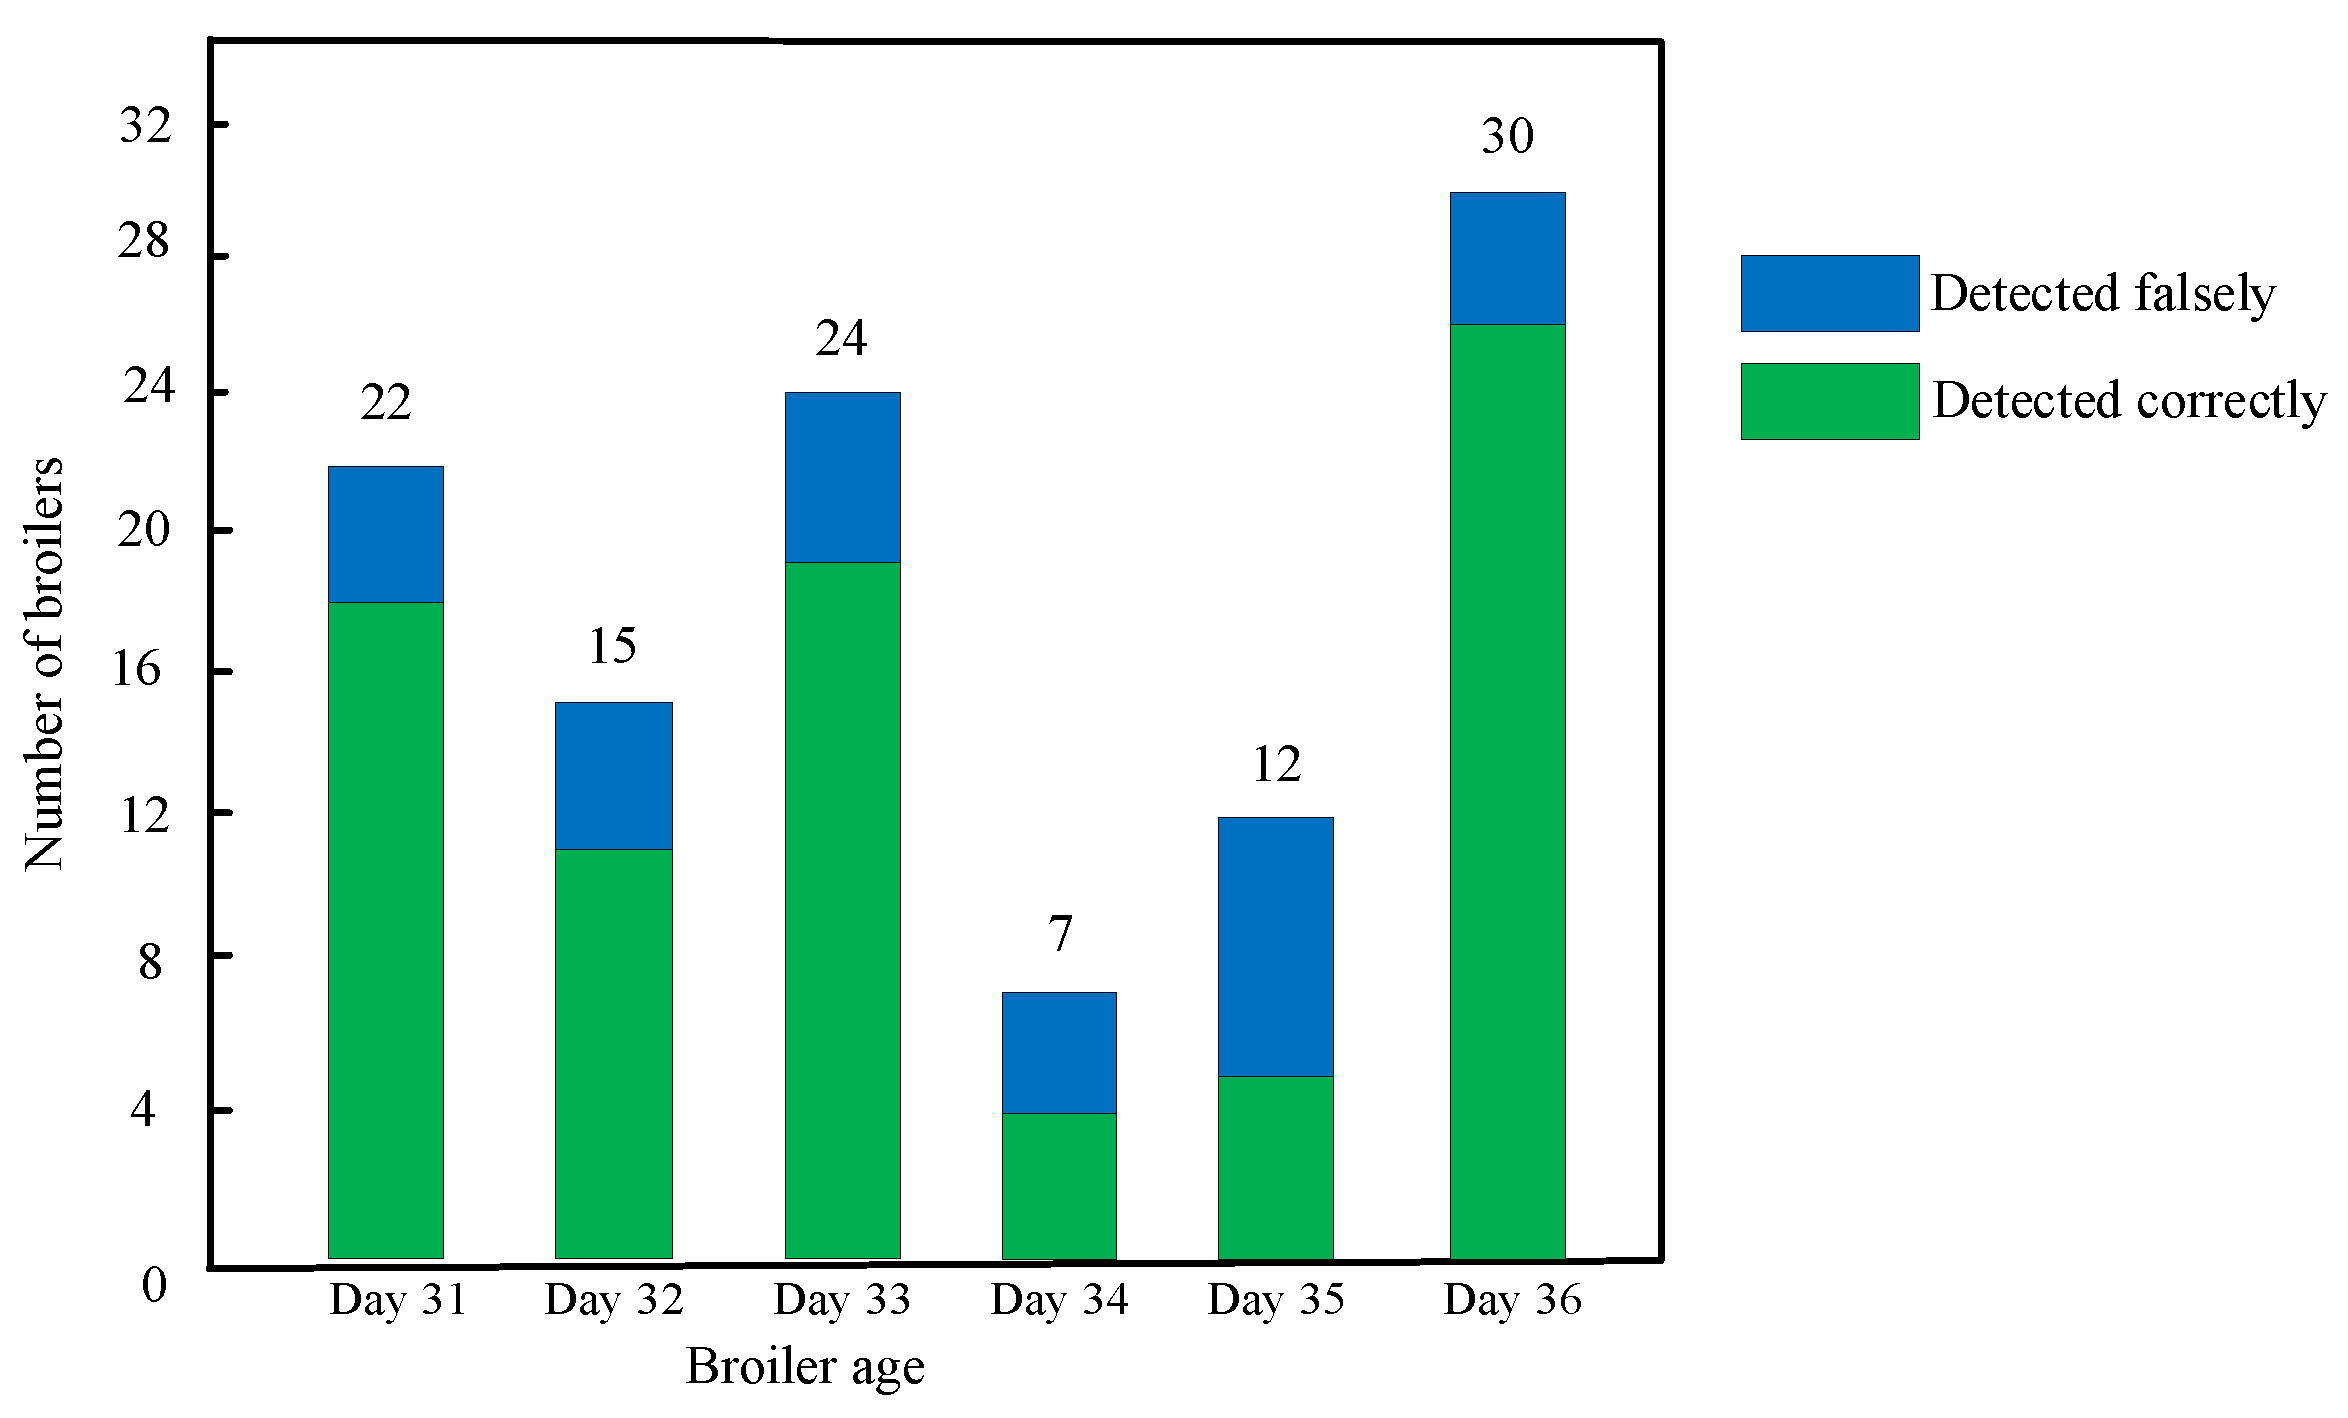
The processing results of dead broilers in days 31–36 are shown in Figure 11. An average of 1664 images were collected and processed each day. Approximately 7–30 dead broilers were identified by the developed model from days 31–36. Among them, 3–7 live broilers were mistakenly identified as dead. Most of the correctly detected dead broilers had prominent features of lying on the grid floor with pink or brownish-black breast exposed, and stiff claws. These dead broilers made up the bulk of the training set. However, there were some dead broiler samples similar to live broilers in the training dataset as shown in Figure 12a; it was even difficult to distinguish them during the manual inspection according to our experience. The developed model learned features of such dead broilers and misidentified broilers with only partially exposed feathered bodies as dead. As shown in Figure 12b, these falsely detected dead broilers received a low confidence score, which indicated that this cohort of falsely detected broilers can be filtered by adjusting the confidence threshold of classification but, at the same time, more dead broilers will be missed. Therefore, in order to further improve the detection performance of the model, the best method was to collect more dead broiler samples similar to Figure 12a to improve the robustness of the model.

3.3.2. Analysis of the Defects of the Dead Broiler Detection System

In this study, the proposed dead broiler inspection system could inspect the broiler flocks and relay the dead broilers’ positions to breeders. Some problems were still found during the experiment. In the late breeding stage, the manure of broilers increases greatly. Despite the manure being cleaned with the manure belt once a day, there was still part of the manure dropped on the aisle due to the design of the manure cleaning belt and the locomotion of broilers. Manure mixed with cooling water, feathers, and dust particles covered the magnetic strip or adhered to the tire, sometimes causing the platform to slip and fail to turn. In this case, we have to remote control the platform to return to the origin and restart it. Furthermore, in the last few days, the magnetic strip had partially fallen off in the cleaning process, which led to false navigation and position errors. Attaining a better fix of the magnetic strip in the aisle of the broiler house was still a problem. Considering the dead broiler detection model, a higher model accuracy is expected, as any false or missed dead broiler in the house may lead to the spread of disease in the broiler flock. It can be also noticed that the image dataset was mainly collected from Ross 308 broilers; thus, the developed model may not be robust to other breeds of broilers.
The ChickenBoy robot developed by the Big Dutchman company is an analysis robot that can support the daily tasks of broiler producers. It moves along fixed rails above the ground and gathers data on climate conditions in the chicken house, distinguishing dead chickens by applying thermographic images [30]. Nevertheless, the ChickenBoy is mainly designed for flat-breeding chicken houses and is not suitable for the stacked-cage culture model for multiple reasons, such as the shielding of cages and multi-layer structures. However, a fixed rail design in their system may be considered to fix the problem mentioned above. Liu et al. [24] designed a dead chicken removal system for the flat-breeding chicken house. The tracked vehicle of the dead chicken removal system reported in their research seems to be maneuverable while waking on the litter, which is worth considering. The dead chicken removal system achieves a walking speed of 3.3 cm/s, and could detect dead chickens in front of the system. In our study, the autonomous inspection platform walks in the aisle at a speed of 20 cm/s, and inspects four layers of broiler cages synchronously. Our system is more efficient, despite the image capture interval during inspection.
Occlusions in the broiler house were the main causes of the false and missed detection of dead broilers in this study. This was mainly due to two reasons, the camera’s position and the breeding density. In most studies, the cameras were set directly above the chickens [7,15,19,31], and the breeding density was relatively low [15,24]. However, as broilers were reared in stacked cages in this study, the cameras were positioned outside the cage and the occlusion of the broilers by the feed and water lines was avoided as much as possible. Thus, the oblique shooting angle resulted in some broilers being obscured by others. In addition, the high density of stacked-cage broilers (70 broilers/cage), and the cluster characteristics of broilers make the occlusion more serious [31]. Bao et al. [23] measured the three-dimensional displacement of the chickens by fastening a foot ring on each chicken to identify dead and sick chickens in the flock. As the maximum displacement and three-dimensional total variance of the dead chickens were almost 0, this method could identify dead chickens in the flock with 100 percent accuracy. However, it did not need to consider the occlusion problem in the flocks and has obvious drawbacks when used in large-scale chicken farms. Binding the foot rings to more than 100,000 broilers is even more laborious than the daily inspection work, and the foot rings may fall off during the breeding process. Therefore, it is more feasible to use camera and image processing technology to identify dead broilers in large farms. To further improve dead broiler detection performance and robustness, it is worth considering the selection of a more optimized model and collect more samples of different breeds of dead broiler samples.

3.4. Future Work

Currently, most of the functionality of the autonomous inspection platform has been implemented, but it still needs further improvement to facilitate use. Future work will focus on solving the problems mentioned above. In addition, images collected by the autonomous inspection platform were transferred to the server manually. Uploading images via wireless internet access or deploying the dead broiler detection model with the OpenVINO inference engine on a computer (Dell OptiPlex 7090MFF) and uploading the detection result to the CloudDB will be further explored to make the platform more automatic and intelligent.

4. Conclusions

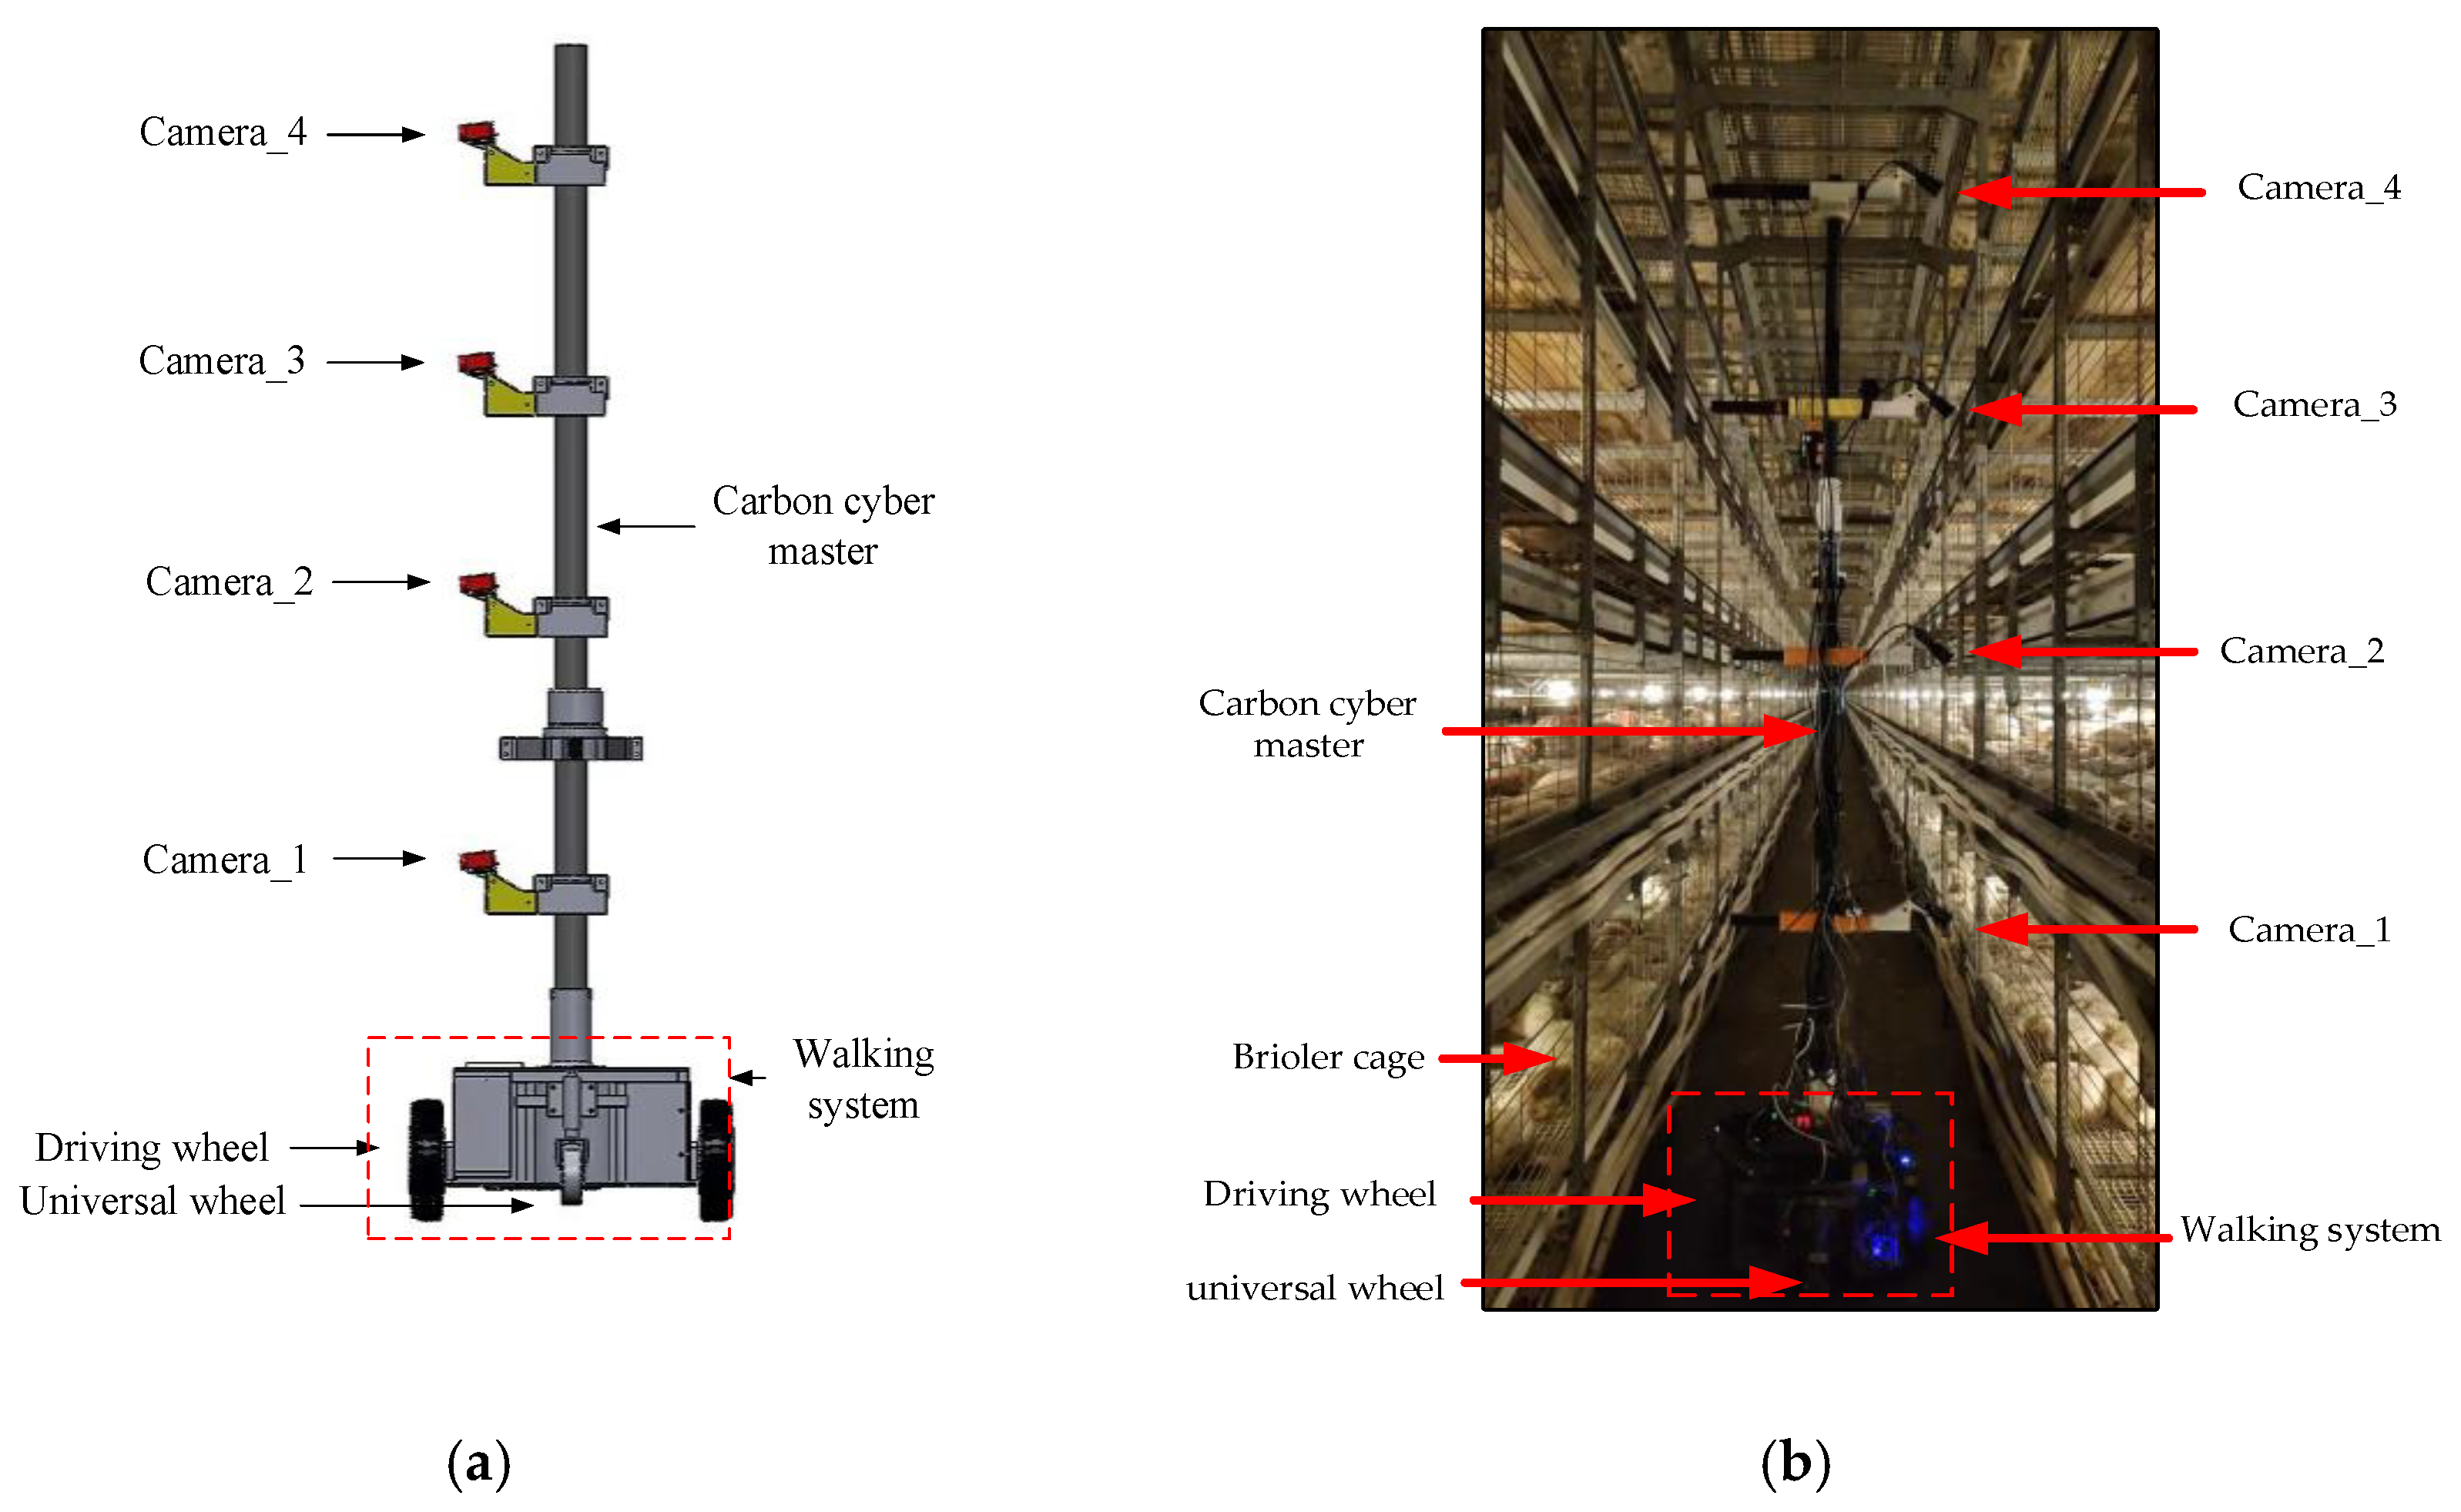
In this study, an autonomous inspection platform was designed to capture images for the stacked-cage broiler house. It had a total length of 53 cm, width of 47 cm, and height of 310 cm, and was designed as a wheeled self-propelled vehicle. A magnetic navigation sensor was fixed on the platform to provide navigation and positioning. Four CCD cameras were mounted on the platform to capture images of four layers of cage broilers simultaneously. The autonomous inspection platform could walk in the broiler house aisle at a speed of 0.2 m/s and stop at each image acquisition waypoint to capture images of the broiler flocks.
A dead broiler detection model was developed with the improved-YOLOv3 network. The improvement of the YOLOv3 network included mosaic enhancement, the Swish function, an SPP module, and CIoU loss. The mAP of the dead broiler detection model was 98.6%, the recall was 96.8%, and the precision was 95.0%. The developed model could process images at a speed of 0.09 s/frame, and identify broilers of different ages. A human–machine interface based on the dead broiler detection model was developed and employed on the sever. Breeders only need to click the buttons successively according to the prompts on the interface, and the position of dead broilers will be displayed on the interface in the form of a table.
By using the autonomous inspection platform to collect images of broilers and processing the images with the dead broiler detection model, breeders could easily obtain the location of the dead broilers in the broiler house. In future work, the detection of dead broilers using thermal infrared images and instance segmentation will be studied. Moreover, we will continue to develop the platform to enable more functionality, such as the automatic monitoring of broilers’ welfare, monitoring of the harmful gases, etc.

Author Contributions

Conceptualization, software, validation, formal analysis, investigation, data curation, writing—original draft preparation, review, and editing, visualization, H.H. and L.W.; methodology, E.D., P.F. and Z.Y.; resource supervision, project administration, funding acquisition, H.W. All authors have read and agreed to the published version of the manuscript.

Funding

This work was funded by the Ministry of Science and Technology, China under grant number: 2017YFE0122200.

Institutional Review Board Statement

The procedures for the use of animals were approved by the ethics committee of the China Agricultural University Laboratory Animal Welfare and Ethical Committee, and all applicable institutional and governmental regulations concerning the ethical use of animals were followed (grant number AW09211202-5-1).

Informed Consent Statement

Not applicable.

Data Availability Statement

Not applicable.

Acknowledgments

The authors thank Xianqiu Sun for providing the experimental site and material.

Conflicts of Interest

The authors declare no conflict of interest.

References

  1. Sciforce Smart Farming: The Future of Agriculture. IoT for All 2020. Available online: https://www.iotforall.com/smart-farming-future-of-agriculture (accessed on 19 July 2022).
  2. Baoming, L.; Yang, W.; Weichao, Z.; Qin, T. Research Progress in Environmental Control Key Technologies, Facilities and Equipment for Laying Hen Production in China. Trans. Chin. Soc. Agric. Eng. 2020, 36, 212–221. [Google Scholar]
  3. Cuan, K.; Zhang, T.; Huang, J.; Fang, C.; Guan, Y. Detection of Avian Influenza-Infected Chickens Based on a Chicken Sound Convolutional Neural Network. Comput. Electron. Agric. 2020, 178, 105688. [Google Scholar] [CrossRef]
  4. Olejnik, K.; Popiela, E.; Opaliński, S. Emerging Precision Management Methods in Poultry Sector. Agriculture 2022, 12, 718. [Google Scholar] [CrossRef]
  5. Fang, P.; Hao, H.; Li, T.; Wang, H. Instance Segmentation of Broiler Image Based on Attention Mechanism and Deformable Convolution. Trans. Chin. Soc. Agric. Mach. 2021, 52, 257–265. [Google Scholar] [CrossRef]
  6. Louton, H.; Bergmann, S.; Piller, A.; Erhard, M.; Stracke, J.; Spindler, B.; Schmidt, P.; Schulte-Landwehr, J.; Schwarzer, A. Automatic Scoring System for Monitoring Foot Pad Dermatitis in Broilers. Agriculture 2022, 12, 221. [Google Scholar] [CrossRef]
  7. Wang, J.; Wang, N.; Li, L.; Ren, Z. Real-Time Behavior Detection and Judgment of Egg Breeders Based on YOLO V3. Neural Comput. Appl. 2020, 32, 5471–5481. [Google Scholar] [CrossRef]
  8. Fang, C.; Huang, J.; Cuan, K.; Zhuang, X.; Zhang, T. Comparative Study on Poultry Target Tracking Algorithms Based on a Deep Regression Network. Biosyst. Eng. 2020, 190, 176–183. [Google Scholar] [CrossRef]
  9. Li, G.; Zhao, Y.; Purswell, J.L.; Du, Q.; Chesser, G.D.; Lowe, J.W. Analysis of Feeding and Drinking Behaviors of Group-Reared Broilers via Image Processing. Comput. Electron. Agric. 2020, 175, 105596. [Google Scholar] [CrossRef]
  10. Aydin, A. Development of an Early Detection System for Lameness of Broilers Using Computer Vision. Comput. Electron. Agric. 2017, 136, 140–146. [Google Scholar] [CrossRef]
  11. Aydin, A. Using 3D Vision Camera System to Automatically Assess the Level of Inactivity in Broiler Chickens. Comput. Electron. Agric. 2017, 135, 4–10. [Google Scholar] [CrossRef]
  12. de Alencar Nääs, I.; da Silva Lima, N.D.; Gonçalves, R.F.; Antonio de Lima, L.; Ungaro, H.; Minoro Abe, J. Lameness Prediction in Broiler Chicken Using a Machine Learning Technique. Inf. Process. Agric. 2021, 8, 409–418. [Google Scholar] [CrossRef]
  13. Shen, M.; Li, J.; Lu, M.; Liu, L.; Sun, Y.; Li, B. Evaluation Method of Limping Status of Broilers Based on Dynamic Multi-Feature Variables. Trans. Chin. Soc. Agric. Mach. 2018, 49, 35–44. [Google Scholar] [CrossRef]
  14. Okinda, C.; Lu, M.; Liu, L.; Nyalala, I.; Muneri, C.; Wang, J.; Zhang, H.; Shen, M. A Machine Vision System for Early Detection and Prediction of Sick Birds: A Broiler Chicken Model. Biosyst. Eng. 2019, 188, 229–242. [Google Scholar] [CrossRef]
  15. Zhuang, X.; Zhang, T. Detection of Sick Broilers by Digital Image Processing and Deep Learning. Biosyst. Eng. 2019, 179, 106–116. [Google Scholar] [CrossRef]
  16. Zhuang, X.; Bi, M.; Guo, J.; Wu, S.; Zhang, T. Development of an Early Warning Algorithm to Detect Sick Broilers. Comput. Electron. Agric. 2018, 144, 102–113. [Google Scholar] [CrossRef]
  17. Aydin, A.; Cangar, O.; Ozcan, S.E.; Bahr, C.; Berckmans, D. Application of a Fully Automatic Analysis Tool to Assess the Activity of Broiler Chickens with Different Gait Scores. Comput. Electron. Agric. 2010, 73, 194–199. [Google Scholar] [CrossRef]
  18. Kristensen, H.H.; Cornou, C. Automatic Detection of Deviations in Activity Levels in Groups of Broiler Chickens—A Pilot Study. Biosyst. Eng. 2011, 109, 369–376. [Google Scholar] [CrossRef]
  19. Dawkins, M.S.; Cain, R.; Merelie, K.; Roberts, S.J. In Search of the Behavioural Correlates of Optical Flow Patterns in the Automated Assessment of Broiler Chicken Welfare. Appl. Anim. Behav. Sci. 2013, 145, 44–50. [Google Scholar] [CrossRef]
  20. Peña Fernández, A.; Norton, T.; Tullo, E.; van Hertem, T.; Youssef, A.; Exadaktylos, V.; Vranken, E.; Guarino, M.; Berckmans, D. Real-Time Monitoring of Broiler Flock’s Welfare Status Using Camera-Based Technology. Biosyst. Eng. 2018, 173, 103–114. [Google Scholar] [CrossRef]
  21. Zhu, W.; Peng, Y.; Ji, B. An Automatic Dead Chicken Detection Algorithm Based on SVM in Modern Chicken Farm. In Proceedings of the International Symposium on Information Science and Engineering, Nanjing, China, 26–28 December 2009; pp. 323–326. [Google Scholar] [CrossRef]
  22. Li, P. Study on Caged Layer Health Behavior Monitoring Robot System. Ph.D. Thesis, China Agriculture University, Beijing, China, 2016. [Google Scholar]
  23. Bao, Y.; Lu, H.; Zhao, Q.; Yang, Z.; Xu, W.; Bao, Y.; Lu, H.; Zhao, Q.; Yang, Z.; Xu, W. Detection System of Dead and Sick Chickens in Large Scale Farms Based on Artificial Intelligence. MBE 2021, 18, 6117–6135. [Google Scholar] [CrossRef]
  24. Liu, H.-W.; Chen, C.-H.; Tsai, Y.-C.; Hsieh, K.-W.; Lin, H.-T. Identifying Images of Dead Chickens with a Chicken Removal System Integrated with a Deep Learning Algorithm. Sensors 2021, 21, 3579. [Google Scholar] [CrossRef] [PubMed]
  25. Redmon, J.; Farhadi, A. YOLOv3: An Incremental Improvement. arXiv 2018, arXiv:1804.02767. [Google Scholar] [CrossRef]
  26. Ramachandran, P.; Zoph, B.; Le, Q.V. Searching for Activation Functions. arXiv 2017, arXiv:1710.05941. [Google Scholar] [CrossRef]
  27. He, K.; Zhang, X.; Ren, S.; Sun, J. Spatial Pyramid Pooling in Deep Convolutional Networks for Visual Recognition. IEEE Trans. Pattern Anal. Mach. Intell. 2015, 37, 1904–1916. [Google Scholar] [CrossRef] [Green Version]
  28. Zheng, Z.; Wang, P.; Liu, W.; Li, J.; Ye, R.; Ren, D. Distance-IoU Loss: Faster and Better Learning for Bounding Box Regression. arXiv 2019, arXiv:1911.08287. [Google Scholar] [CrossRef]
  29. Wang, J.; Shen, M.; Liu, L.; Xu, Y.; Okinda, C. Recognition and Classification of Broiler Droppings Based on Deep Convolutional Neural Network. J. Sens. 2019, 2019, e3823515. [Google Scholar] [CrossRef] [Green Version]
  30. Epp, M. Poultry Technology—Rise of the Robots. Can. Poult. 2019. Available online: https://www.canadianpoultrymag.com/.rise-of-the-robots-30876/ (accessed on 15 July 2022).
  31. Del Valle, J.E.; Pereira, D.F.; Mollo Neto, M.; Gabriel Filho, L.R.A.; Salgado, D.D. Unrest Index for Estimating Thermal Comfort of Poultry Birds (Gallus Gallus Domesticus) Using Computer Vision Techniques. Biosyst. Eng. 2021, 206, 123–134. [Google Scholar] [CrossRef]
Figure 1. The autonomous inspection platform. (a) Schematic. (b) Experimental setup.
Agriculture 12 01176 g001
Figure 2. Computation graph of the ROS.
Agriculture 12 01176 g002
Figure 3. Working flowchart of the autonomous inspection platform.
Agriculture 12 01176 g003
Figure 4. YOLOv3 structure.
Agriculture 12 01176 g004
Figure 5. Activation function. (a) LReLU function. (b) Swish function.
Agriculture 12 01176 g005
Figure 6. Image acquisition waypoint in an aisle.
Agriculture 12 01176 g006
Figure 7. Training mAP of the improved-YOLOv3 and YOLOv3 models.
Agriculture 12 01176 g007
Figure 8. Broiler flocks in 6 days old (a) and 36 days old (b).
Agriculture 12 01176 g008
Figure 9. Test on images with different brightness. (a) Improved-YOLOv3. (b) YOLOv3 model.
Agriculture 12 01176 g009aAgriculture 12 01176 g009b
Figure 10. Part of the processing results of the human–machine interface.
Agriculture 12 01176 g010
Figure 11. Detection results of dead broilers in days 31–36.
Agriculture 12 01176 g011
Figure 12. False detection sample of the improved-YOLOv3 model. (a) Difficult dead broiler sample. The dead broiler was marked with a red rectangular box. (b) False detection image.
Agriculture 12 01176 g012
Table 1. Parameters of the camera and lens.
CameraSony XCG-CG240C
Imaging sensor1/1.2-type Global Shutter CMOS
Camera resolutionGigE Vision® Version 1.2/2.0
Output pixels (H × V)1920 × 1200
LensRicoh FL-CC0614A-2M
Focus length6.0 mm
ApertureF1.4–F16.0
Horizontal angle of view71.2°
Table 2. Interpretation of nodes and topics.
Node NameDescriptionTopic NameDescription
Velocity_smootherSmooth and limit the velocitySmoother_cmd_velSmoothed output velocity data
Camera_capture_nodeImage acquisitionCam_captureImage acquisition command
Vehicle_control_nodeBehavior of the vehicleTape_infoWaypoint data
Meg_sensoringMagnetic navigationMeg_stripMagnetic sensor data
Wheeltec_robotBehavior of the motorsOdomOdometer data
Robot_nodeBehavior of the platformCmd_velVelocity data
Table 3. Deviations of the platform.
OffsetFront and Rear/cmLeft and Right/cm
6012018024060120180240
1+0.8+3.1+2.6+1.5−1.3+1.8+1.6+0.9
2+2.5+1.1+1.7+0.6+2.1−1.3+1.2+0.7
3+0.6+0.9+2.2+2.3−1.5+0.6−1.8+1.3
4+1.3+2.3+0.7+3.7+1.7+2.1+0.6−1.1
5+0.7+3.4+3.1+0.9+1.6−1.8−0.3−0.3
6+5.1+3.6+4.2+1.4−1.8+1.6+0.5+1.2
7+3.2+1.5+1.6+2.3+1.6−1.3+1.1−0.5
8+3.5+2.8+3.7+0.8+1.1+2.2−1.2+0.7
9+1.4+0.7+2.5+1.6+1.3−0.5−1.5+1.9
10+0.9+1.3+0.8+2.1−0.6+1.5+0.7+2.3
Table 4. Comparison of the detection models.
ModelClassPrecisionRecallAPmAP
YOLOv3Dead79.4%93.5%92.7%91.5%
Live76.6%93.4%90.3%
Improved-YOLOv3Dead97.0%97.0%98.2%98.6%
Live93.1%96.7%99.0%
Table 5. Detection performance (AP) in different growth stage.
ModelClass6–12 Days (20)13–19 Days (28)20–26 Days (55)27–33 Days (62)34–40 Days (57)
YOLOv3Dead86.7%83.9%84.2%55.5%54.1%
Live62.5%72.7%73.3%77.6%74.8%
Improved-YOLOv3Dead99.0%99.4%100%97.4%91.9%
Live94.6%92.3%92.5%93.3%92.9%
Publisher’s Note: MDPI stays neutral with regard to jurisdictional claims in published maps and institutional affiliations.

