
Classification of Maize Lodging Extents Using Deep Learning Algorithms by UAV-Based RGB and Multispectral Images

 , , ,
, , ,
Abstract
:1. Introduction
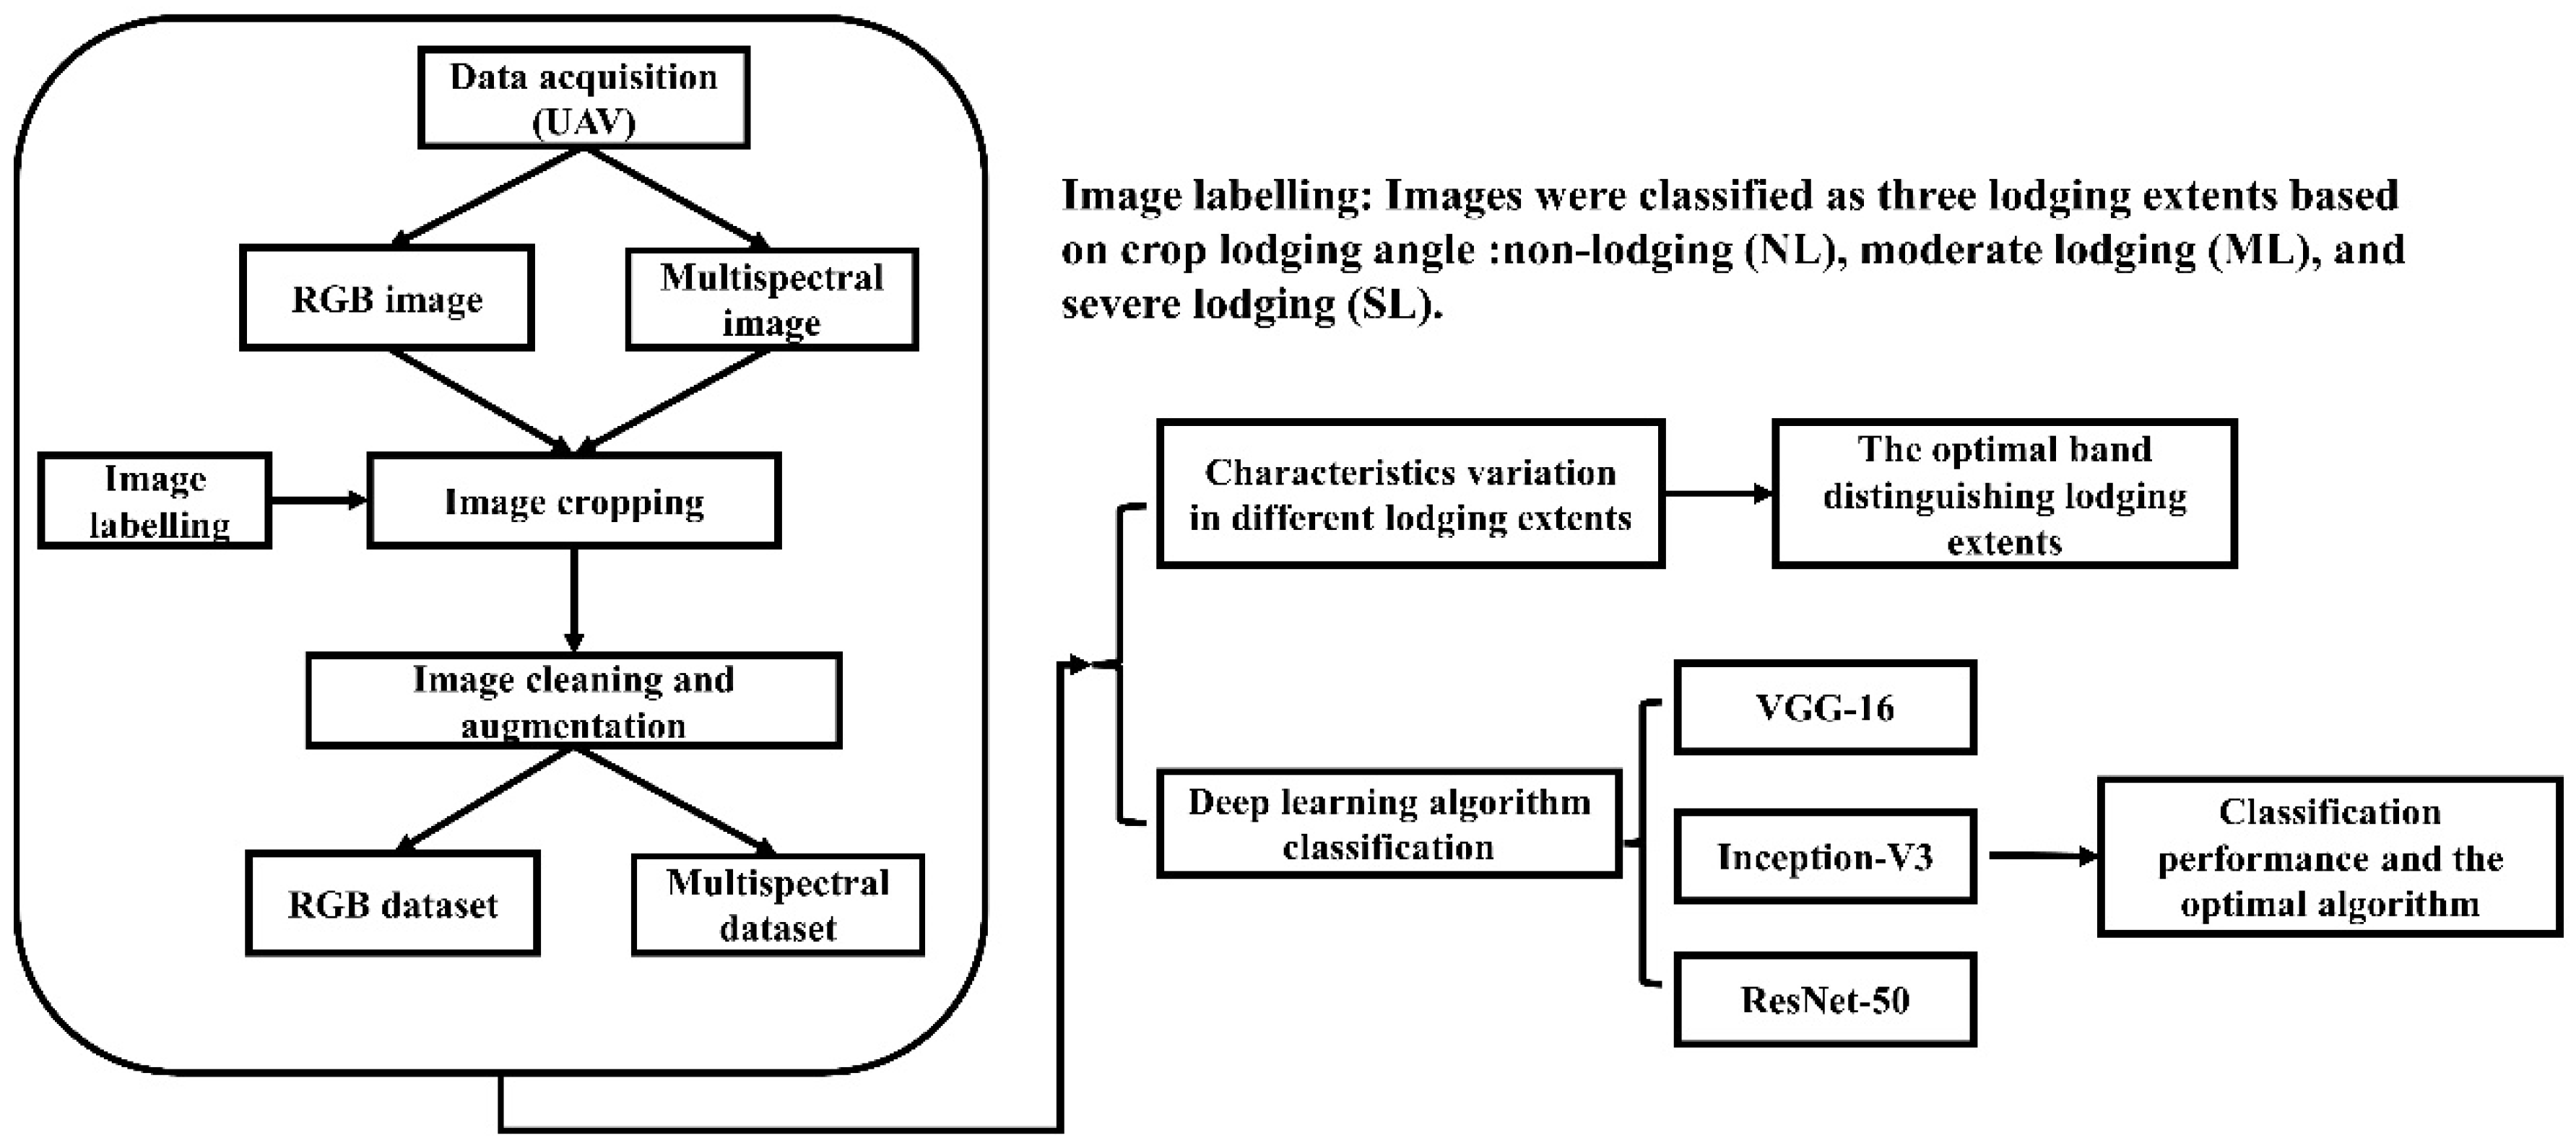
2. Materials and Methods
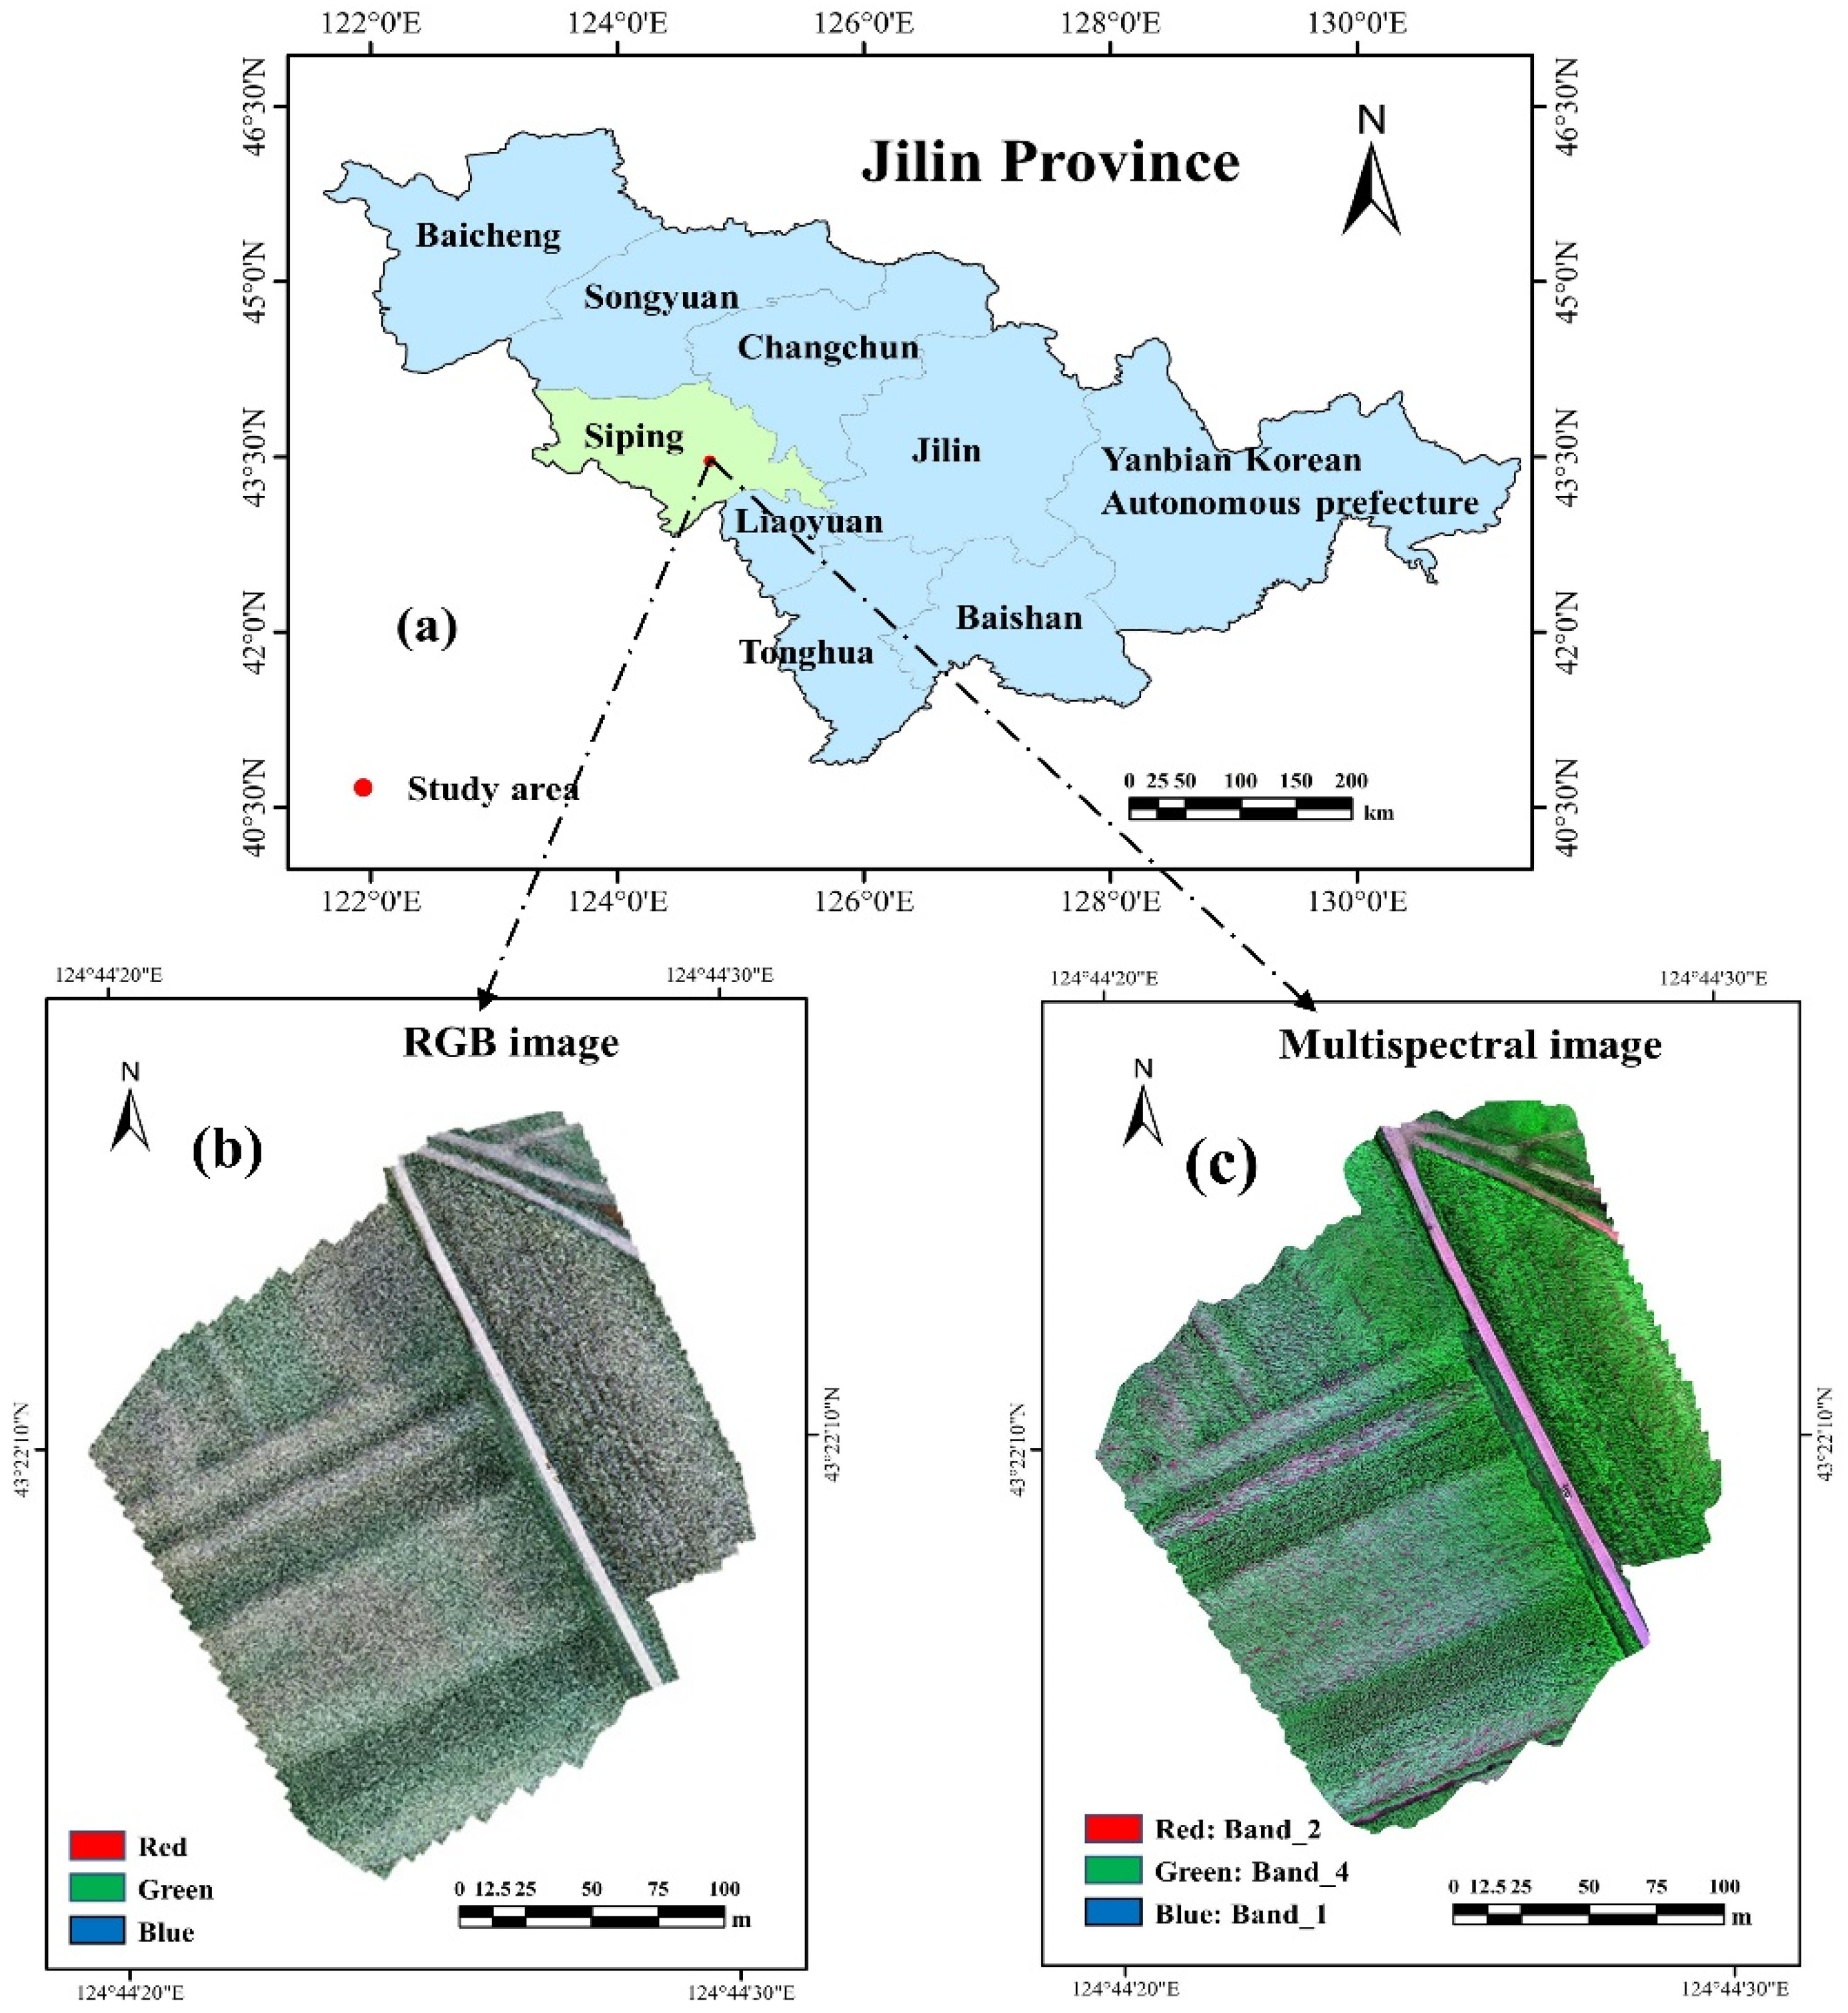
2.1. Study Area
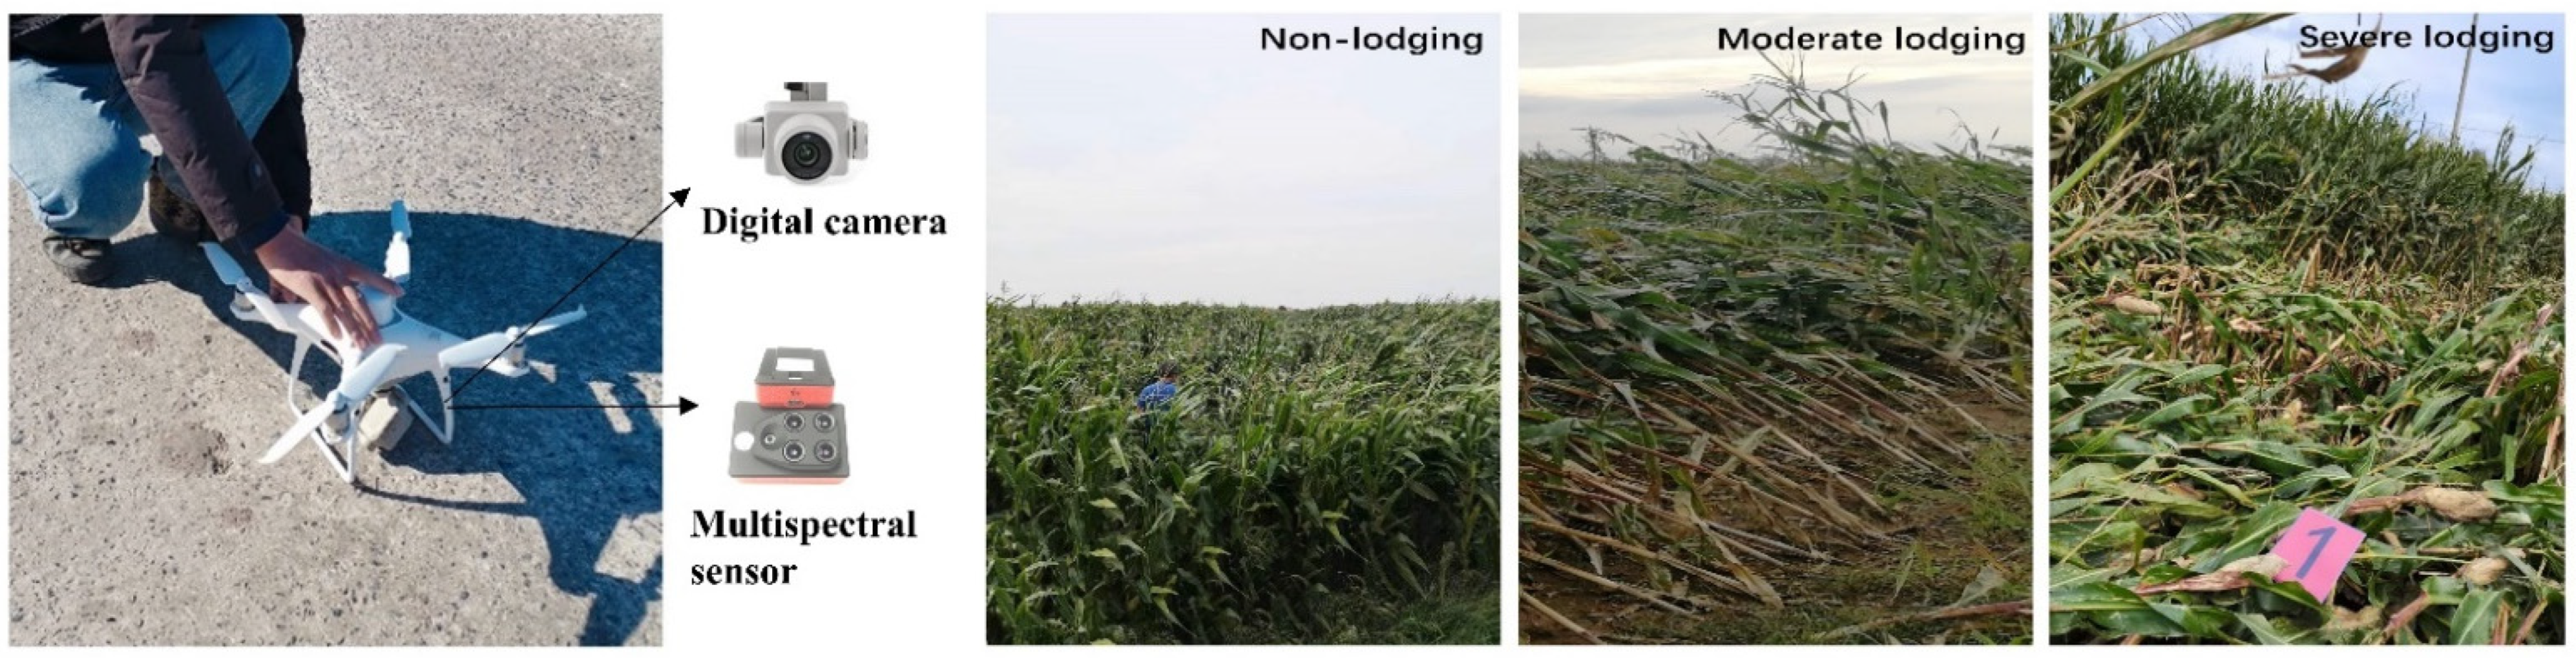
2.2. Data Acquisition
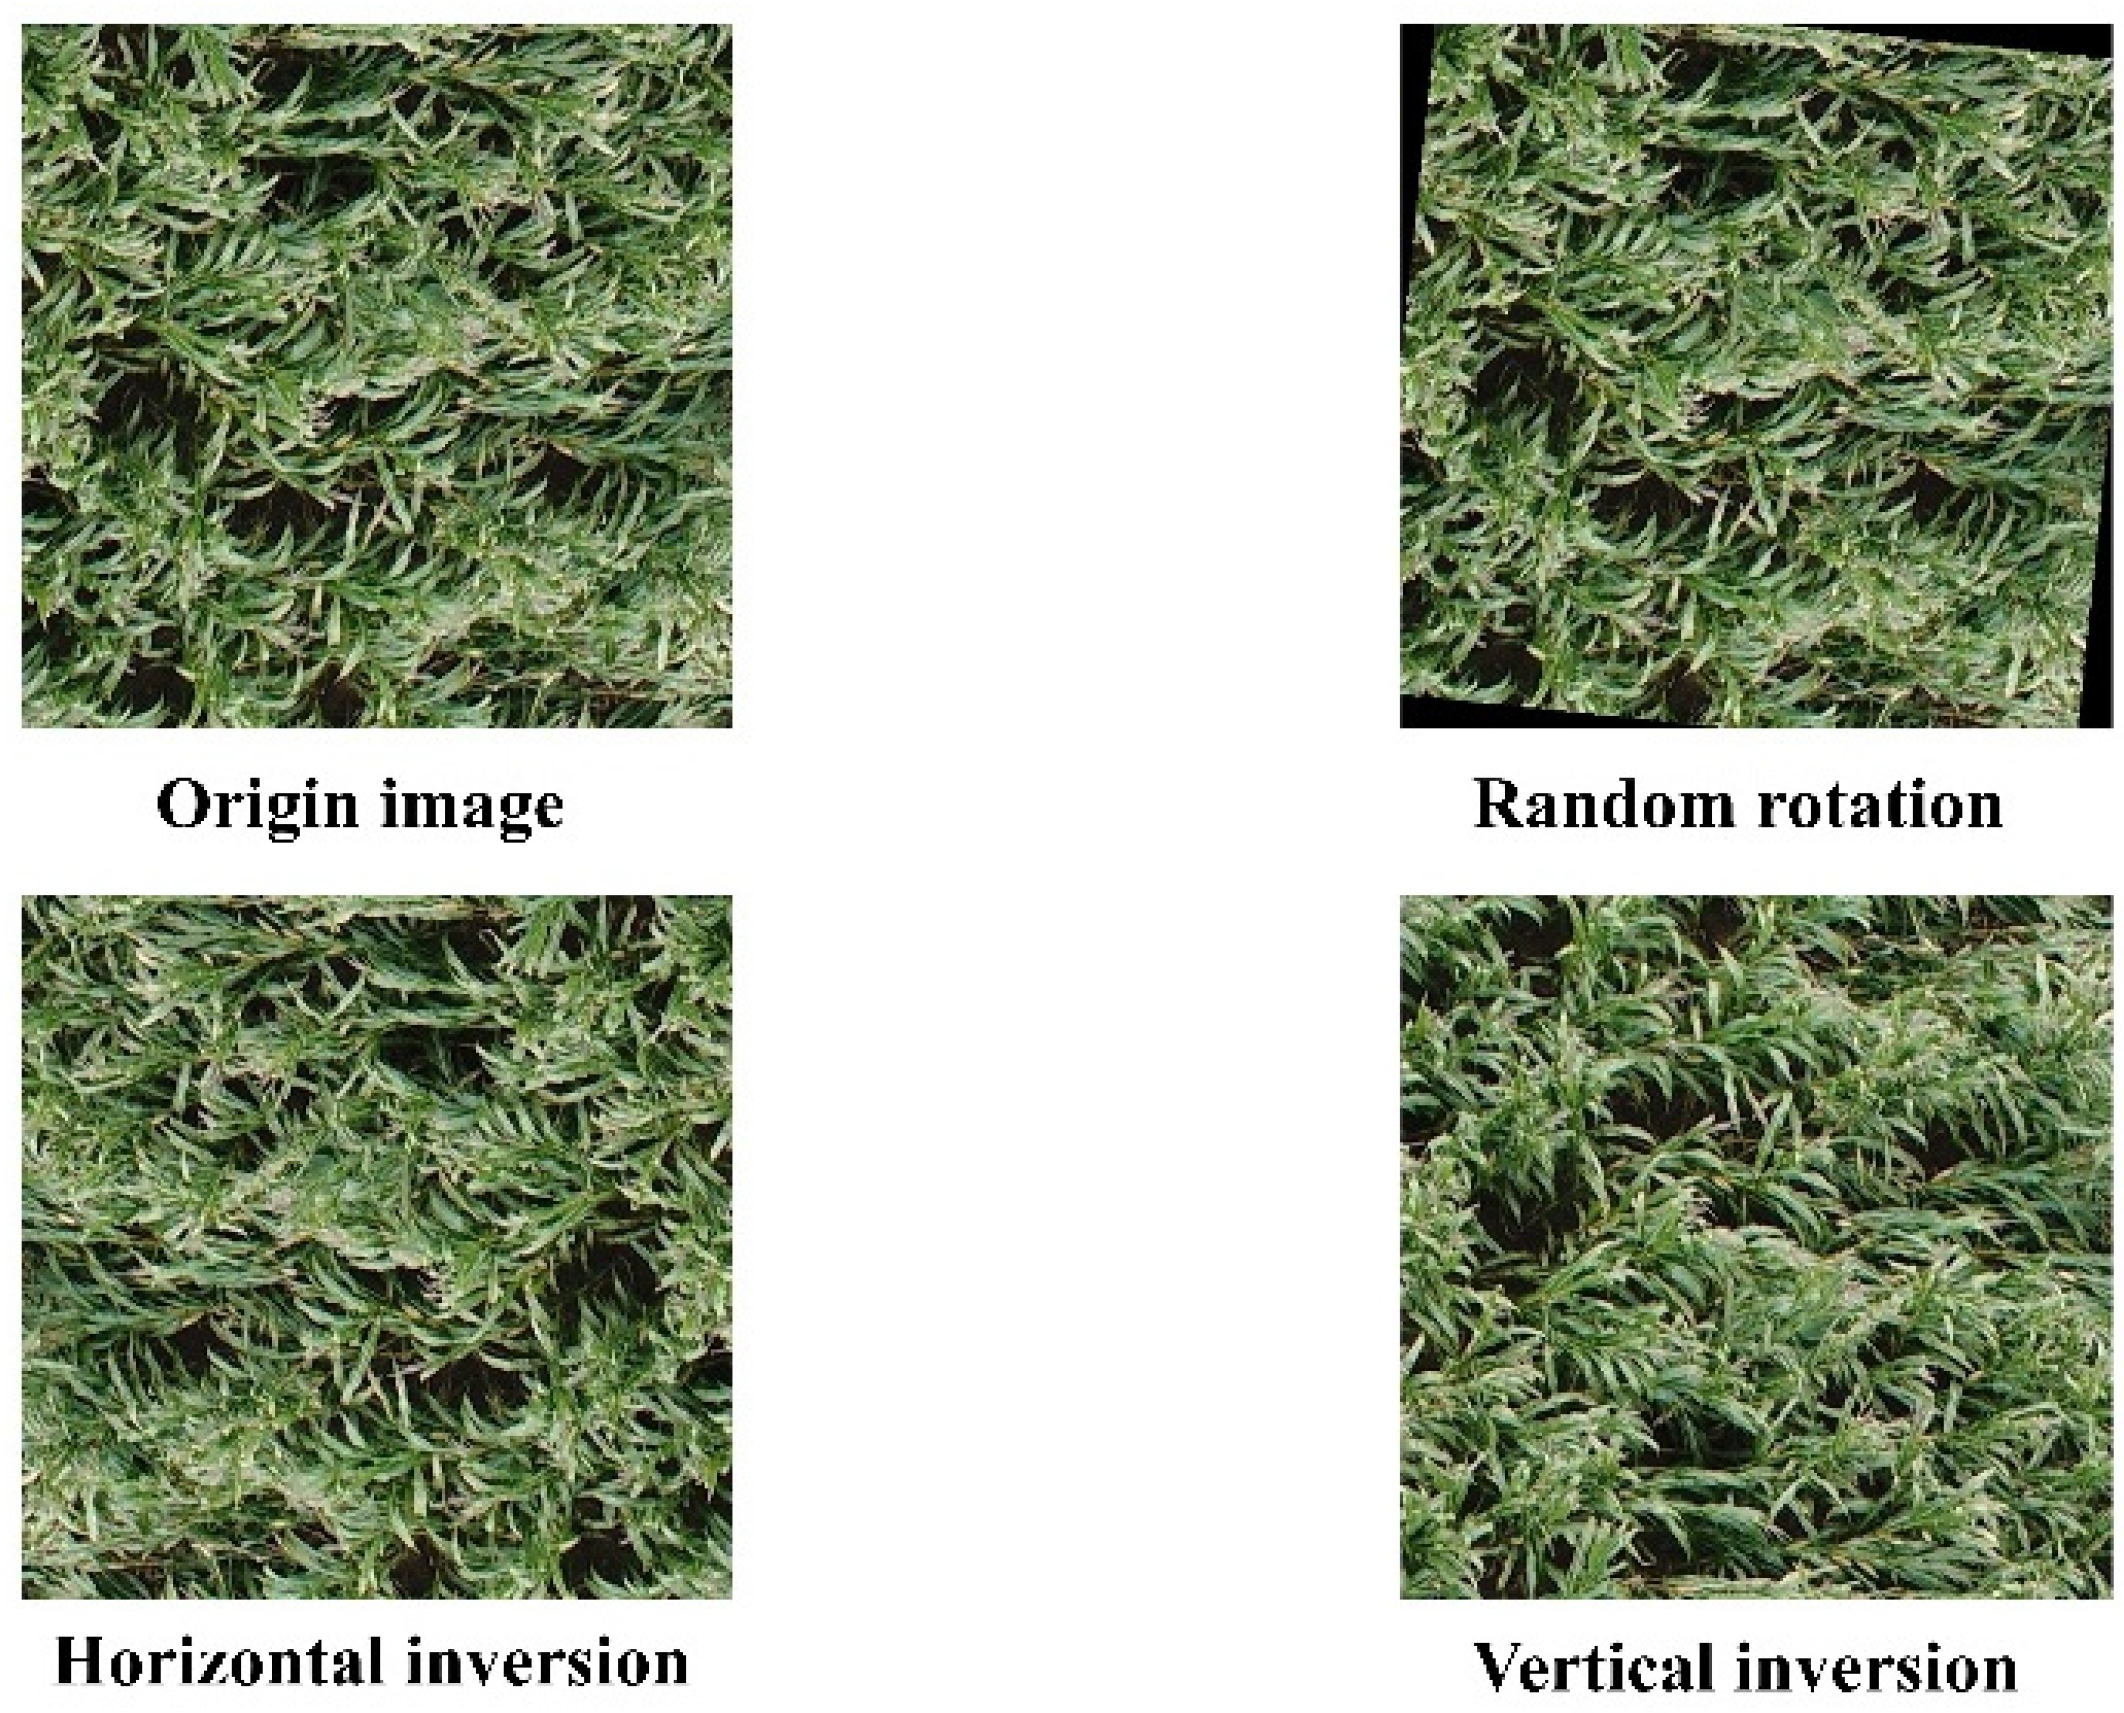
2.3. Data Cleaning and Augmentation
2.4. Deep Learning
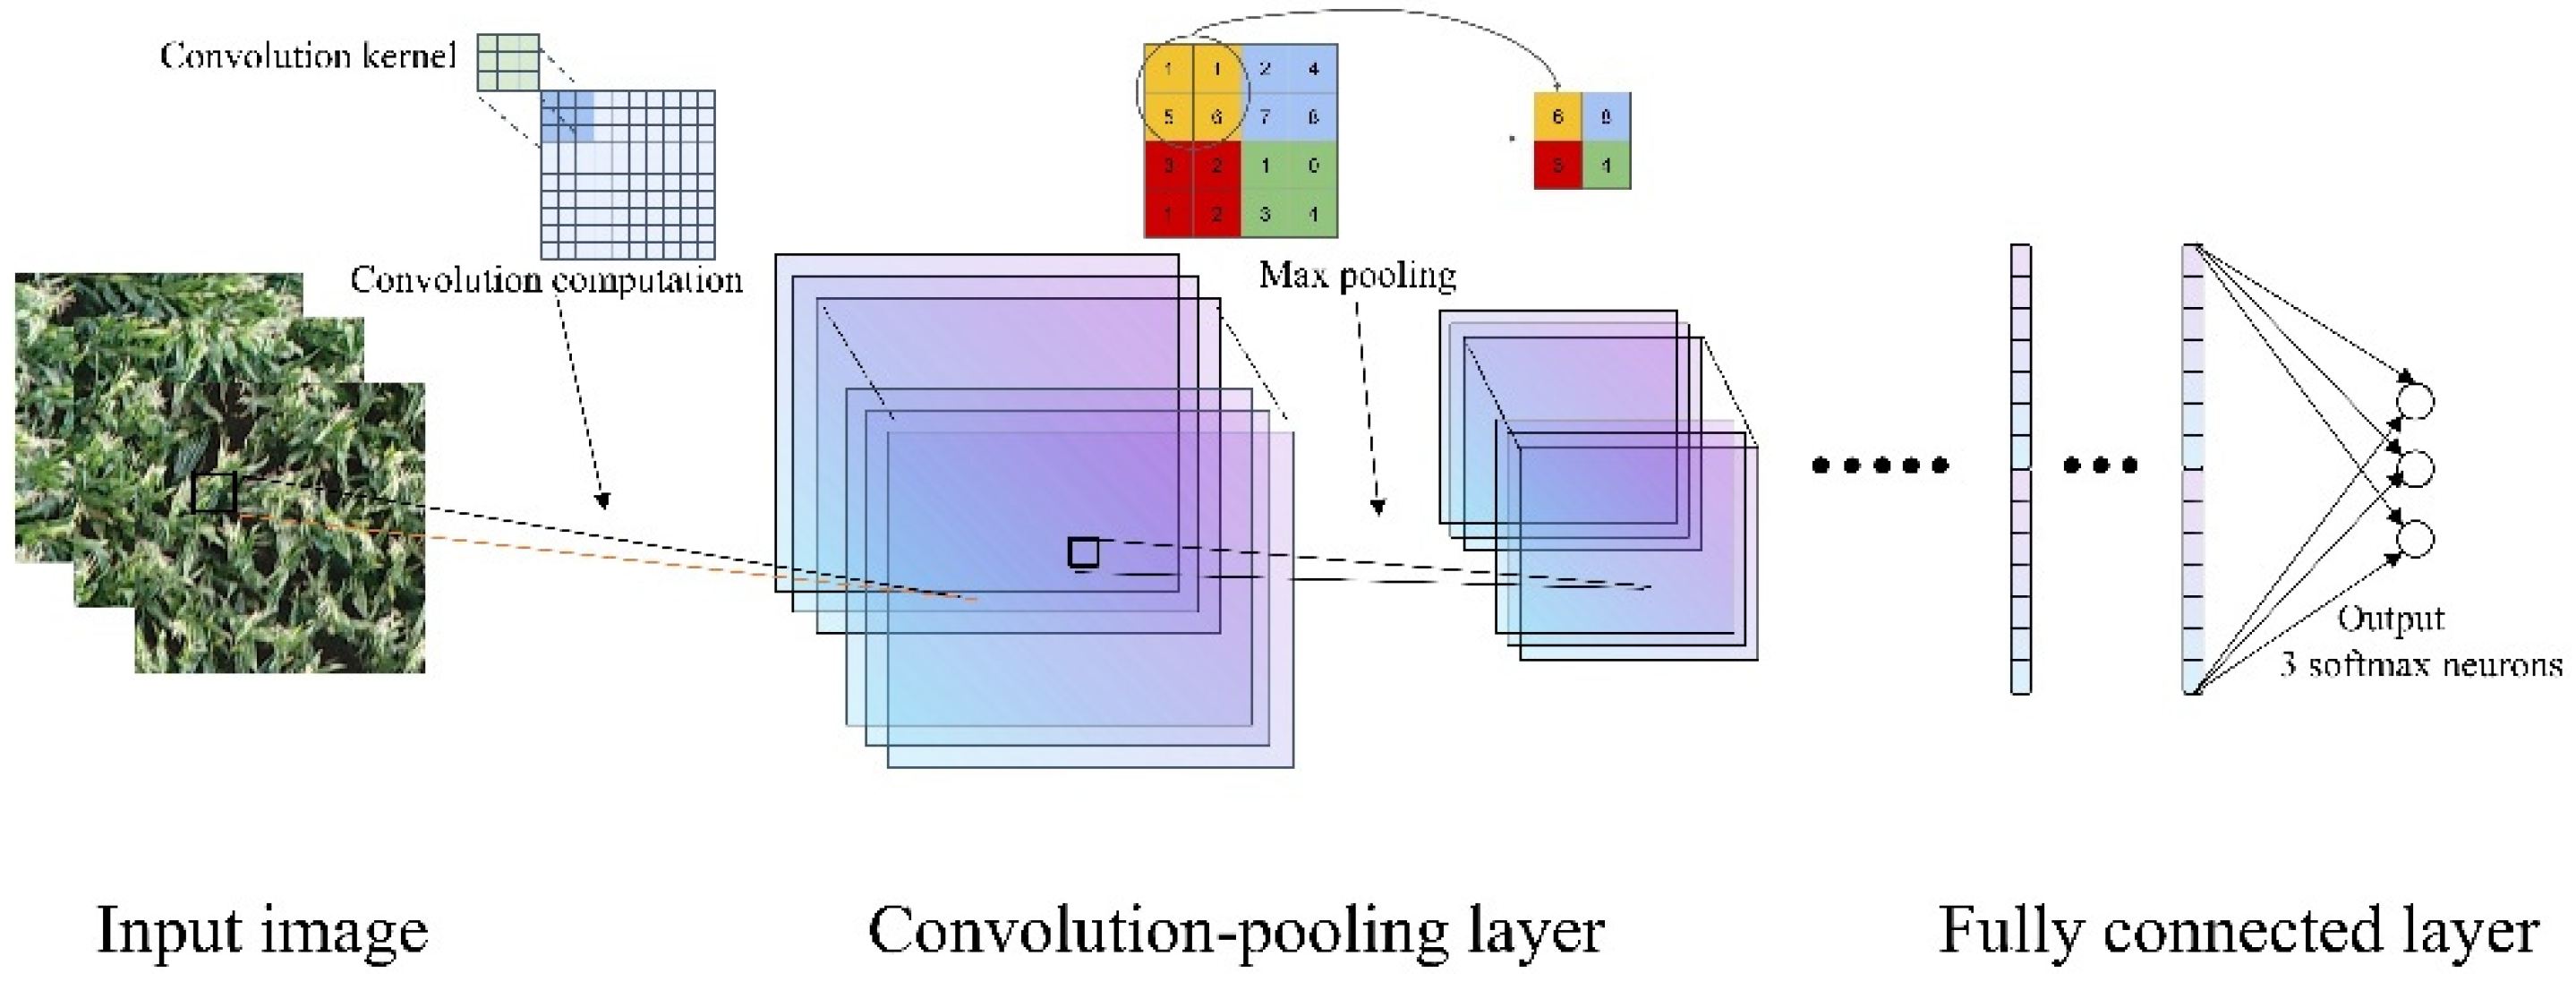
2.4.1. Convolutional Neural Networks
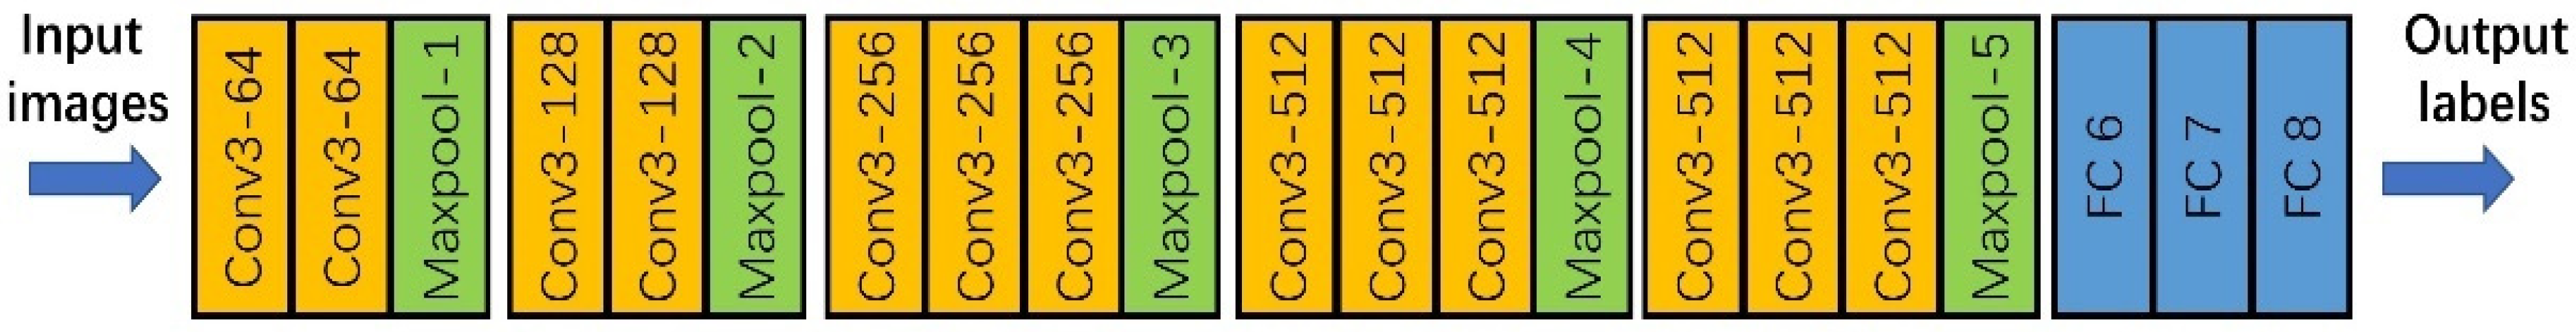
2.4.2. VGG-16
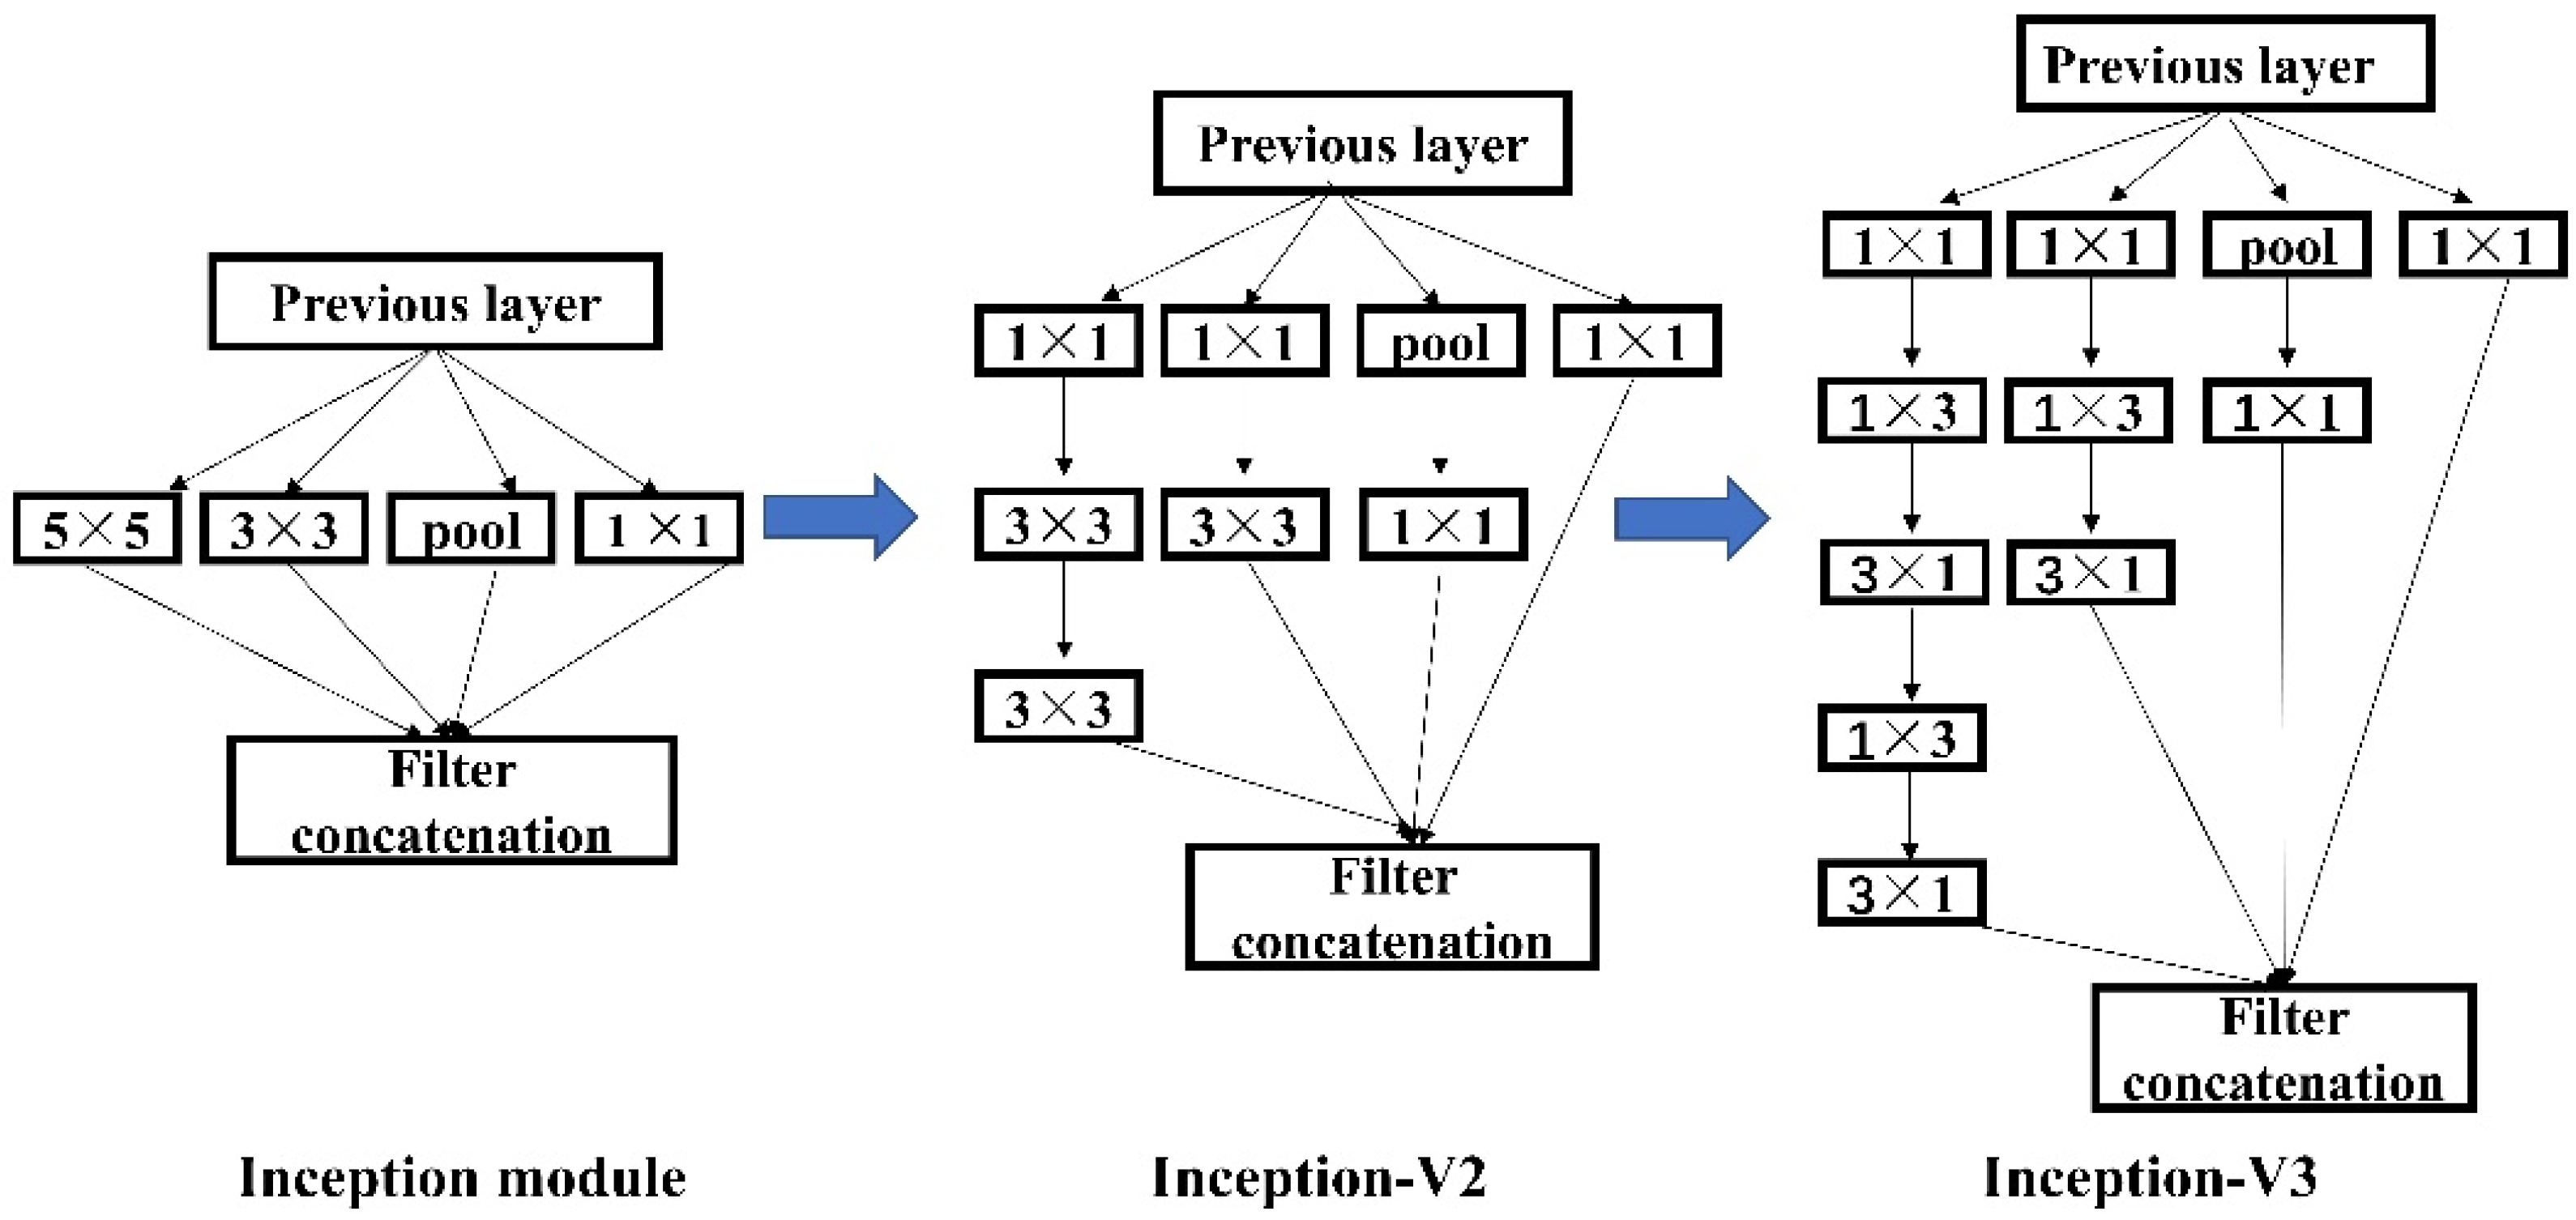
2.4.3. Inception-V3
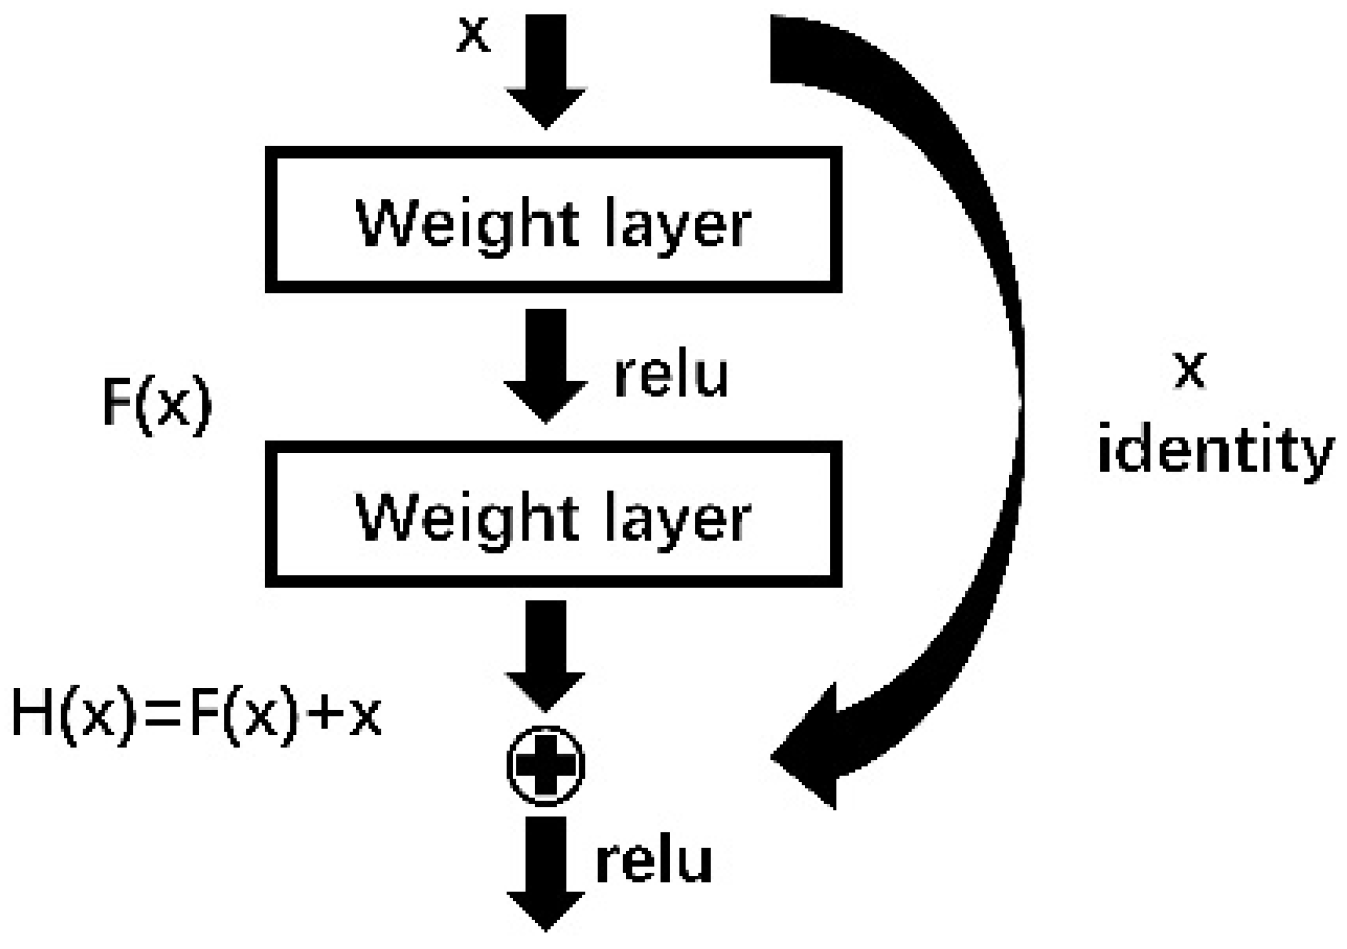
2.4.4. ResNet-50
2.5. Validation
3. Results
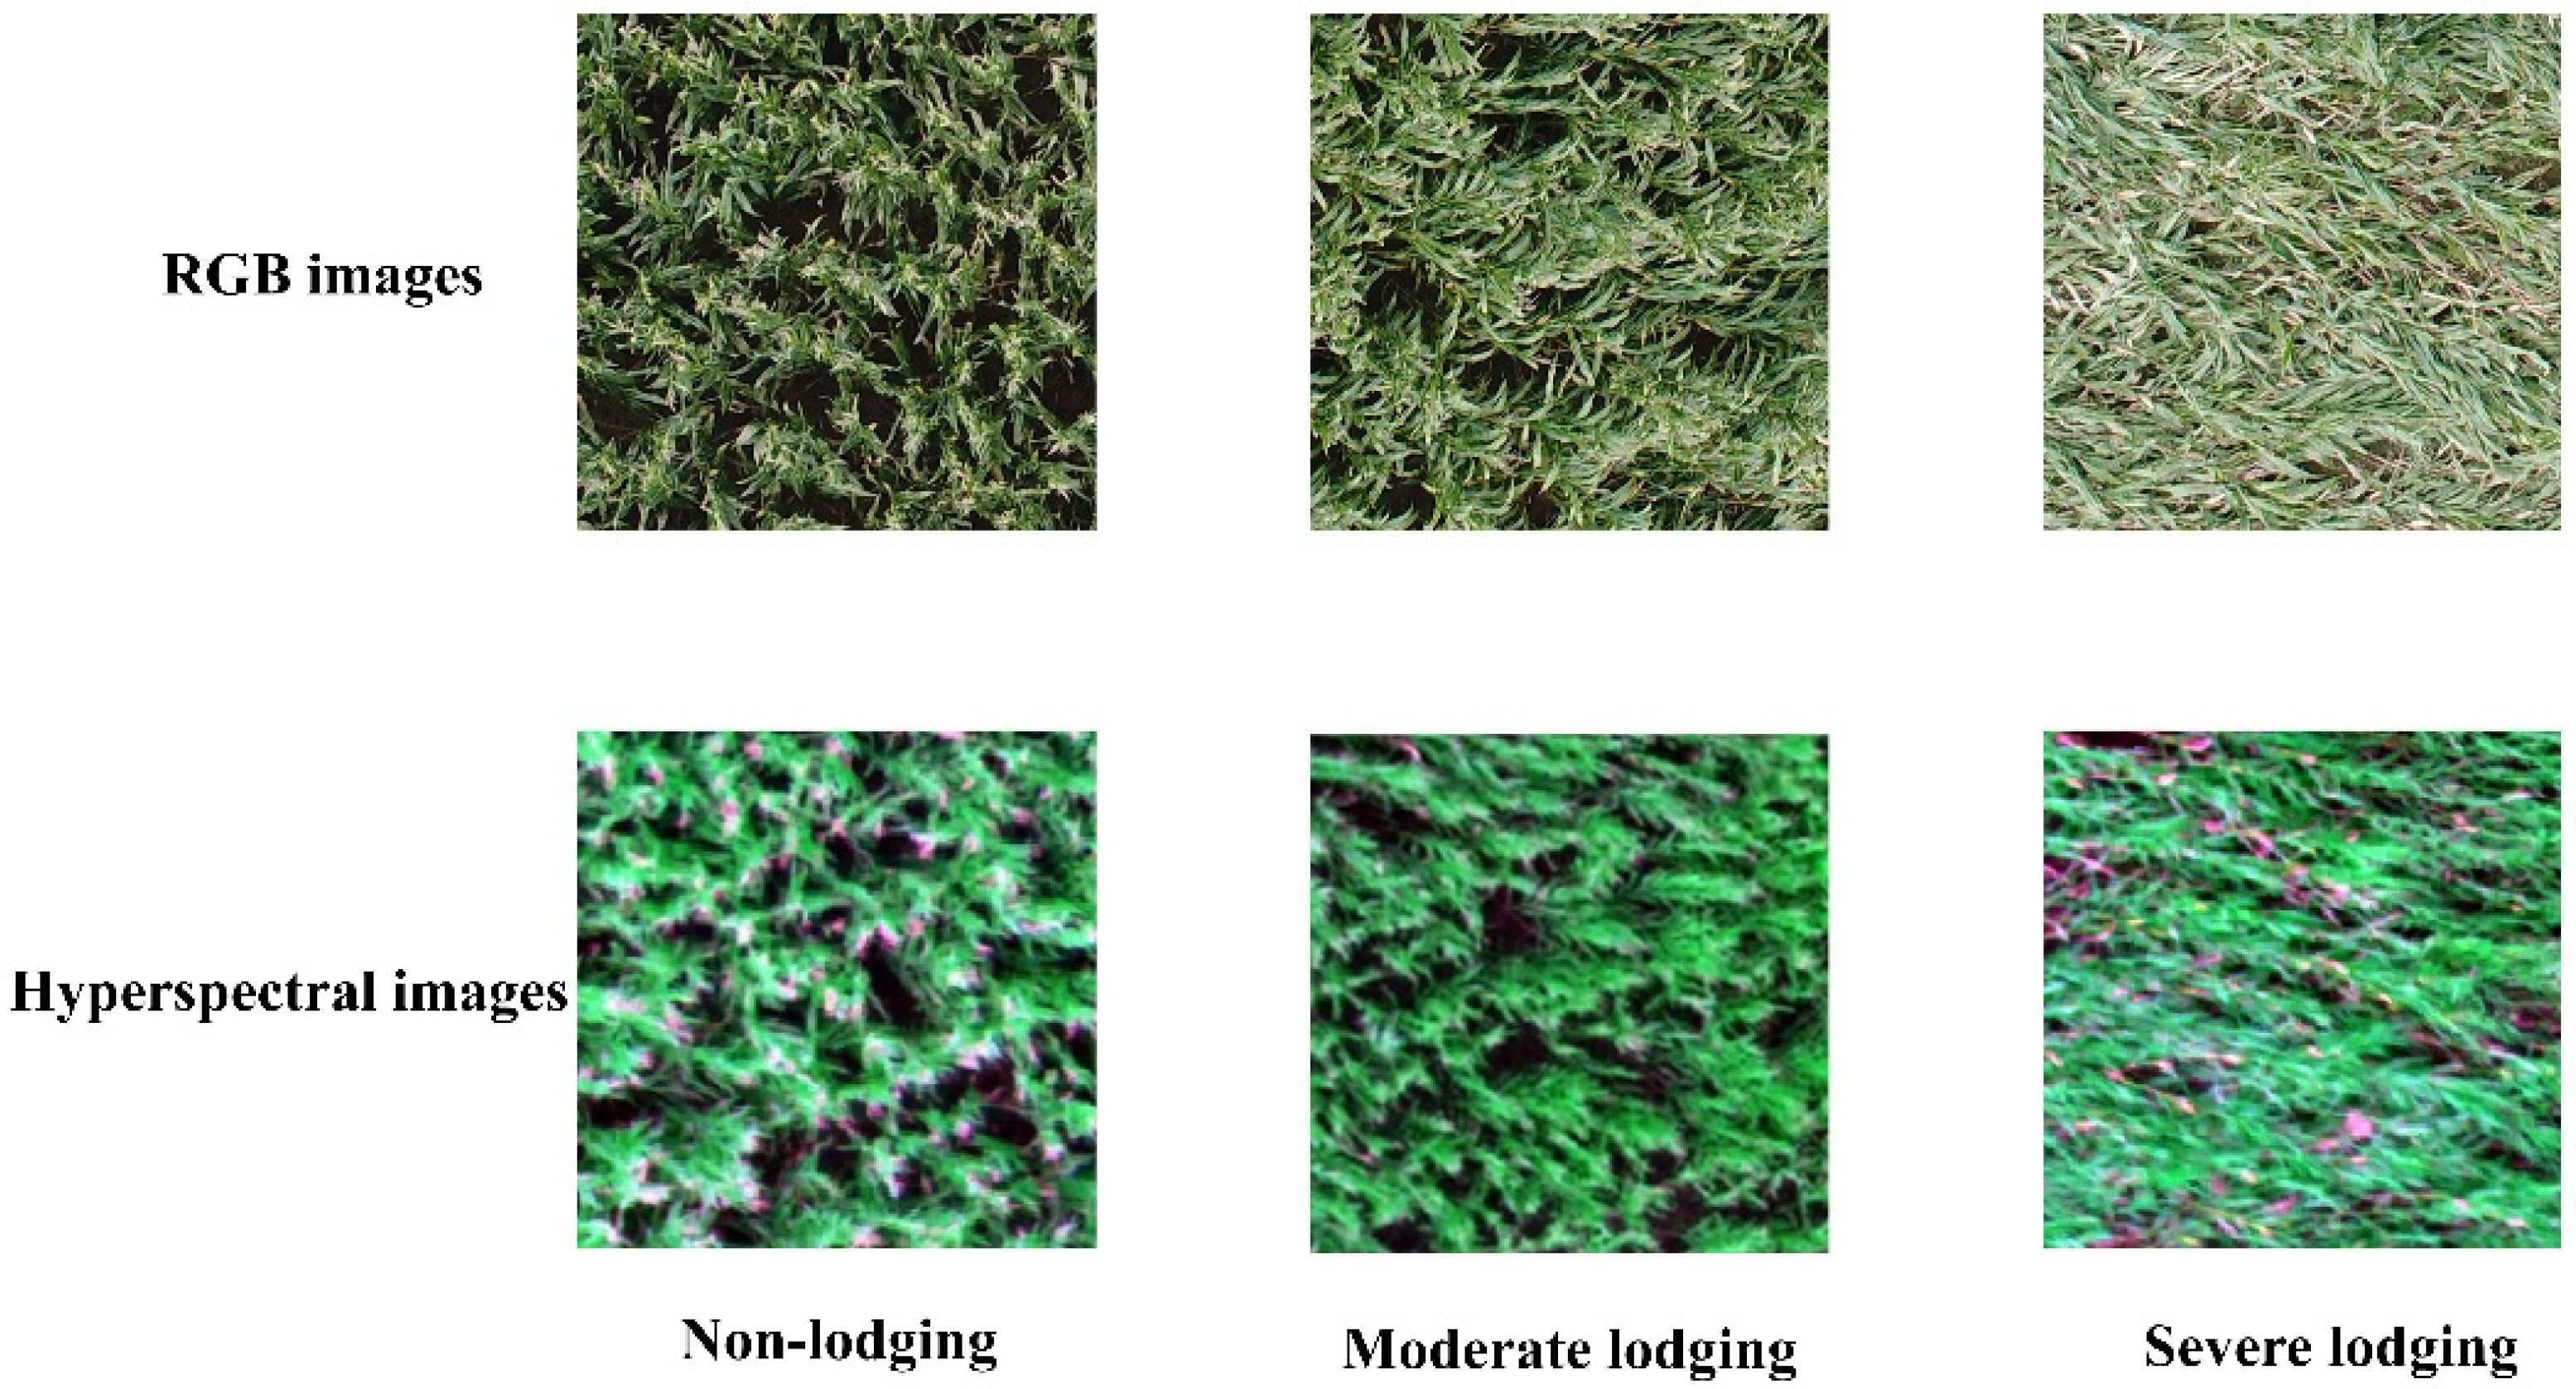
3.1. Research Images Analysis
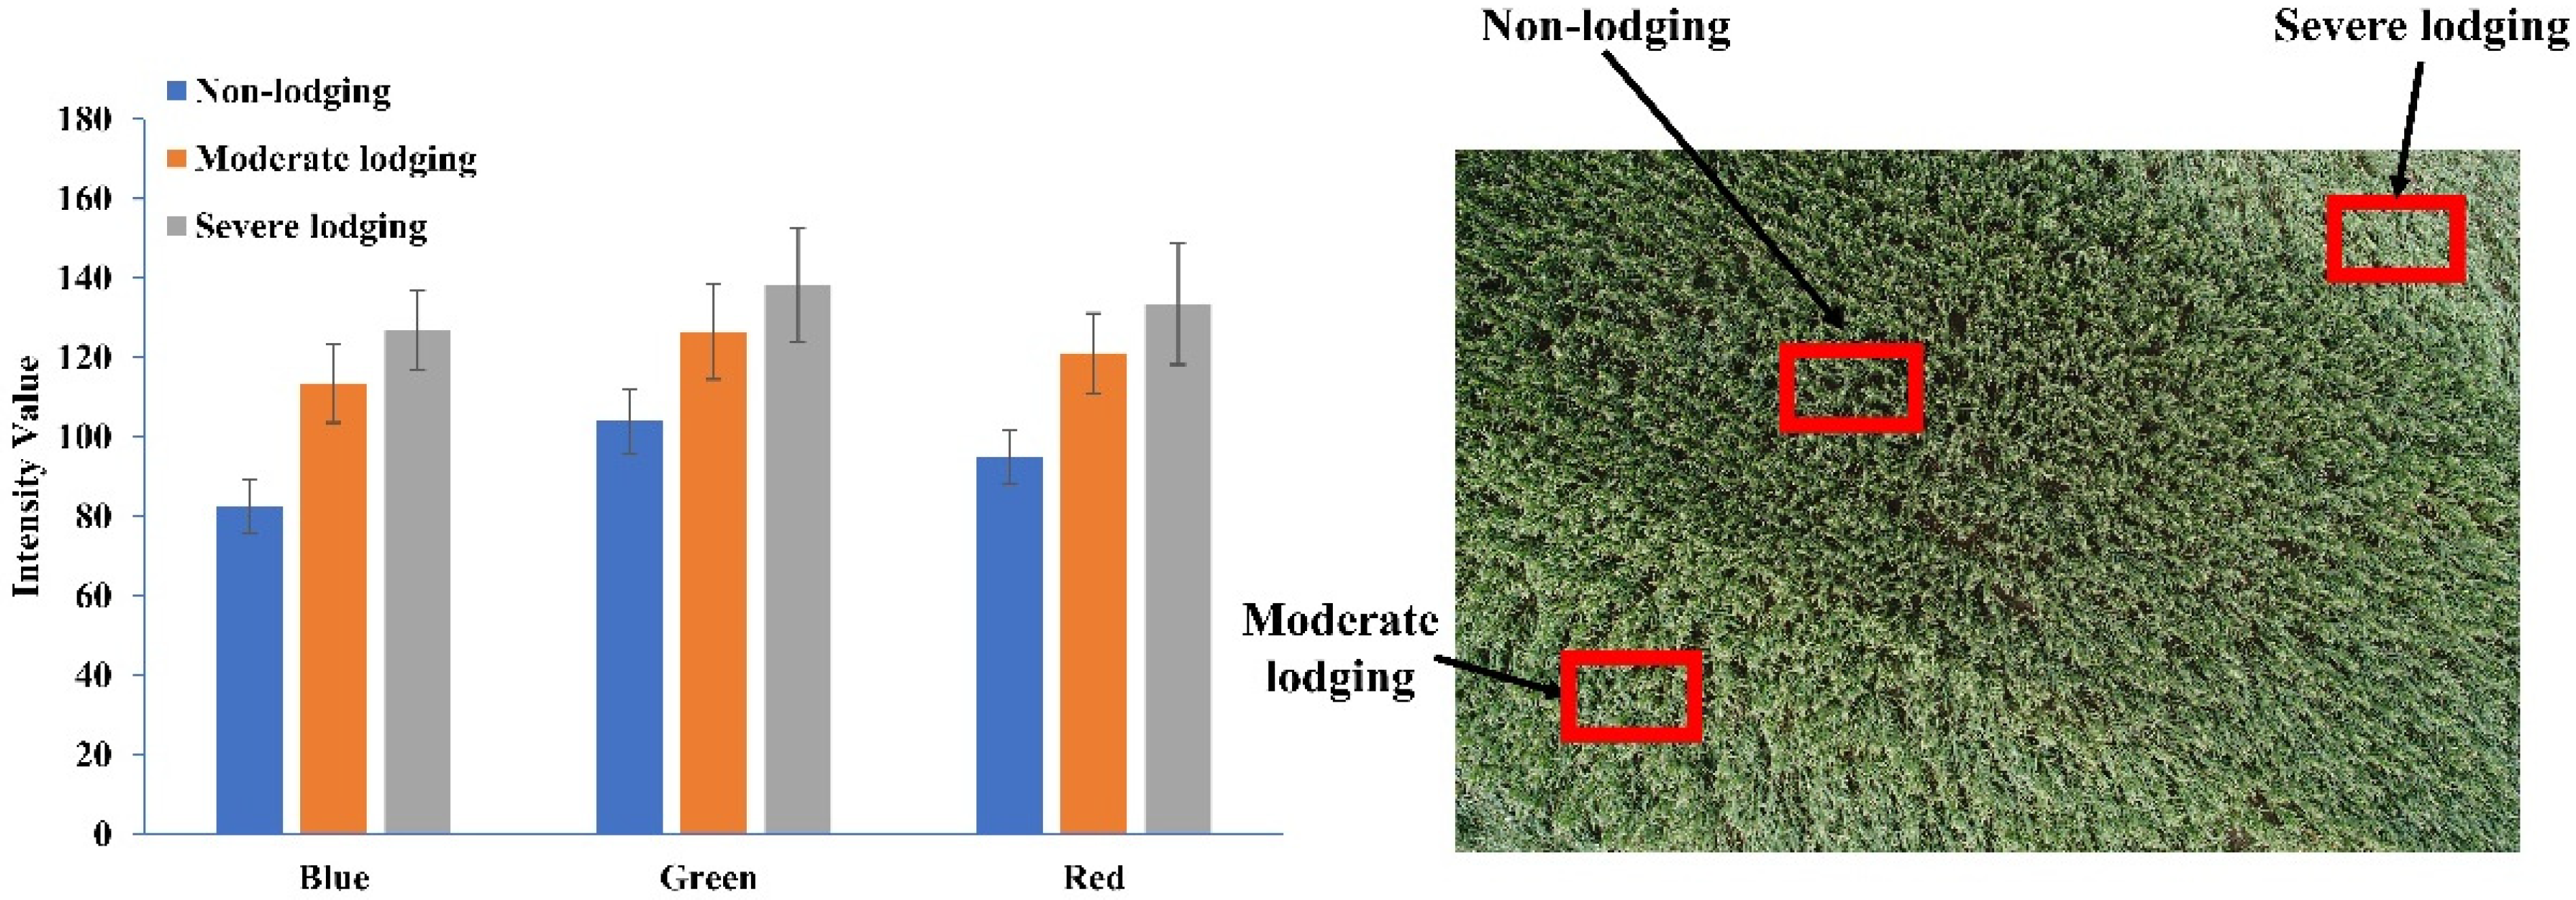
3.1.1. RGB Images Analysis
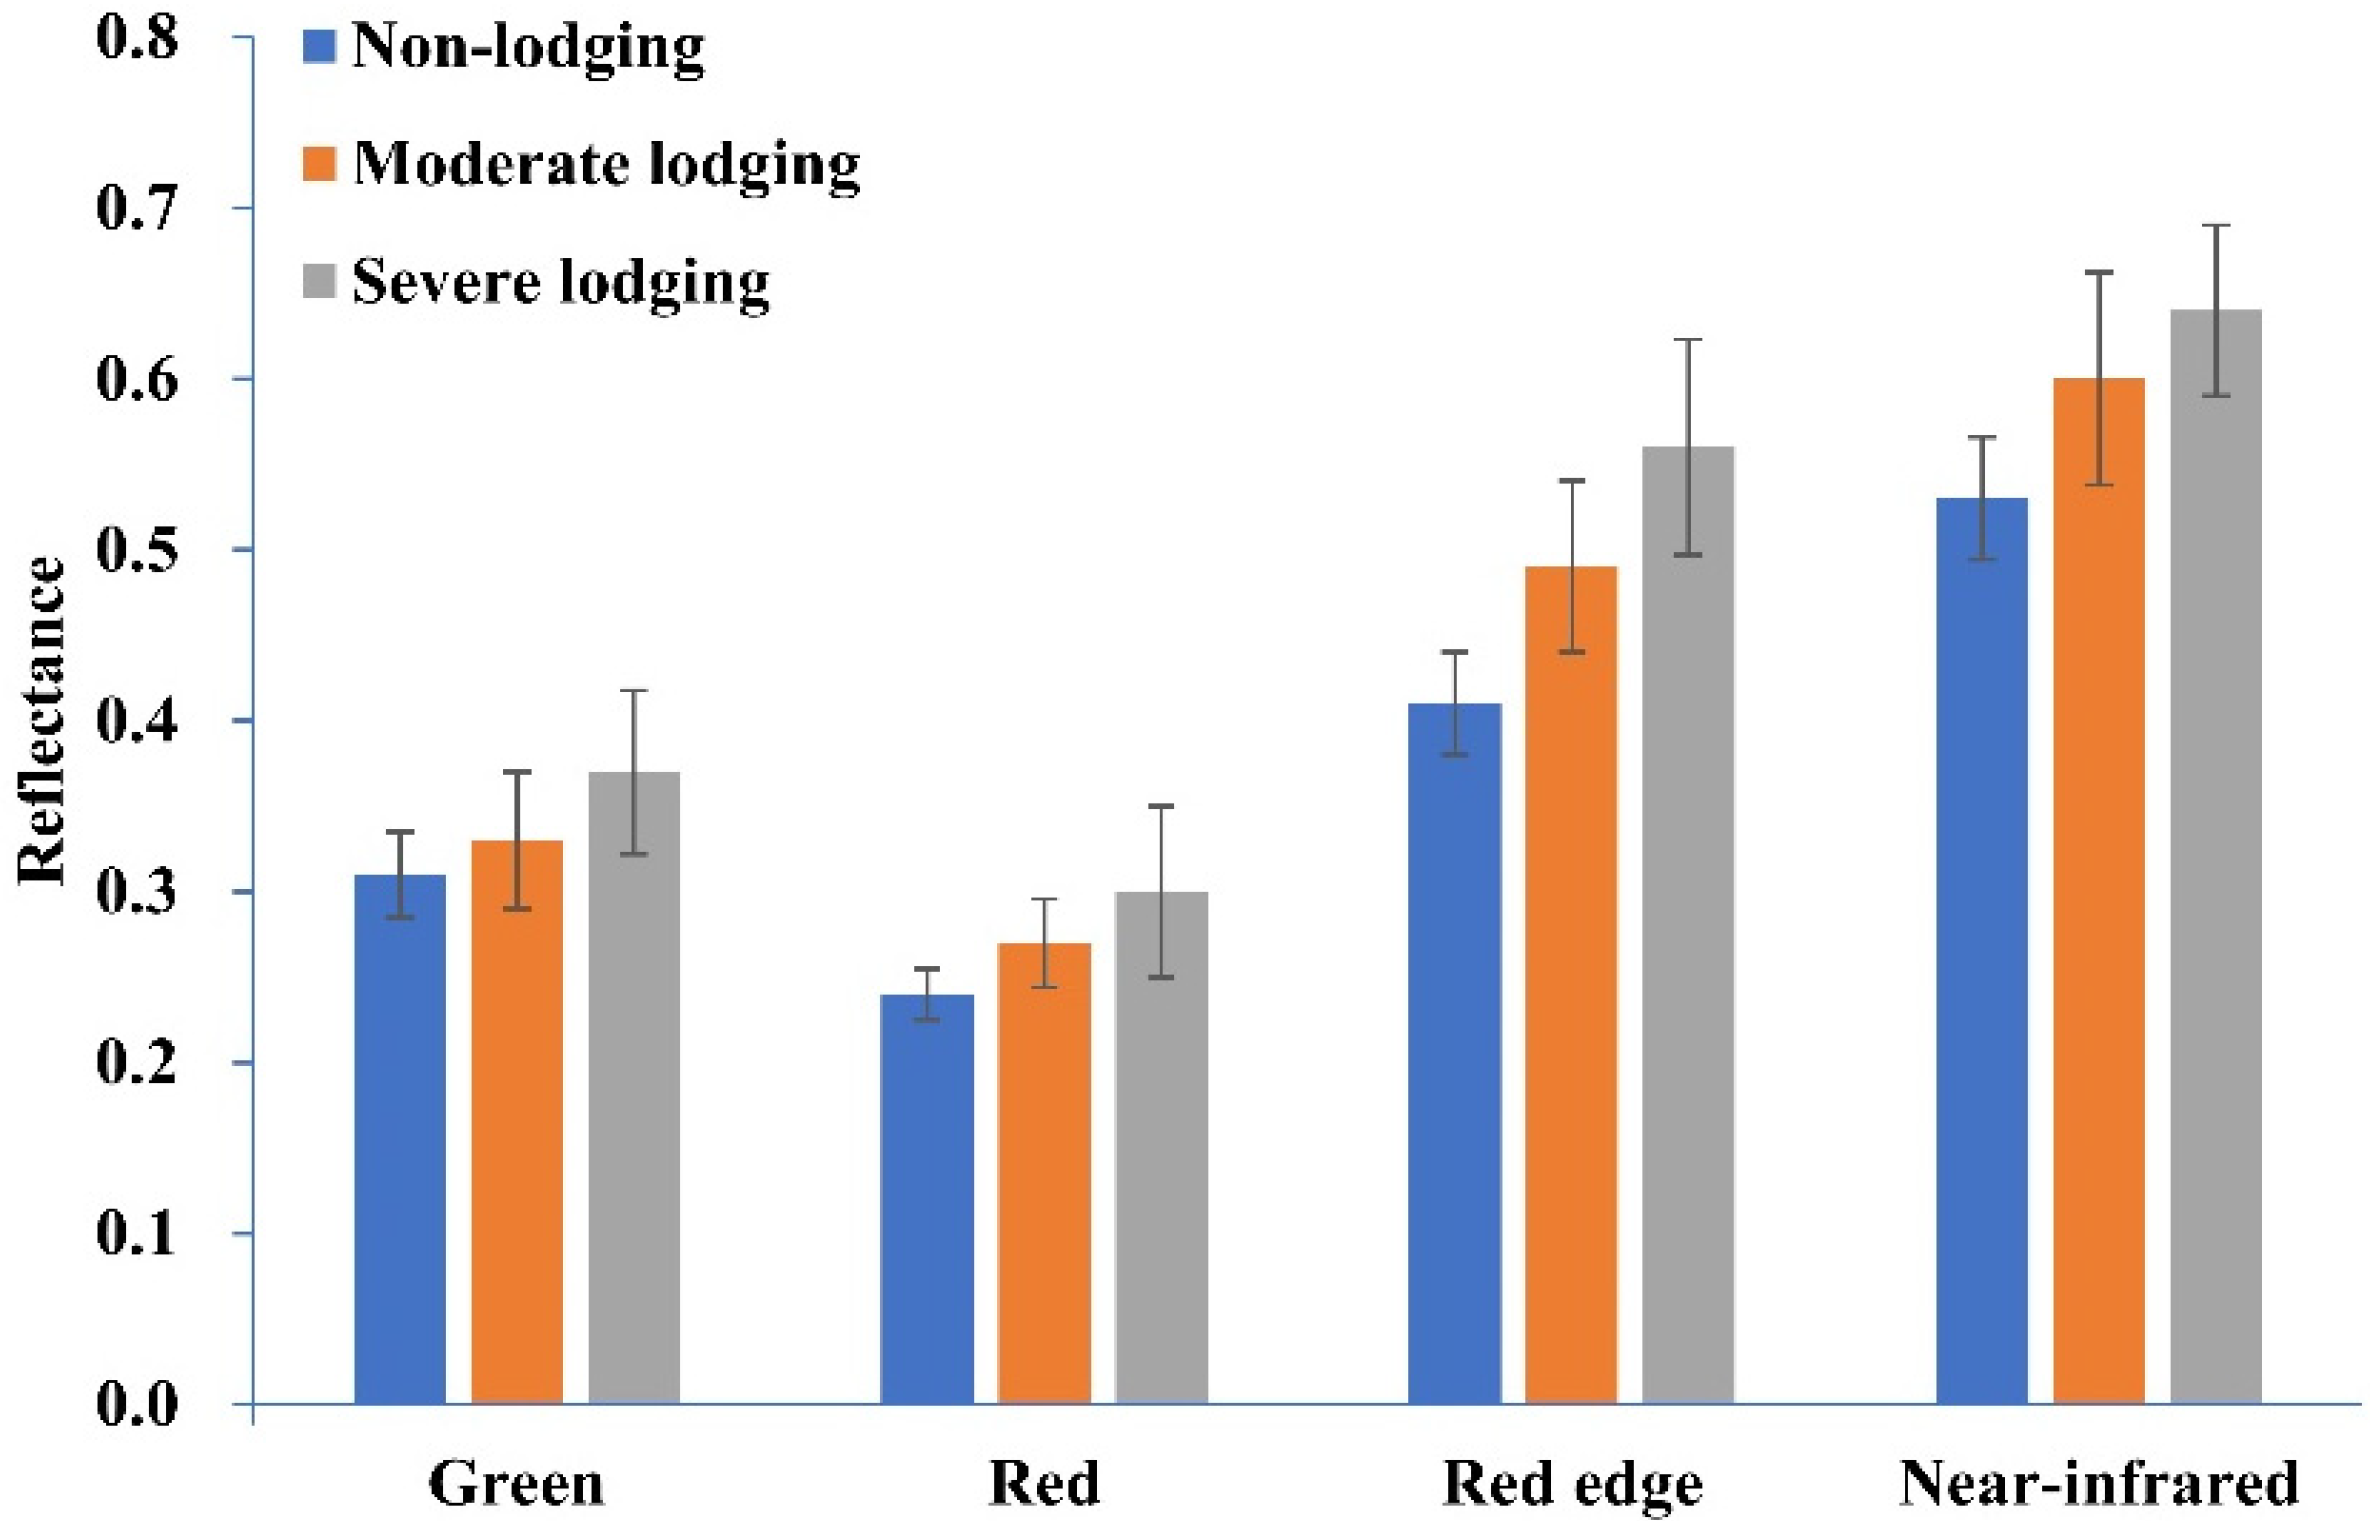
3.1.2. Multispectral Images Analysis
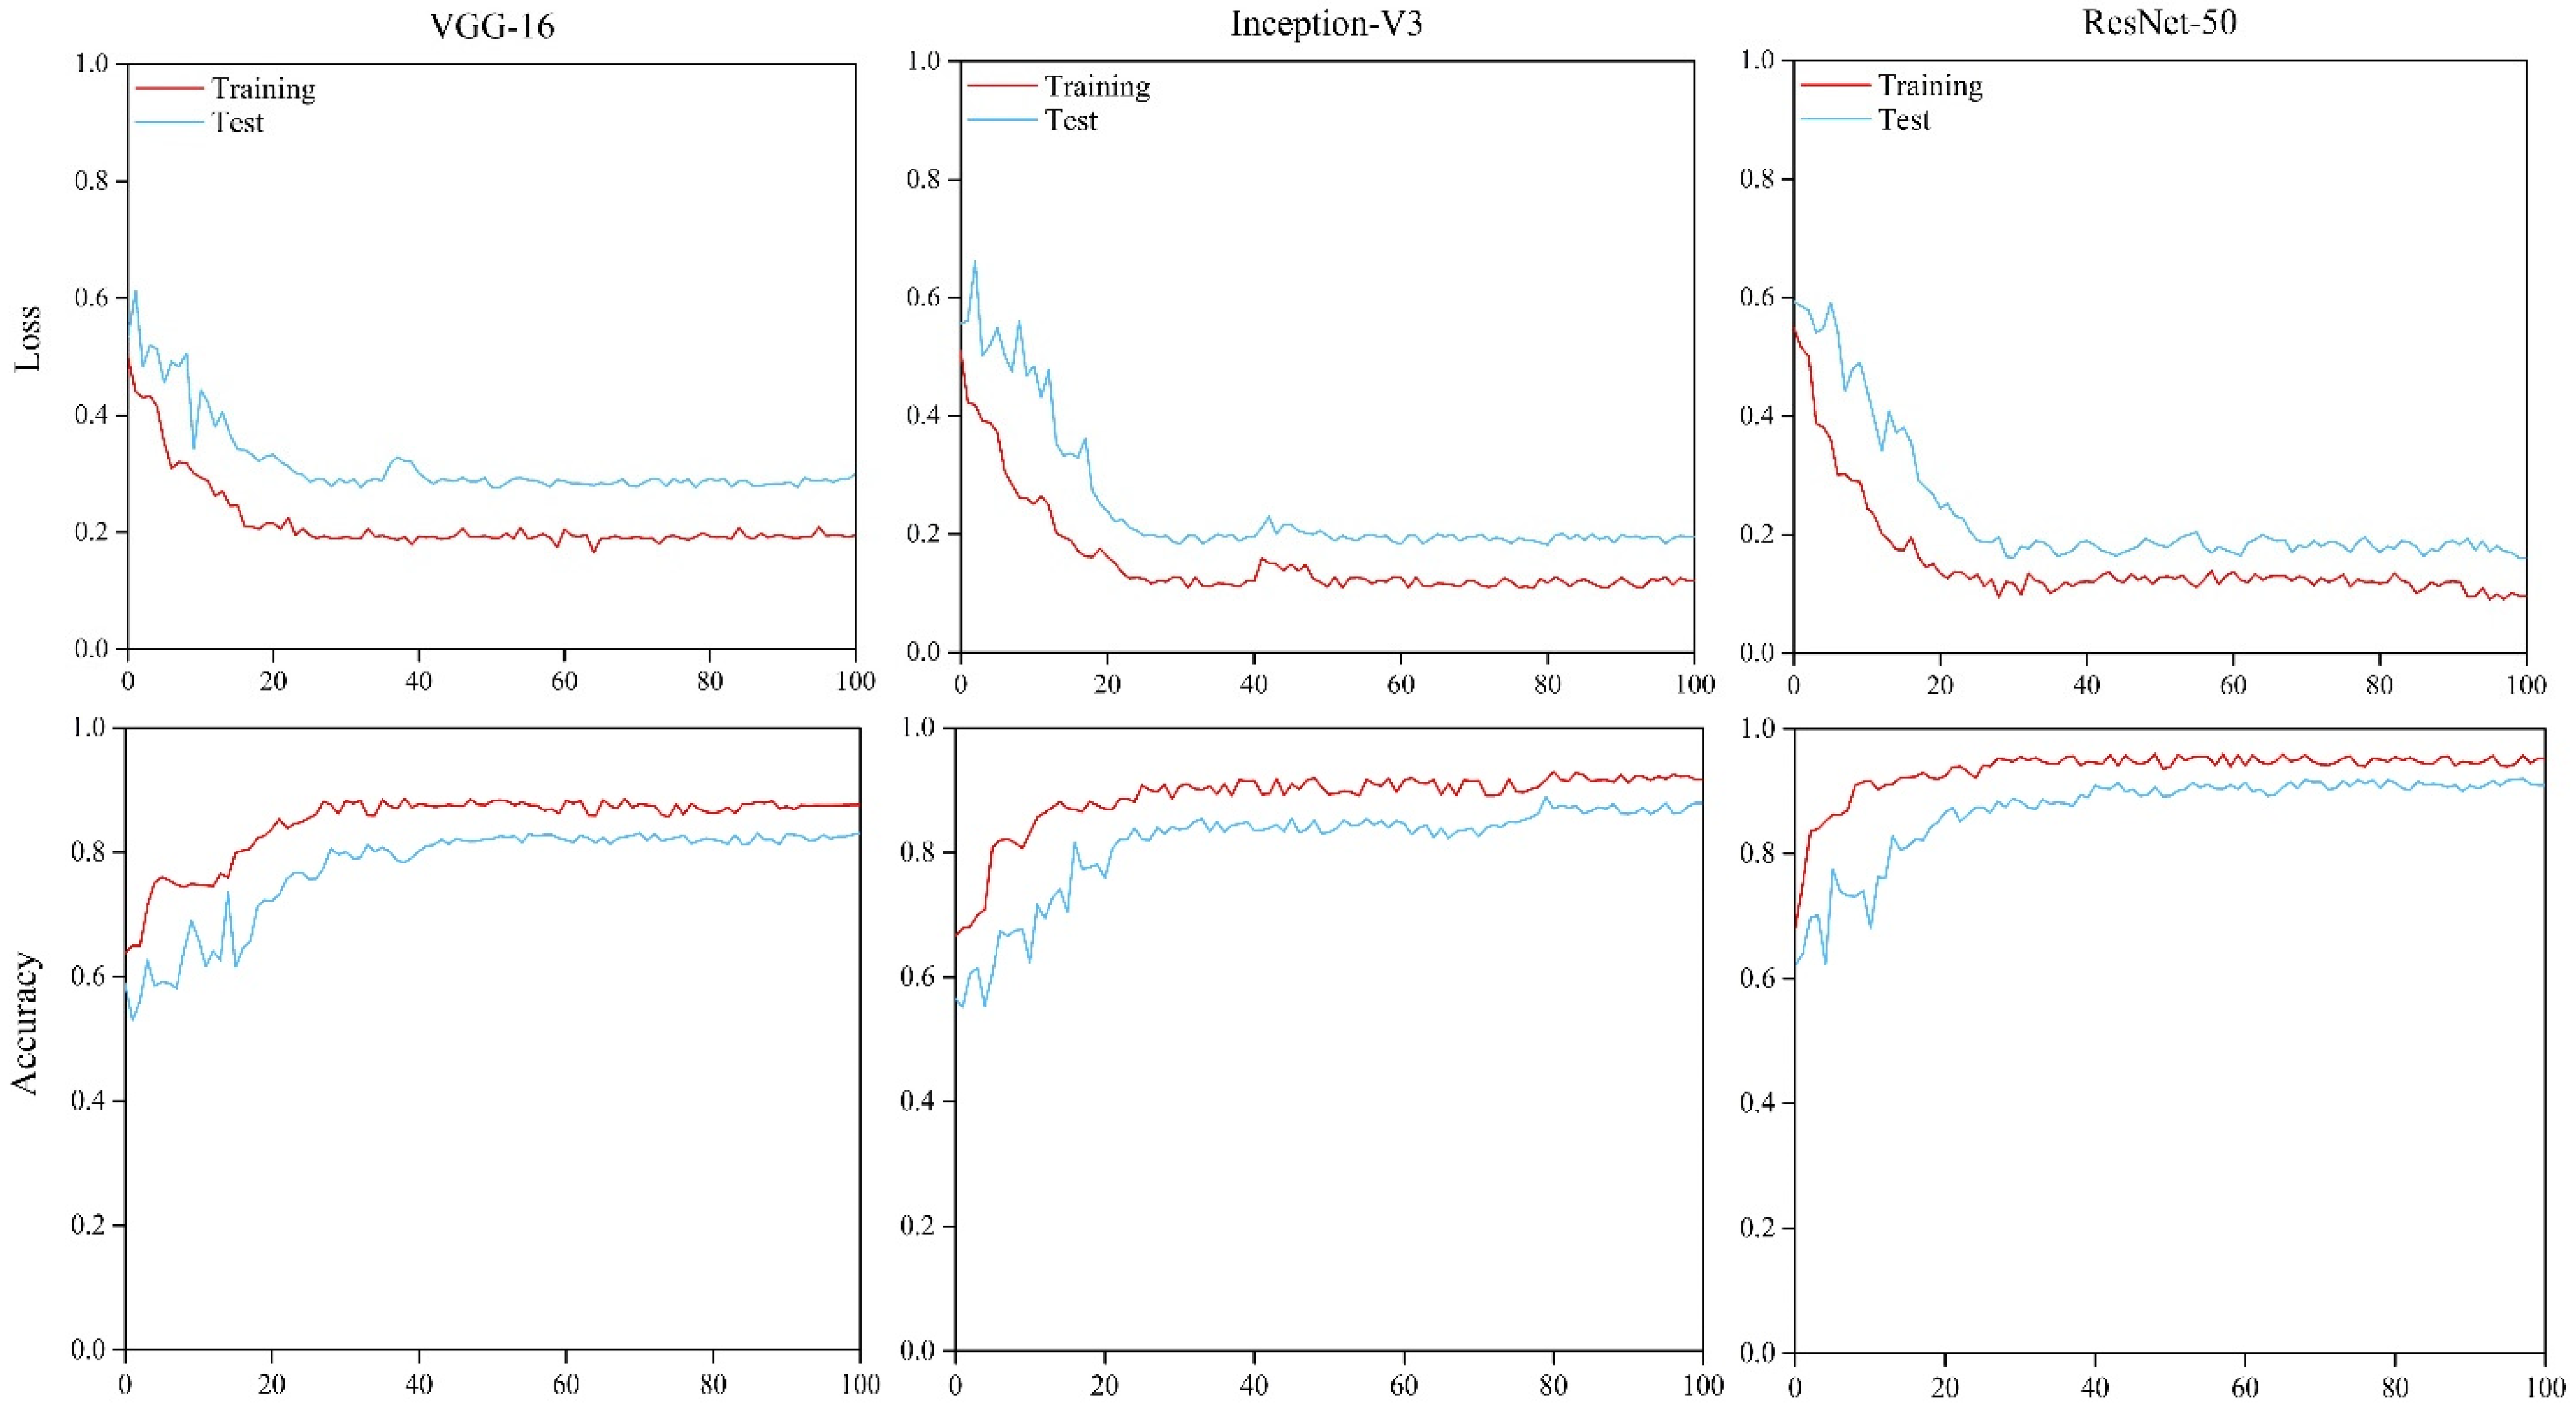
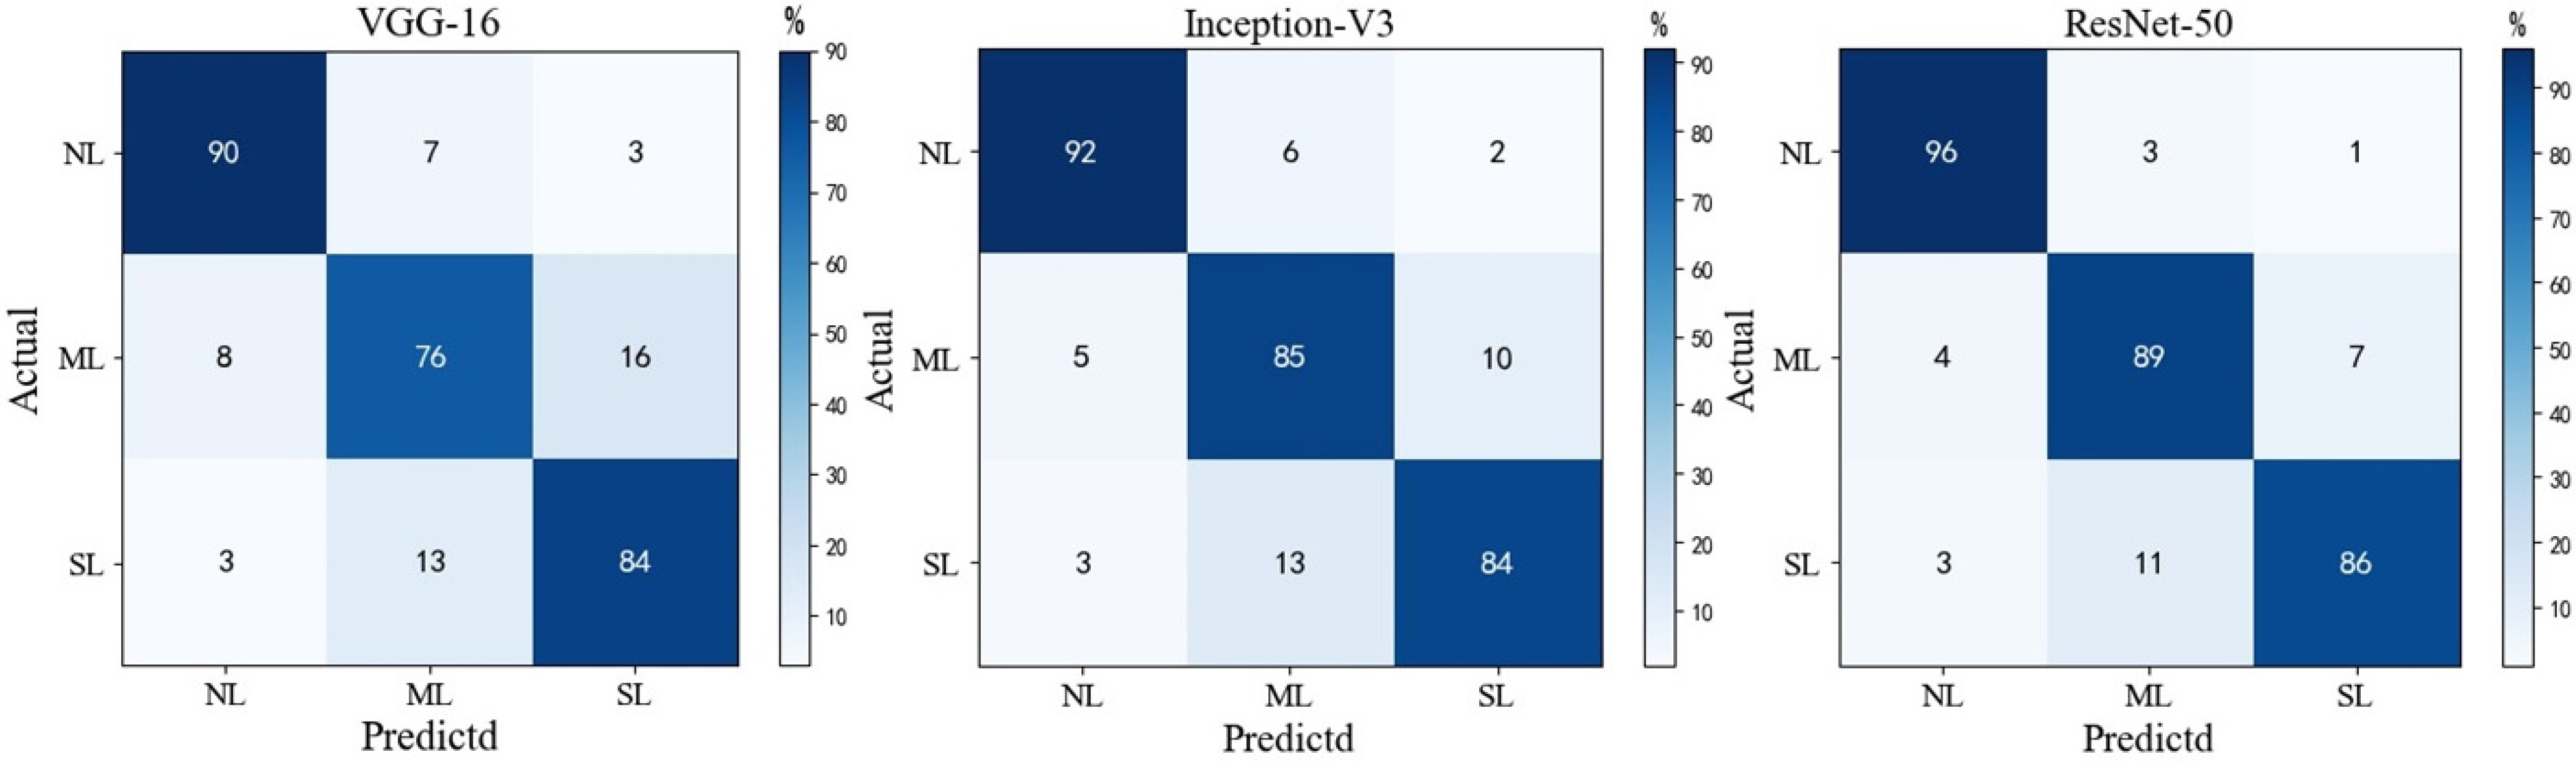
3.2. Lodging Classification Using RGB Images
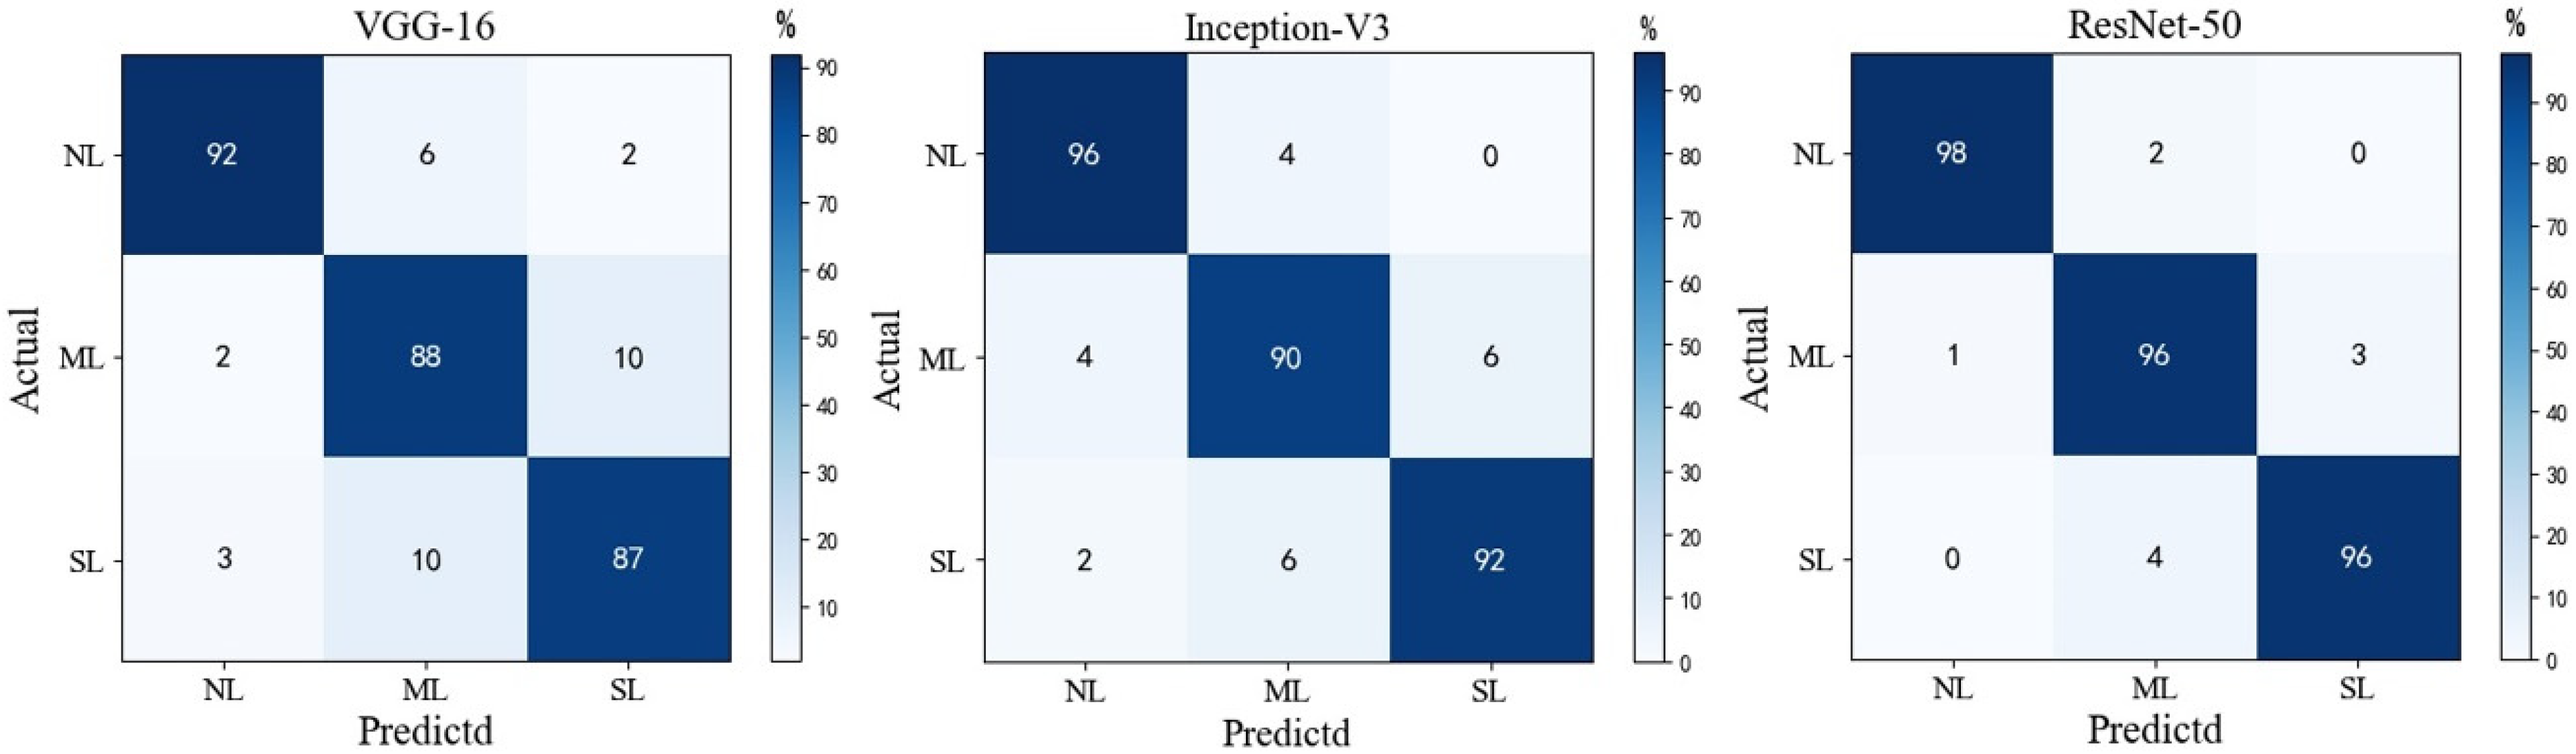
3.3. Lodging Classification Using Multispectral Images
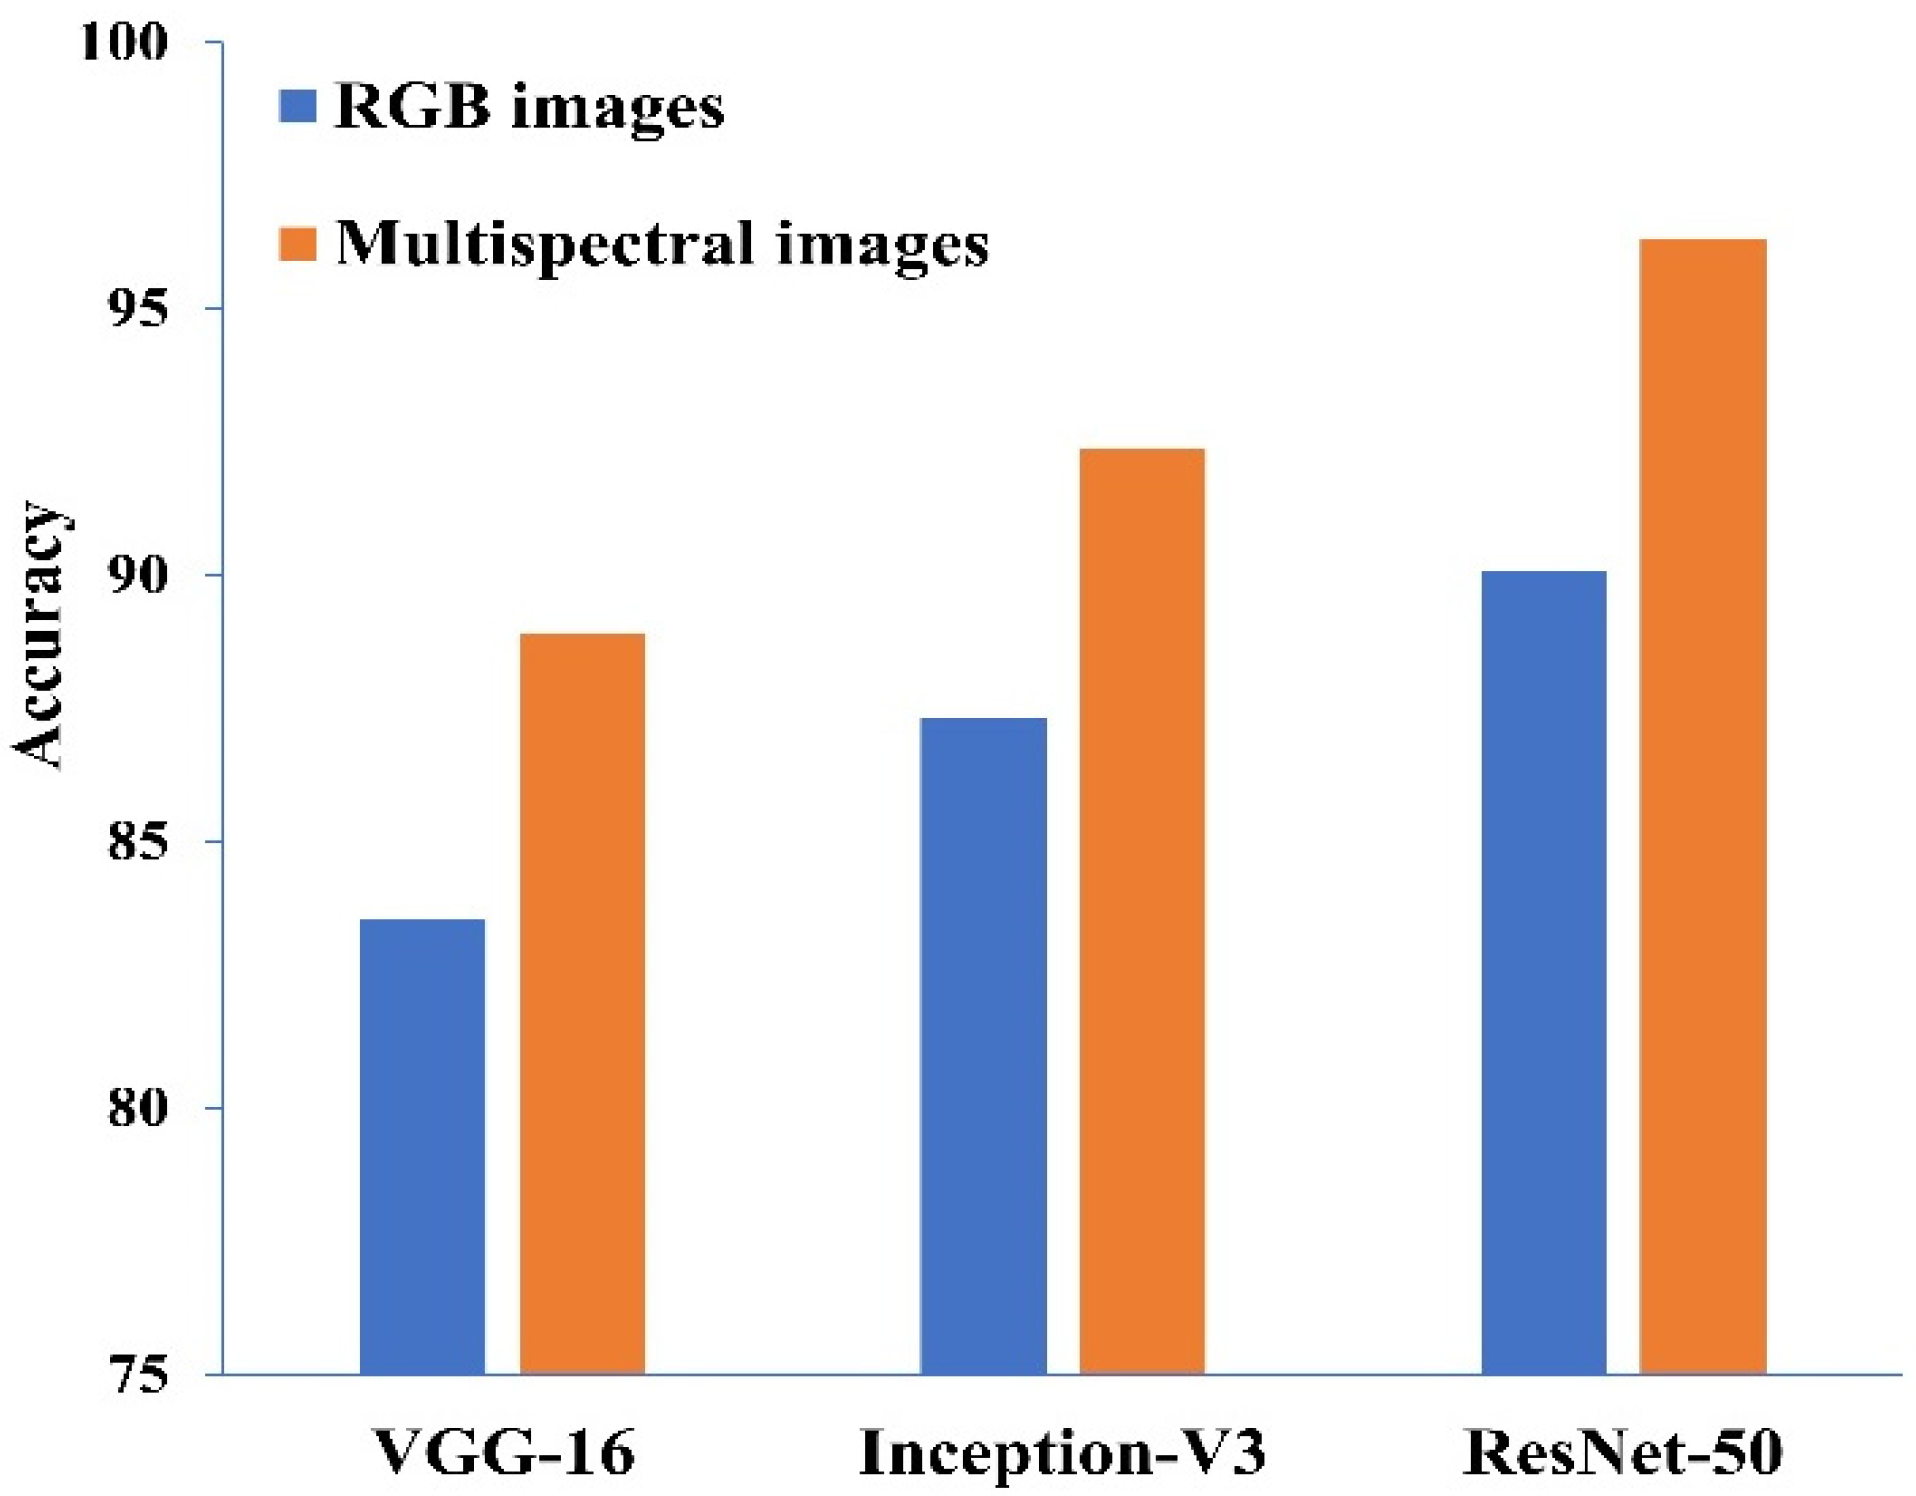
3.4. Classification Results
4. Discussion
5. Conclusions
Author Contributions
Funding
Institutional Review Board Statement
Informed Consent Statement
Data Availability Statement
Conflicts of Interest
References
- Wu, W.; Ma, B. A new method for assessing plant lodging and the impact of management options on lodging in canola crop production. Sci. Rep. 2016, 6, 31890. [Google Scholar] [CrossRef] [Green Version]
- Ma, D.; Xie, R.; Liu, X.; Niu, X.; Hou, P.; Wang, K.; Lu, Y.; Li, S. Lodging-related stalk characteristics of maize varieties in China since the 1950s. Crop Sci. 2014, 54, 2805–2814. [Google Scholar] [CrossRef]
- Sun, Q.; Gu, X.; Chen, L.; Xu, X.; Wei, Z.; Pan, Y.; Gao, Y. Monitoring maize canopy chlorophyll density under lodging stress based on UAV hyperspectral imagery. Comput. Electron. Agric. 2022, 193, 106671. [Google Scholar] [CrossRef]
- Shu, M.; Zhou, L.; Gu, X.; Ma, Y.; Sun, Q.; Yang, G.; Zhou, C. Monitoring of maize lodging using multi-temporal Sentinel-1 SAR data. Adv. Space Res. 2020, 65, 470–480. [Google Scholar] [CrossRef]
- Han, L.; Yang, G.; Yang, X.; Song, X.; Xu, B.; Li, Z.; Wu, J.; Yang, H.; Wu, J. An explainable XGBoost model improved by SMOTE-ENN technique for maize lodging detection based on multi-source unmanned aerial vehicle images. Comput. Electron. Agric. 2022, 194, 106804. [Google Scholar] [CrossRef]
- Islam, M.S.; Peng, S.; Visperas, R.M.; Ereful, N.; Bhuiya, M.S.U.; Julfiquar, A.W. Lodging-related morphological traits of hybrid rice in a tropical irrigated ecosystem. Field Crop. Res. 2007, 101, 240–248. [Google Scholar] [CrossRef]
- Guo, Y.; Hu, Y.; Chen, H.; Yan, P.; Du, Q.; Wang, Y.; Wang, H.; Wang, Z.; Kang, D.; Li, W.-X. Identification of traits and genes associated with lodging resistance in maize. Crop J. 2021, 9, 1408–1417. [Google Scholar] [CrossRef]
- Liu, T.; Li, R.; Zhong, X.; Jiang, M.; Jin, X.; Zhou, P.; Liu, S.; Sun, C.; Guo, W. Estimates of rice lodging using indices derived from UAV visible and thermal infrared images. Agric. For. Meteorol. 2018, 252, 144–154. [Google Scholar] [CrossRef]
- Sposaro, M.M.; Berry, P.M.; Sterling, M.; Hall, A.J.; Chimenti, C.A. Modelling root and stem lodging in sunflower. Field Crop. Res. 2010, 119, 125–134. [Google Scholar] [CrossRef]
- Zhang, P.; Gu, S.; Wang, Y.; Yang, R.; Yan, Y.; Zhang, S.; Sheng, D.; Cui, T.; Huang, S.; Wang, P. Morphological and mechanical variables associated with lodging in maize (Zea mays L.). Field Crop. Res. 2021, 269, 108178. [Google Scholar] [CrossRef]
- Bock, C.H.; Poole, G.H.; Parker, P.E.; Gottwald, T.R. Plant disease severity estimated visually, by digital photography and image analysis, and by hyperspectral imaging. Crit. Rev. Plant Sci. 2010, 29, 59–107. [Google Scholar] [CrossRef]
- Chu, T.; Starek, M.; Brewer, M.; Murray, S.; Pruter, L. Assessing lodging severity over an experimental maize (Zea mays L.) field Using UAS images. Remote Sens. 2017, 9, 923. [Google Scholar] [CrossRef] [Green Version]
- Jay, S.; Maupas, F.; Bendoula, R.; Gorretta, N. Retrieving LAI, chlorophyll and nitrogen contents in sugar beet crops from multi-angular optical remote sensing: Comparison of vegetation indices and PROSAIL inversion for field phenotyping. Field Crop. Res. 2017, 210, 33–46. [Google Scholar] [CrossRef] [Green Version]
- Chauhan, S.; Darvishzadeh, R.; Lu, Y.; Boschetti, M.; Nelson, A. Understanding wheat lodging using multi-temporal Sentinel-1 and Sentinel-2 data. Remote Sens. Environ. 2020, 243, 111804. [Google Scholar] [CrossRef]
- Sakamoto, T.; Shibayama, M.; Takada, E.; Inoue, A.; Morita, K.; Takahashi, W.; Miura, S.; Kimura, A. Detecting seasonal changes in crop community structure using day and night digital images. Photogramm. Eng. Remote Sens. 2010, 76, 713–726. [Google Scholar] [CrossRef]
- Liu, Z.; Li, C.; Wang, Y.; Huang, W.; Ding, X.; Zhou, B.; Wu, H.; Wang, D.; Shi, J. Comparison of spectral indices and principal component analysis for differentiating lodged rice crop from normal ones. In Computer and Computing Technologies in Agriculture V. IFIP Advances in Information and Communication Technology; Li, D., Chen, Y., Eds.; Springer: Berlin/Heidelberg, Germany, 2012; Volume 369, pp. 84–92. [Google Scholar]
- Murakami, T.; Yui, M.; Amaha, K. Canopy height measurement by photogrammetric analysis of aerial images: Application to buckwheat (Fagopyrum esculentum Moench) lodging evaluation. Comput. Electron. Agric. 2012, 89, 70–75. [Google Scholar] [CrossRef]
- Xiang, H.; Tian, L. Development of a low-cost agricultural remote sensing system based on an autonomous unmanned aerial vehicle (UAV). Biosyst. Eng. 2011, 108, 174–190. [Google Scholar] [CrossRef]
- Chapman, S.; Merz, T.; Chan, A.; Jackway, P.; Hrabar, S.; Dreccer, M.; Holland, E.; Zheng, B.; Ling, T.; Jimenez-Berni, J. Pheno-copter: A Low-altitude, autonomous remote-sensing robotic helicopter for high-throughput field-based phenotyping. Agronomy 2014, 4, 279–301. [Google Scholar] [CrossRef] [Green Version]
- Burkart, A.; Aasen, H.; Alonso, L.; Menz, G.; Bareth, G.; Rascher, U. Angular dependency of hyperspectral measurements over wheat characterized by a novel UAV based goniometer. Remote Sens. 2015, 7, 725–746. [Google Scholar] [CrossRef] [Green Version]
- Wang, J.-J.; Ge, H.; Dai, Q.; Ahmad, I.; Dai, Q.; Zhou, G.; Qin, M.; Gu, C. Unsupervised discrimination between lodged and non-lodged winter wheat: A case study using a low-cost unmanned aerial vehicle. Int. J. Remote Sens. 2018, 39, 2079–2088. [Google Scholar] [CrossRef]
- Molaei, B.; Chandel, A.; Peters, R.T.; Khot, L.R.; Vargas, J.Q. Investigating lodging in spearmint with overhead sprinklers compared to drag hoses using entropy values from low altitude RGB-imagery. Inf. Process. Agric. 2021, 9, 335–341. [Google Scholar] [CrossRef]
- Tan, S.; Mortensen, A.K.; Ma, X.; Boelt, B.; Gislum, R. Assessment of grass lodging using texture and canopy height distribution features derived from UAV visual-band images. Agric. For. Meteorol. 2021, 308, 108541. [Google Scholar] [CrossRef]
- Chauhan, S.; Darvishzadeh, R.; Lu, Y.; Stroppiana, D.; Boschetti, M.; Pepe, M.; Nelson, A. Wheat Lodging Assessment Using Multispectral UAV Data. Int. Arch. Photogramm. Remote Sens. Spat. Inf. Sci. 2019, XLII-2/W13, 235–240. [Google Scholar] [CrossRef] [Green Version]
- Sun, Q.; Sun, L.; Shu, M.; Gu, X.; Yang, G.; Zhou, L. Monitoring maize lodging grades via unmanned aerial vehicle multispectral Image. Plant Phenomics 2019, 2019, 1–16. [Google Scholar] [CrossRef] [PubMed] [Green Version]
- Yang, M.-D.; Huang, K.-S.; Kuo, Y.-H.; Tsai, H.; Lin, L.-M. Spatial and spectral hybrid image classification for rice lodging assessment through UAV imagery. Remote Sens. 2017, 9, 583. [Google Scholar] [CrossRef] [Green Version]
- Wilke, N.; Siegmann, B.; Klingbeil, L.; Burkart, A.; Kraska, T.; Muller, O.; van Doorn, A.; Heinemann, S.; Rascher, U. Quantifying lodging percentage and lodging severity using a UAV-based canopy height model combined with an objective threshold approach. Remote Sens. 2019, 11, 515. [Google Scholar] [CrossRef] [Green Version]
- Zhang, H.; Li, Y.; Zhang, Y.; Shen, Q. Spectral-spatial classification of hyperspectral imagery using a dual-channel convolutional neural network. Remote Sens. Lett. 2017, 8, 438–447. [Google Scholar] [CrossRef] [Green Version]
- Hao, X.; Jia, J.; Khattak, A.M.; Zhang, L.; Guo, X.; Gao, W.; Wang, M. Growing period classification of Gynura bicolor DC using GL-CNN. Comput. Electron. Agric. 2020, 174, 105497. [Google Scholar] [CrossRef]
- Paymode, A.S.; Malode, V.B. Transfer learning for multi-crop leaf disease image classification using convolutional neural network VGG. Artif. Intell. Agric. 2022, 6, 23–33. [Google Scholar] [CrossRef]
- Zhang, Z.; Flores, P.; Igathinathane, C.; Naik, D.L.; Kiran, R.; Ransom, J.K. Wheat lodging detection from UAS imagery using machine learning algorithms. Remote Sens. 2020, 12, 1838. [Google Scholar] [CrossRef]
- Subetha, T.; Khilar, R.; Christo, M.S. A comparative analysis on plant pathology classification using deep learning architecture–Resnet and VGG19. Mater. Today Proc. 2021. [Google Scholar] [CrossRef]
- Zhao, Y.; Sun, C.; Xu, X.; Chen, J. RIC-Net: A plant disease classification model based on the fusion of inception and residual structure and embedded attention mechanism. Comput. Electron. Agric. 2022, 193, 106644. [Google Scholar] [CrossRef]
- Zhang, H.; Feng, L.; Zhang, X.; Yang, Y.; Li, J. Necessary conditions for convergence of CNNs and initialization of convolution kernels. Digit. Signal Process. 2022, 123, 103397. [Google Scholar] [CrossRef]
- Simonyan, K.; Zisserman, A. Very deep convolutional networks for large-scale image recognition. arXiv 2015, arXiv:1409.1556. [Google Scholar]
- Szegedy, C.; Vanhoucke, V.; Ioffe, S.; Shlens, J.; Wojna, Z. Rethinking the inception architecture for computer vision. In Proceedings of the 2016 IEEE Conference on Computer Vision and Pattern Recognition (CVPR), Las Vegas, NV, USA, 27–30 June 2016; pp. 2818–2826. [Google Scholar]
- Lu, Z.; Bai, Y.; Chen, Y.; Su, C.; Lu, S.; Zhan, T.; Hong, X.; Wang, S. The classification of gliomas based on a pyramid dilated convolution resnet model. Pattern Recognit. Lett. 2020, 133, 173–179. [Google Scholar] [CrossRef]
- Glorot, X.; Bengio, Y. Understanding the difficulty of training deep feedforward neural networks. In Proceedings of the Thirteenth International Conference on Artificial Intelligence and Statistics, Sardinia, Italy, 13–15 May 2010; pp. 249–256. [Google Scholar]
- Kumpumaki, T.; Linna, P.; Lipping, T. Crop lodging analysis from UAS orthophoto mosaic, sentinel-2 image and crop yield monitor data. In Proceedings of the IGARSS 2018: IEEE International Geoscience and Remote Sensing Symposium, Valencia, Spain, 23–27 July 2018. [Google Scholar]
- Ampatzidis, Y.; Partel, V. UAV-based high throughput phenotyping in citrus utilizing multispectral imaging and artificial intelligence. Remote Sens. 2019, 11, 410. [Google Scholar] [CrossRef] [Green Version]
- Rajapaksa, S. Classification of crop lodging with gray level co-occurrence matrix. In Proceedings of the 2018 IEEE Winter Conference on Applications of Computer Vision (WACV), Lake Tahoe, NV, USA, 12–15 March 2018. [Google Scholar]


| Bands | Blue | Green | Red | |
|---|---|---|---|---|
| Extents | ||||
| Non-lodging | 82.49 | 103.99 | 94.84 | |
| Moderate lodging | 113.54 | 126.54 | 121.14 | |
| Severe lodging | 126.88 | 138.20 | 133.55 | |
| Bands | Green | Red | Red Edge | Near-Infrared | |
|---|---|---|---|---|---|
| Extents | |||||
| Non-lodging | 0.31 | 0.24 | 0.41 | 0.53 | |
| Moderate lodging | 0.33 | 0.27 | 0.49 | 0.60 | |
| Severe lodging | 0.37 | 0.30 | 0.56 | 0.64 | |
| Algorithms | Test Accuracy | Kappa |
|---|---|---|
| VGG-16 | 83.55% | 0.7421 |
| Inception-V3 | 87.32% | 0.8040 |
| ResNet-50 | 90.08% | 0.8599 |
| Algorithms | Test Accuracy | Kappa |
|---|---|---|
| VGG-16 | 88.91% | 0.8318 |
| Inception-V3 | 92.36% | 0.8935 |
| ResNet-50 | 96.32% | 0.9551 |
Publisher’s Note: MDPI stays neutral with regard to jurisdictional claims in published maps and institutional affiliations. |
© 2022 by the authors. Licensee MDPI, Basel, Switzerland. This article is an open access article distributed under the terms and conditions of the Creative Commons Attribution (CC BY) license (https://creativecommons.org/licenses/by/4.0/).
Share and Cite
Yang, X.; Gao, S.; Sun, Q.; Gu, X.; Chen, T.; Zhou, J.; Pan, Y. Classification of Maize Lodging Extents Using Deep Learning Algorithms by UAV-Based RGB and Multispectral Images. Agriculture 2022, 12, 970. https://doi.org/10.3390/agriculture12070970
Yang X, Gao S, Sun Q, Gu X, Chen T, Zhou J, Pan Y. Classification of Maize Lodging Extents Using Deep Learning Algorithms by UAV-Based RGB and Multispectral Images. Agriculture. 2022; 12(7):970. https://doi.org/10.3390/agriculture12070970
Chicago/Turabian StyleYang, Xin, Shichen Gao, Qian Sun, Xiaohe Gu, Tianen Chen, Jingping Zhou, and Yuchun Pan. 2022. "Classification of Maize Lodging Extents Using Deep Learning Algorithms by UAV-Based RGB and Multispectral Images" Agriculture 12, no. 7: 970. https://doi.org/10.3390/agriculture12070970