Article

Safety Evaluation on a Fastening Device of an Agricultural By-Product Collector for Hard Flat Ground Driving

by
Jeong-Hun Kim
1,2,†,
Markumningsih Sri
1,3,† and
Ju-Seok Nam
1,2,*
1
Department of Biosystems Engineering, College of Agriculture and Life Sciences, Kangwon National University, Chuncheon 24341, Korea
2
Interdisciplinary Program in Smart Agriculture, Kangwon National University, Chuncheon 24341, Korea
3
Department of Agricultural and Biosystems Engineering, Faculty of Agricultural Technology, Universitas Gadjah Mada, Yogyakarta 55281, Indonesia
*
Author to whom correspondence should be addressed.
These authors contributed equally to this work.
Agriculture 2022, 12(7), 1071; https://doi.org/10.3390/agriculture12071071
Submission received: 27 June 2022 / Revised: 13 July 2022 / Accepted: 20 July 2022 / Published: 21 July 2022
(This article belongs to the Section Agricultural Product Quality and Safety)

Abstract

:
In this study, the static safety factor and fatigue life of fastening devices of an agricultural by-product collector were evaluated under hard flat ground driving conditions. The strain gage-based measurement system was constructed, and the strain gage was attached on the highest stress spot of the fastening devices derived from structural analysis. The static safety factor and fatigue life of the fastening devices were calculated using the measured strain values and by converting it into stress data. The two operating conditions are considered to be the loading part of the by-product collector, lifted and non-lifted. The results for all fastening devices showed that the static safety factor was larger than 1.0 and the fatigue life was much greater than the expected lifetime under both operating conditions. Therefore, it can be concluded that the fastening devices of the by-product collector can be operated reliably under hard flat ground driving conditions. In future work, we plan to evaluate the safety of the fastening devices in various actual orchard farm environments.

1. Introduction

When a material is subjected to repeated stress for a long time, fatigue proceeds and fractures occur; this phenomenon is called fatigue failure [1,2,3]. In addition, the time or number of loading cycles until the material subjected to repeated load fails is called fatigue life. In fact, most of the causes of mechanical and structural damage are reported to be due to fatigue, resulting in loss of life and property [4]. In order to minimize these losses, it is important to accurately determine the fatigue life of the material and reflect it in the design [5]. This is also important in the design of agricultural machinery. In order to accurately evaluate the fatigue life of agricultural machinery, the magnitude and frequency of load that occur during actual agricultural work should be measured [6,7]. However, this is not easy because it is time-consuming and costly.
Hwang et al. performed a conceptual design of an agricultural by-product collector to directly collect or process agricultural by-products [8]. Considering the characteristics of the cultivation environment of fruit trees, which are the main target crops, the agricultural by-product collectors are mainly operated off-site. When the agricultural by-product collector moves in an off-road working environment with a lot of gravel, stones, and obstacles, there is a high possibility that the fragile part will be damaged by repeated loads and stresses. Therefore, it is necessary to evaluate the fatigue life of the vulnerable part of the agricultural by-product collector in order to increase the safety of the worker and prevent damage and breakdown.
Fatigue life is predicted through the S–N curve indicating the number of stress cycles and the frequency of repeated stress was identified through the rain-flow counting method. Studies to evaluate the fatigue life of machines and structures through the rain-flow counting method and the S–N curve have been conducted in various fields. Kim et al. measured the stress of the rail under KTX running and calculated the equivalent stress through the rain-flow counting method, then the fatigue life of ground rail was predicted using the Modified Miner’s rule [9]. Cho et al. derived the stress profiles of the carrier weak points using commercial FE software and predicted the fatigue life of a planet carrier of a slewing reducer for a tower crane using the equivalent stress range, an S–N curve and the cumulative damage law [10]. Lee et al. constructed a load spectrum for torque and traction force generated during plowing in dry land and derived the fatigue life of the plow through the S–N curve of the material [11]. Paraforos et al. developed a sensor frame attached on a tractor 3-point hitch to measure the field profiles and the driving stress. Additionally, they derived the fatigue life of the 3-point hitch using a rain-flow counting method [12]. Paraforos et al. attached 28 strain gages to the rotary swather to measure the load generated when driving farmland and general roads, and derived the fatigue life [13]. Kepka et al. measured stress spectra and evaluated fatigue life using S–N curves for different materials of T-joint [14]. Han et al. measured the traction force of the tractor-mounted garlic–onion harvester through field experiments, and derived the fatigue life based on the rain-flow counting method and the Goodman equation [15].
In this study, the stress generated in the fastening device, which is a weak part, was measured when the agricultural by-product collector designed by Hwang et al. [8] was running, and the fatigue life was derived using a commercial analysis program. A theoretical analysis was performed to derive the fatigue life, and the process of a commercial analysis program was constructed based on the results of the theoretical analysis. In addition, by utilizing the rain-flow counting method, the equivalent completely reversed stress was derived and the load spectrum was constructed.

2. Materials and Methods

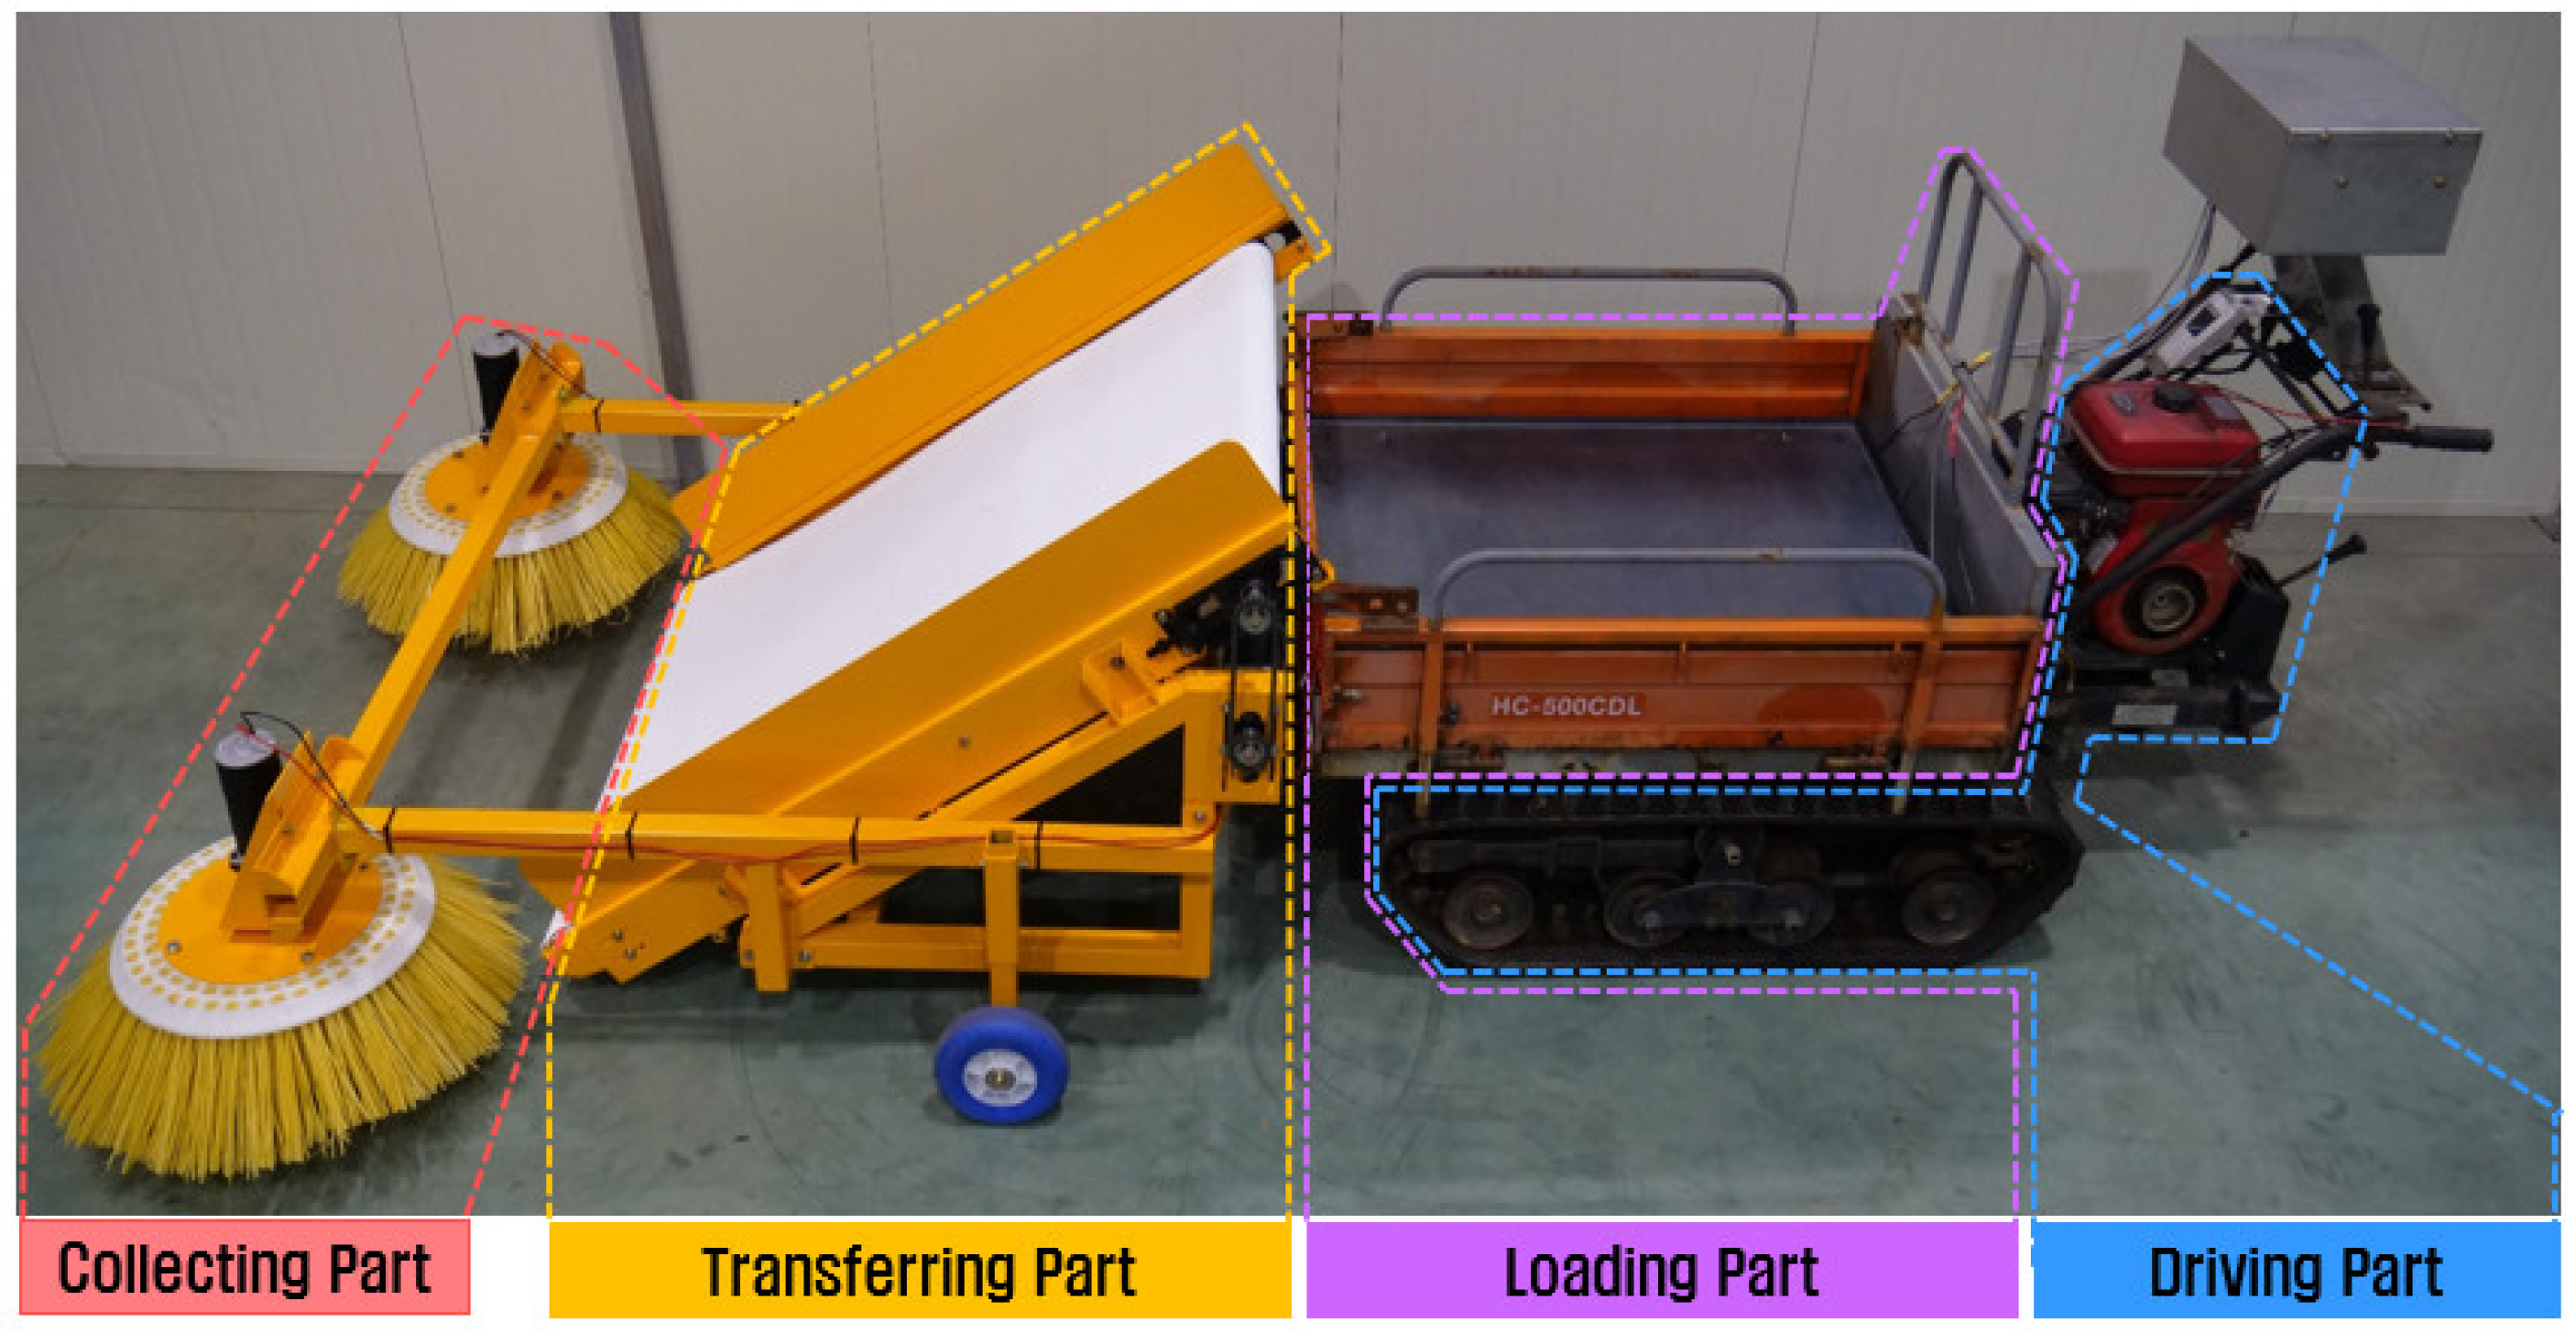
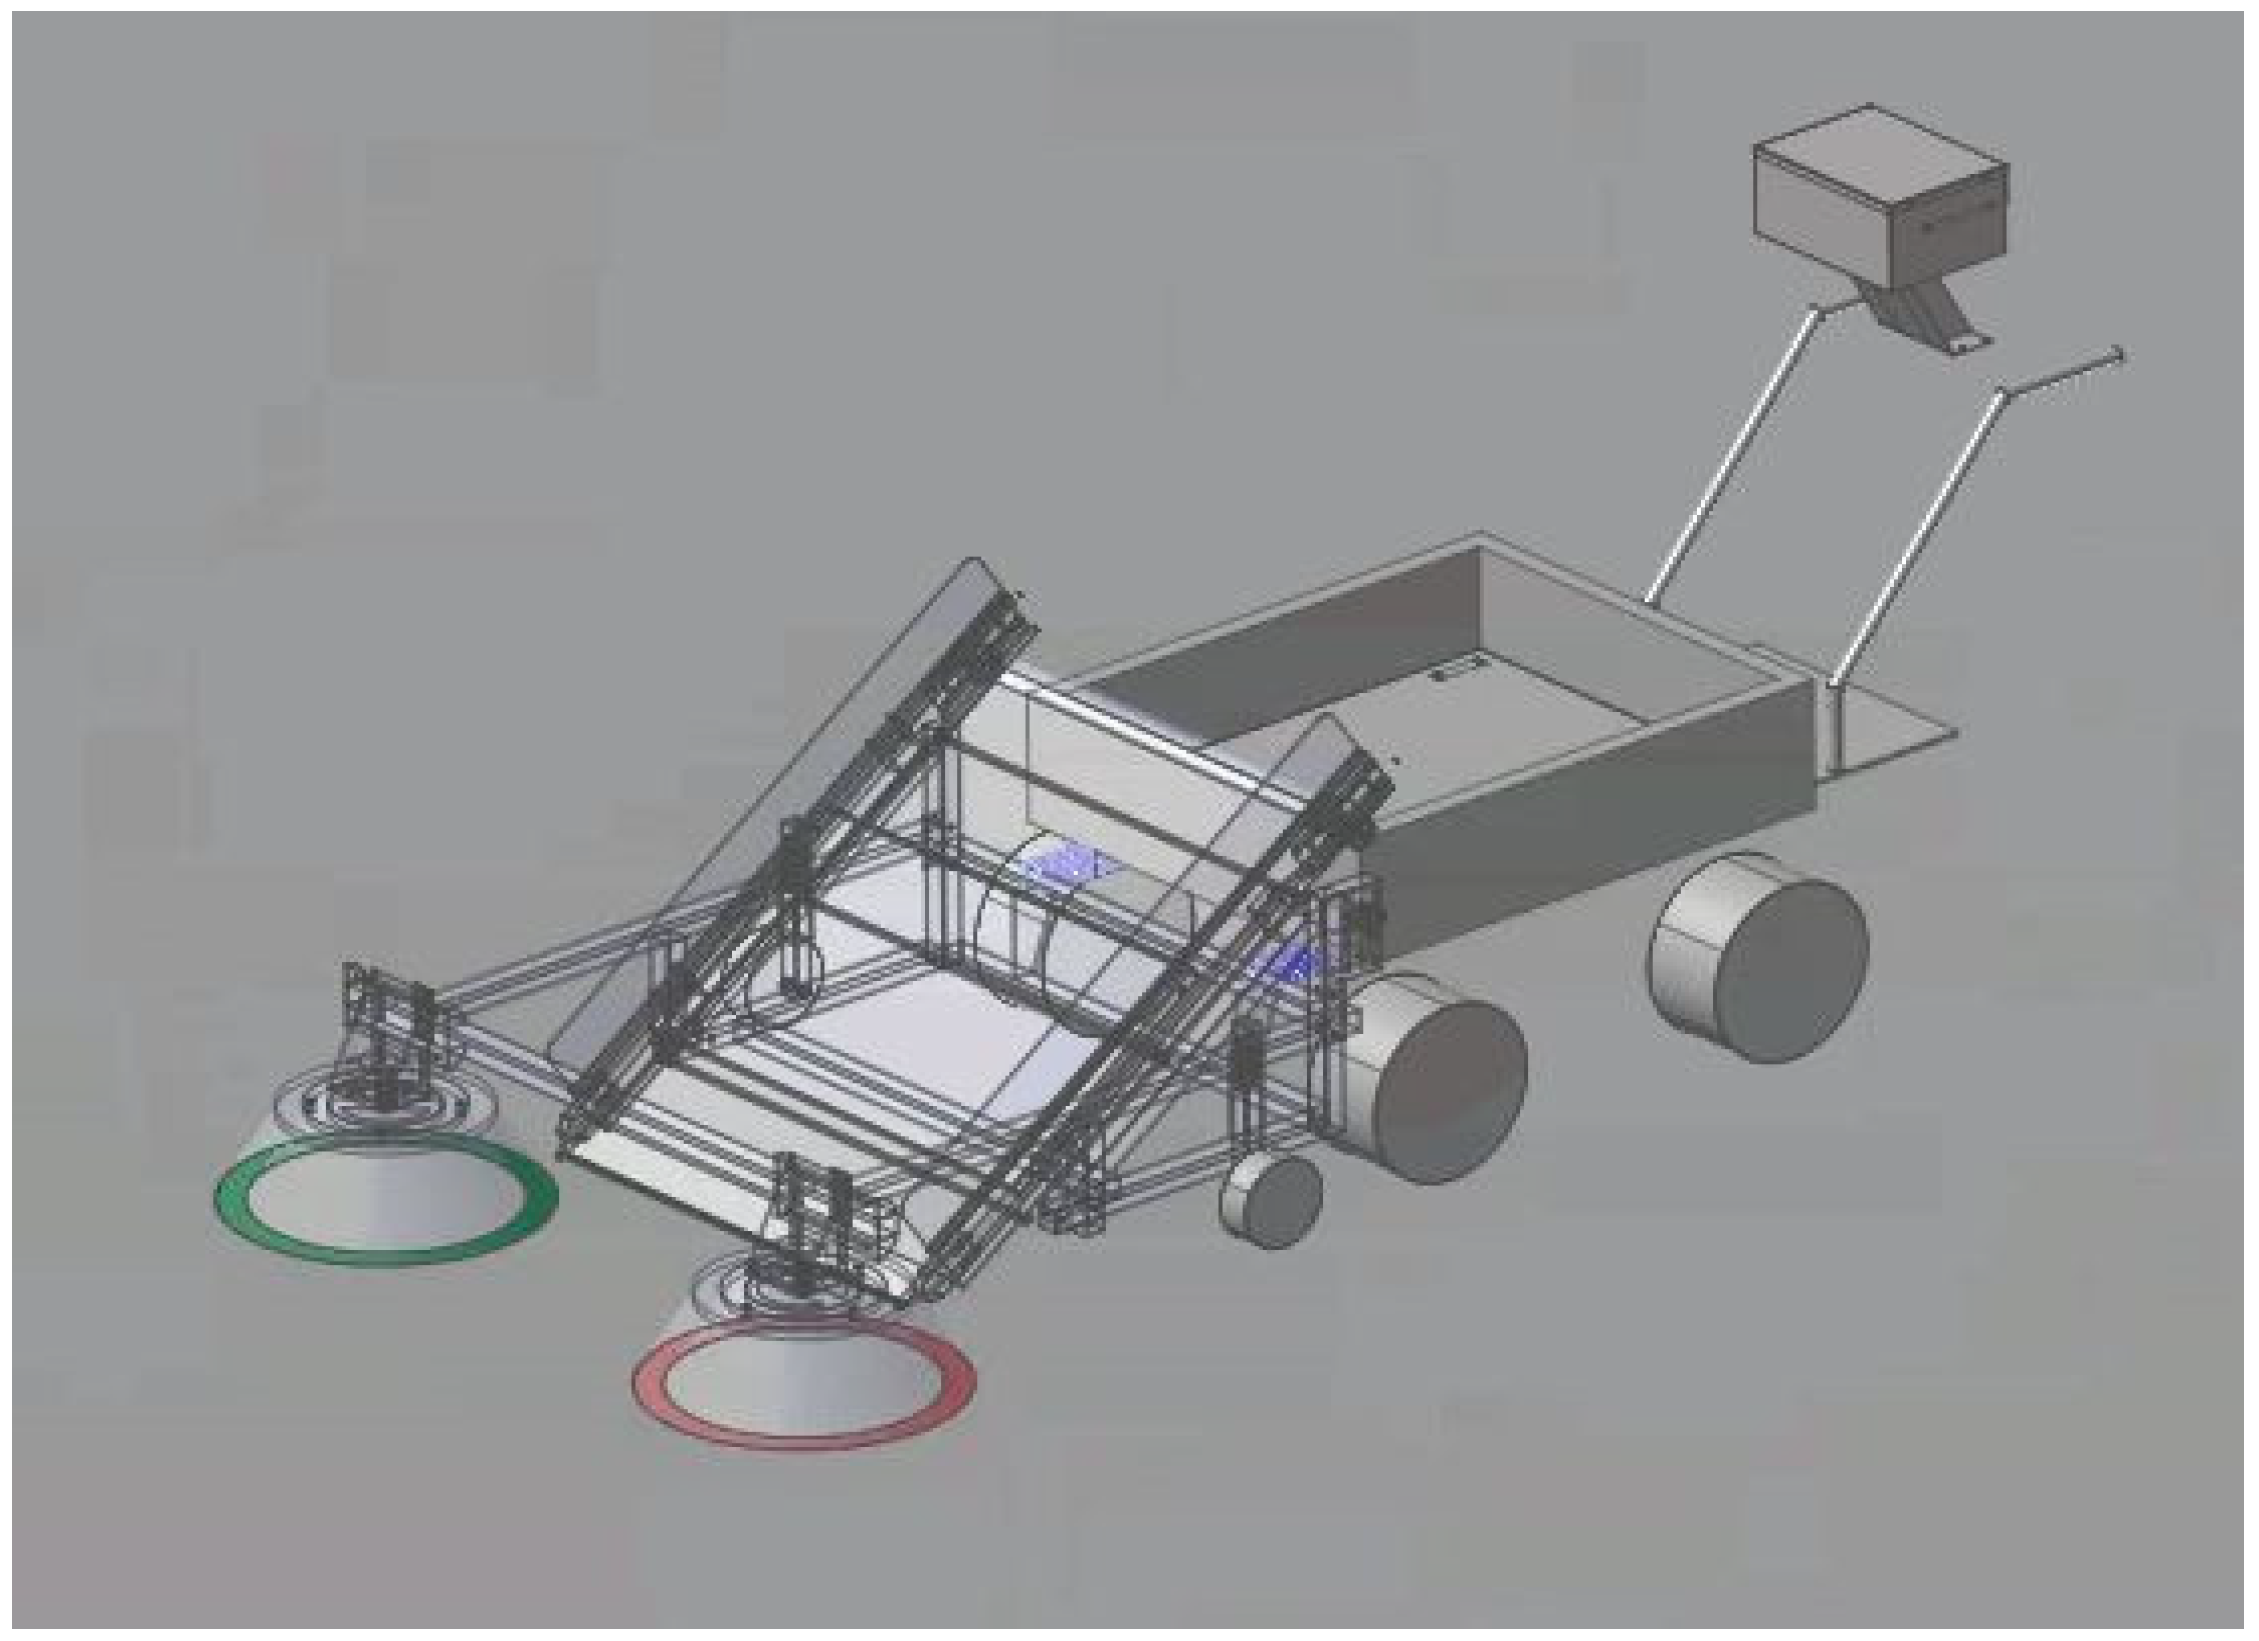
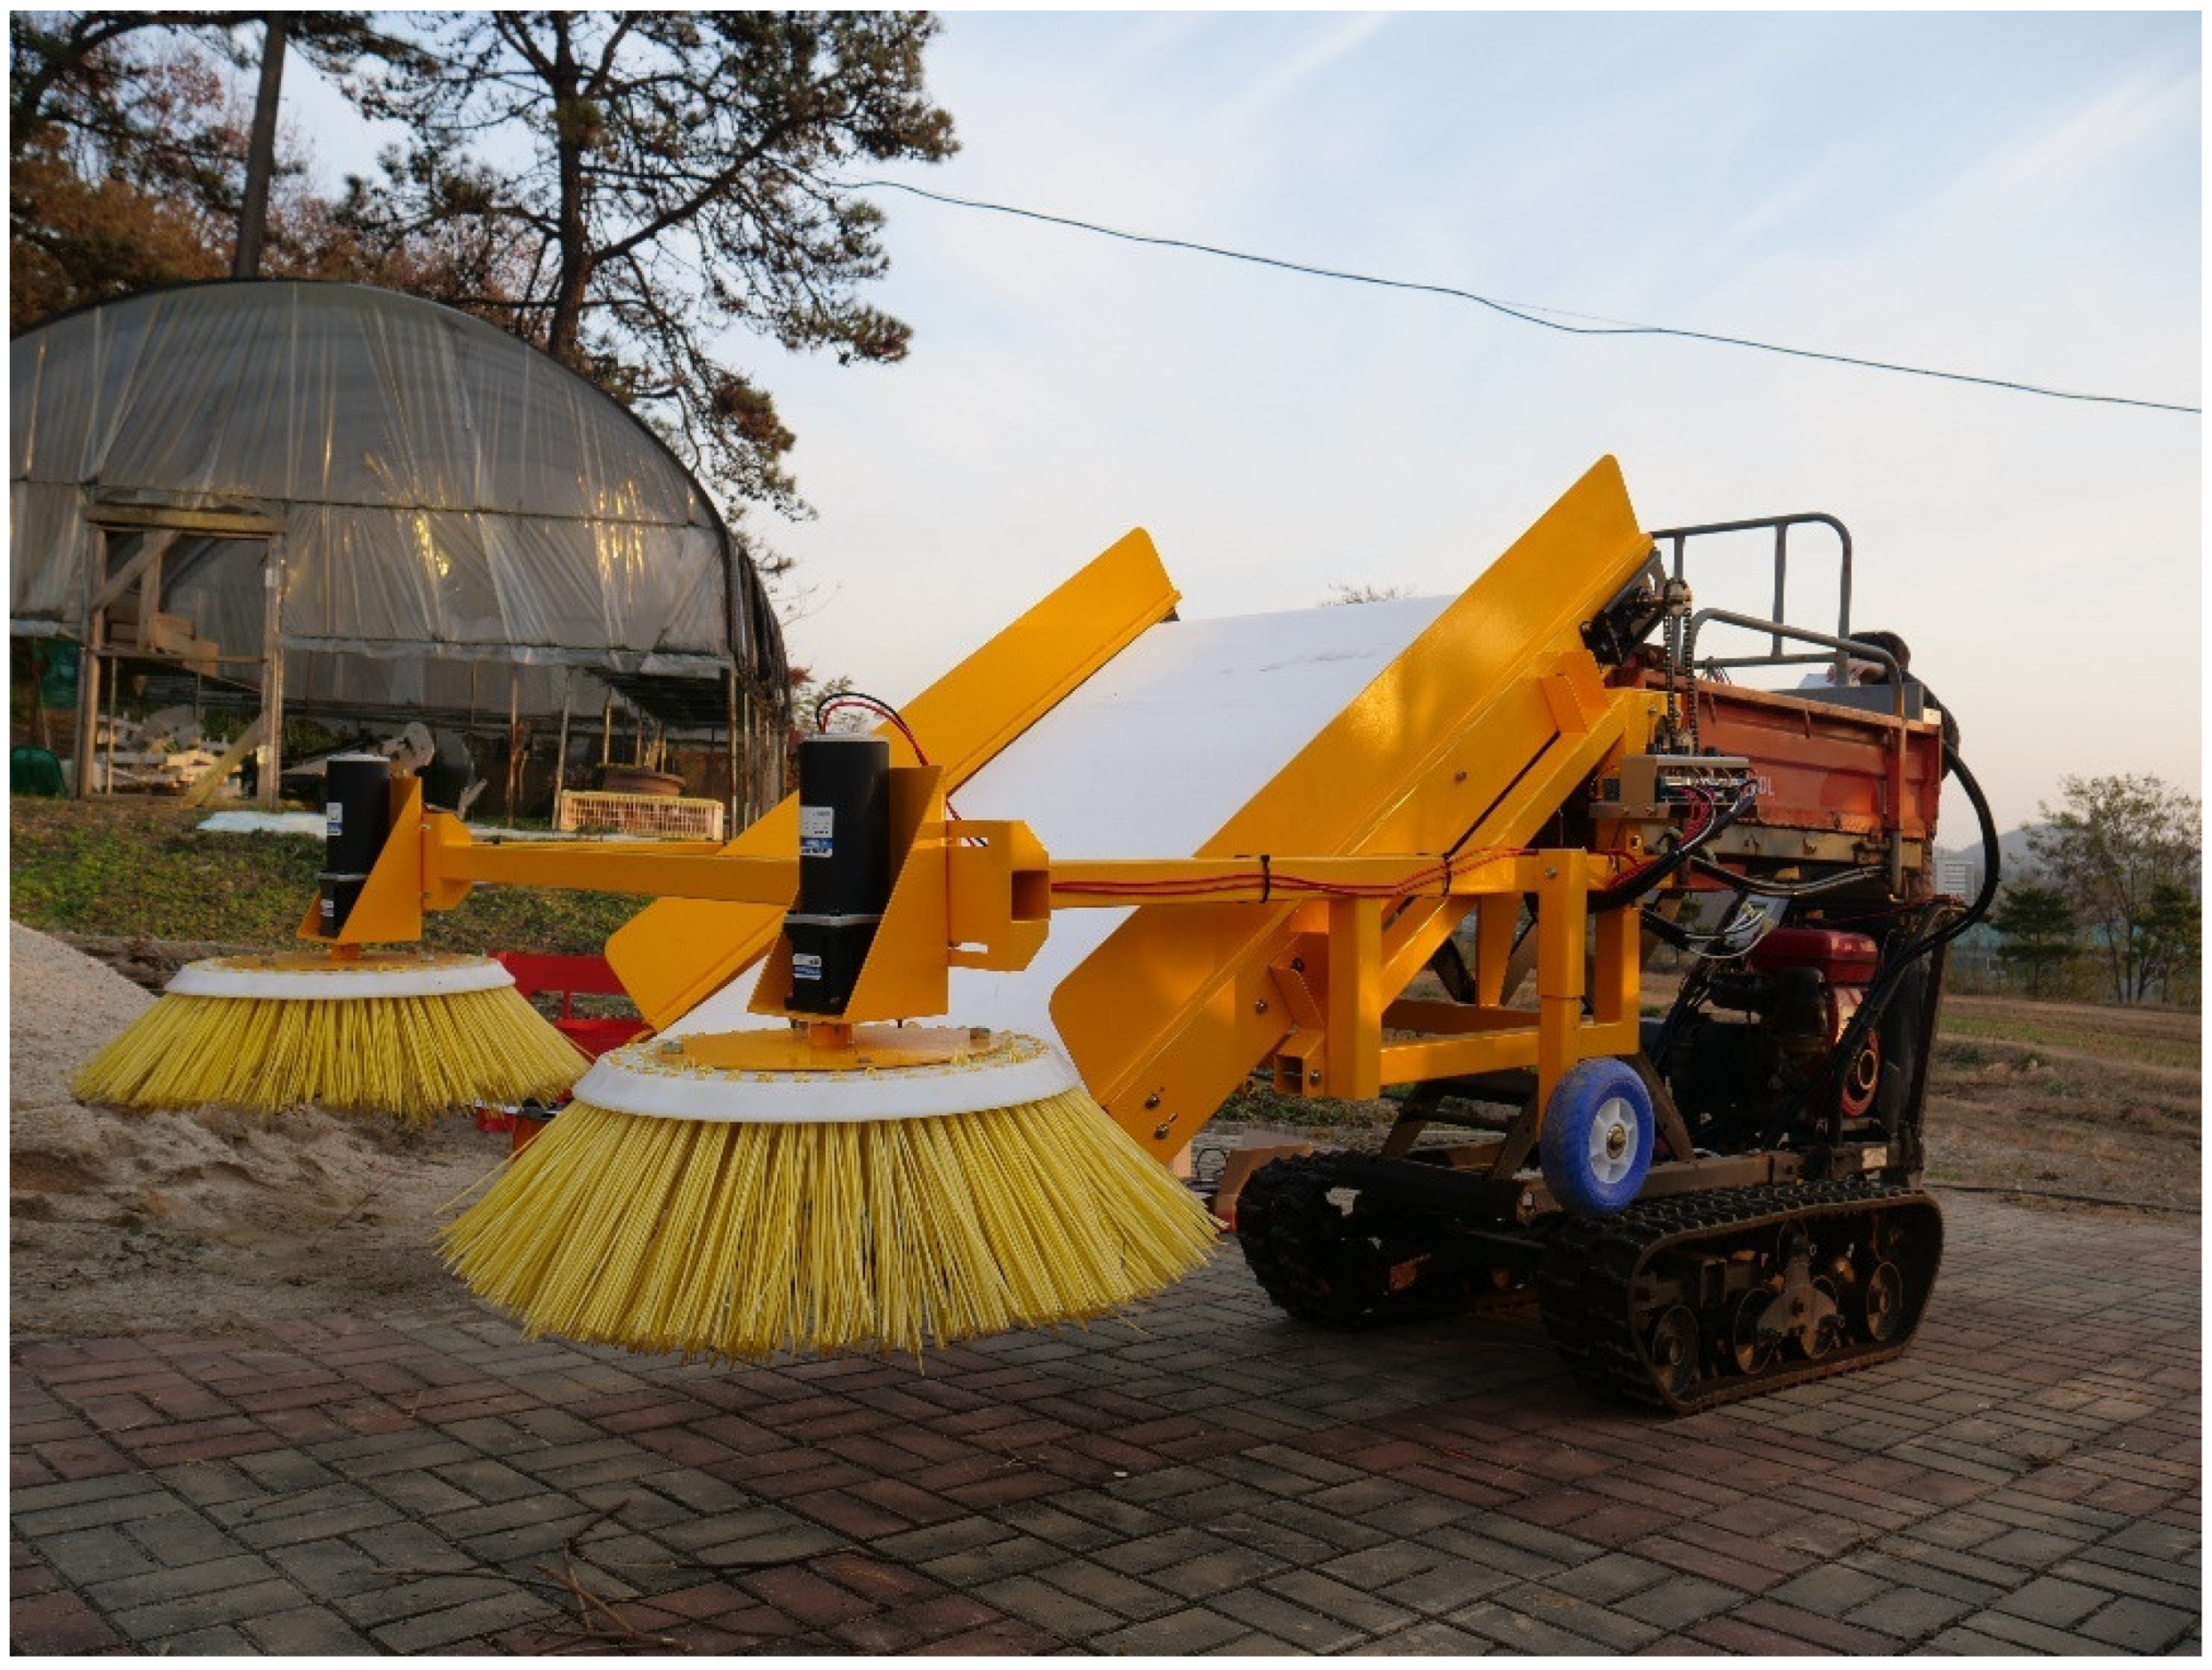
2.1. Agricultural By-Product Collector

The shape of the agricultural by-product collector used in this study is shown in Figure 1. The agricultural by-product collector consists of a collecting part, a transferring part, a loading part, and a driving part. The collecting part/transferring part and the loading part/driving part are connected by a fastening device and are designed for easy attachment and detachment. The characteristics and functions of each part of the agricultural by-product collector are as follows:
(1)
Collecting part: ADC motor is used as a power source to rotate the collecting brush, and the two rotating collecting brushes collect agricultural by-products in the center.
(2)
Transferring part: A conveyor belt is operated using a chain-sprocket and a DC motor, and agricultural by-product collected in the center by the collecting brush are transferred to the loading unit through the conveyor belt.
(3)
Loading part: The transferred agricultural by-products can be loaded, and the maximum loading weight is 100 kg. The size of the loading box was designed to be 900 × 1100 × 450 mm based on the size of the target crop, the fruit tree pruning branch. In addition, the loading box can be raised by applying the lift function.
(4)
Driving part: By applying a caterpillar track, it is possible to steer forward/reverse and left/right.
(5)
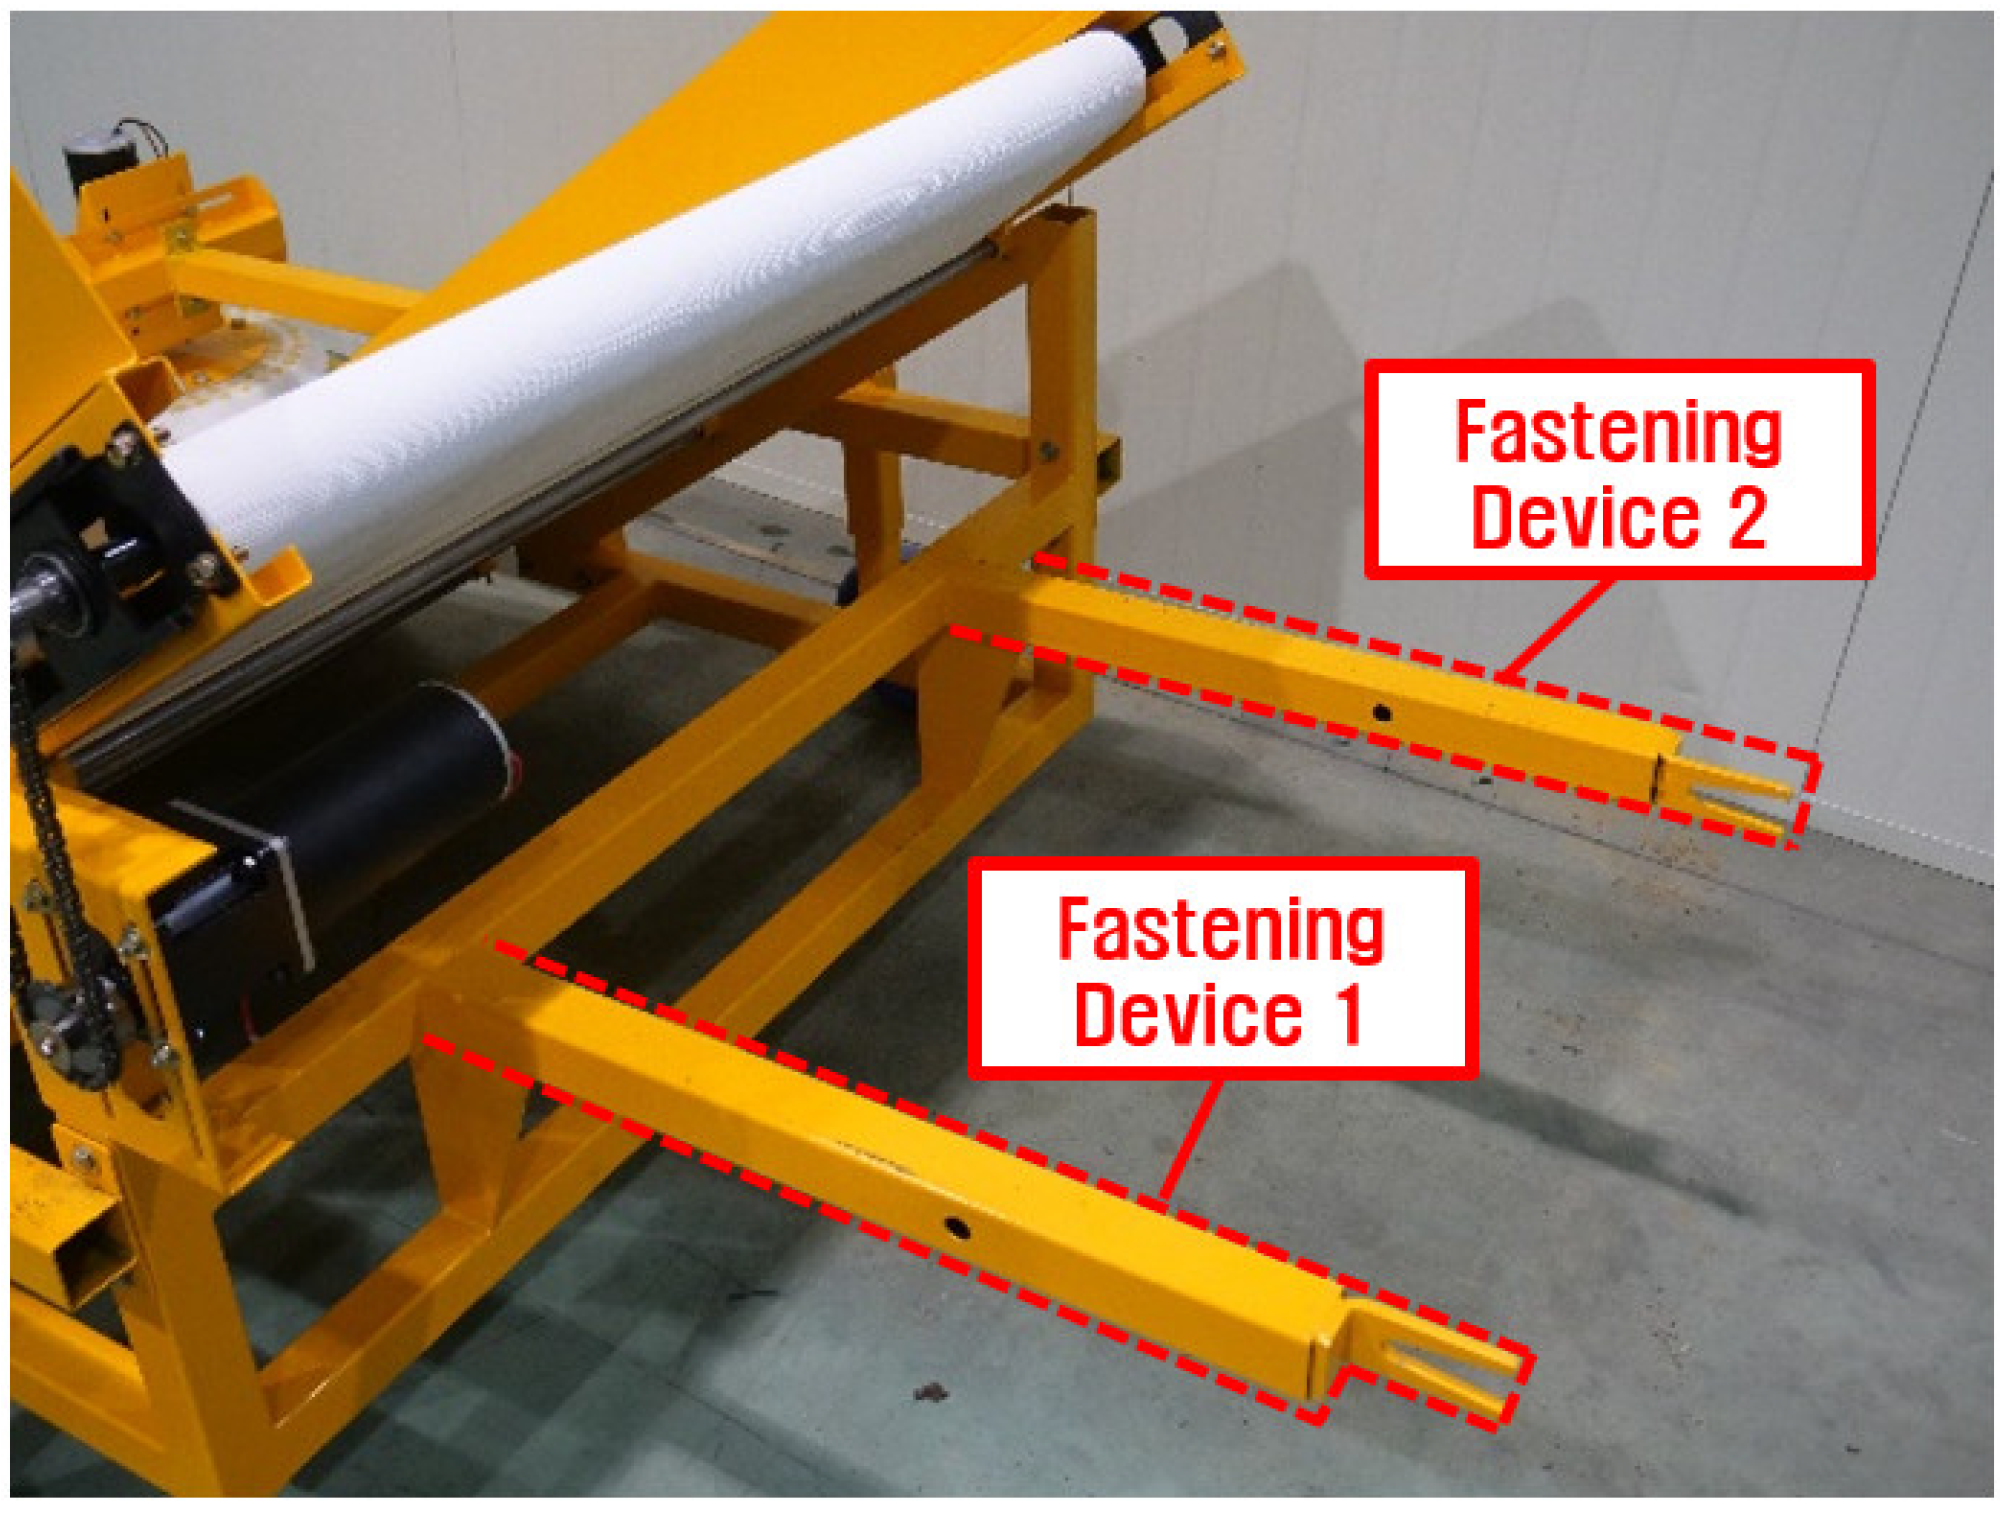
Fastening device: The shape of the fastening device is shown in Figure 2, it is designed to be fastened to the frame located at the bottom of the loading part in the form of a cantilever derived from the collecting/transferring part.
The fastening device has a structurally weak cantilever shape and is subjected with a large load because it has to support the self-weight of the collecting part/transferring part. When the agricultural by-product collector works on flat ground, it can be determined as the structurally weakest part, so it is necessary to analyze the fatigue life of the fastening device to determine the safety of the agricultural by-product collector.

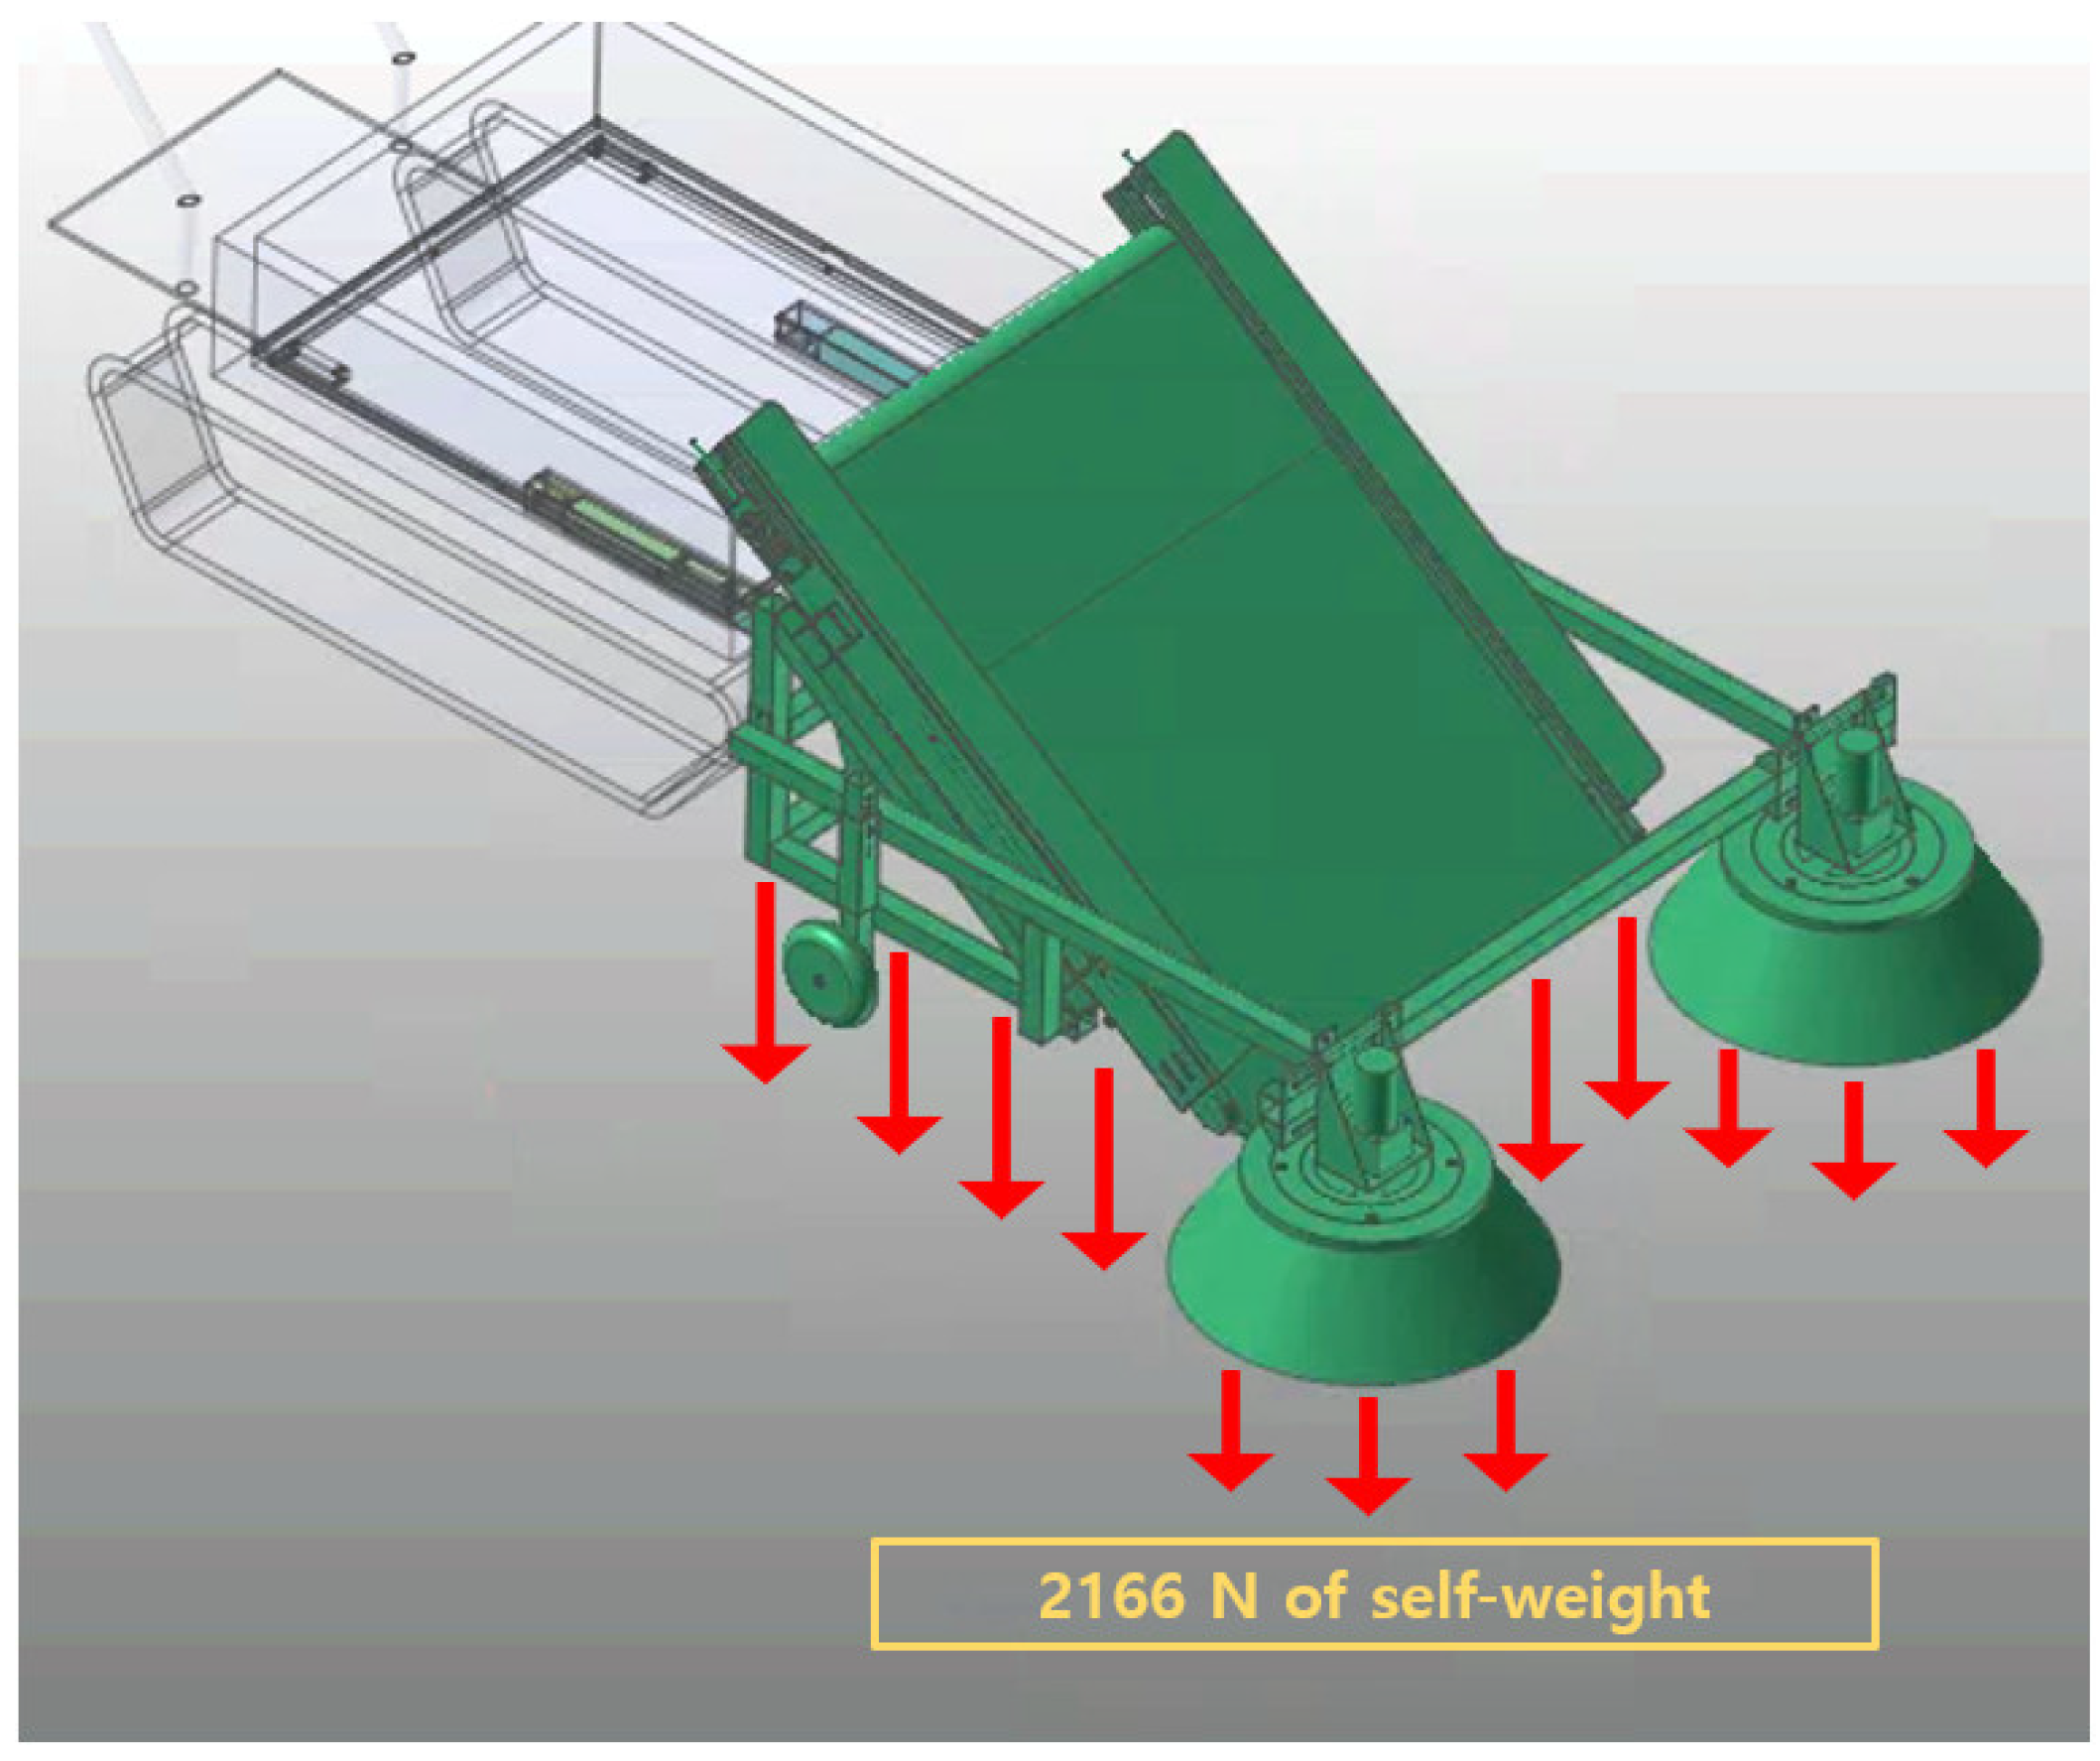
2.2. Structural Analysis of Agricultural By-Product Collector Fastening Device

Structural analysis was performed using a commercial simulation program (Recurdyn V8R5, Functionbay, Seongnam, Korea) to determine the location of the maximum stress spot in the fastening device of the agricultural by-product collector. For the simulation, the actual shape of the agricultural by-product collector was modeled in three dimensions (Figure 3), and the actual physical properties and simulation parameters for each part of the agricultural by-product collector were input through literature research [16,17,18,19,20]. The physical properties and parameters of each part are shown in Table 1. The gravitational acceleration was set to act vertically downward with a magnitude of 9.81 m/s2, and the ground was assumed to be a rigid body. In addition, air resistance generated during driving was neglected. Reflecting the actual conditions, the fastening device of the agricultural by-product collector was set to support all of the 2166 N self-weight of the collecting/transferring part (Figure 4). The shape of the grid for the flexible body stress analysis is a triangle, and the size is 12.0–16.1 mm, depending on the location.
As a result of structural analysis of the fastening device of the agricultural by-product collector, a maximum stress of 158.97 MPa occurred at the upper end of the fastening device at a distance of 17.5 cm from the frame of transferring part of agricultural by-product collector (Figure 5).

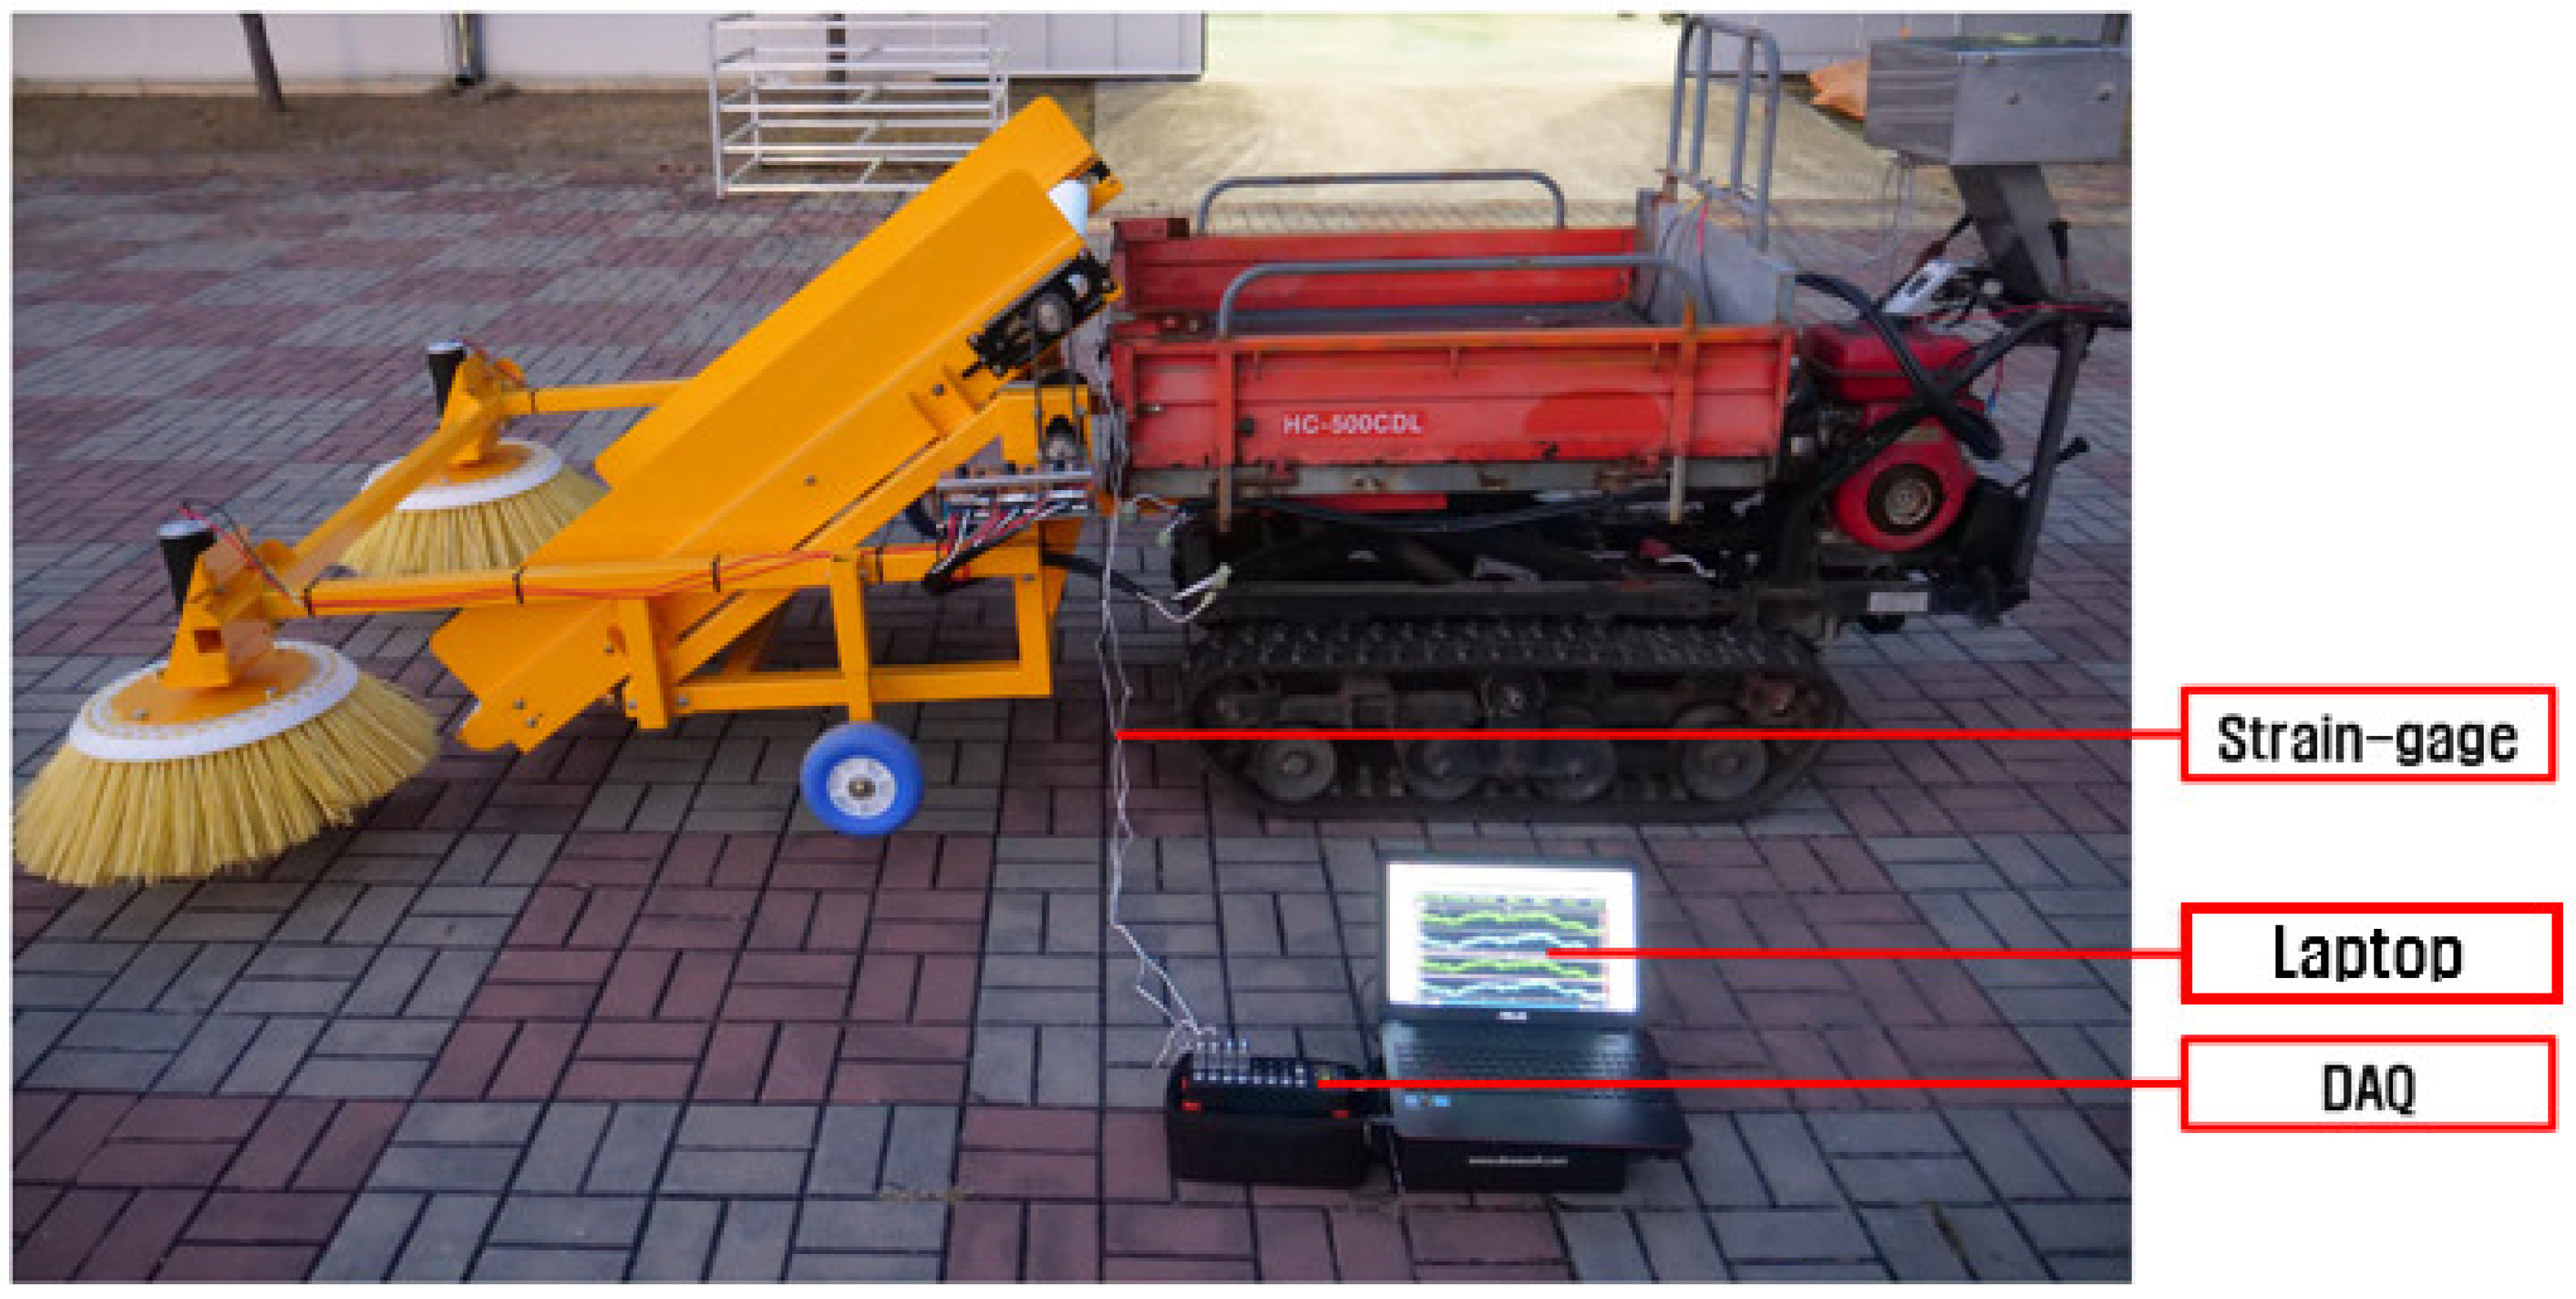
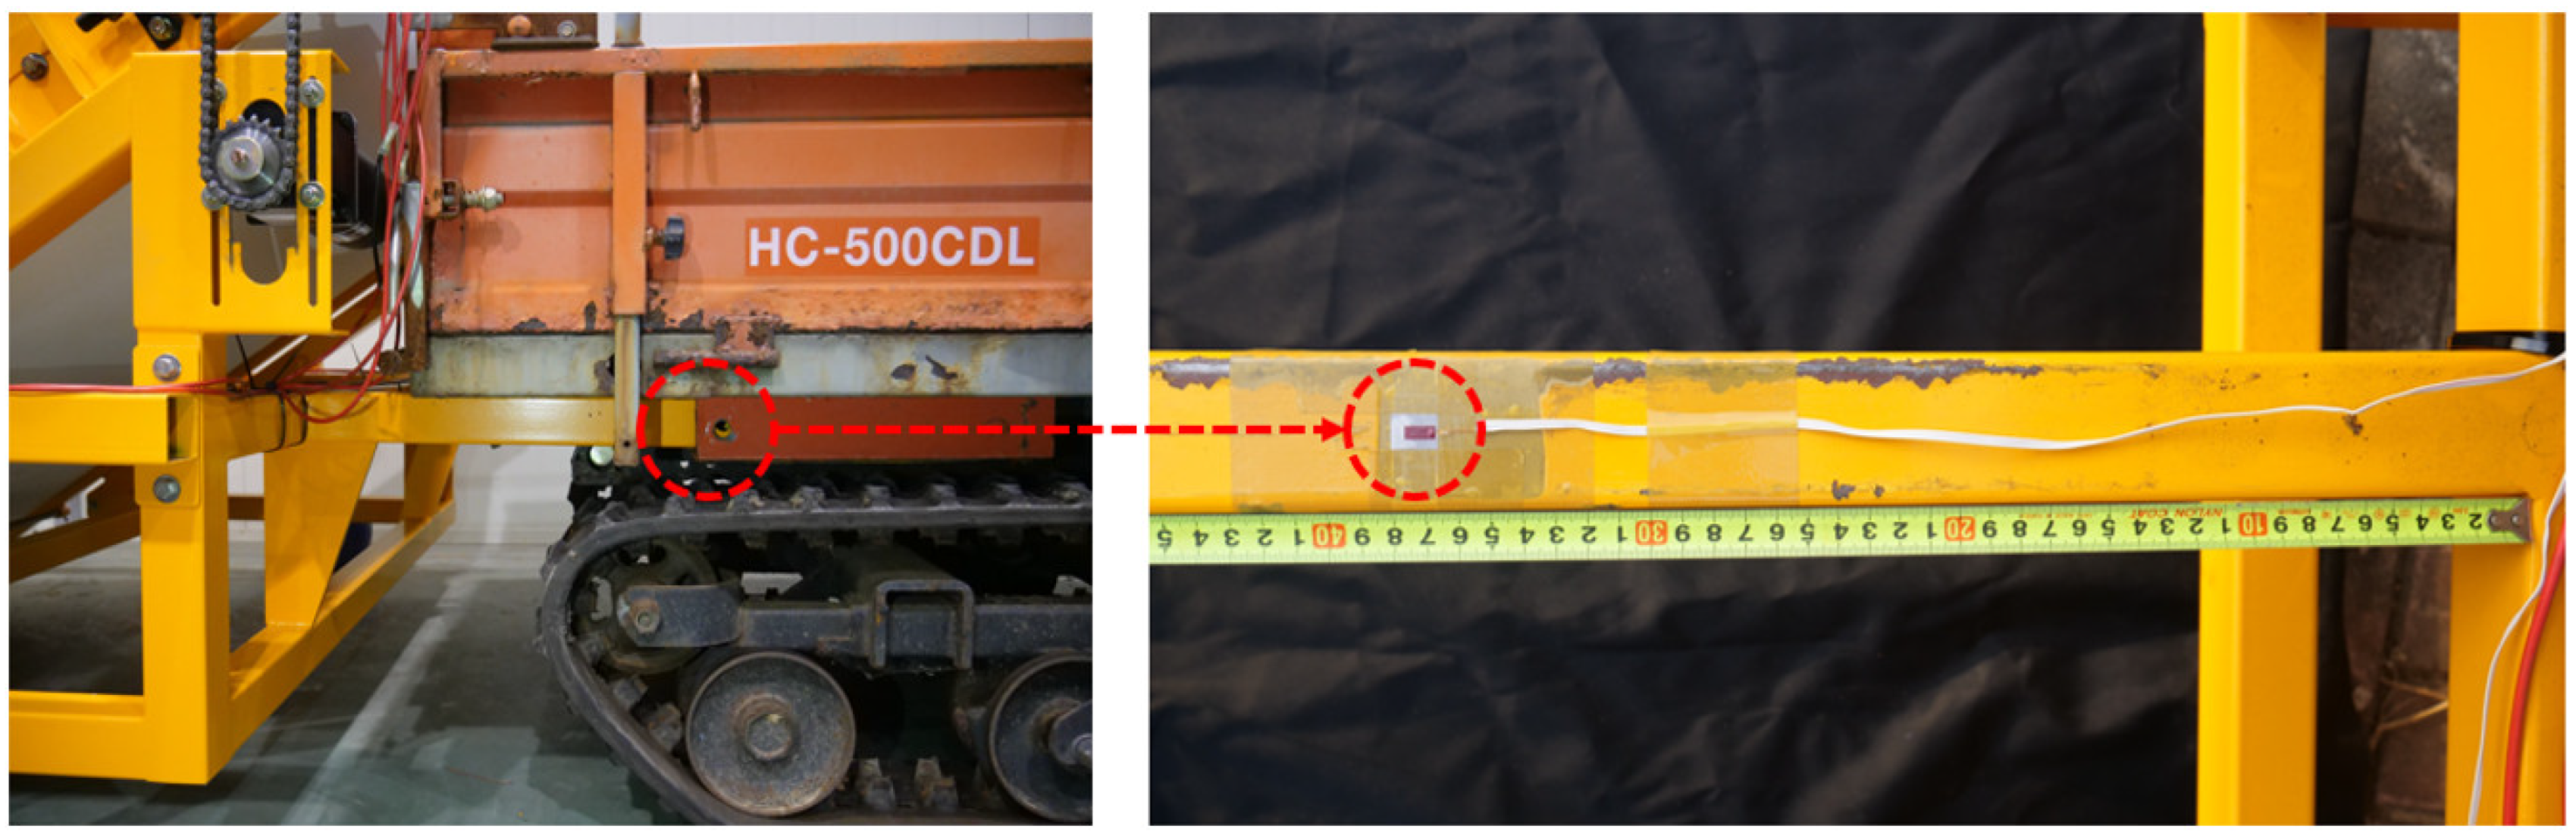
2.3. Measurement System and Operating Conditions

A measurement system was constructed to measure the strain and stress generated in the fastening device when the agricultural by-product collector is working (Figure 6). As a result of structural analysis of the fastening device of agricultural by-product collector, a single-axis strain gage was attached to the top of each fastening device at a distance of 17.5 cm from the frame of transferring part, which is the location where the greatest stress occurs (Figure 7). The specifications of the strain gages used are shown in Table 2. The signal from strain gage that measured strain and stress was transmitted to a data acquisition device (DEWE-43A, Dewesoft, Trbovlje, Slovenia), and the transmitted data can be measured and analyzed in real time using the Dewesoft program (DewesoftX3, Dewesoft, Slovenia). The sampling frequency of the data collection device was set to 10 Hz to include the peak value through a preliminary test, and the driving distance was set to 15 m for one test.
When the agricultural by-product collector is working, a variable stress is generated in the fastening device due to the weight of the collecting/transferring part. The test was conducted by dividing the driving condition into a case in which the loading part was lifted to the highest point by using a hydraulic device and a case in which the driving part was driven without lifting the loading part. The former represents the most severe driving condition, while the latter represents the moderate condition. We chose the most severe and the normal moderate driving conditions for representative conditions in this study. Figure 8 shows that the collecting/transferring part is lifted to the highest point. Three repeated tests were performed under the same driving conditions and the average was used as a representative value. The working speed was set to 1.0 m/s, suitable for the agricultural by-product collector, by referring to previous studies [8]. A hard and flat concrete was selected as the test field.

2.4. Theoretical Analysis

2.4.1. Static Safety Factor
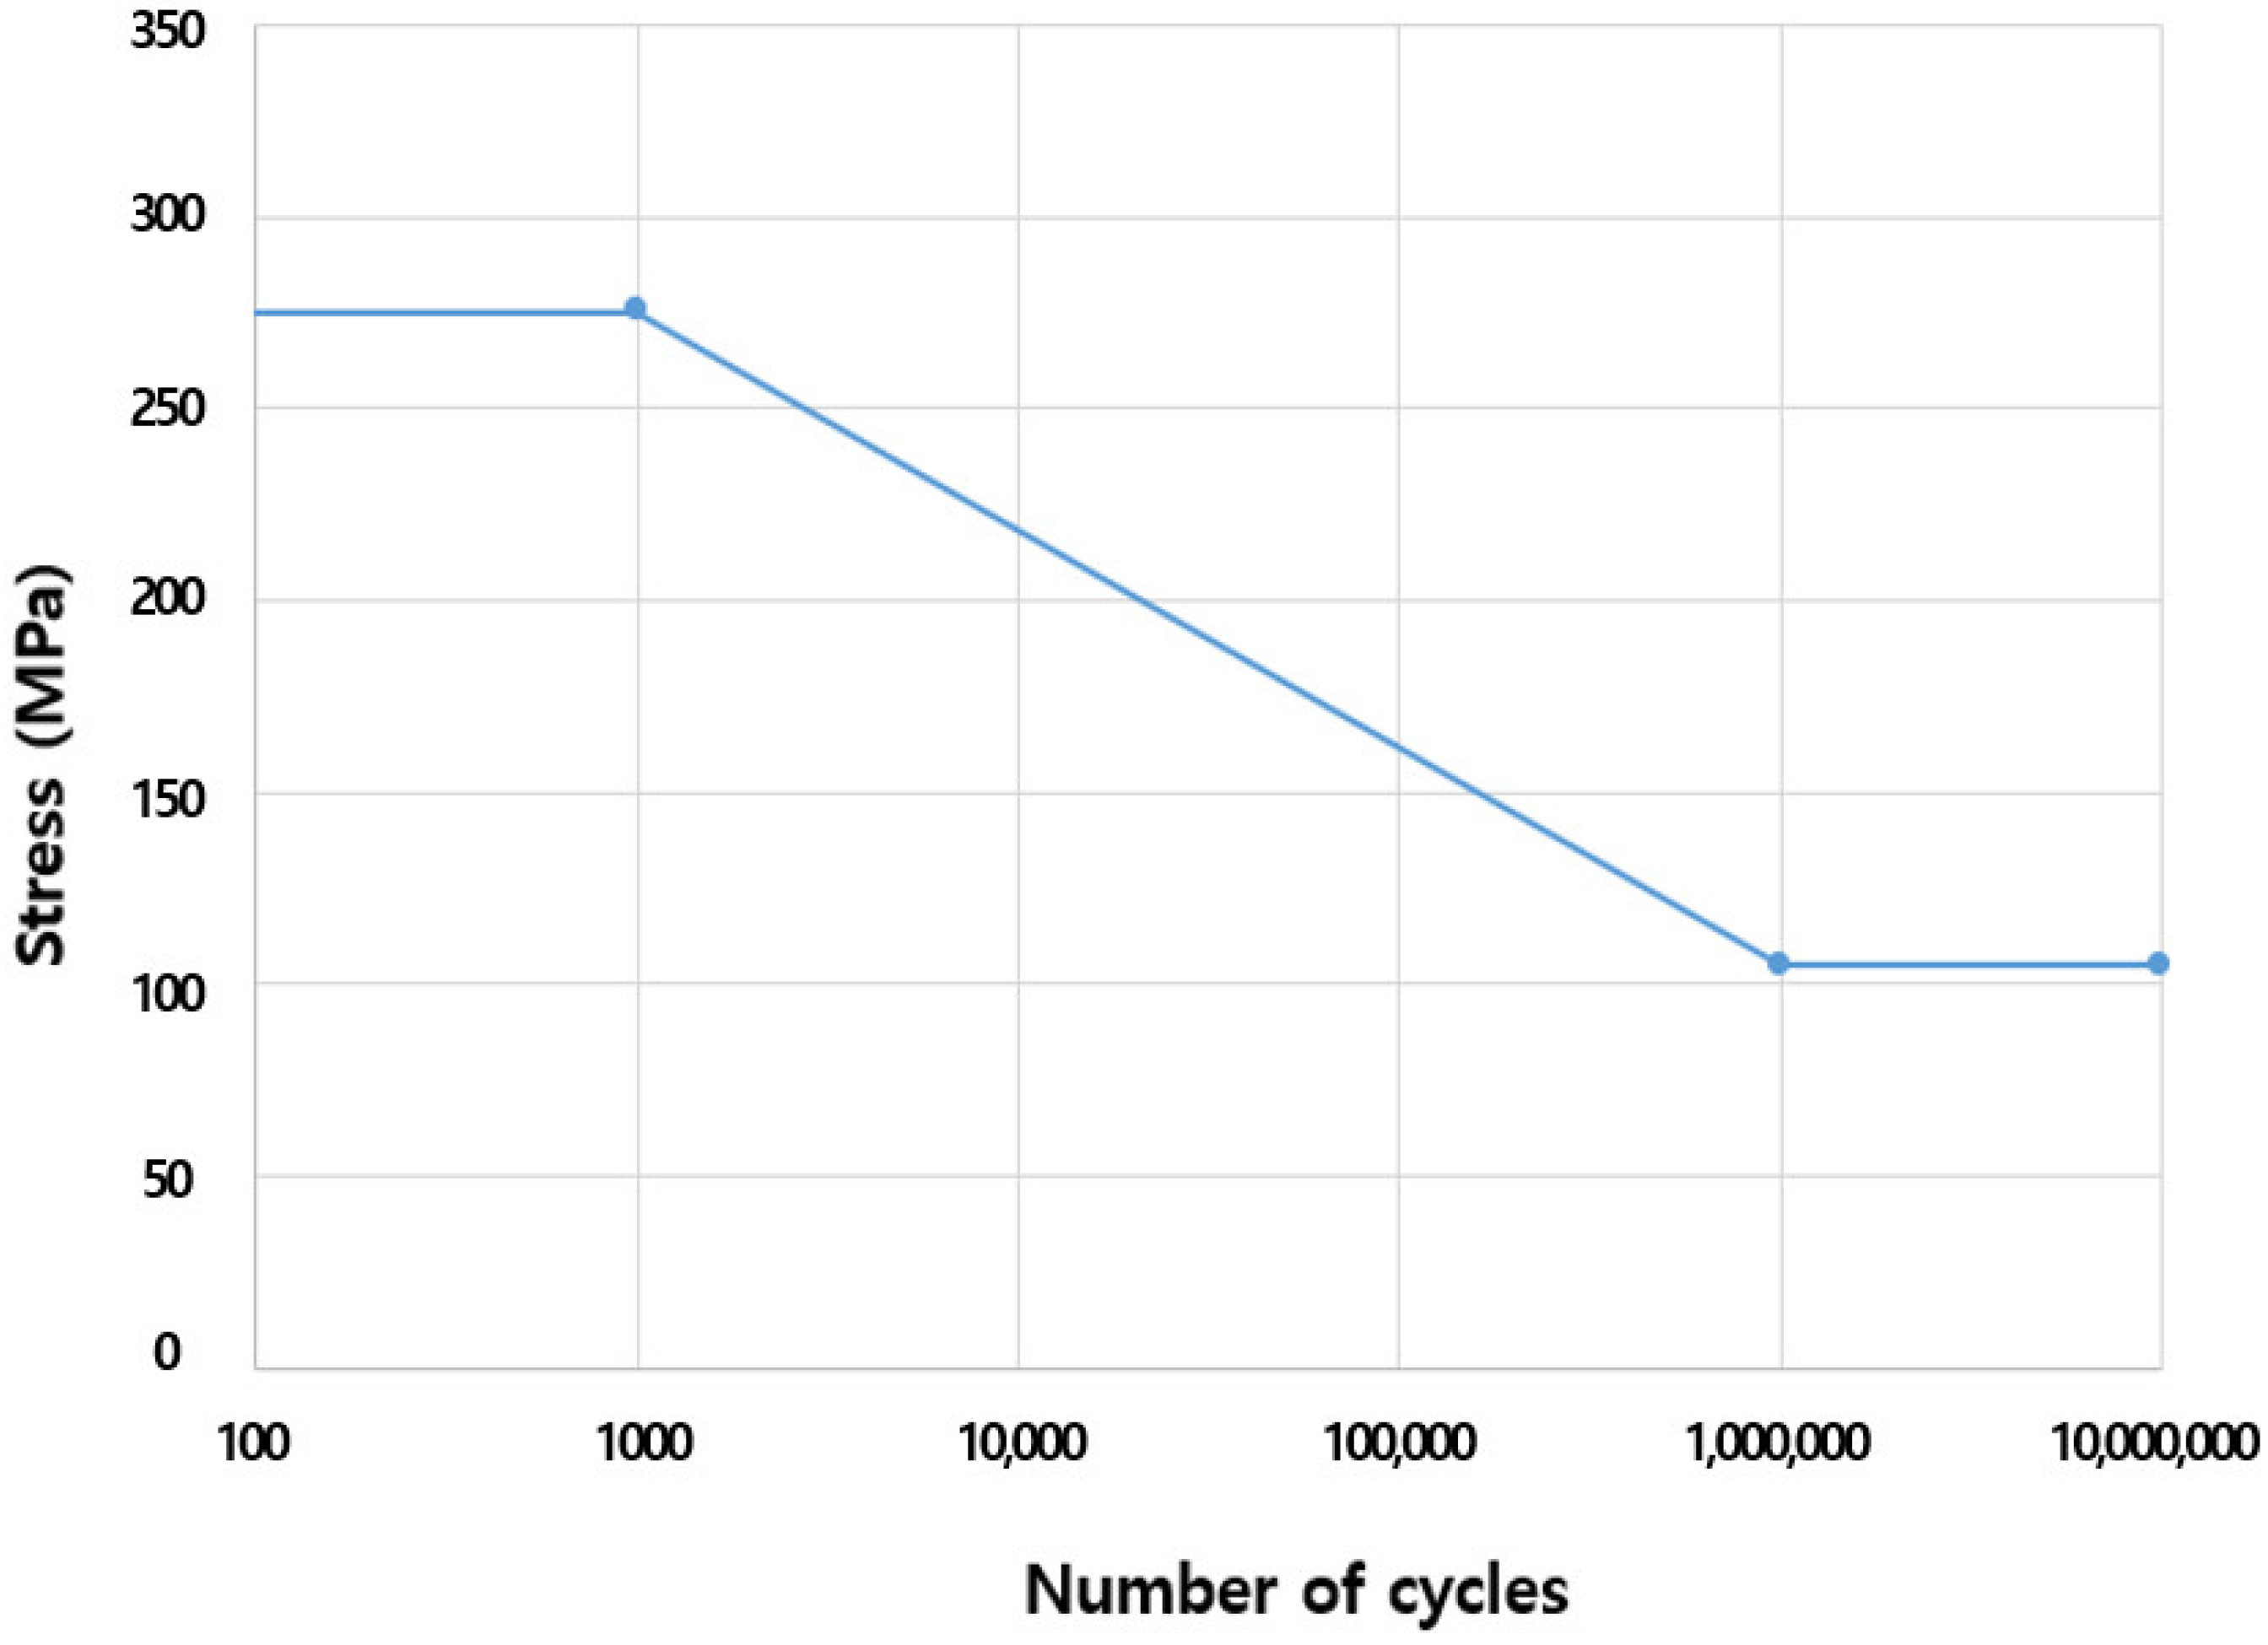
When the static safety factor is greater than 1.0, it means that the design is statically safe. However, if the maximum stress in a specific area is greater than the strength of the material, the static safety factor becomes less than 1.0, which is dangerous in design, and the parts fail or do not function properly [21]. Therefore, it is necessary to analyze the static safety factor of the agricultural by-product collector. As in Equation (1), the static safety factor can be calculated using the yield strength of the material and the maximum stress.
S . F . = S y σ m a x
where S . F . is the static safety factor; S y is yield strength of the material, MPa; and σ m a x is the maximum stress, MPa.

2.4.2. Fatigue Life

The measured strain was converted into stress using Equation (2).
σ = E × ε
where σ is the stress, N/m2; E is the modulus of elasticity, N/m2; and ε is the strain, mm/mm.
In order to construct the load spectrum, the magnitude of the load must be expressed into the frequency domain. The load spectrum represents the equivalent of a completely reversed load as a function of its occurring frequencies [22]. A load from a time domain can be expressed into the frequency domain by applying a rain-flow counting method. In addition, in order to derive the durability life, the magnitude of the load must be converted into an equivalent of completely reserved stress. For this, the load spectrum for the equivalent completely reserved stress is derived by applying the Goodman’s equation as shown in Equation (3).
σ e q = S u σ a S u σ m
where σ e q is the equivalent completely reserved stress, MPa; S u is the ultimate strength, MPa; σ a is the stress amplitude, MPa, and σ m is the mean stress, MPa.
By applying the Palmgren–Miner rule to the load spectrum, the damage sum can be calculated as in Equation (4). In the cumulative damage theory, the total damage is derived by adding all the partial damage caused by all the loads acting on it. A stress spectrum is prepared using a load spectrum expressed as an equivalent completely reserved load, and partial damage can be calculated using the ratio of the actual applied loading cycles at each stress to the respective life cycles corresponding to that stress in the S–N curve. However, at a stress less than the endurance limit, fatigue failure does not occur, regardless of the frequency, so partial damage to the stress below the endurance limit is calculated as 0. The fatigue life is calculated using the damage sum and working time as shown in Equation (5).
D t = i = 1 k n i N i
where D t is the damage sum; n i is the actual applied cycles for equivalent completely reversed stress in the ist cycle, respectively; and N i is the life cycles for equivalent completely reversed stress in the ist cycle, respectively.
L f = 1 D × t
where L f is the fatigue life, sec; D is the damage sum; and t is the working time which generate damage sum, sec.

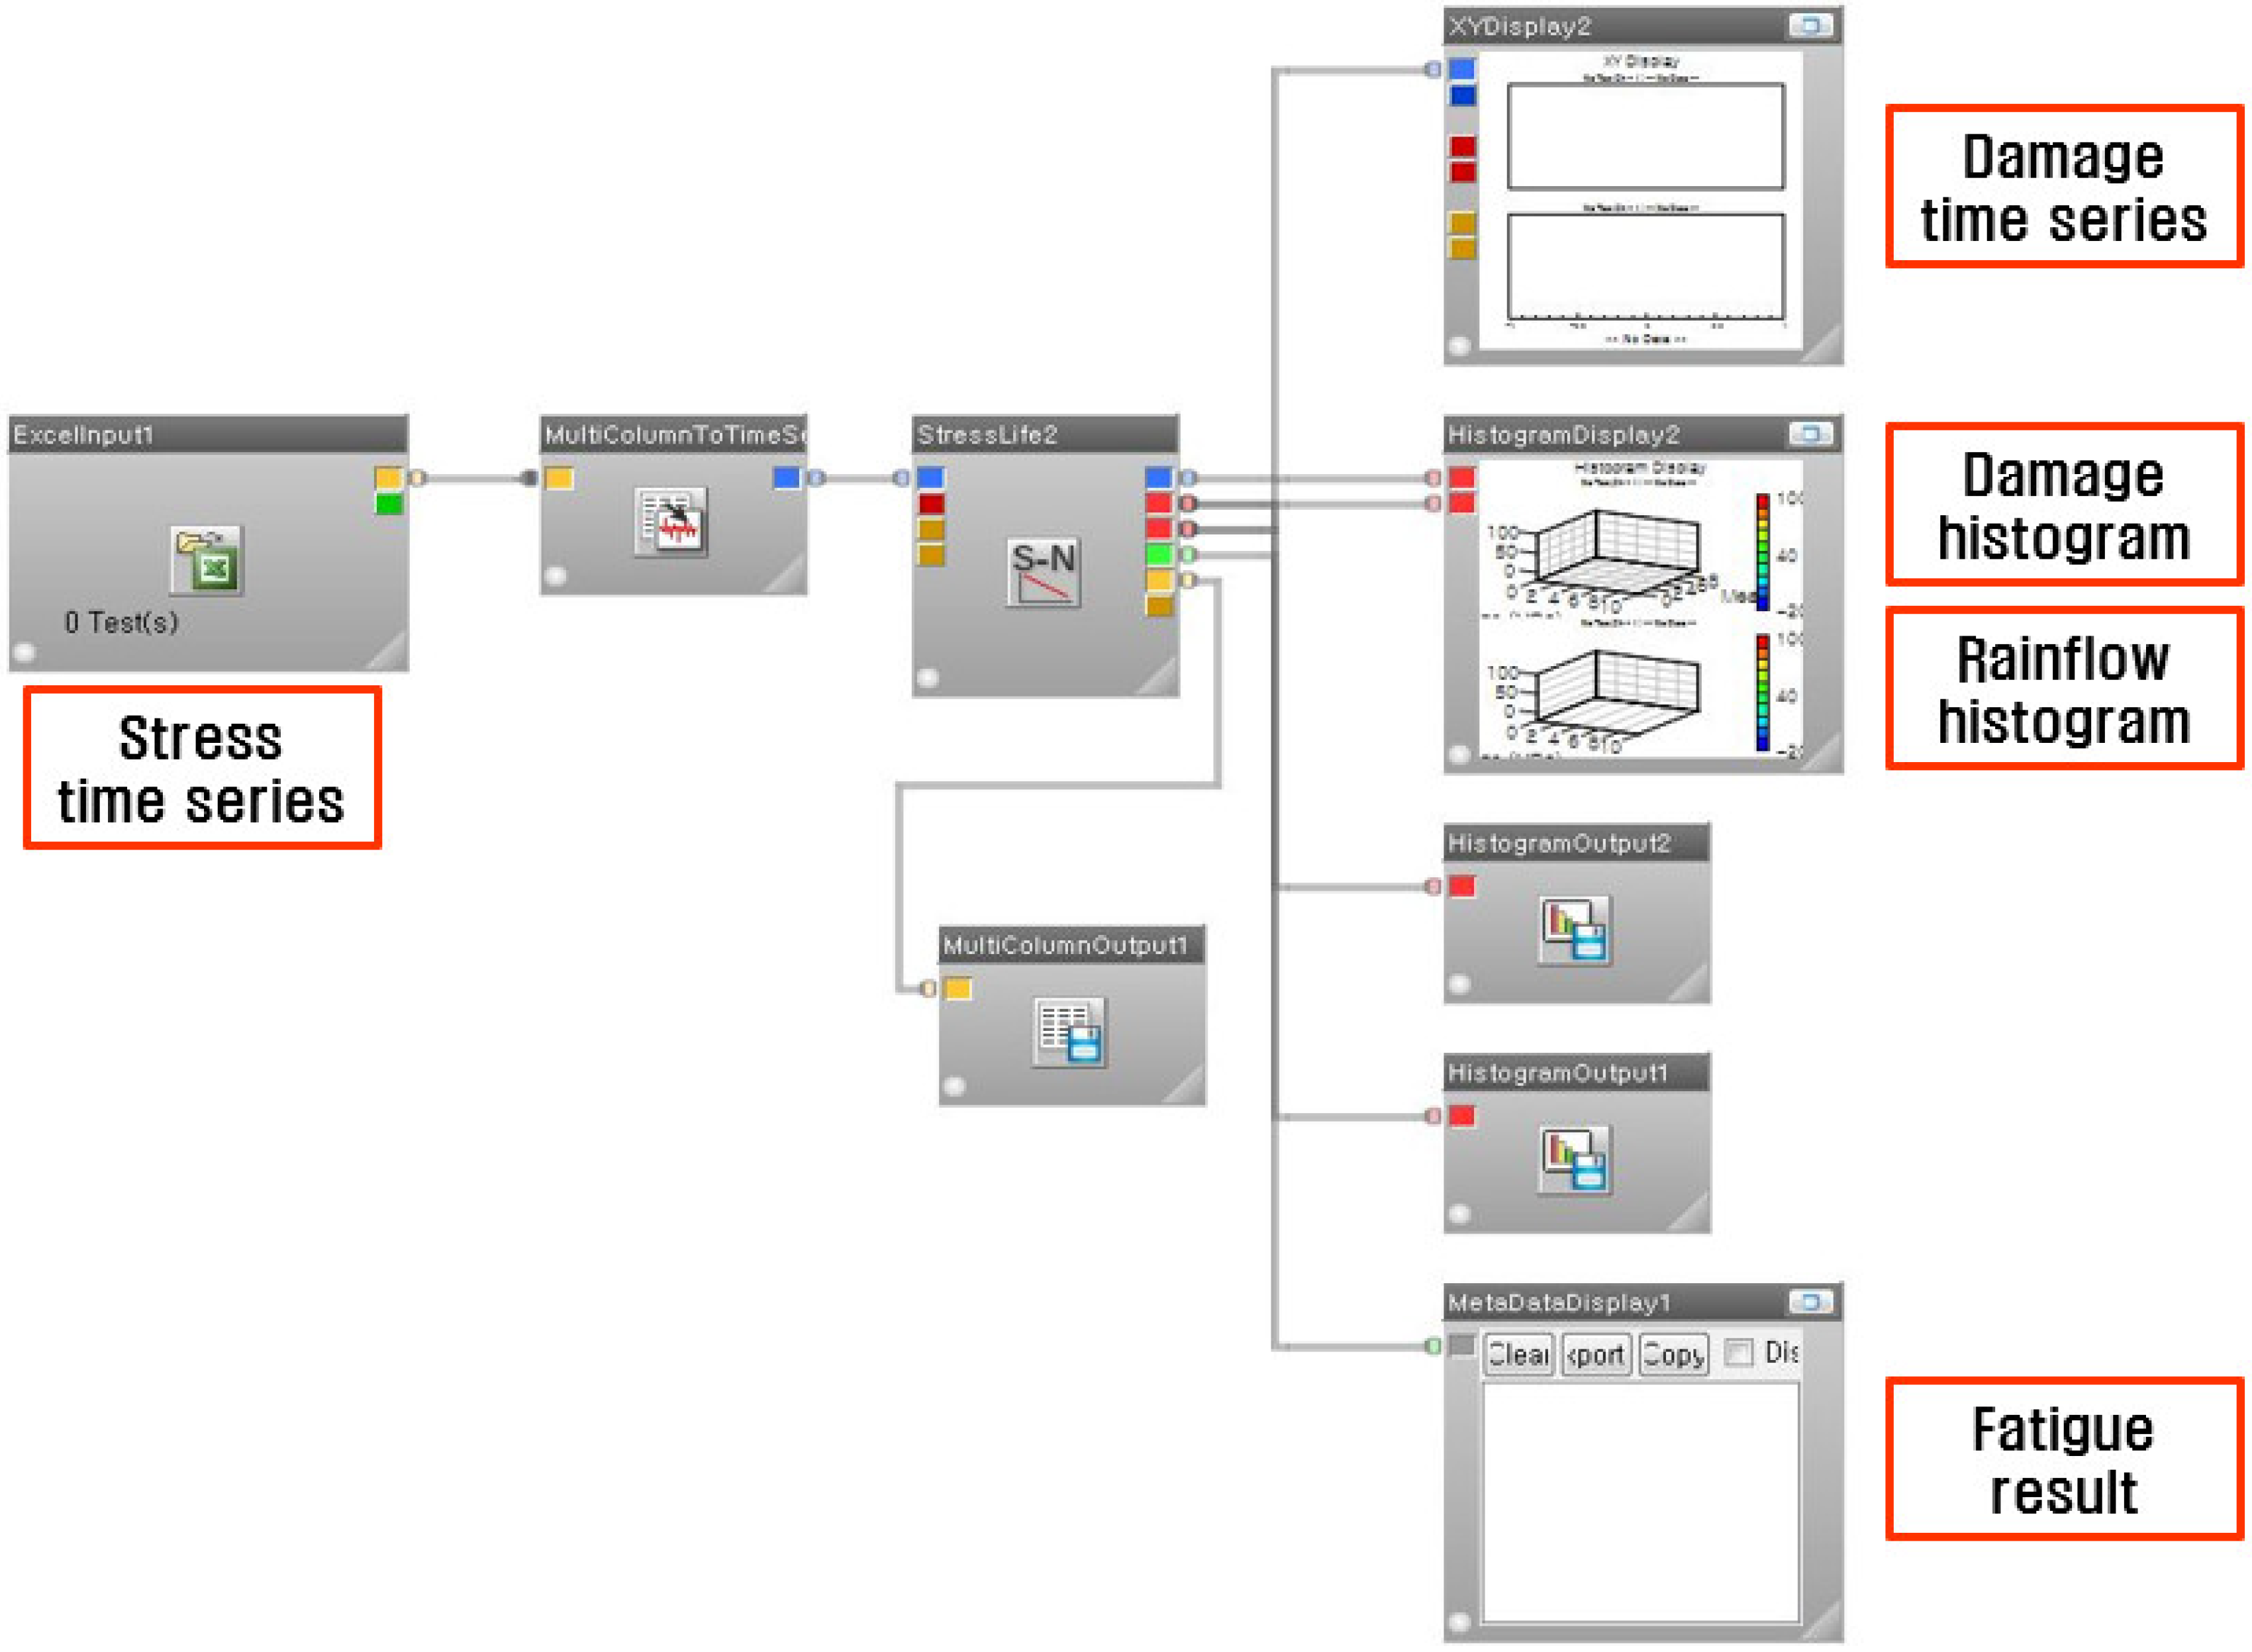
2.5. Fatigue Life Analysis

Fatigue life was calculated using commercial software nCode (nCode, HBM Prenscia, Southfield, MI, USA). The fatigue life analysis process is shown in Figure 9. The input for this process is time series stress data. After entering the time series stress data, the S–N curve of the fastening device of agricultural by-product collector was selected from the library of nCode program [23]. The material of the fastening device of the agricultural by-product collector is Steel UML UTS 300, and the physical properties and S–N curve are shown in Table 3 and Figure 10. After the process is executed, the rain-flow counting result, the damage result, and the fatigue life result can be obtained.

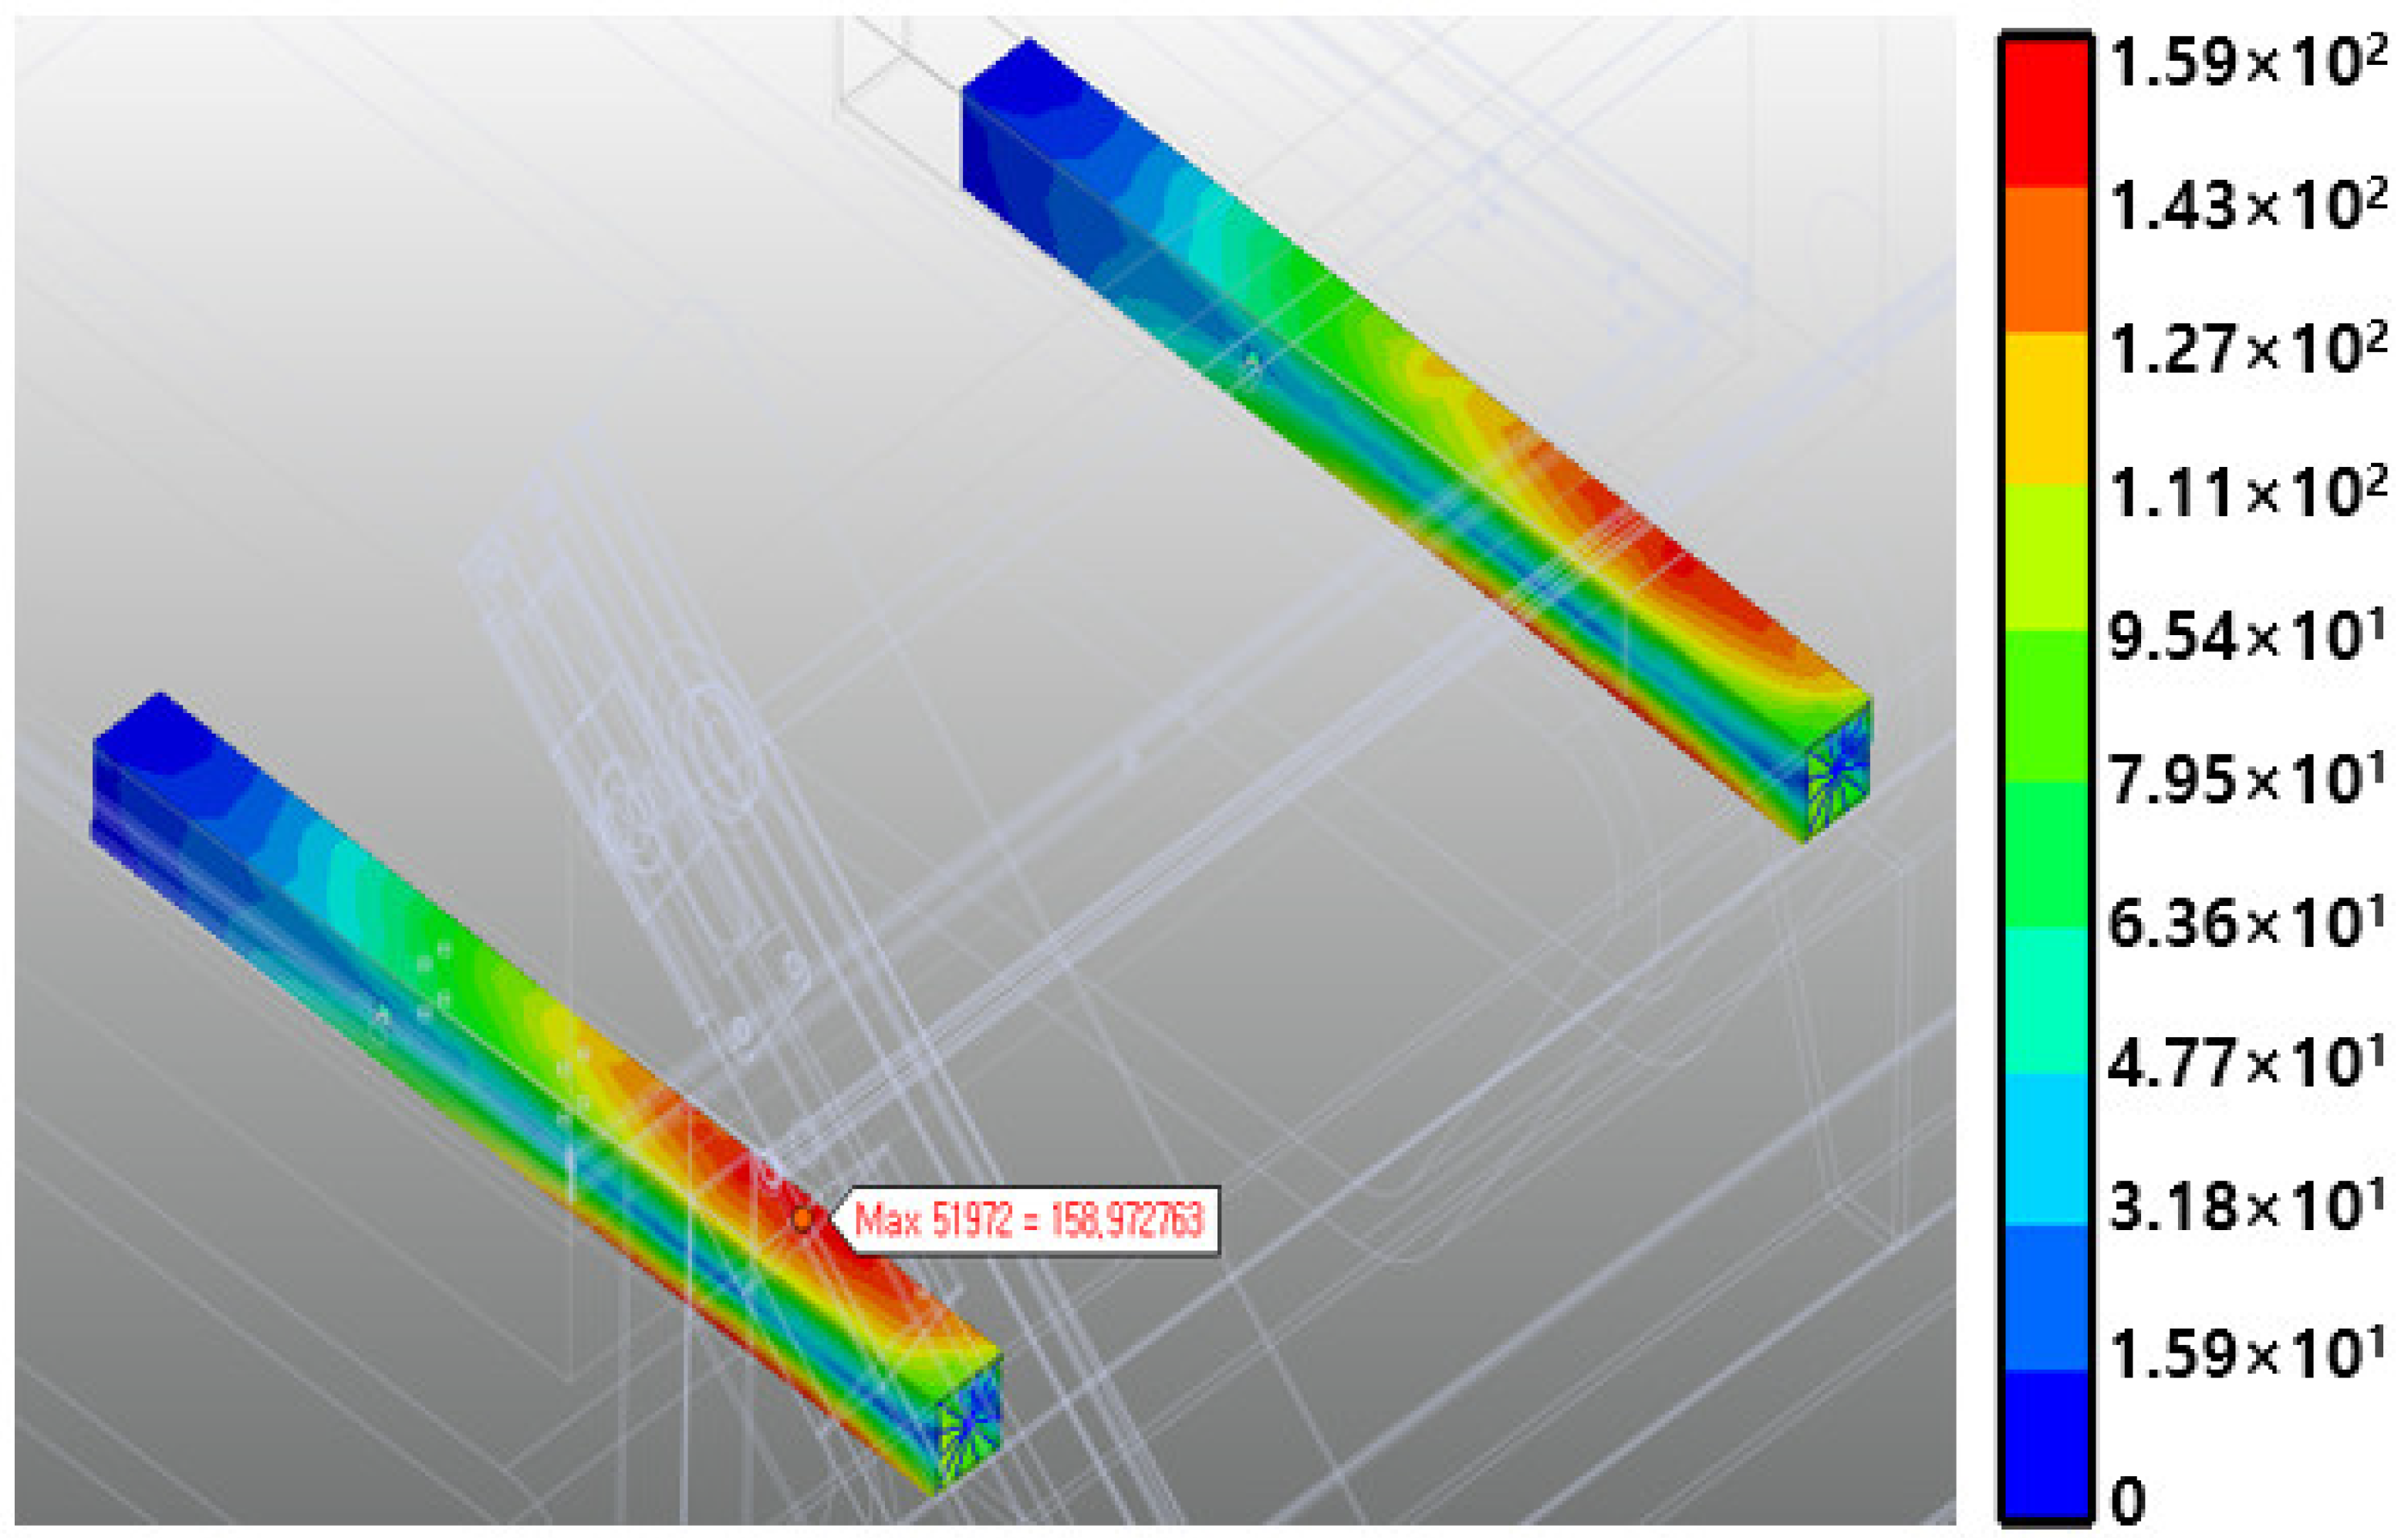
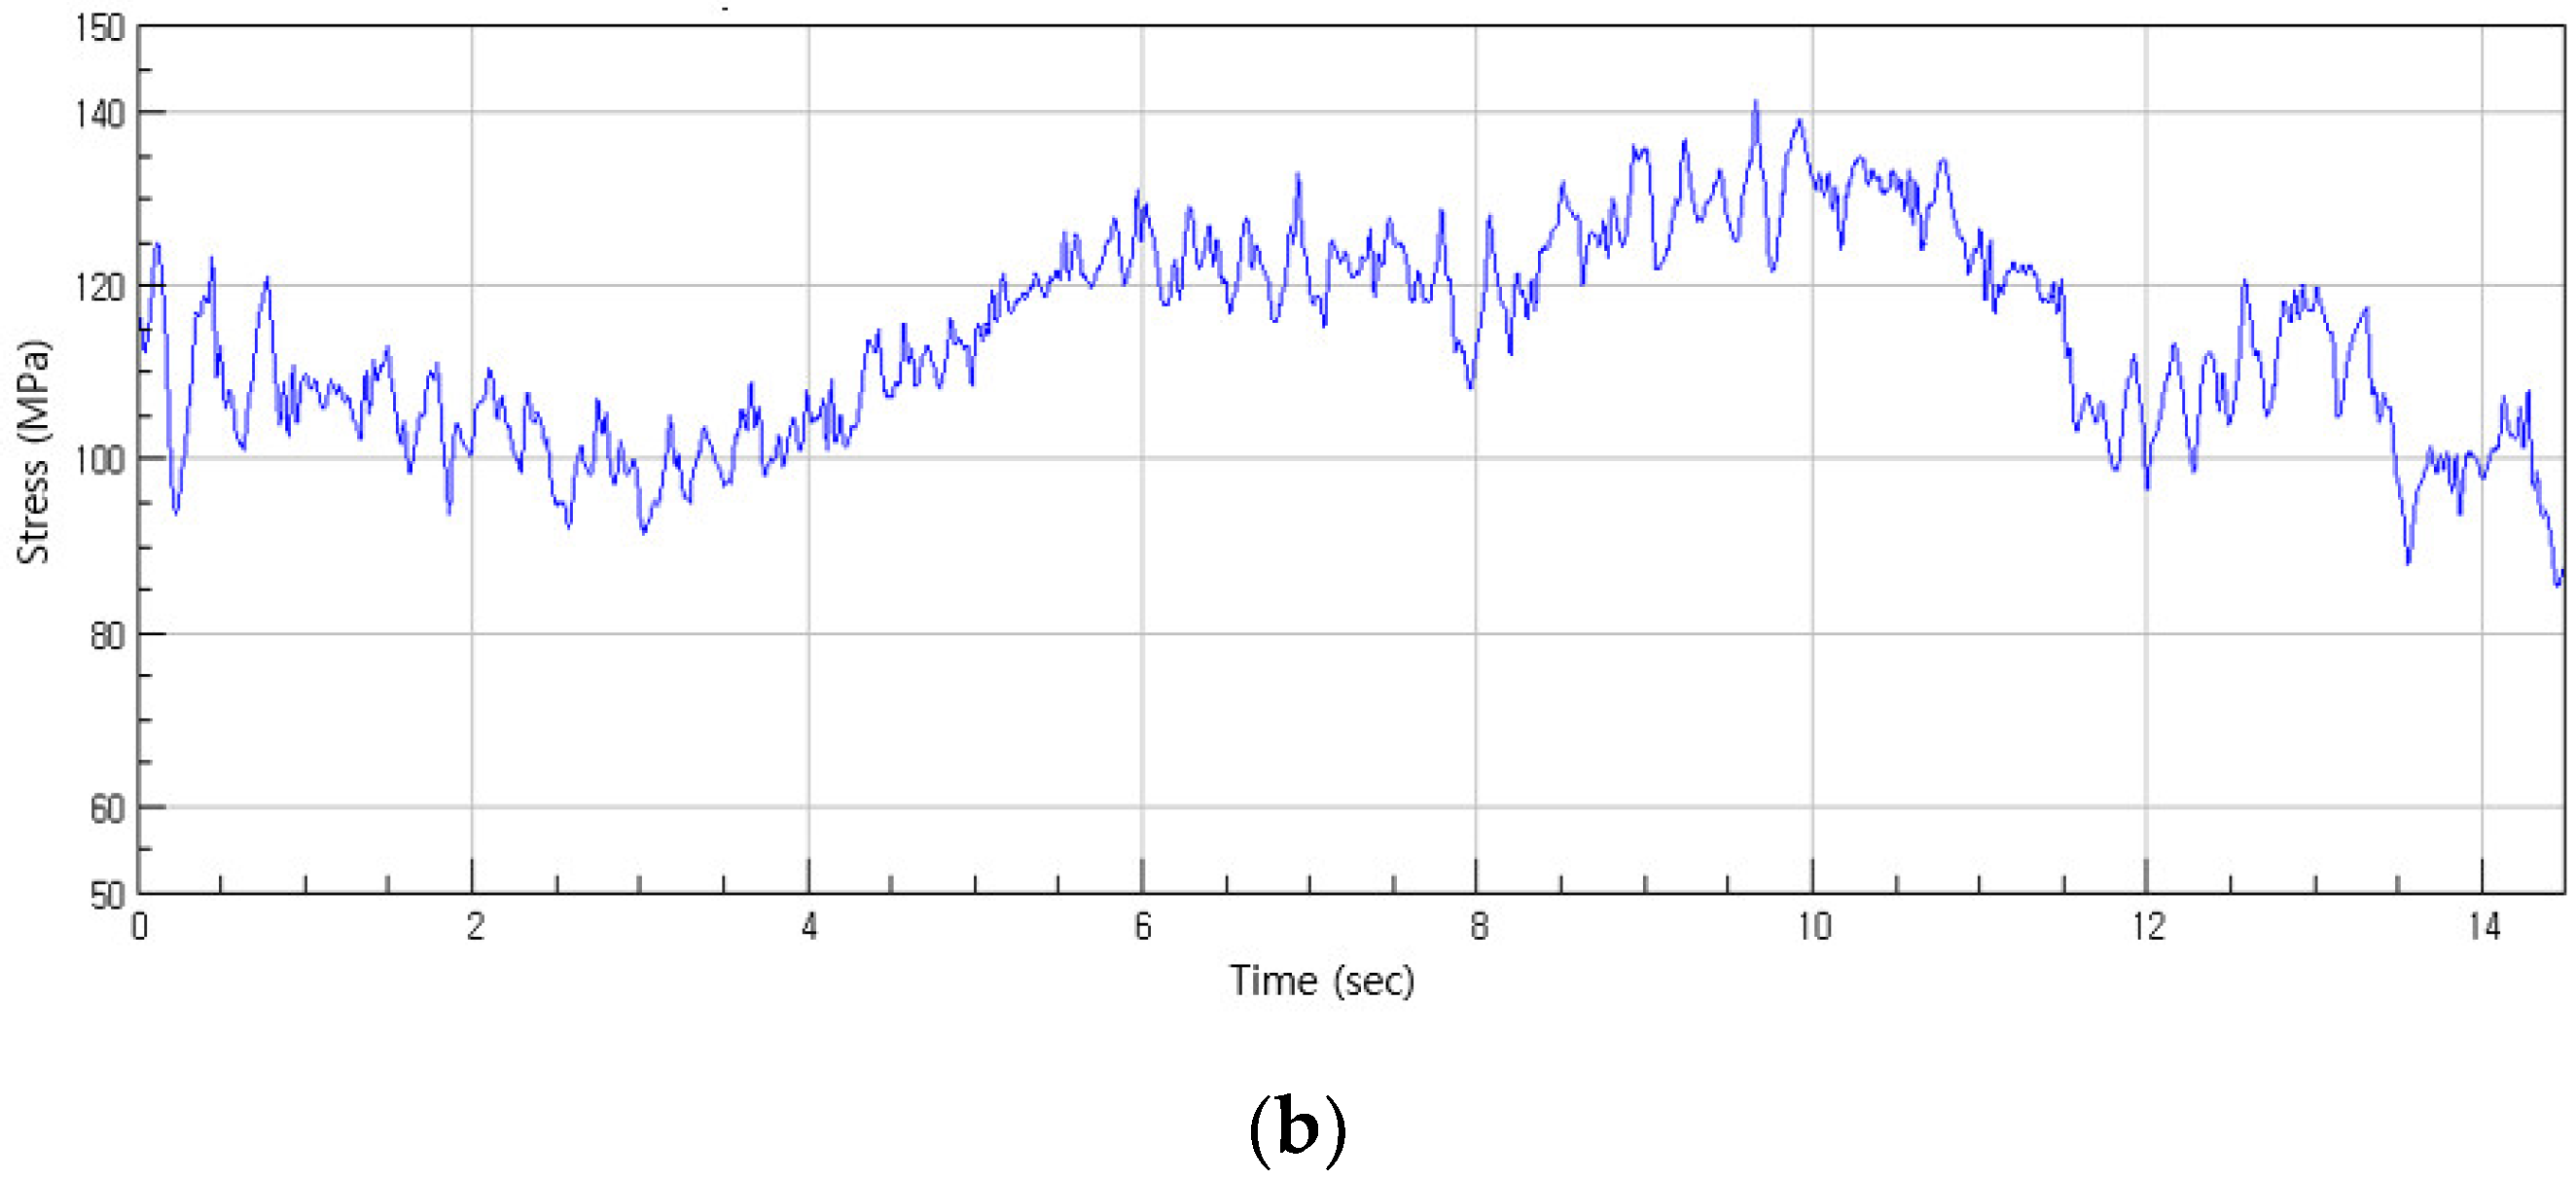
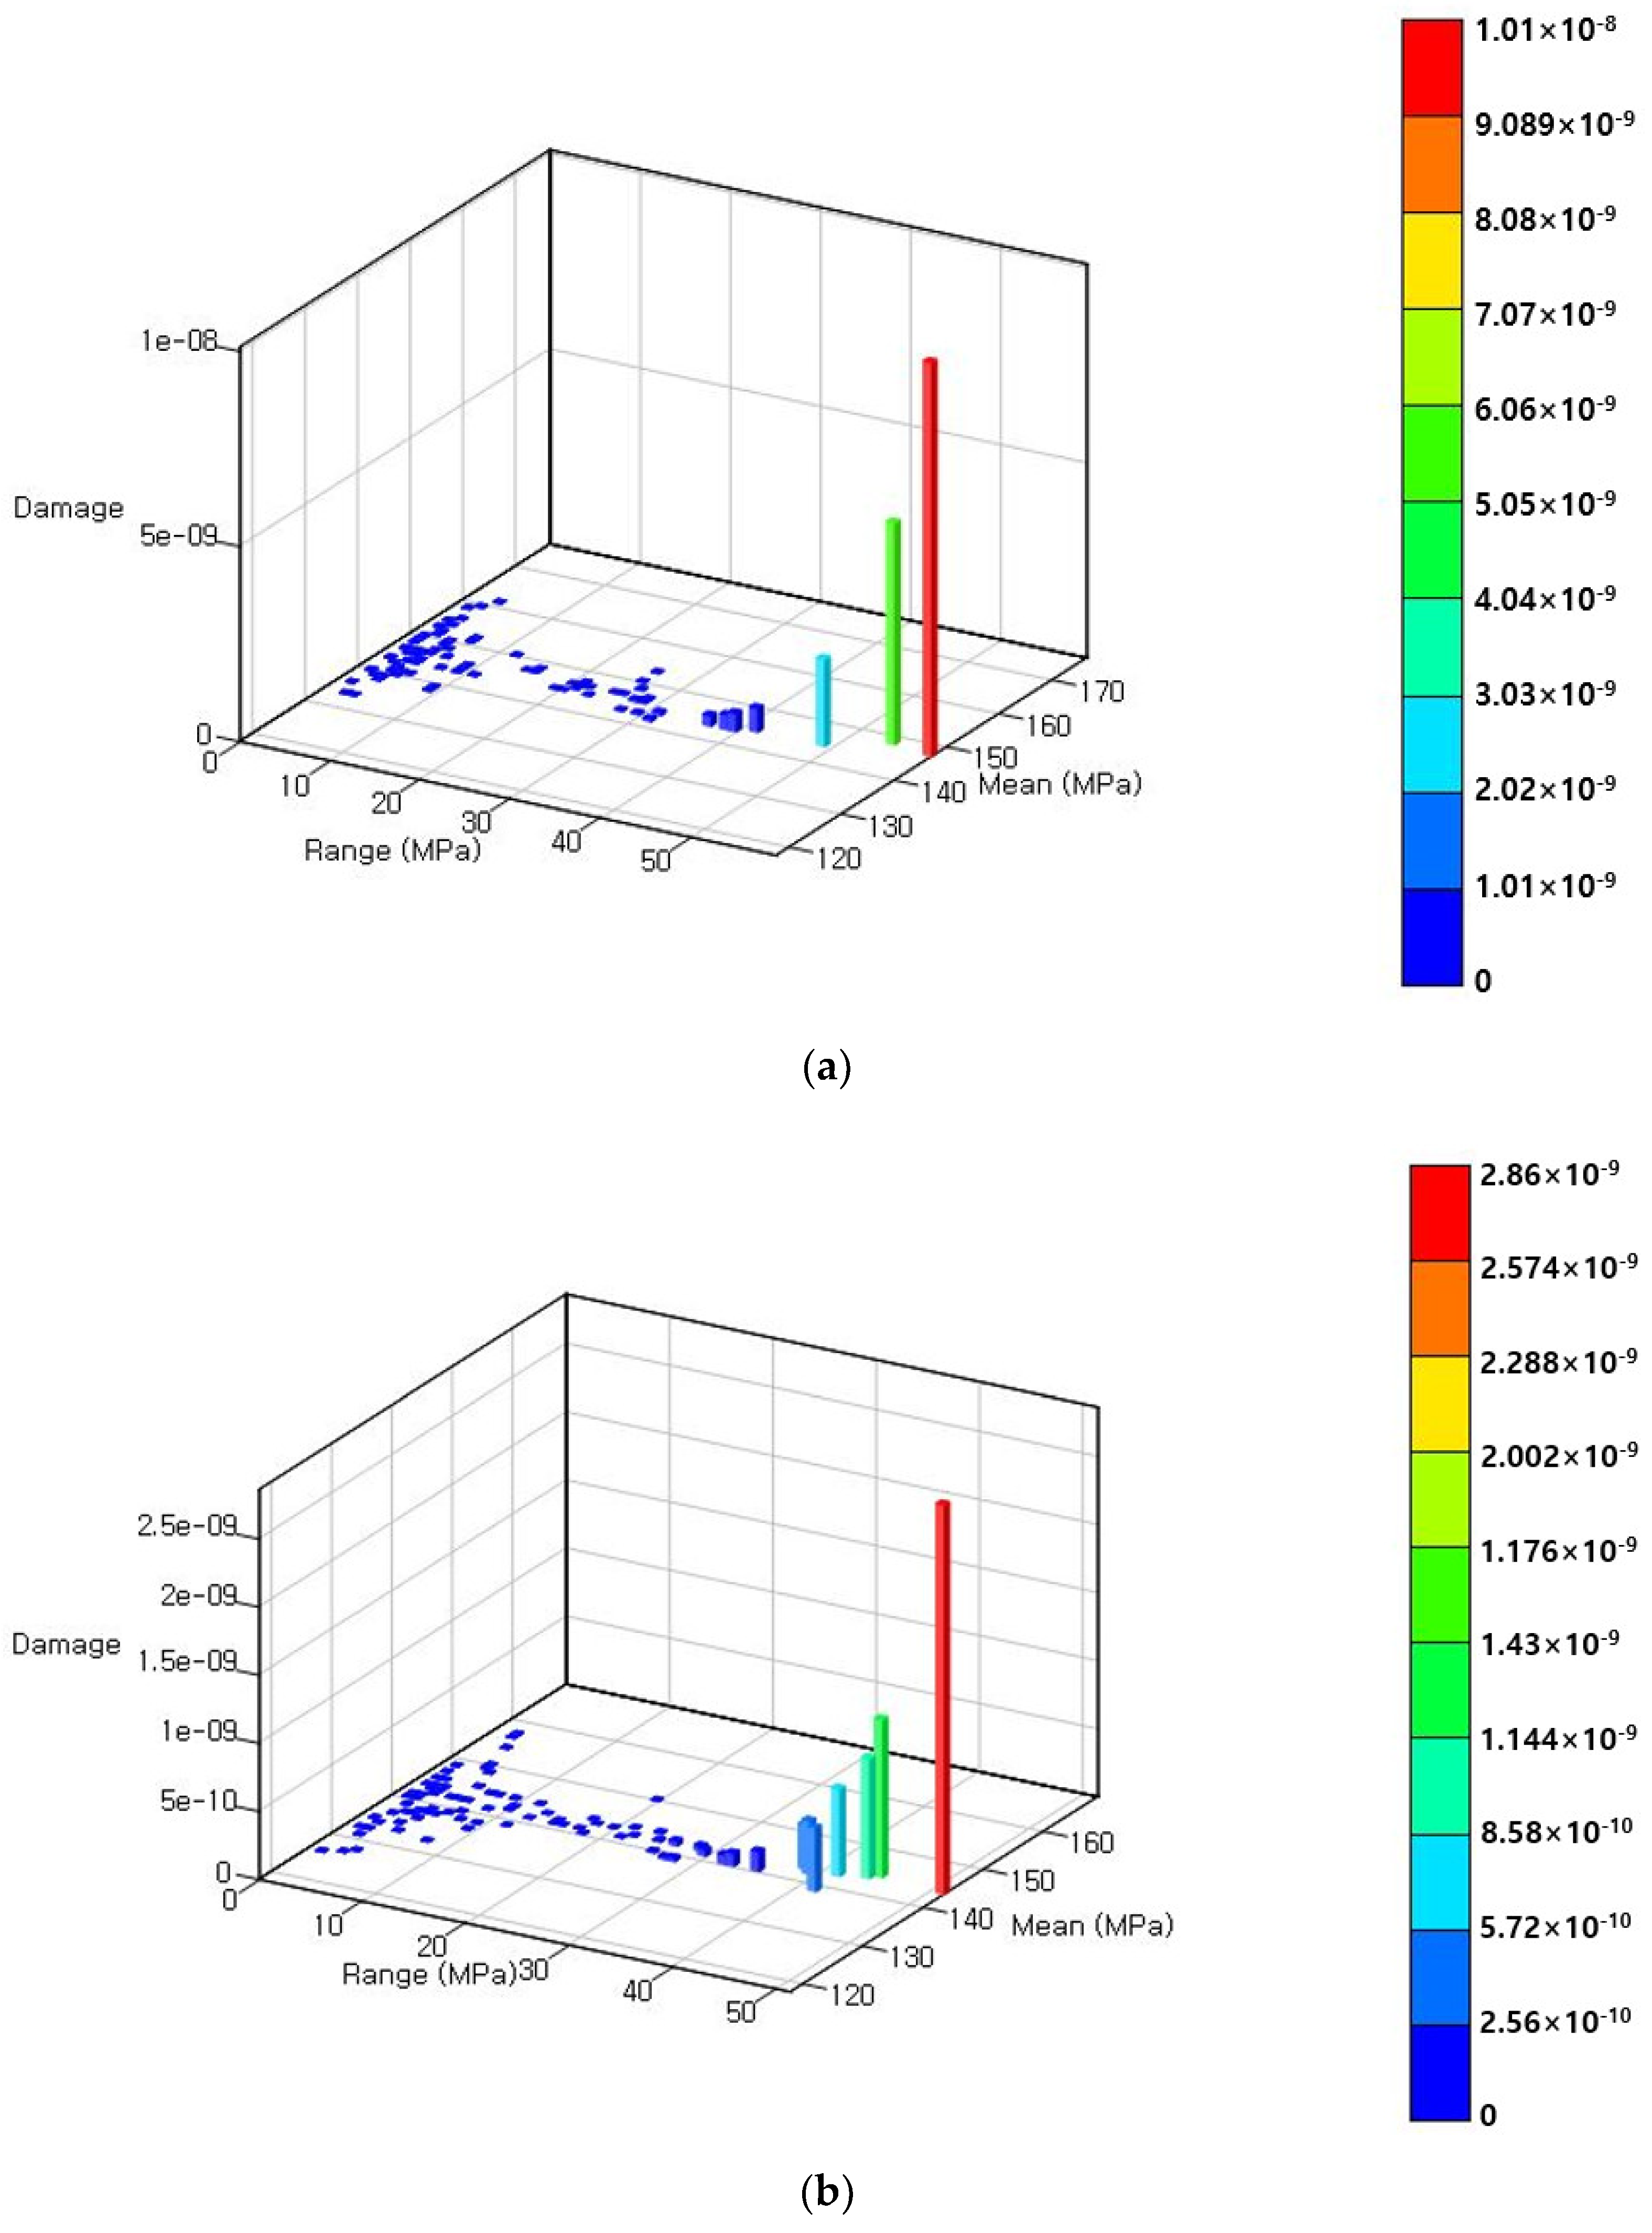
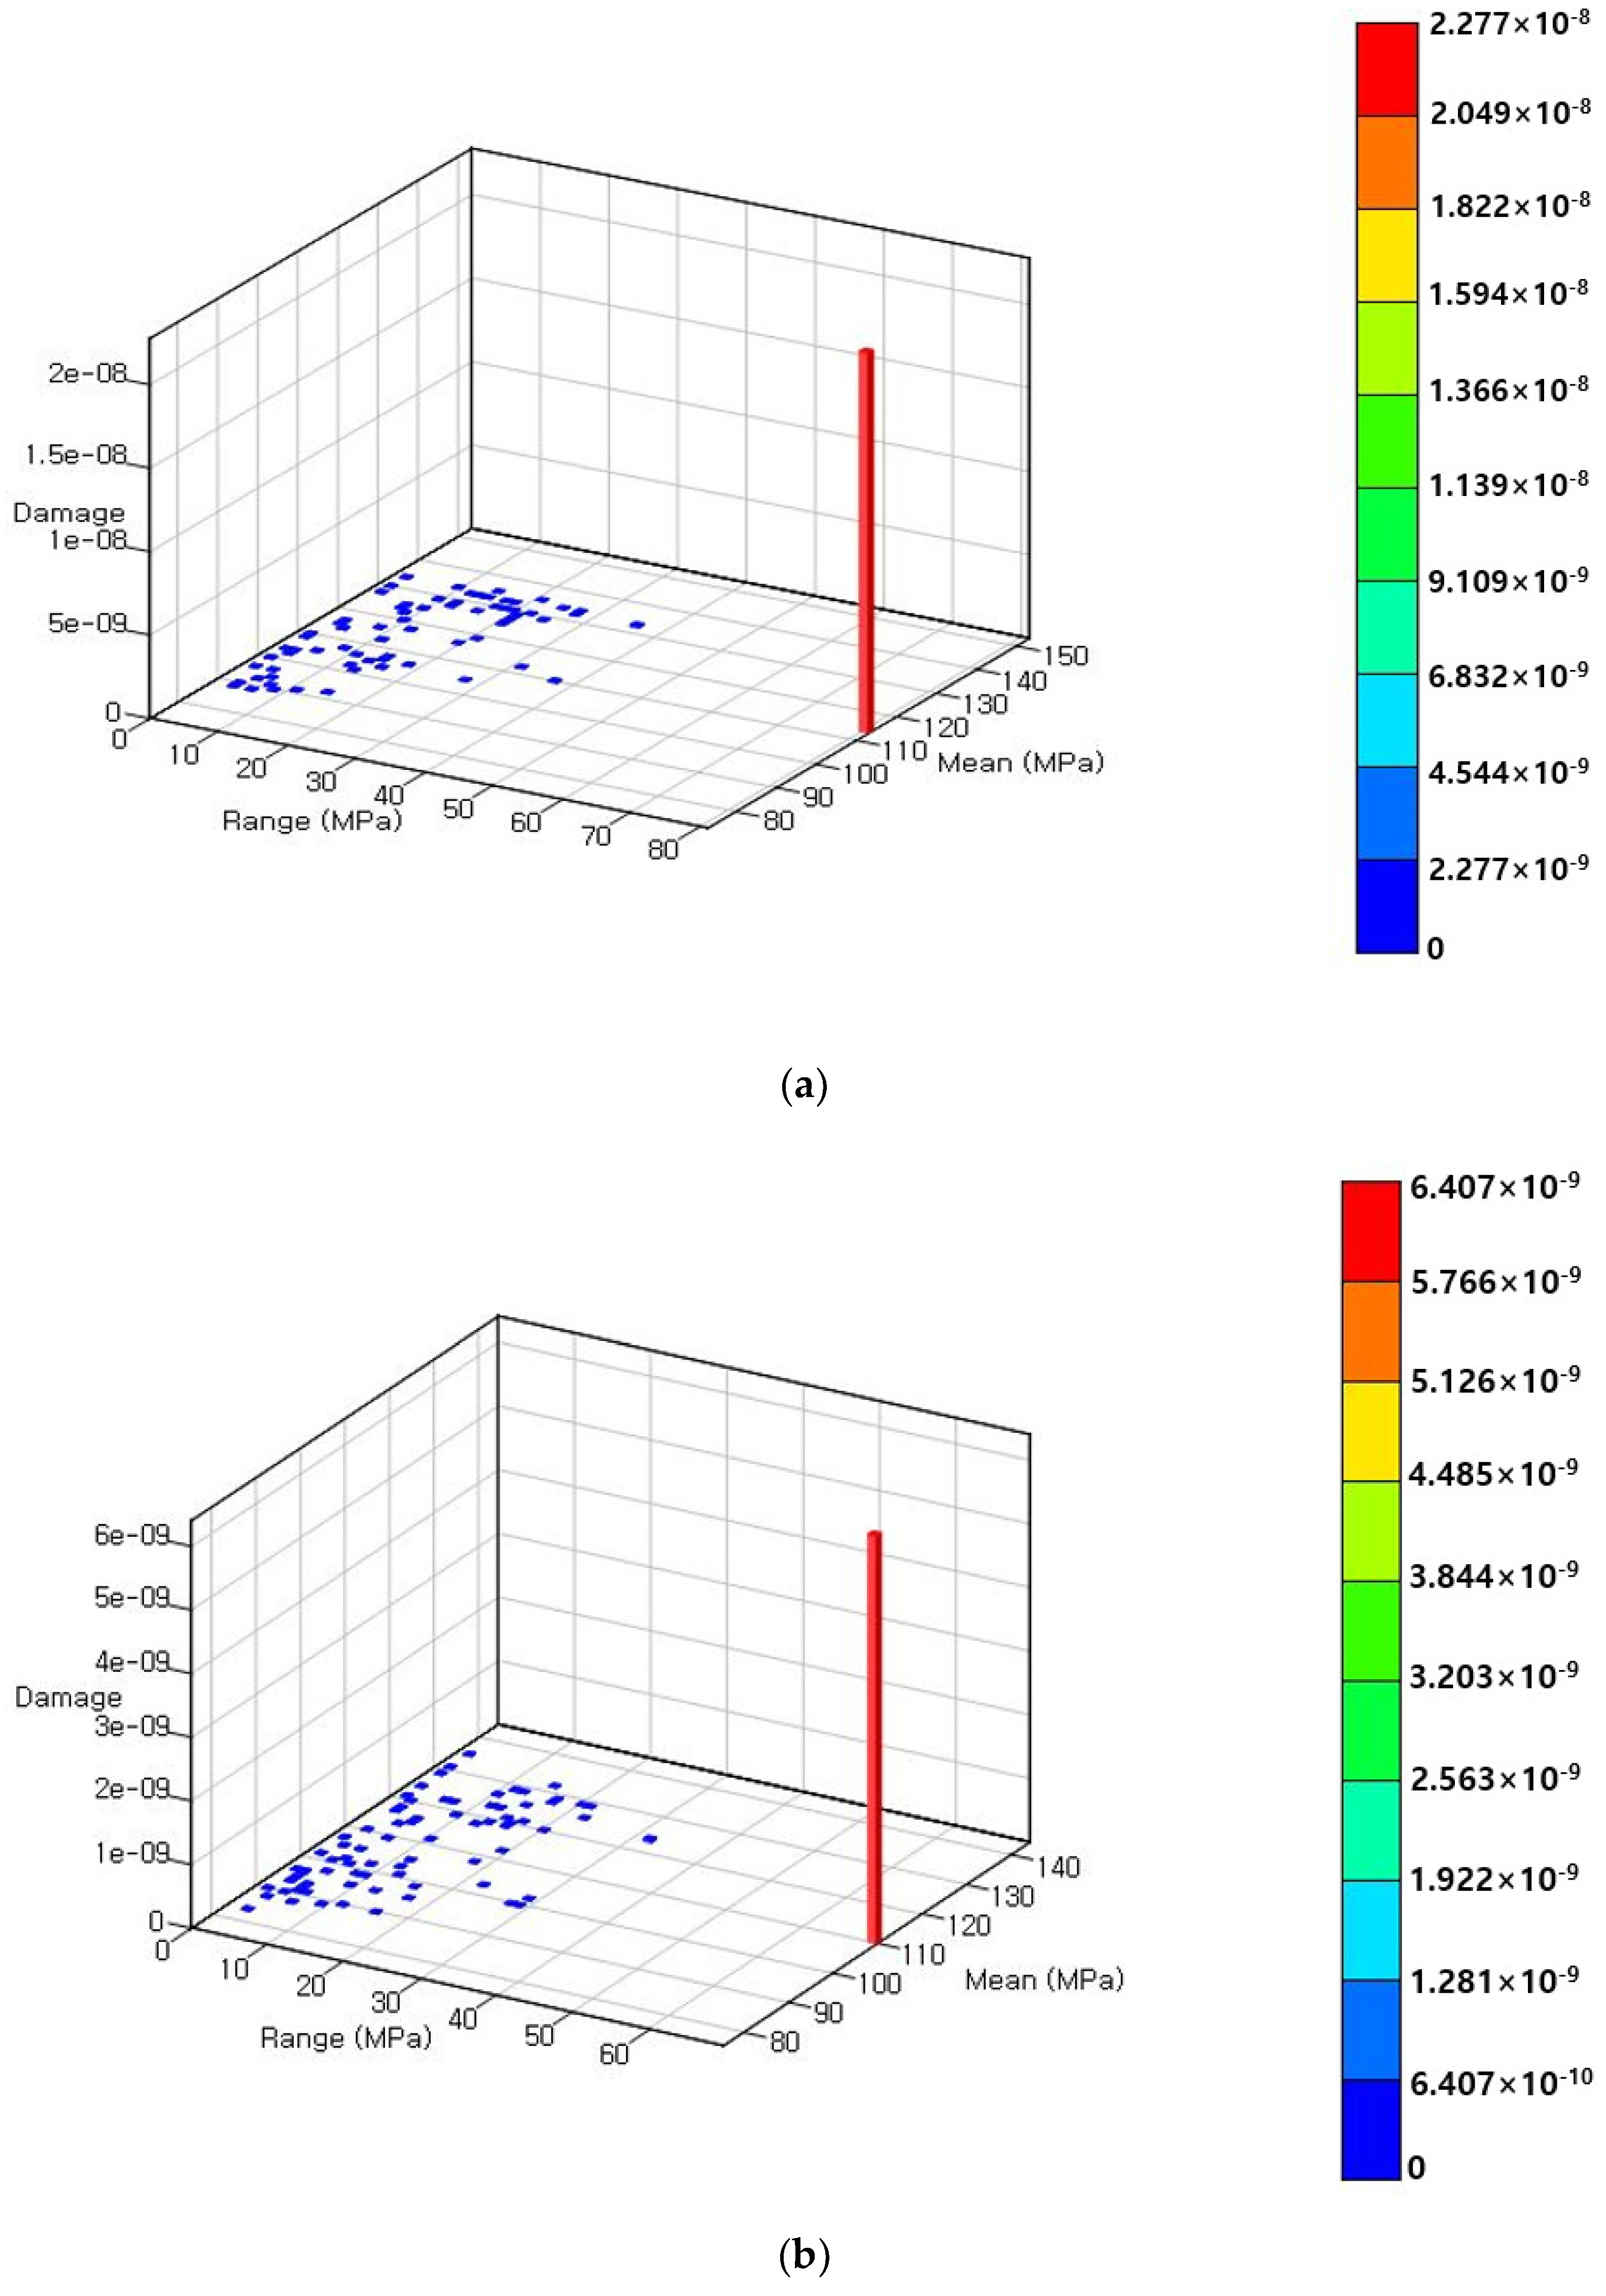
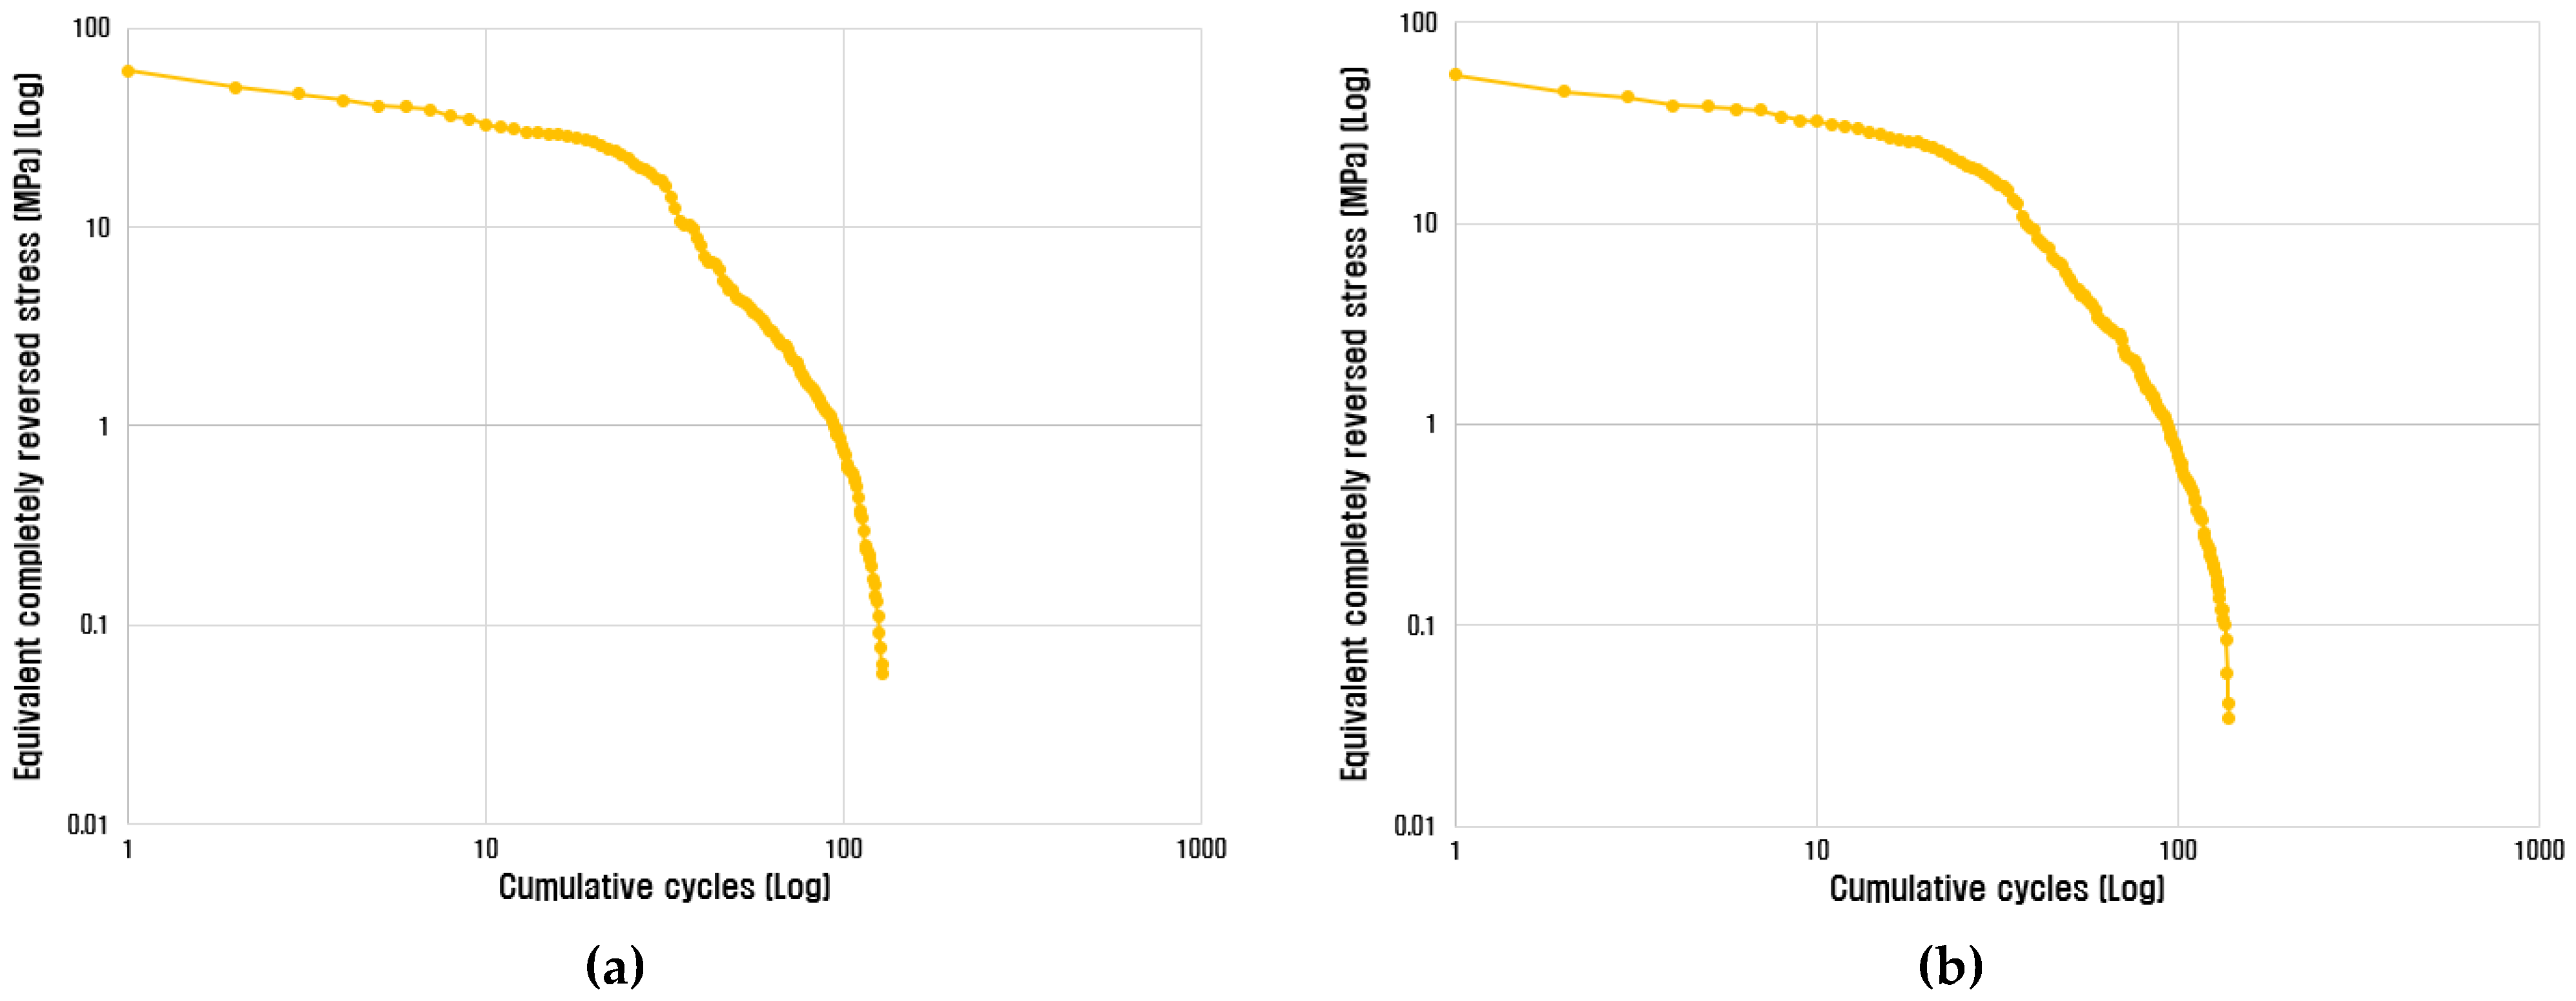
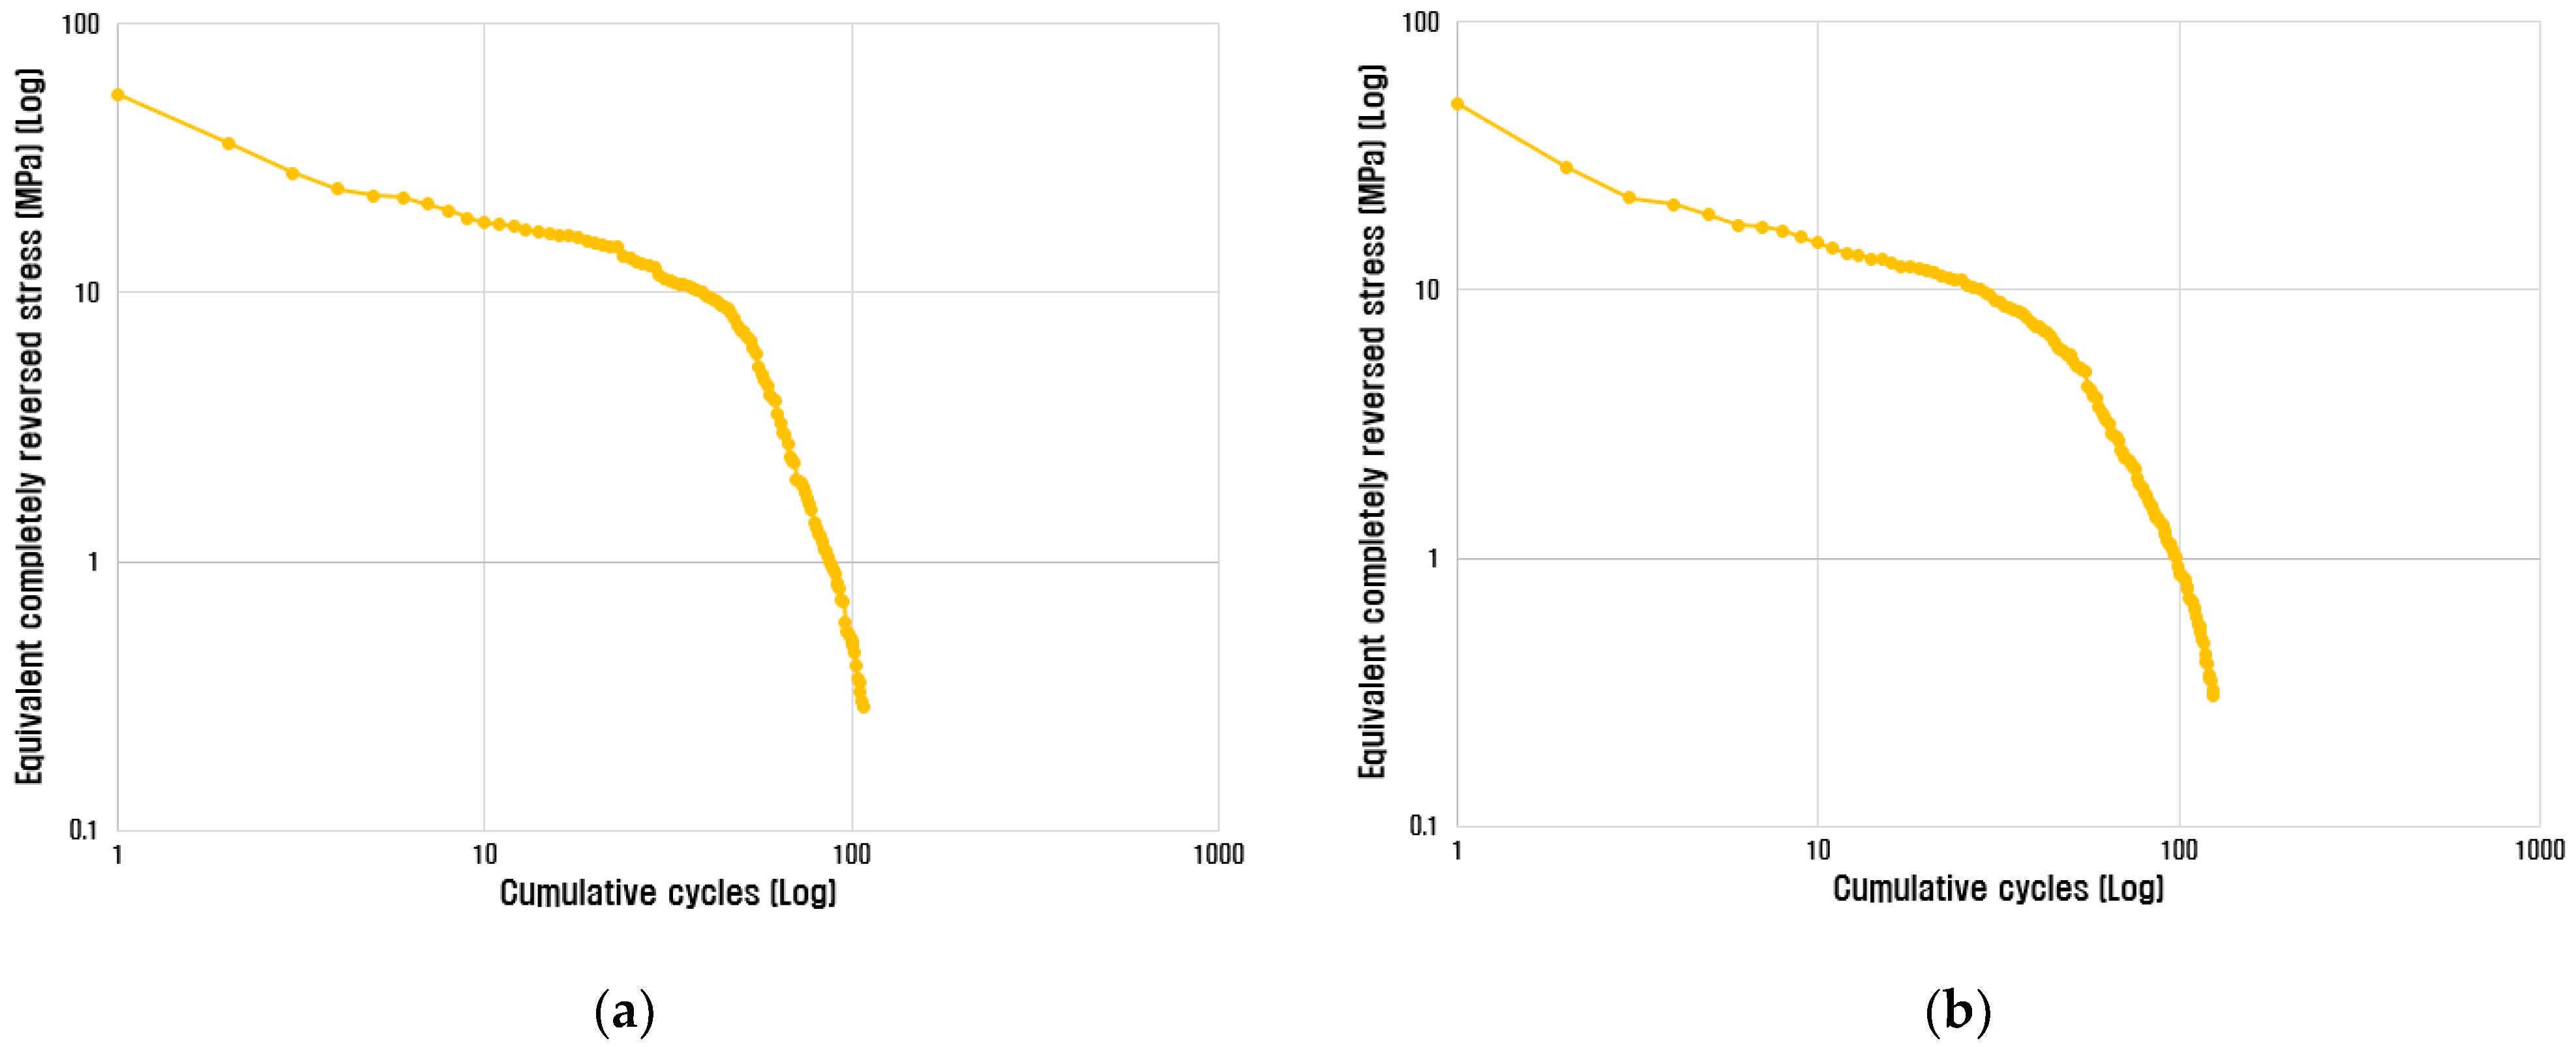
3. Results and Discussion

Figure 11 shows the shape of measured stress at each fastening device of agricultural by-product collector when the loading part was lifted to the highest point. The average maximum stresses for three repeated experiments were 183.6 MPa and 172.8 MPa for fastening devices 1 and 2, respectively. Figure 12 shows the shape of measured stress when the loading part was not lifted. The average maximum stresses were 145.8 MPa and 139.4 MPa for fastening devices 1 and 2, respectively. The stress level and its deviation were higher when the loading part was lifted because of the cantilever effect. The low-frequency fluctuation of stress was found in the non-lifting condition due to the interaction between collecting part of the collector and the ground.
The yield strength of the Steel UML UTS 300 that is the material of fastening devices was 230.769 MPa, and the average maximum stresses generated in each fastening device for each driving condition were measured to be 183.6 MPa, 172.8 MPa, 145.8 MPa, and 139.4 MPa as mentioned earlier. The static safety factors of each fastening device were calculated using these values and Equation (1) (Table 4). The static safety factors of fastening devices were greater than 1.0 in both driving conditions. Therefore, the design of the fastening device of agricultural by-product collector can be determined to be statically safe.
The shape of damage histogram for each driven conditions are shown in Figure 13 and Figure 14. A few load conditions caused most of the damage, and the other load conditions have negligible effect on the damage. Table 5 and Table 6 show the maximum damage condition at each fastening device. The maximum damage condition occurred in just one cycle; however, it accounted for more than 60% of the total damage. Therefore, it can be seen that the specific load condition has a decisive effect on the damage and fatigue life of the fastening device. Total damage was larger at the lifted loading part condition compared to the non-lifted condition. The shape of the load spectrums at each fastening device is shown in Figure 15 and Figure 16. It can be seen that the cycle in which the maximum load occurs is small, and the cycle occupied by a load less than 10 MPa accounts for more than 50%.
Table 7 shows the calculated fatigue life using total damage for each driving condition. Through a literature review, the average annual pruning time of orchard farmers in Korea was found to be 38.5 h [24]. Assuming that the agricultural by-product collector is continuously driven during the pruning season, the fatigue life of the fastening devices 1 and 2 is 8258 and 6105 years, respectively, when the loading part is lifted. In addition, the fatigue life of the fastening devices 1 and 2 under the condition that the loading part is not lifted is 17,095 and 38,993 years, respectively. Considering that the average service life of agricultural machines is 9 years in Korea [25], the fatigue life of the fastening device is sufficient, and it can be concluded that the fastening devices can be driven reliably for its expected lifetime.

4. Conclusions

In this study, the stress generated in the fastening device of the agricultural by-product collector was measured during flat ground driving to evaluate the static safety factor and fatigue life. The strain gage-based measurement system was constructed, and the experiment was conducted under the driving conditions of the lifted and non-lifted loading part of the by-product collector.
The main results of this study are as follows:
(1)
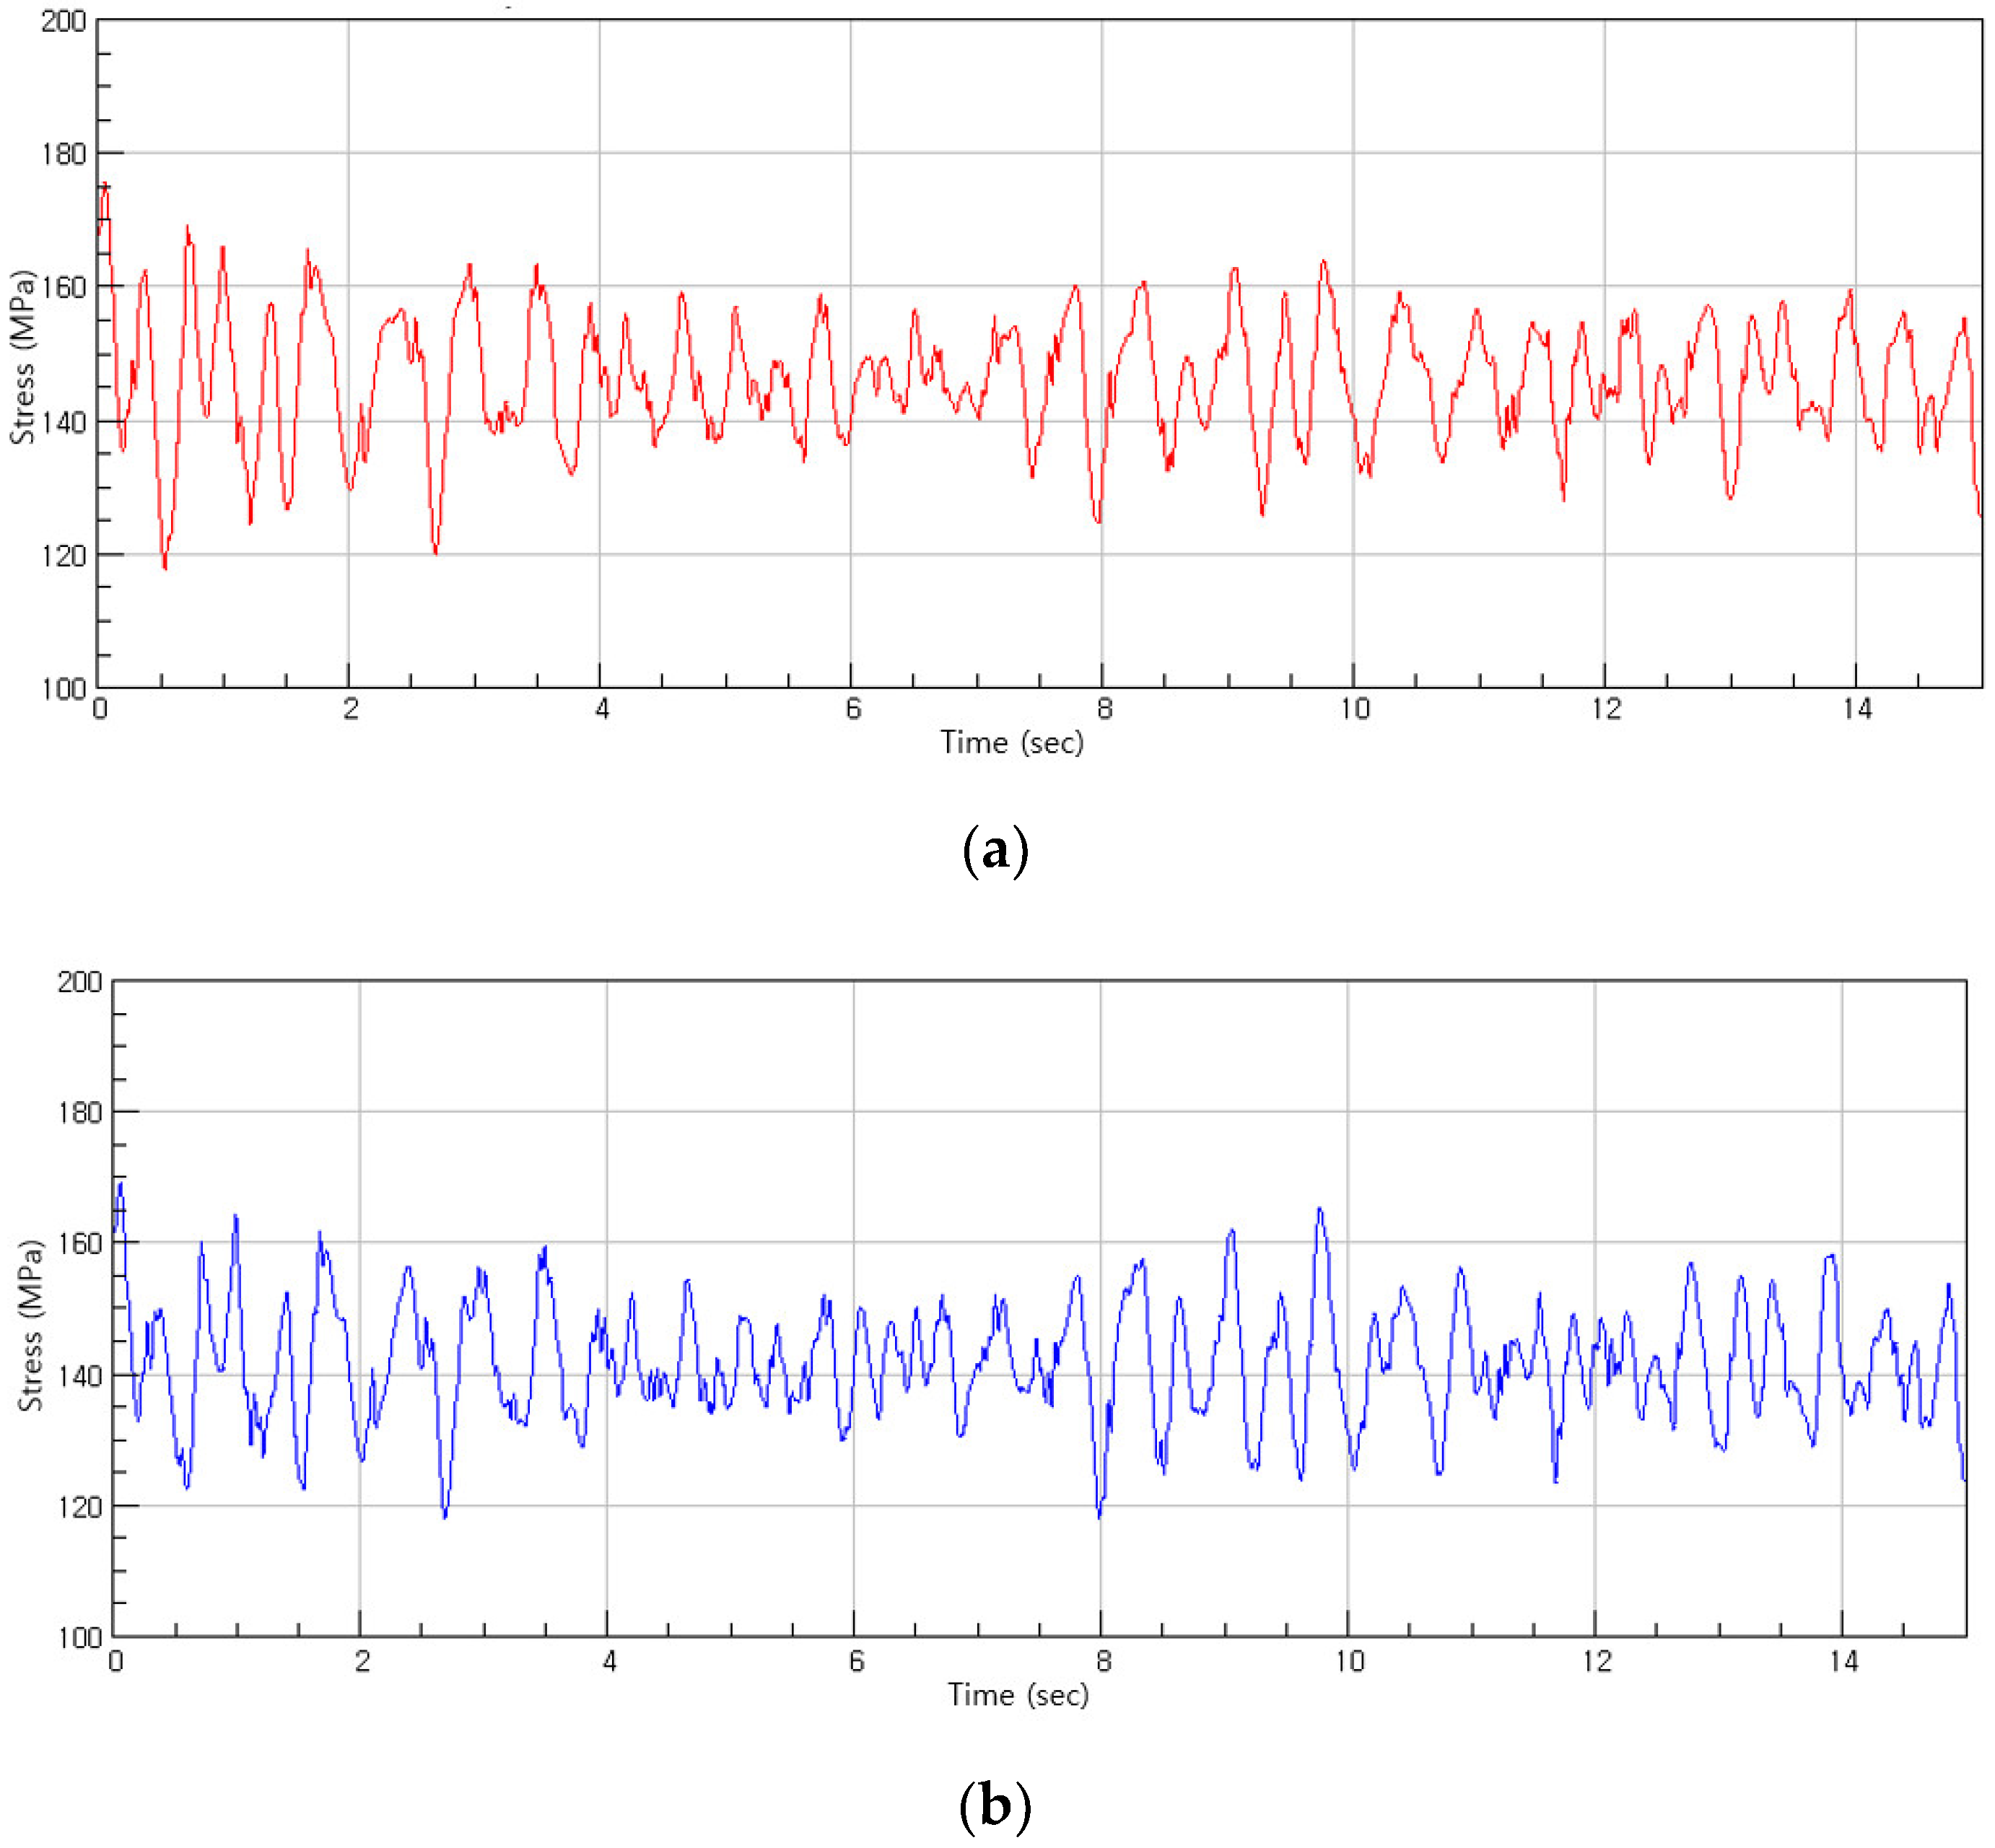
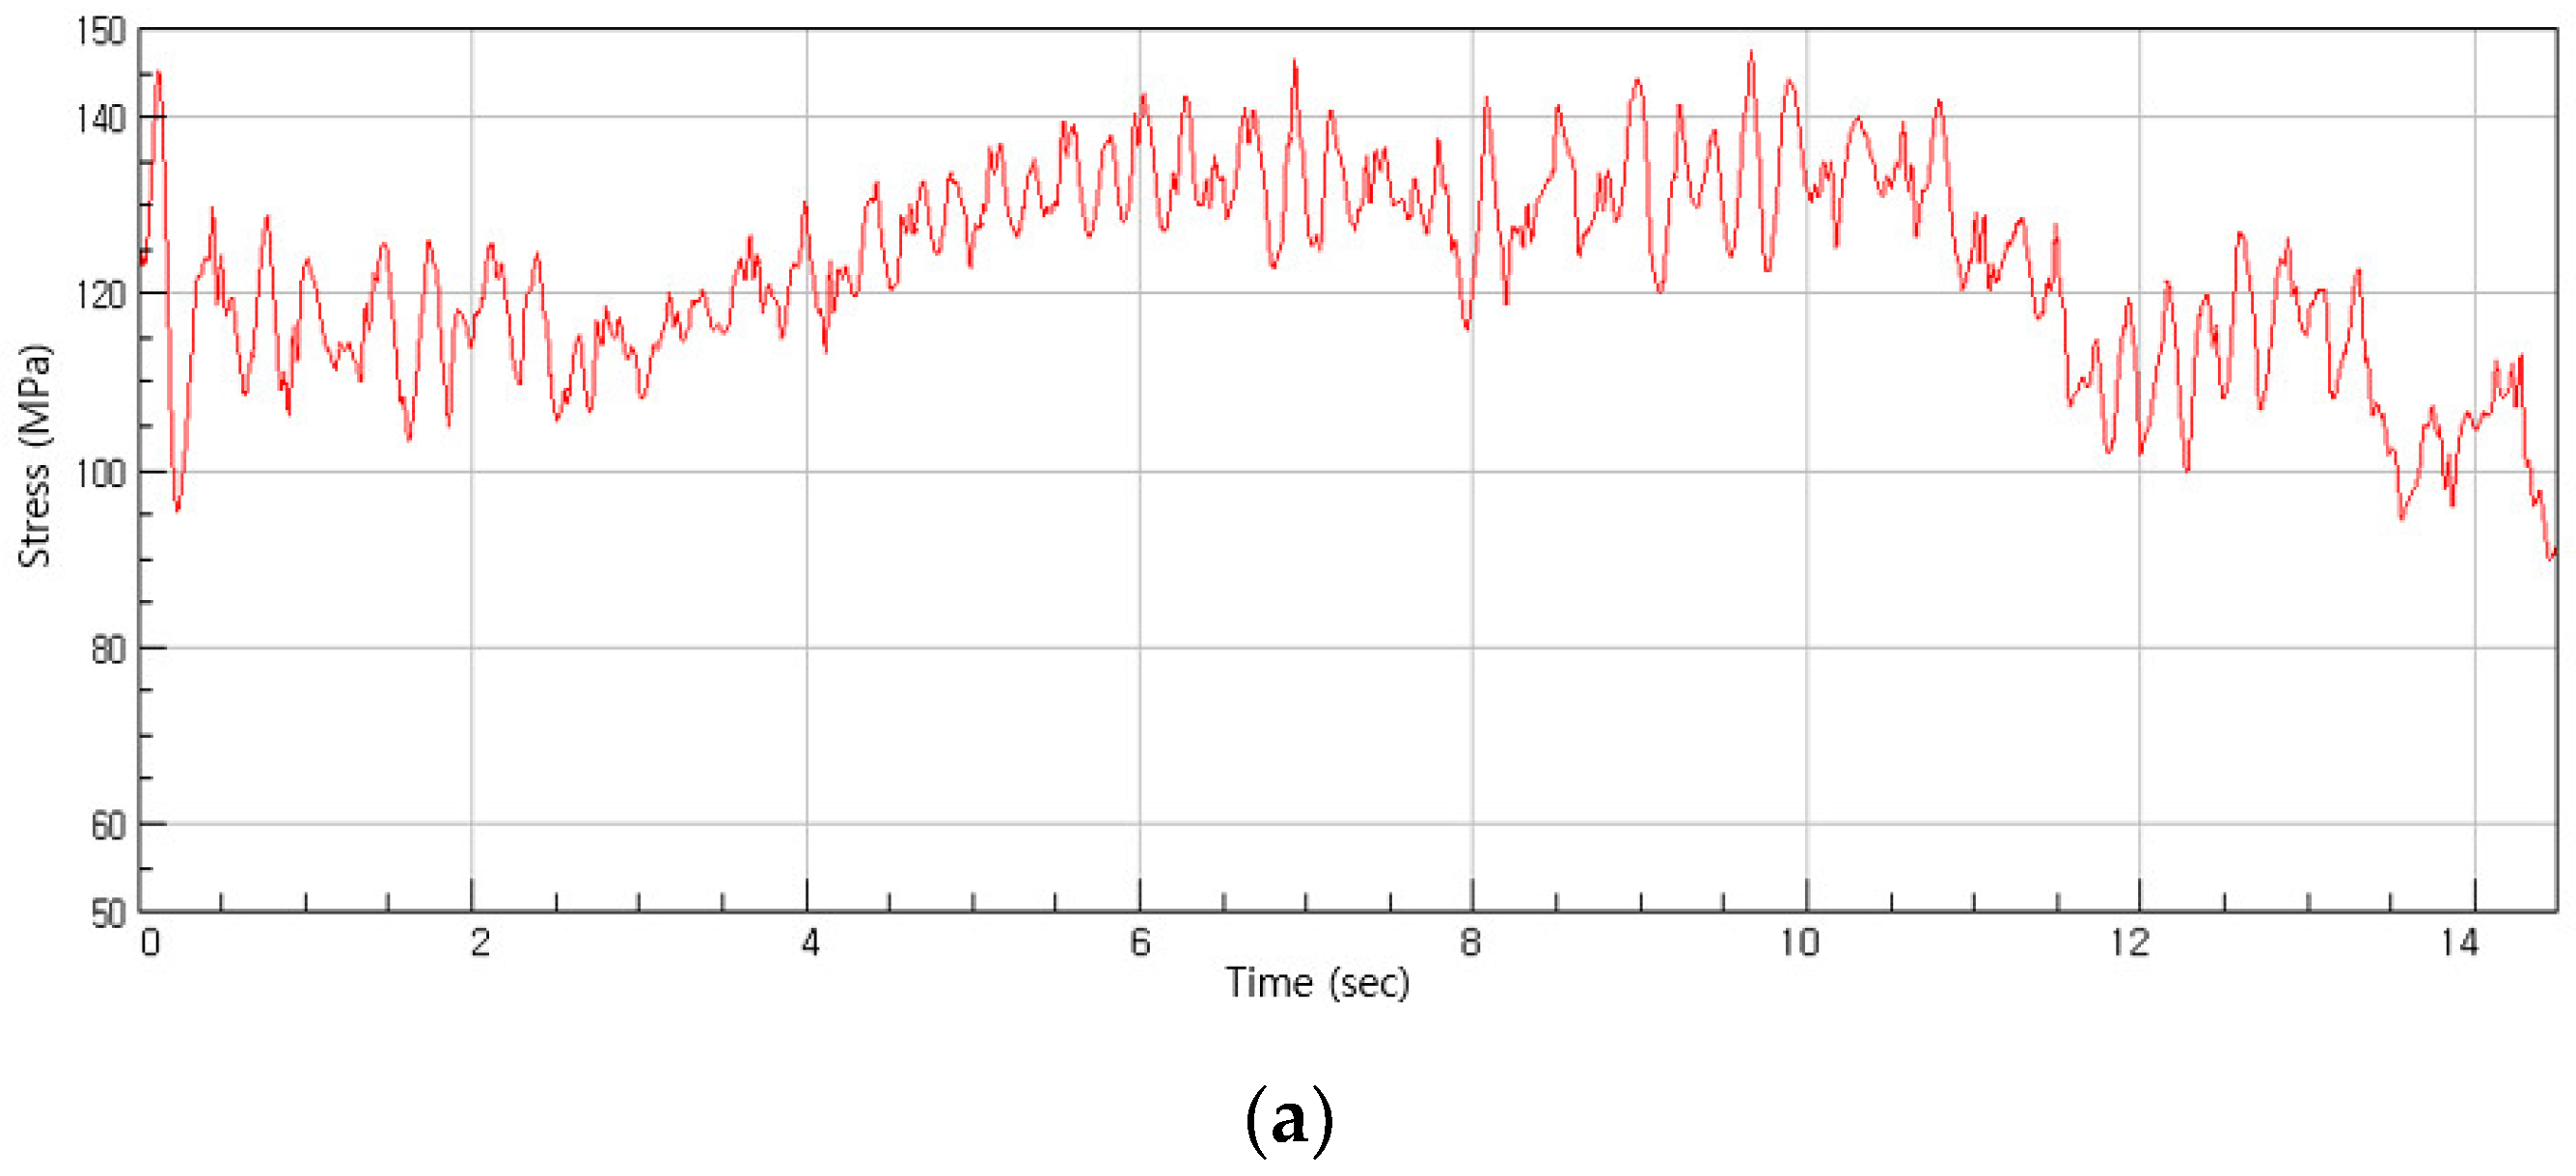
The average maximum stresses of the fastening devices 1 and 2 when the agricultural by-product collector was driven with the lifted loading part condition were 183.6 MPa and 172.8 MPa, respectively. Additionally, for the non-lifted loading part condition, the average maximum stresses of fastening devices 1 and 2 were 145.8 MPa and 139.4 MPa, respectively.
(2)
The static safety factors of the fastening devices ranged from 1.3 to 1.7 depending on operating conditions. It is considered that the fastening devices of agricultural by-product collector are statically safely designed for its hard flat ground driving conditions.
(3)
The maximum damage of the fastening devices ranged from 6.41 × 10⁻⁹ to 2.31 × 10⁻⁸ depending on driving conditions. A few load conditions caused most of the damage, and the other load conditions have a negligible effect on the damage.
(4)
Considering the average annual fruit tree pruning time of orchard farmers in the Republic of Korea, the fatigue life of the fastening devices ranged from 6105 to 38,993 years. It exceeds the expected lifetime of agricultural machinery in Korea, and it can be concluded that the fastening devices can be driven reliably on hard ground.
In future research, we plan to evaluate the static safety factor and fatigue life of the fastening devices when the agricultural by-product collector operates in various orchard farm environments.

Author Contributions

Theoretical and simulation analysis, J.-H.K. and M.S.; writing—original draft preparation, J.-H.K.; writing—review and editing, J.-S.N. All authors have read and agreed to the published version of the manuscript.

Funding

This work was supported by Korea Institute of Planning and Evaluation for Technology in Food, Agriculture, Forestry (IPET) through Advanced Agricultural Machinery Industrialization Technology Development Program, funded by Ministry of Agriculture, Food and Rural Affairs (MAFRA) (321058-02), Republic of Korea.

Institutional Review Board Statement

Not applicable.

Informed Consent Statement

Not applicable.

Conflicts of Interest

The authors declare no conflict of interest.

References

  1. Vincent, M.K.; Varghese, V.; Sukumaran, S. Fabrication and Analysis of Fatigue Testing Machine. Int. J. Eng. Sci. 2016, 5, 15–19. [Google Scholar]
  2. Jeong, S.U. Bending Fatigue Characteristics and Stress Analysis of STS304 Steel. J. Inst. Mar. Ind. 2007, 20, 79–84. [Google Scholar]
  3. Kang, M.S.; Koo, J.M.; Seok, C.S.; Park, J.S. Fatigue Characteristic of High Impact Polystyrene(HR-1360) Materials. Trans. Korean Soc. Mech. Eng. A 2010, 34, 763–769. [Google Scholar] [CrossRef]
  4. Yeom, H.H.; Jung, Y.C.; Kim, C.Y.; Kang, K.Y.; Lee, M.G.; Hong, M.S.; Jeon, Y.H. Ultrasonic Fatigue Test for a High Strength Steel Plate. J. Korean Soc. Manuf. Technol. Eng. 2015, 24, 89–593. [Google Scholar] [CrossRef] [Green Version]
  5. Murakami, M.; Takai, T.; Wada, K.; Matsunaga, H. Essential structure of S-N curve: Prediction of fatigue life and fatigue limit of defective materials and nature of scatter. Int. J. Fatigue 2021, 146, 106138. [Google Scholar] [CrossRef]
  6. Kim, J.T.; Han, H.W.; Oh, J.S.; Chung, W.J.; Cho, S.J.; Park, Y.J. Structural Design of Garlic Plants Footplate Considering Physical Characteristics of Elderly Women. J. Biosyst. Eng. 2020, 45, 16–23. [Google Scholar] [CrossRef]
  7. Ali, M.; Lee, Y.S.; Chowdhury, M.; Khan, N.A.; Swe, K.M.; Rasool, K.; Kabir, S.N.; Lee, D.H.; Chung, S.O. Analysis of Driving Stability and Vibration of a 20-kW Self-Propelled 1-Row Chinese Cabbage Harvester. J. Biosyst. Eng. 2021, 46, 48–59. [Google Scholar] [CrossRef]
  8. Hwang, S.J.; Kim, J.H.; Nam, J.S. Factorial Experiment for the Collecting Device of an Agricultural By-product Collector. J. Biosyst. Eng. 2020, 45, 422–431. [Google Scholar] [CrossRef]
  9. Kim, M.C.; Choi, E.S. Evaluation of Rail Fatigue Life by Grinding of Kyeong-Bu High Speed Line. J. Korean Soc. Railw. 2010, 13, 577–582. [Google Scholar]
  10. Cho, S.J.; Park, Y.J.; Han, J.W.; Lee, G.H. Fatigue Life Prediction of the Carrier of Slewing Reducer for Tower Crane. J. Korean Soc. Manuf. Process. Eng. 2015, 14, 131–140. [Google Scholar] [CrossRef] [Green Version]
  11. Lee, J.Y.; Nam, J.S. Load and Safety Analysis for Plow Operation in Dry Fields. J. Korean Soc. Manuf. Process. Eng. 2019, 18, 9–18. [Google Scholar] [CrossRef]
  12. Paraforos, D.S.; Griepentrog, H.W.; Vougioukas, S.G. Country road and field surface profiles acquisition, modeling and synthetic for evaluating fatigue life or agricultural machinery. J. Terramech. 2016, 63, 1–12. [Google Scholar] [CrossRef]
  13. Paraforos, D.S.; Griepentrog, H.W.; Vougioukas, S.G.; Kortenbruck, D. Fatigue life assessment of a four-rotor swather based on rainflow cycle counting. Biosyst. Eng. 2014, 127, 1–10. [Google Scholar] [CrossRef]
  14. Kepka, M.; Kepka, M. Parametric calculations of service fatigue life of welded T-joints. Procedia Struct. Integr. 2022, 38, 596–603. [Google Scholar] [CrossRef]
  15. Han, J.W.; Kim, E.K.; Moon, S.G.; Lee, H.M.; Kim, J.G.; Park, Y.J. Fatigue integrity assessment for tractor-mounted garlic-onion harvester. J. Terramech. 2022, 100, 1–10. [Google Scholar] [CrossRef]
  16. Hofstee, J.W.; Huisman, W. Handling and Spreading of Fertilizers Part 1: Physical Properties of Fertilizer in Relation to Particle Motion. J. Agric. Eng. Res. 1990, 47, 213–234. [Google Scholar] [CrossRef]
  17. Juvinall, R.C.; Marshek, K.M. Machine Component Design, 5th ed.; John Wiley & Sons Inc.: Hoboken, NJ, USA, 2011. [Google Scholar]
  18. Olieslagers, R.; Ramon, H.; De Baerdemaeker, J. Calculation of fertilizer distribution patterns from a spinning disc spreader by means of a simulation model. Int. J. Agric. Biol. Eng. 1996, 63, 137–152. [Google Scholar] [CrossRef]
  19. Wang, J.; Zou, D.; Wang, J.; Zhou, W. Testing and analysis of the shear modulus of urea granules. In IFIP Advances in Information and Communication Technology, Proceedings of the International Conference on Computer and Computing Technologies in Agriculture, Beijing, China, 18–20 September 2013; Springer: Berlin/Heidelberg, Germany, 2013; Volume 419, pp. 137–144. [Google Scholar] [CrossRef] [Green Version]
  20. Rahmanian, H.; Mahmoodi, M.; Azimi, H. Simulation of Draught Force During Chisel Ploughing Using Discrete Element Method. J. Biosyst. Eng. 2022, 47, 152–166. [Google Scholar] [CrossRef]
  21. Budynas, R.G.; Nisbett, J.K. Shigley’s Mechanical Engineering Design, 9th ed.; Mcgraw-Hill: New York, NY, USA, 2011; pp. 10–15. [Google Scholar]
  22. Han, K.H.; Kim, K.U.; Wu, Y.G. Severeness of Transmission Loads of Agricultural Tractor for Rotary Operation in Poorly Drained Paddy Field. J. Biosyst. Eng. 1999, 24, 293–300. [Google Scholar]
  23. Prenscia. The nCode Book of Fatigue Theory; Technical Reference Book; nCode International Ltd.: Sheffield, UK, 2005. [Google Scholar]
  24. Lee, Y.H.; Lee, J.H.; Lee, K.S.; Kim, K.R.; Lee, S.J. Ergonomic risk factors related to musculoskeletal symptoms in the vineyard workers. J. Korean Soc. Occup. Environ. Hyg. 2008, 18, 122–132. [Google Scholar]
  25. Lee, J.M.; Kim, Y.Y.; Hwang, S.J. A Study of Useful Life for Agricultural Machinery; National Institute of Agricultural Sciences: Wanju, Korea, 2017. [Google Scholar]
Figure 1. Shape of agricultural by-product collector.
Agriculture 12 01071 g001
Figure 2. Shape of fastening device.
Agriculture 12 01071 g002
Figure 3. 3D modeling of agricultural by-product collector.
Agriculture 12 01071 g003
Figure 4. Self-weight of collecting/transferring part.
Agriculture 12 01071 g004
Figure 5. Maximum stress generated on the fastening device.
Agriculture 12 01071 g005
Figure 6. Configuration of measurement system.
Agriculture 12 01071 g006
Figure 7. Attachment point of the strain gage.
Agriculture 12 01071 g007
Figure 8. Collecting/transferring part lifted to the highest point.
Agriculture 12 01071 g008
Figure 9. Fatigue life analysis process using nCode.
Agriculture 12 01071 g009
Figure 10. S–N curve for Steel UML UTS300.
Agriculture 12 01071 g010
Figure 11. Measured stress at each fastening device when loading part lifted: (a) fastening device 1; (b) fastening device 2.
Agriculture 12 01071 g011
Figure 12. Measured stress at each fastening device when loading part not lifted: (a) fastening device 1; (b) fastening device 2.
Agriculture 12 01071 g012aAgriculture 12 01071 g012b
Figure 13. The shape of damage histogram when loading part is lifted: (a) fastening device 1; (b) fastening device 2.
Agriculture 12 01071 g013
Figure 14. The shape of damage histogram when loading part is not lifted: (a) fastening device 1; (b) fastening device 2.
Agriculture 12 01071 g014
Figure 15. Load spectrum at each fastening device when loading part is lifted: (a) fastening device 1; (b) fastening device 2.
Agriculture 12 01071 g015
Figure 16. Load spectrum at each fastening device when loading part is not lifted: (a) fastening device 1; (b) fastening device 2.
Agriculture 12 01071 g016
Table 1. Material properties for simulation.
ItemsValue
Alloy steel (body frame)Poisson’s ratio0.3
Shear modulus (GPa)0.3
Density (kg/m3)1900
Synthetic rubber (wheel)Poisson’s ratio0.46
Shear modulus (GPa)0.4
Density (kg/m3)950
Interaction between wheel and groundStiffness (N/mm)408
Damping coefficient2.8
Coefficient of static friction1.55
Coefficient of dynamic friction0.8
Table 2. Specification of strain gage.
ItemSpecification
Model/Company/NationKFGS-5-350-C1-11/KYOWA/Japan
Gage factor (%)2.13 ± 1.0%
Gage Length (mm)5
Gage Resistance (Ω)350.0 ± 0.7%
Table 3. Material properties of fastening device.
ItemMaterial Properties
MaterialSteel UML UTS300
Yield strength (MPa)230.769
Ultimate strength (MPa)300
Elastic modulus (MPa)2.07 × 10⁵
Table 4. Static safety factor of the fastening device.
ItemFastening Device 1Fastening Device 2
When loading part is lifted1.31.3
When loading part is not lifted1.61.7
Table 5. Maximum damage condition at each fastening device when loading part is lifted.
ItemMean Stress (MPa)Stress Amplitude (MPa)Equivalent Stress (MPa)DamageNumber of Cycles
Fastening
device 1
159.8330.1964.622.31 × 10−81
Fastening
device 2
145.8431.1660.631.43 × 10−81
Table 6. Maximum damage condition at each fastening device when loading part is not lifted.
ItemMean Stress (MPa)Stress Amplitude (MPa)Equivalent Stress (MPa)DamageNumber of Cycles
Fastening
device 1
113.1940.1764.512.28 × 10−81
Fastening
device 2
109.9234.4954.436.41 × 10−91
Table 7. Fatigue life of each fastening device.
Driving ConditionFastening DeviceFatigue Life (Hours)Fatigue Life Considering 38.5 h of Annual Working Time (Years)
When loading part is lifted13.180 × 1058258
22.351 × 1056105
When loading part is not lifted16.582 × 10517,095
21.501 × 10638,993
Publisher’s Note: MDPI stays neutral with regard to jurisdictional claims in published maps and institutional affiliations.

