Article

The Impact of Digital Technology on Land Rent-Out Behavior: Information Sharing or Exclusion?

1
College of Humanities and Development Studies, China Agricultural University, Beijing 100193, China
2
Institute of Science and Development, Chinese Academy of Sciences, Beijing 100190, China
*
Author to whom correspondence should be addressed.
Agriculture 2022, 12(7), 1046; https://doi.org/10.3390/agriculture12071046
Submission received: 20 April 2022 / Revised: 11 July 2022 / Accepted: 12 July 2022 / Published: 19 July 2022
(This article belongs to the Special Issue Sustainable Agriculture: Theories, Methods, Practices and Policies)

Abstract

:
In the digital age, it is critical to understand the nexus between digital technology (DT) and land rent-out behavior (LRB). It has implications for reducing the rate of land abandonment to achieve sustainable agricultural development. A large dataset (n = 5233) dating from 2016 and coming from the China Family Panel Studies (CFPS) is used to explore the impact of DT on LRB by applying several econometric models, also including the “Recursive Bivariate Probit (RBP) model” and “Chain Multiple Mediation effect (CMM) model”. We provide empirical evidence that the DT’s information sharing effect positively impacted LRB, while an opposite effect is observed by the “digital divide (DT_GAP)” i.e., information exclusion that negatively impacted LRB. We further test the effect of two other variables, namely “digital information dependence” and “non-farm jobs” supposed as mediating factors of DT and DT_GAP in influencing LRB, respectively in a positive and negative way. In particular, the variable “nonfarm jobs” plays a mediating role conditional on the variable “digital information dependence” as a mediating variable at the first level. In addition, statistical tests reveal that the impact of DT and the DT_GAP on LRB is not significant in terms of regional preferences but is significant in terms of age of householder and household income level.

1. Introduction

Measuring Digital Development: Facts and Figures 2021, published by International Telecommunication Union (ITU), shows that global Internet penetration is 59.5% as of 2020 and measures that it will reach 63% in 2021 [1]. As the largest developing country in the world, China has an Internet penetration rate of 73%, with 78.3% in urban areas and 59.3% in rural areas [2]. The information dividend released by the development of the Internet has contributed to the economic and social development of the world. The land is an important resource in agricultural production. Promoting the land production factor mobility is a key link to achieving the improvement of agricultural production efficiency. As a largely agricultural country, highly fragmented land and smallholder are the basic characteristics of China’s agriculture. However, low level of agricultural mechanization, high degree of land fragmentation, and small-scale family farms are also the characteristics of the agricultural development constraints faced by most developing countries or regions. Therefore, promoting the land production factor mobility and integrating finely fragmented land are inevitable requirements for improving agricultural production efficiency and achieving sustainable development of the agricultural activity. Digital technology (DT) breaks through the limitation of time and space and brings about a change in information transmission. There are advantages to optimizing the allocation of land resources and promoting the mobility of land resources. However, it is undeniable that there is a digital divide (DT_GAP) caused by unevenness and inadequacy in the development of DT. It can produce information exclusion and weaken the positive impact brought by DT. China has realized the digital management of national land use status in 2014 [3]. In recent years, the Chinese government has actively promoted the reform of rural land digitization. It has pushed forward the digital management process of registration, transfer, and distribution of rural land. Taking China as an example, we reveal the impact of DT and the DT_GAP on land rent-out behavior (LRB) and how this impact can be interpreted. It is meaningful for developing countries to reduce the rate of land abandonment, improve agricultural efficiency, and achieve sustainable farmer livelihoods.
The nexus between DT and income levels has received extensive academic attention and has been thoroughly researched. Existing studies have strongly confirmed that the development of DT plays a positive role in global economic growth and poverty alleviation [4,5]. The impact of DT on agriculture development has also been extensively researched. Agricultural information, which is effectively supplied by DT, controls damage to crops by adverse factors (such as natural disasters) and achieves increased agricultural production [6]. At the same time, the distribution of production factors and the structure of cultivation are optimized by information access from DT, thus increasing agricultural productivity [7]. Agricultural productivity and efficiency are improved by artificial intelligence, which is an important application of DT, while the problem of labor shortages and sustainable agricultural development are addressed effectively [8]. For developing countries, the information problems that prevented smallholders from accessing markets are solved by the application of DT in agricultural production [9]. It is specifically practiced in China where DT is embedded in agricultural production. Agricultural cell phone SMS services had appeared in the Chinese agricultural market in the early 2000s. Farmers’ price search costs before the market launch of agricultural products are reduced by SMS services, which improves farmers’ position in the market. Therefore, farmers use agricultural information technology to obtain more information and increase the selling price of their agricultural products [10]. With the rise of e-commerce, e-commerce clustered villages (e.g., Taobao villages) promote e-commerce down to the rural market. The cluster development of rural e-commerce has broadened the channels for agricultural product sales [11,12].
The land is one of the key elements of agricultural production and has been focused on by agricultural economics. Good resource allocation can effectively improve productivity. Some studies have shown that the effective allocation of resources and the improvement of agricultural productivity are promoted by land transfer (i.e., an active land buying and selling market). When land transfer promotes large-scale operation, agricultural productivity is effectively improved and farmers’ agricultural income is increased [13,14]. Philippines land reform, which included government land allocation and prohibition of alienation, reduces average farm size by 34% and agricultural productivity by 17%, which is a negative example [15]. In China’s land reform, the Chinese central government has proposed the “Three Rights Separation” (“Three Rights Separation” refers to the separation of ownership right, contracting right (disposal right) and operation right of land. In China, the transfer of agricultural land refers to the transfer of operation rights). It encourages the transfer of operation rights to professional farmers to increase farm income by increasing the operation scale as far as possible [16,17]. In 2019, the scale of transferred land in China accounts for 28.94% of the total land [18]. In terms of land rental characteristics, land rentals from smallholders to other operators are very limited. Such characteristics highlight the long-term nature of smallholder agricultural production in China and the obstacles to expanding agricultural production on a larger scale [19].
LRB is driven by many factors, including economic factors, cultural factors, and individual characteristics [20]. For example, people who have experienced famine are more reluctant to rent out their land [21]. Household labor migration also has an effect on LRB, and this effect varies by the size of labor migration and region difference [22]. At the same time, numerous studies have shown that there is a deviation between land rental willingness and behavior [23,24,25]. In practice, the deviation arise mainly from the imperfection of the land rental market and related systems, and the lack of property income for farmers in process of land rental [24]. At this stage, the nexus between DT, more precisely Internet technology, and land use is also more fully justified. DT, represented by Internet technology, can enhance the accessibility of modern technologies in agriculture (e.g., agricultural machinery) and improve land use efficiency [26]. Meanwhile, DT can significantly improve information asymmetry in agricultural markets, while reducing cropland abandonment. An empirical study based on a sample of 8031 farming households showed that Internet use can reduce the abandonment of cropland by 43.20% [27].
It is clear that the mobility of land production factor is essential to improving land utilization [28]. However, the nexus between DT and land rental has been explored only preliminarily and is to a very limited extent. Related research has concluded that farmers’ land rental behavior (including rent out and rent in) was significantly facilitated by access to agricultural information through the Internet [29]. Among them, the information-seeking ability is an important impact path of the Internet on land rental [30]. The negative impact of DT is also not negligible. DT_GAP contributes to the widening of the household wealth gap [31], the further polarization of the educational divide [32], exacerbating inequalities in healthcare accessibility [33], and exclusion of the aging population [34]. Meanwhile, DT also has negative effects on individuals’ behaviors and perceptions, such as DT can exacerbate people’s pessimism [35,36]. However, existing studies have not focused on the nexus between the DT_GAP and land rental.
In summary, there is a consensus in the existing literature on the positive role of DT, represented by the Internet, in promoting economic development and poverty alleviation. The positive impact of DT in promoting agricultural production efficiency and land utilization with information empowerment is also widely discussed. At the present stage, although the amount of literature on the impact of DT on land rental is limited, the positive effect of DT agricultural land rental has been initially affirmed. Undeniably, the existing studies still have the following shortcomings. On the one hand, existing studies have not paid attention to the impact of the DT_GAP generated by the uneven development of DT on LRB. On the other hand, in terms of the available literature, exploring the nexus between DT and LRB is still insufficient, and the mechanism of DT’s impact on LRB has not been interpreted in depth.
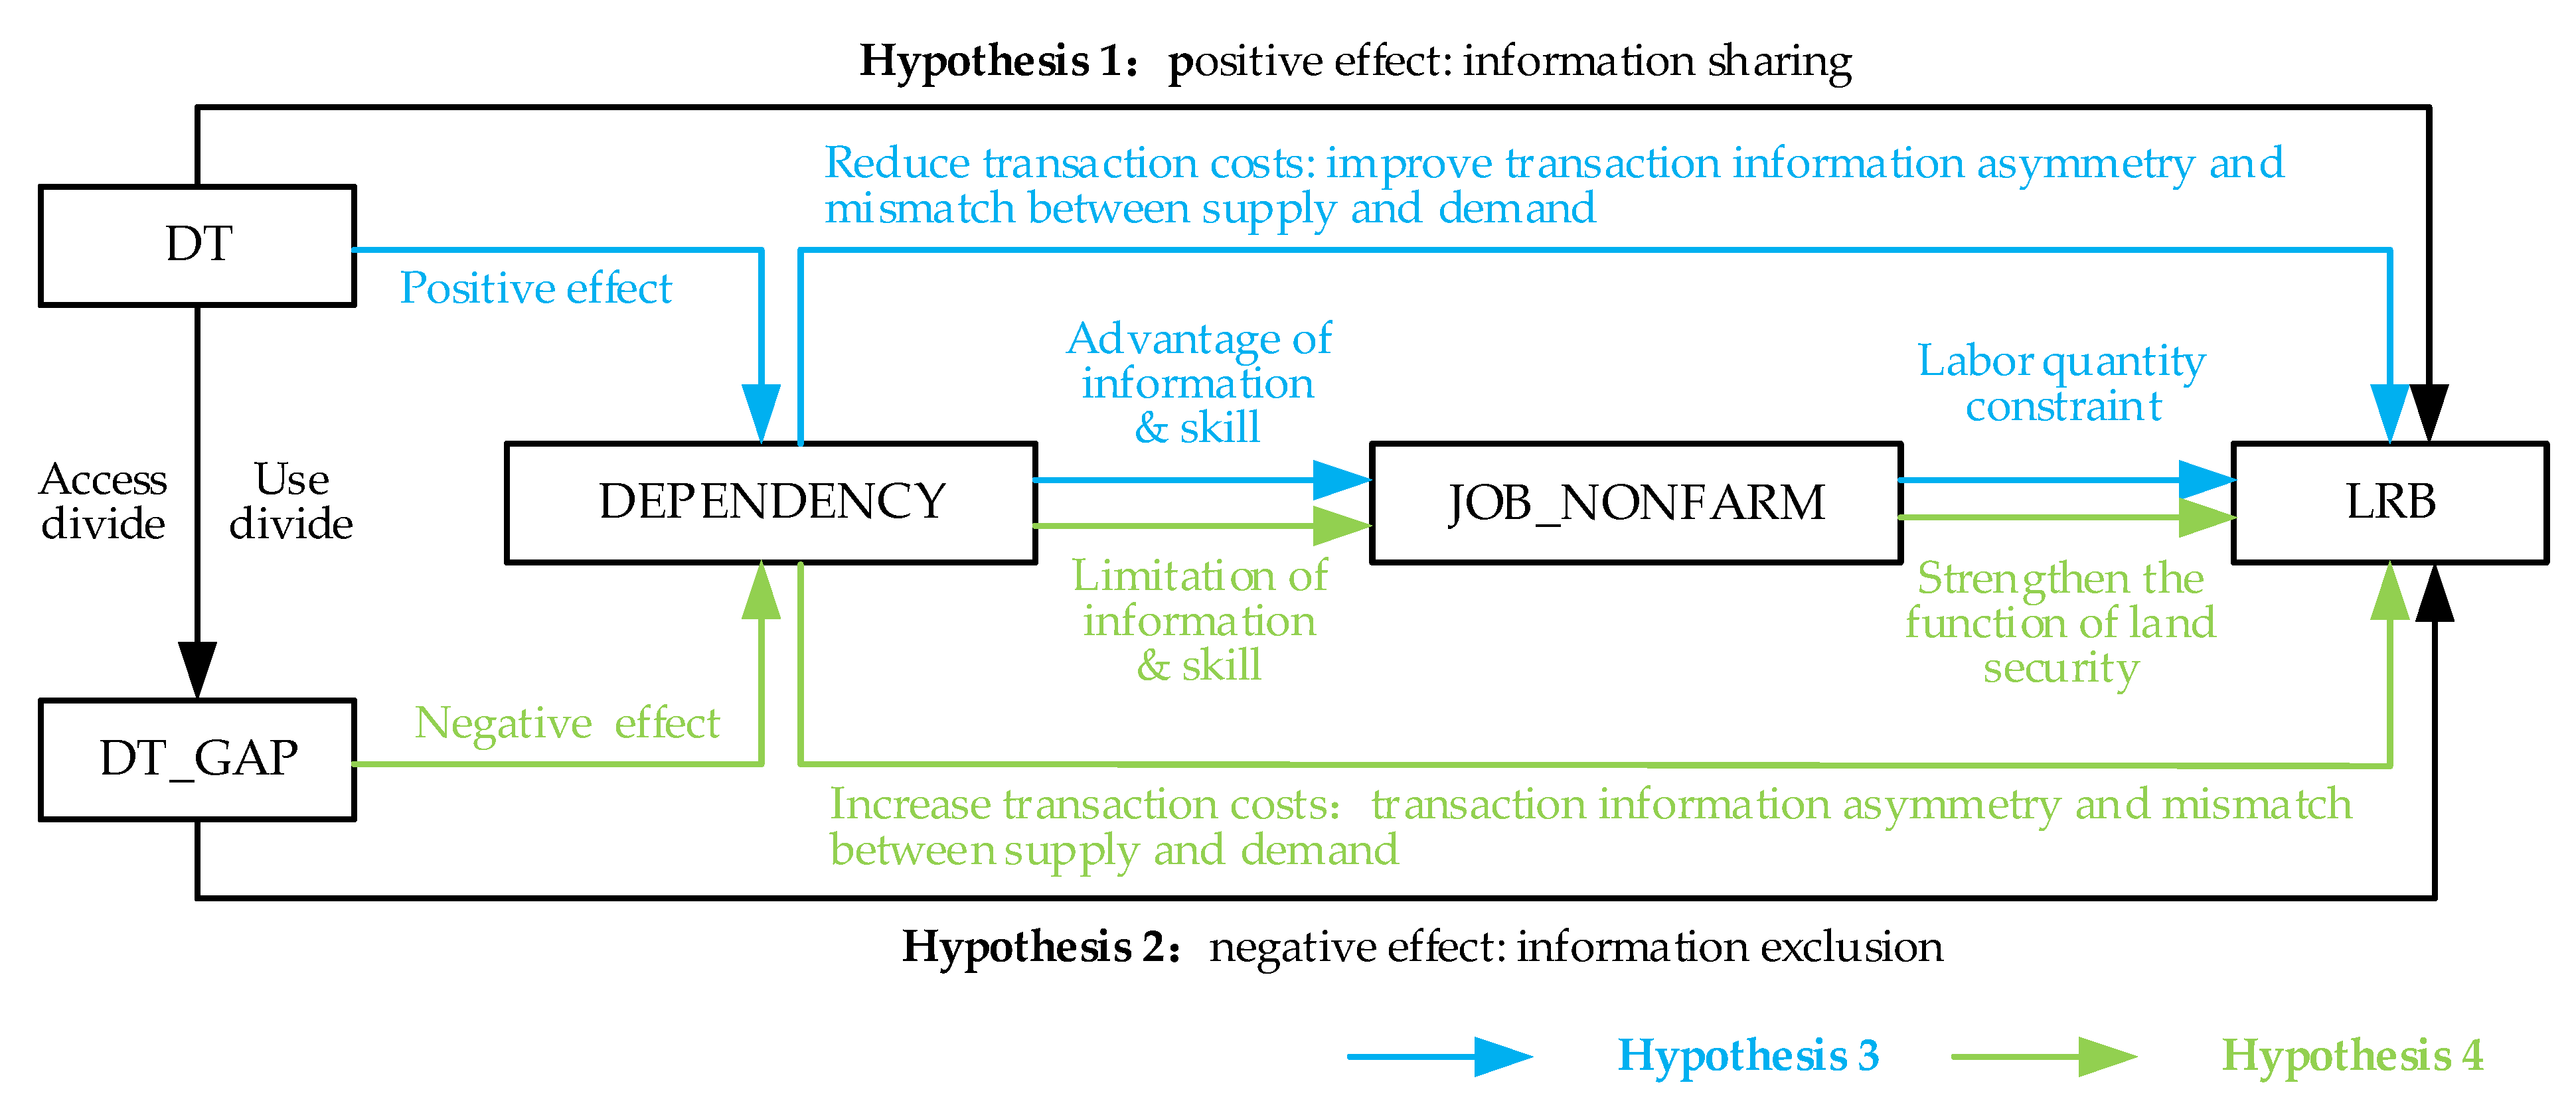
Based on the existing literature, we will analyze the information sharing effect of DT’s impact on LRB and how this impact can be interpreted. Meanwhile, we will also analyze the information exclusion effect of DT_GAP’s impact on LRB and how this impact can be interpreted. Our research will enrich the studies on the nexus between DT and LRB, and fill the gap in the studies of DT_GAP’s impact on LRB.

2. Theoretical Analysis and Research Hypotheses

2.1. Information Sharing and Exclusion of DT

In market economic activities, the theory of information asymmetry assumes that different people have different knowledge of information. Those who have more adequate information tend to be in a more advantageous position, while those who are poorly informed tend to be in a more disadvantageous position [37]. The imbalance caused by information asymmetry impacts the efficiency of market allocation. For example, the information-advantaged party always captures the surplus generated by information asymmetry. In the era of mobile Internet, as a representative of DT, the Internet not only shortens the time distance of information transmission but also improves the timeliness of the information and crosses the geographical limitation. The universal and shared nature of the Internet has reduced information asymmetry. It has improved access to information for the individuals who are in information disadvantaged. Meanwhile, the ICTs revolution has the potential to create new means of social exclusion [38], which is mainly reflected in the information and knowledge inequality brought about by DT_GAP.
In areas of abundantly DT application scenarios, the information sharing effect of DT has fully alleviated information dislocation. Information grabbing will be alleviated or eliminated with the widespread use of DT. In reality, however, a fully covered scenario for the application of DT does not exist. The primary DT_GAP is generated by hardware exclusion, which is mainly reflected in the lack of broadband access for the population in developmentally disadvantaged areas. The secondary DT_GAP is generated by use exclusion, which is mainly reflected in information exclusion of specific populations, including racial exclusion, aging exclusion, and economic or social development exclusion [39,40,41]. It can be considered that both the primary and secondary DT_GAP form a potential information exclusion. The DT_GAP exacerbates information grabbing by worsening the original information asymmetry. Therefore, while DT exerts its information-sharing effect, the DT_GAP generated by the uneven development of DT brings about an information exclusion effect.

2.2. Impact of DT on LRB: Theoretical Analysis and Research Hypothesis

The framework diagram of the theoretical analysis of DT’s impact on LRB was reported in Figure 1.
Information mismatch and information asymmetry are the specific forms of transaction costs in the land rental process, while the search cost of matching supply and demand is reduced by DT. For the side of land rent-out, DT improves the bargaining power and increases the benefits of land rental [42]. Meanwhile, DTs are better than traditional information technologies in terms of timeliness and convenience of information. Therefore, the information advantage of DT increases the farmers’ dependence on digital information channels (DEPENDENCY). With the increase in farmers’ DEPENDENCY, the transaction costs caused by information asymmetry and supply-demand mismatch in land transactions are reduced, further facilitating the formation of LRB decisions for farmers’ households. In the Internet era, the DEPENDENCY is critical for farmers to access nonfarm jobs (JOB_NONFARM). The DEPENDENCY gives farmers more advantage of information. Job seekers, who use DT, get better quality jobs than those who use traditional media [43]. Rural mobile workers with DT skills and DEPENDENCY have access to higher quality income. This is because their skills advantage and information advantage realize the substitution of low-skilled labor groups.
It is undeniable that there is a widespread real dilemma of inadequate and uneven development of DT, namely the DT_GAP problem, which is reflected in the access divide and the use divide. Individuals who use the Internet will further develop Internet knowledge, widening the gap between them and those who do not use the Internet [44], ultimately, there is an information exclusion effect on individuals who do not have access to digital or the Internet. DT_GAP deprives or excludes some individuals from accessing digital information channels, which is attributed to Internet access restrictions or lack of skills to use the Internet. Both of these restrictions reduce or prevent some groups from DEPENDENCY. This will further reduce the likelihood that farmers have access to JOB_NONFARM opportunities. The increase of JOB_NONFARM opportunities will weaken the social security function of land to some extent [45,46]. In other words, the decrease of JOB_NONFARM opportunities will strengthen the social security function of land, then reduce the probability of LRB.
Since the theory of New Economics of Labor Migration was proposed, the nexus between labor migration and factor markets in the place of emigration has been concerned [47]. Agricultural laborers engage in non-agricultural production, leading to a reduction in the number of laborers engaged in agricultural production, which changes the ratio of land to labor factors, resulting in a mismatch between the number of laborers and the scale of the existing agricultural industry. In short, the number of laborers constrains the scale of agricultural production. It can be expected that after the transfer of labor originally involved in agricultural production to the non-agricultural production sector, farm households will reconfigure the ratio of land to labor factors through the land rental market [48].
Based on the above analysis, we propose the following research hypothesis to be tested:
Hypothesis 1 (H1).
The information sharing effect of DT has a significant, direct, and positive effect on farmers’ LRB.
Hypothesis 2 (H2).
The information exclusion effect of DT (DT_GAP) has a significant negative effect on the LRB of farmers.
Hypothesis 3 (H3).
DEPENDENCY and JOB_NONFARM are indirect factors, i.e., mediators of DTU, positively influencing LRB in sequence with each other.
Hypothesis 4 (H4).
Similar to H3, DEPENDENCY and JOB_NONFARM are indirect factors, i.e., mediators of DT_GAP, negatively influencing LRB in sequence with each other.

3. Data Sources, Variables, and Empirical Methods

3.1. Data Sources

China Family Panel Studies (CFPS) data were used in this article. This dataset was provided by the Institute of Social Science Survey (ISSS) of Peking University. CFPS focuses on the economic and non-economic welfare of Chinese residents, and many research topics, including economic activities, educational achievements, family relations and family dynamics, population migration, health, etc. It is a national, large-scale, multidisciplinary social survey project, which uses computer-assisted survey technology to conduct interviews [49]. CFPS program follows the relevant laws and policies of the People’s Republic of China regarding the protection of personal information.
CFPS uses the implicit stratification method to draw multi-stage probability samples, and the samples of each sub-sample frame are obtained by three stages of drawing. The first-stage sample is county-level administrative units, the second-stage sample is village-level administrative units, and the third-stage sample is households. In the third stage, the sampling frame is constructed using the map address method, and the sample households are drawn using circular equiprobable sampling with random starting points. Through data cleaning, we obtained a sample of 5233 rural households, distributed across 455 communities in 25 provincial administrations in a new cross-sectional dataset.

3.2. Variable Settings and Basic Descriptive Statistics

The variables, definitions, and descriptive statistics are reported in Table 1.
Explained variables. LRB indicates whether the respondent farm household had land rent-out behavior in 2015. The mean value of LRB shows that 15.5% of the overall sample had LRB.
Core explanatory variables. DT indicates whether or not household members used the Internet in 2015. The value of 1 is assigned if any member of the household uses the Internet, and 0 is assigned otherwise. The mean value of DT indicates that 21.9% of rural households have been able to access and use the Internet.
Control variables. Refer to the existing literature on the behavioral decisions of rural residents or households [35,50]. Eleven control variables covering both individual characteristics and household characteristics were selected in our research. For aspects of individual characteristics, we selected individual characteristic variables such as AGE, GENDER, HEALTH, EDUCATION, and PARTY of the householder (Since the CFPS questionnaire does not respond to specific information about the head of household. We have chosen to substitute information on the head of household for the household financial respondent (decision maker) by referring to the substitution guidelines commonly used in microdata studies). For aspects of family characteristics, we selected AGE_F, HEALTH_F, EDUCATION_F, MARRY, FAMILYSIZE, and PINCOME_F as control variables for household characteristics. The specific definitions and basic descriptive statistics for all control variables were shown in Table 1. The descriptions were not repeated here.
Auxiliary variables. In accordance with the research design, relevant auxiliary variables were introduced to discuss the impact of the information sharing effect and exclusion effect of DT on LRB. The variable JOB_NONFARM indicates whether or not a household member was engaged in nonfarm jobs during 2015. The mean value shows that 72.0% of rural households were engaged in nonfarm jobs, indicating that nonfarm jobs have become the main employment option for rural households in China. The variable DEPENDENCY indicates the level of dependence on Internet information channels. Both of these variables are mediating variables for discussing the impact of DTU on LRB. We also introduced the frequency of Internet usage scenarios, including the frequency of use in five scenarios: learning, work, social, entertainment, and trade activities, to measure DT_GAP. In terms of frequency of use in different scenarios, social interaction is one of the most frequent scenarios.
Regional variables. To control regional differences and counter the impact of possible unmeasured omitted variables on the model estimation results. Three regional variables were set by using the northeastern region of China as the reference region, namely EASTERN, CENTRAL, and WESTERN.

3.3. Empirical Methods

3.3.1. Probit Model

Based on the characteristics of the data distribution of our chosen explanatory variable LRB (dichotomous variables), the Probit model was selected to test the effect of DT on LRB. The specific numerical derivation process of Probit was not shown anymore, and the equation of the model was set in the form shown in Equation (1). In Equation (1), L R B i denotes the LRB of the i-th sample household, i = 1,2, …, 5233. D T U i denotes the DT of the i-th sample household, C V i r denotes the r-th control variable of the i-th sample household, r = 1,2,…,11. R V i k denotes the k-th regional control variable for the i-th sample household, k =1,2,3. β 0 , β 1 , β 2 r , β 3 k denotes the coefficient to be estimated, respectively. ε i denotes the random error term.
L R B i = β 0 + β 1 D T U i + β 2 r C V i r + β 3 k R V i k + ε i

3.3.2. Recursive Bivariate Probit (RBP) Model

There may be endogeneity between DT and LRB arising from omitted variables. That is, there may be some important explanatory variables that are omitted due to database limitations or subjective preference of the researcher, and these explanatory variables may be correlated with the model’s disturbance term, i.e., the omitted explanatory variables are correlated with the existing explanatory variables, resulting in biased model estimates in Probit model. For this reason, RBP model with instrumental variables is constructed to predict the effect of endogenous dichotomous explanatory variables on dichotomous explanatory variables, and the model equation is set to the form shown in Equation (2). In Equation (2), I V i is the instrumental variable selected for the endogenous variable DT. In this article, the mean value of DT in the same community (excluding the sample itself) is selected (DT_Mean). It is clear that DT_Mean cannot have a direct impact on LRB. Meanwhile, the behavior and cognition of groups within a community can have an effect on the behavior and cognition of individuals, which we call the neighborhood effect or endogenous interaction effect [50]. Therefore, DT_Mean satisfies the principle of bounded exclusion for the selection of instrumental variables. α 0 , α 1 , α 2 r , α 3 k , μ 0 , μ 1 , μ 2 r , and μ 3 k denote the coefficients to be estimated in the two equations respectively. ξ 1 i and ξ 2 i denote the random error term in the two equations, respectively. The other parameters have the same meaning as in Equation (1).
The use of the RBP model requires the existence of correlation requirement for the two perturbation terms of the two equations in Equation (2). athrho is the parameter that tests whether the perturbation terms are correlated. If athrho passes the significance test, i.e., the original hypothesis that the two perturbation terms are not correlated is rejected, indicating that the use of the RBP model is necessary, and the results of the Probit model are biased.
{ D T i = α 0 + α 1 I V i + α 2 r C V i r + α 3 k R V i k + ξ 1 i L R B i = μ 0 + μ 1 D T i + μ 2 r C V i r + μ 3 k R V i k + ξ 2 i

3.3.3. Principal Component Analysis (PCA): Measurement of DT_GAP

To provide a more comprehensive measure of the DT_GAP, we have introduced the frequency of Internet use for learning, work, social, entertainment, and business activities as a comprehensive measure of DT_GAP. PCA method is used to reduce the dimensionality and extract the principal components (DT_PCA) as the main source of data for the calculation of DT_GAP. PCA method is a way of replacing the original variables with a new set of mutually uncorrelated composite variables by regrouping them. The extraction of principal components by the PCA method is a process of dimensionality reduction while retaining more data efficiency [51].
We need to perform a correlation test on the different components selected before moving on to PCA. At the 1% statistical level, the bartlett test passes the significance test. It indicates that the original hypothesis that all variables are uncorrelated with each other is rejected. The test parameter KMO = 0.898 indicates that the sum of squares of the simple correlation coefficients of the different components is much greater than the sum of squares of the partial correlation coefficients. In other words, there is a strong correlation between the different components. Based on all results of the statistical test above, PCA is allowed to be continued.
Table 2 reports the relevant test values for the PCA process. The rules for PCA selection require that the eigenvalue of the selected principal component factor needs to be greater than 1. However, we also have to meet another requirement is that the cumulative variance contribution rate of the principal component be 0.85 or higher. For this reason, we selected both factor1 and factor2 as the components in PCA. We further calculated the uniqueness of the variables, all of which are less than 0.6, indicating that the variance explained by the common factors is large. Therefore, all the factors selected in this article satisfy the uniqueness requirement of the PCA method.
Further, the extracted factors were summed up using proportion as the weight and calculated as shown in Equation (3). In Equation (3), D T _ P C A i denotes the calculated principal component and D T _ G A P i denotes the digital divide. f 1 i indicates the proportion of the factor1, v a l u e 1 indicates the eigenvalue corresponding to the factor1. j indicates the number of factors, according to the above calculation, two factors should be extracted. So, the value of j here is 2. Max ( ) denotes that extracting the maximum value of a variable. Assigned a value to D T _ G A P i by calculating the specific difference between the maximum value of D T _ P C A i and the D T _ P C A i of each sample. The other parameters have the same meaning as in Equations (1) and (2).
{ D T U _ P C A i = f 1 i * v a l u e 1 + + f j i * v a l u e j v a l u e 1 + + v a l u e j D T U _ G A P i = Max ( D T U _ P C A i ) D T U _ P C A i

3.3.4. Chain Multiple Mediating Effects (CMM) Model

The CMM model is suitable for testing mediating effects that contain two or more mediating variables, and there mediating variables are related to each other [52]. Compared with the general mediating effects model, the advantage of the CMM model is that it takes full account of the relationship between the mediating variables. Therefore, the CMM model can be effective in reducing errors in model estimation.
Theoretical analysis has shown that the mediating variable DEPENDENCY impacts LRB through another mediating variable JOB_NONFARM. This means that the two mediating variables are related to each other and apply to the CMM model. A prerequisite for constructing CMM model is that DT has a significant effect on LRB. Obviously, this prerequisite was confirmed in the benchmark regression model and robustness tests above. According to the interpretation of the path of DT’s impact on LRB in the theoretical analysis, we need to construct four equations to test all the impact path of DT on LRB (as shown in Equations (4)–(7)).
L R B i = β 0 + β 1 D T i + β 2 r C V i r + β 3 k R V i k + ε i
D E P E N D E N C Y i = λ 0 + λ 1 D T i + λ 2 r C V i r + λ 3 k R V i k + ζ 1 i
J O B _ N O N F A R M i = η 0 + η 1 D E P E N D E N C Y i + η 2 D T i + η 3 r C V i r + η 4 k R V i k + ζ 2 i
L R B i = σ 0 + σ 1 D T i + σ 2 D E P E N D E N C Y i + σ 3 J O B _ N O N F A R M i + σ 4 r C V i r + σ 5 k R V i k + ζ 3 i
Equation (4) is the same as Equation (1). In Equation (5), D E P E N D E N C Y i is the explained variable and D T i is the explanatory variable. λ 0 , λ 1 , λ 2 r , and λ 3 k are the coefficients to be estimated and ζ 1 i is the random error term. In Equation (6), J O B _ N O N F A R M i is the explained variable, D E P E N D E N C Y i and D T i are the explanatory variables. η 0 , η 1 , η 2 , η 3 r , and η 4 k are all indicators coefficients to be estimated and ζ 2 i is the random error term. In Equation (7), L R B i is the explained variable. D T i , D E P E N D E N C Y i , and J O B _ N O N F A R M i are the explanatory variables. σ 0 , σ 1 , σ 2 , σ 3 , σ 4 r and σ 5 k are the coefficients to be estimated and ζ 3 i is the random error term. All other variables, which are not explained above in Equations (5)–(7), have the same meaning as the variables in Equations (1)–(4).
In order to show and illustrate the mainly coefficients that need to be examined in the CMM model and the path of DT’s impact on the LRB more clearly, we drew a schematic diagram of the CMM model (as shown in Figure 2).
To verify the “DT- DEPENDENCY -LRB” impact mechanism, we need to examine whether the λ 1 and σ 2 coefficients both pass the significance test. To verify the “DT- JOB_NONFARM -LRB” impact mechanism, we need to examine whether the η 2 and σ 3 coefficients both pass the significance test. To verify the “DT- DEPENDENCY-JOB_NONFARM -LRB” impact mechanism, we need to examine whether the λ 1 , η 1 and σ 3 coefficients all pass the significance test. The above method also applies when we examine the chain mediating effect of DEPENDENCY and JOB_NONFARM in the impact of DT_GAP on LRB.
Further, It needs to be specifically stated that if the coefficient of DT’s impact on the mediating variable (e.g., λ 1 ) and the coefficient of mediating variable’s impact on the LRB (e.g., σ 2 ) do not all pass the significance test, but only at least one coefficient (e.g., λ 1 or σ 2 ) passes the significance test. At this point, we need to conduct the Sobel test [53]. If the coefficients pass the Sobel test, we can consider that the mediating effect still holds.

4. Analysis of Results

4.1. Analysis of DT’s Impact Paths on LRB

The results of benchmark model test for the impact of DT on LRB are reported in Table 3. The Probit model is applied in columns (1)–(3), and we put into the control variables and regional variables sequentially for regression. Column (4) reports the results of the marginal effects test of column (3). The test results show that DT exerts a significant positive effect on LRB at the 1% or 5% statistical level, regardless of whether control variables and regional variables are included in the model. It shows that the information sharing effect of DT has a positive impact on LRB, i.e., DT can significantly enhance the formation of LRB. From the results reported in column (4), DT increases probability of LRB by 6.5%. At this point, Hypothesis 1 is initially verified.
The results of the impact of control variables on LRB are also reported in Table 3. The AGE has a positive effect on LRB at the 1% significance level. The probability of LRB increase by 0.2% for each 1-year increase in AGE. The results of the GENDER’s impact on LRB show that gender have a negative effect on LRB at the 1% significance level, and the marginal effect result indicates that female has a greater probability (3.2%) of conducting LRB than male. The higher the AGE_F, the higher the probability of LRB, which is similarity with the results of the AGE’s impact on LRB. As the HEALTH_F continues to deteriorate, labor resource may be inadequate or rapidly shift to other industries with higher labor compensation rates (secondary and tertiary industries), further impacting LRB. At the 5% level of significance, the probability of LRB is elevated by 2.1% for each 1-unit declined in HEALTH_F. At the 1% level of significance, the probability of LRB is 7.8% lower for households in married status compared to those otherwise. To some extent, it means that MARRY promote the household to carry out agricultural production, due to those who are in married status have a lower probability of LRB. The impact of FAMILYSIZE on LRB is not robust but has a negative effect on LRB at the 10% significance level. The marginal effect results show that the probability of LRB decreased by 0.5% for each-1 person increased in FAMILYSIZE. This result further illustrates the importance of labor in the process of engaging in agricultural production. PINCOME_F is an important indicator of household livelihood status [54]. The better the economic status of the households, the higher the probability of LRB. At the 1% significance level, the probability of LRB increased by 2.4% for each 1-unit increased in PINCOME_F. It illustrates that agricultural production has become a non-preferred choice for Chinese farm households to maintain their livelihood. As the income level increases, the willingness of farm households to engage in agricultural production decreases, and the probability of LRB increases. So that means, it is limited that the positive effect of agricultural production on the improvement of household economic status. The results of the regional variables’ impact on LRB indicate that the differences exist in LRB across regions (compared with the northeast region). Detailed interpretation is not performed here.
To further test the robustness of the results in the benchmark model, we re-examined the impact of DT on LRB in two approaches. Table 4 reports robustness test results of the impact of DT on LRB.
In the first approach, the RBP model is used to address omitted variables. The test results in column (1) of Table 4 show that DT has a significant positive effect on LRB in the RBP model, the marginal effect test results for the RBP model are reported in column (2), DT increase the probability of LRB by 3.1%. In contrast, the increasing effect of DT on LRB in the benchmark model was 6.5%. The difference between the two results indicates that the positive effect of DT on LRB without considering endogeneity was overestimated. The parameter athrho passes the significance test, indicating that the RBP model we constructed is reasonable and valid.
In the second approach, we further tested the robustness of DT’s impact on LRB by replacing proxy variables. We have obtained the variable DT_PCA in process of measuring DT_GAP. Column (3) reports the results of impact of DT_PCA on LRB. At the 1% statistical significance level, the results show that DT_PCA has a positive impact on LRB. The results of the IV-Probit model test are reported in column (4). In a similar method to the selection of IV for DT, the mean value of DT_PCA in the community (excluding the sample itself) is used as a IV for DT_PCA. The test results report in column (4) are consistent with column (3). The marginal effect results of column (4) is reported in column (5), which show that the probability of LRB increase by 19.3% for every 1 unit increase in DT_PCA.
Based on the results of the empirical tests above, the positive effect of DT on LRB has been verified by replacing the estimation method and replacing the proxy variables. The robustness of the benchmark model is verified. Therefore, hypothesis 1 is further verified.
Further, we interpreted how DT impacts LRB. 
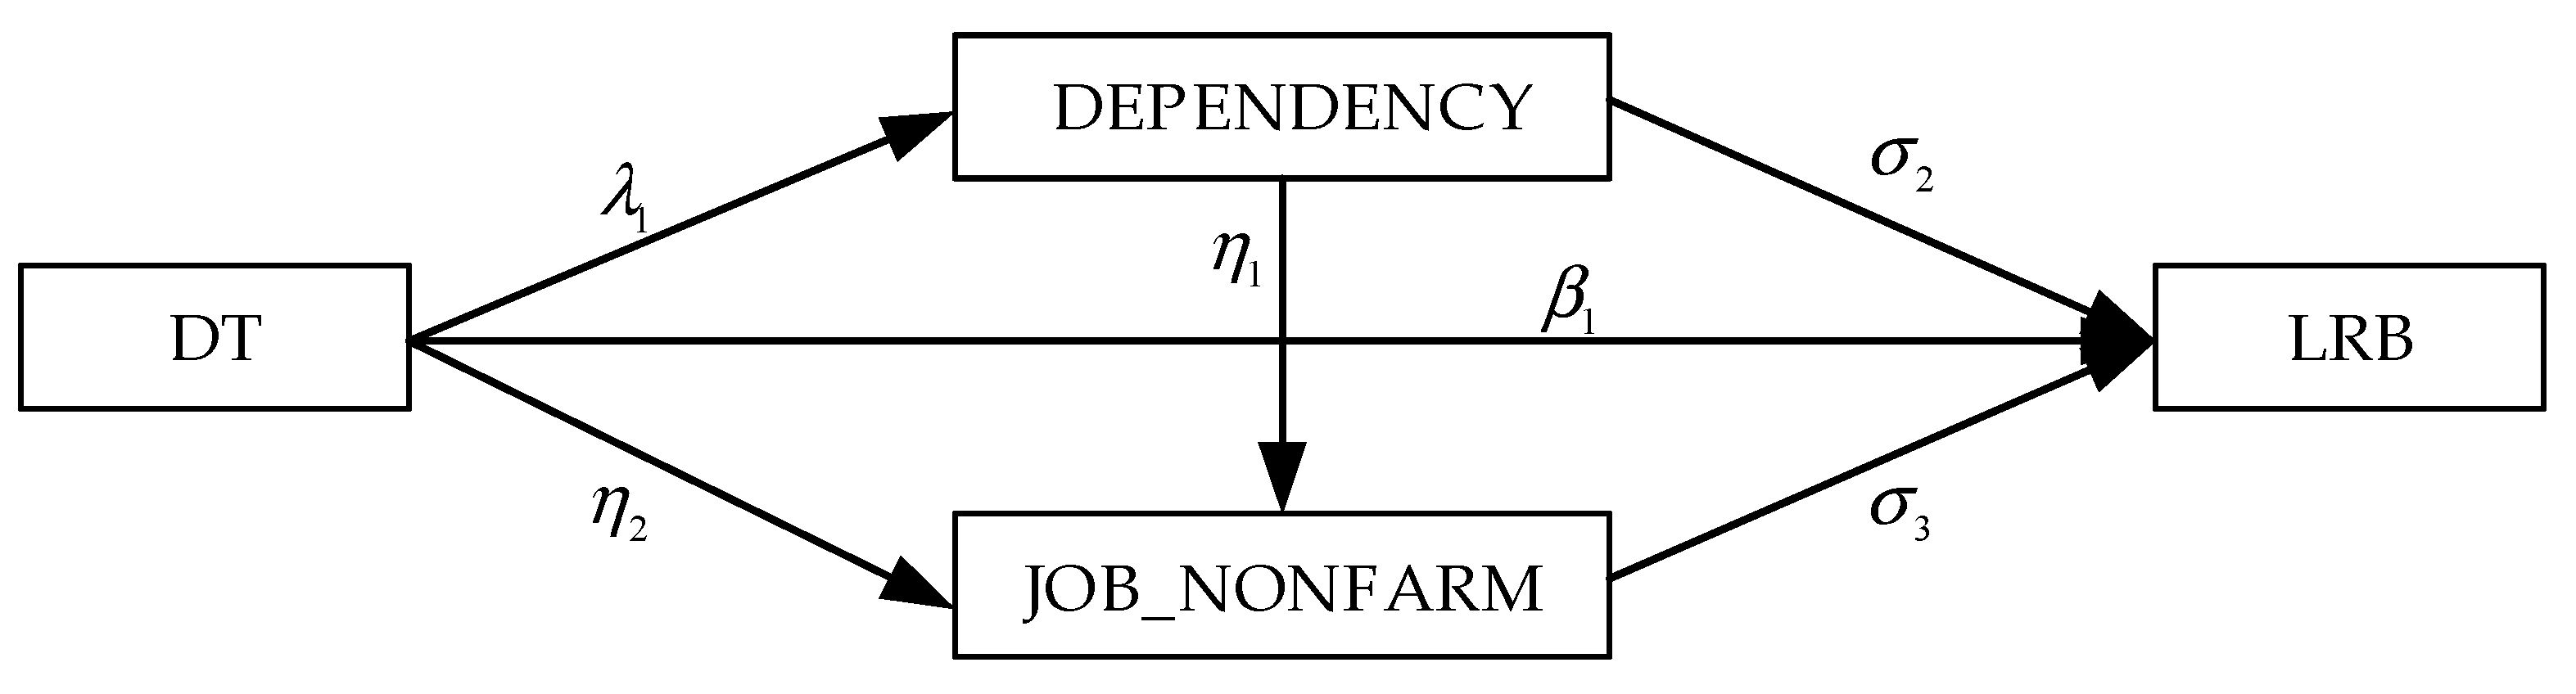
Table 5 reports the results of DT’s impact on LRB in CMM model. The test results in columns (1)–(4) correspond to Equations (4)–(7).
Firstly, the test results in column (1) show that the significant positive effect of DT on LRB, which becomes the premise of CMM model to test the impact path of DT on LRB. Secondly, at the 1% statistical level, the results in column (2) show that DT positive impact DEPENDENCY. And the test results in column (3) show that DT does not play a direct effect on JOB_NONFARM, indicating that JOB_NONFARM does not play a mediating effect in DT’s impact on LRB independently. Thirdly, the positive effect of DEPENDENCY on JOB_NONFARM is confirmed at the 10% significance level. In column (4), DT, DEPENDENCY, and JOB_NONFARM have a significant positive effect on LRB at the 1%, 5%, and 1% statistical levels respectively.
Therefore, all test results of the CMM model show that “DT- DEPENDENCY -LRB” and “DT-DEPENDENCY-JOB_NONFARM-LRB” impact path pass the significance test. We further conducted the Sobel test on the impact path of “DT-JOB_NONFARM-LRB”, and the statistical results do not pass the Sobel test. So, the impact path of “DT-JOB_NONFARM-LRB” is not statistically valid. Therefore, we can consider that JOB_NONFARM is not able to independently play a mediating effect in the process of DT‘s impact on LRB, but JOB_NONFARM can play a significant mediating effect after the first transmission through DEPENDENCY. Up to this point, hypothesis 3 is verified.

4.2. Analysis of DT_GAP’s Impact Paths on LRB

The DT_GAP is the major manifestation of the information exclusion effect, which emerged during the development of DT.
Table 6 reports test results of DT_GAP’s impact on LRB. Similarly, the strategy of sequentially placement of control variables and regional variables are also used to test the impact of DT_GAP on LRB. At the 1% significance level, DT_GAP has a significant negative effect on LRB is reported in columns (1)–(3). Further, the mean value of DT_GAP within the community (excluding the sample itself) as IV is used to construct the IV-Probit model, and the parameters associated with the selected IV passed the test. The test results of the IV-Probit model are reported in column (4), which are consistent with the results reported in columns (1)–(3). In summary, from the test results of benchmark model and IV model, the significant negative effect of DT_GAP on LRB is confirmed. To this point, hypothesis 2 is verified.
Refer to the CMM model used in impact path of DT on LRB. Similarly, CMM model for the impact of DT_GAP on LRB is constructed. Table 7 reports the results of DT_GAP’s impact on LRB in CMM model. From the test results in column (1), DT_GAP has a significant negative effect on LRB, which is consistent with the test results above. The test result of the significant negative effect of DT_GAP on DEPENDENCY is reported in column (2). At the 5% significance level, the test results in column (3) show that DT_GAP has no significant effect on JOB_NONFARM, and DEPENDENCY has a significant positive effect on JOB_NONFARM. In the test results in column (4), DT_GAP still has a significant negative effect on LRB, both of DEPENDENCY and JOB_NONFARM exert positive effect on LRB at the 10% and 1% significance levels. Based on all test results in Table 7, DT_GAP reduce the probability of LRB by weakening DEPENDENCY is confirmed.
Meanwhile, DT_GAP decrease DEPENDENCY, then DEPENDENCY decrease probability of JOB_NONFARM, ultimately JOB_NONFARM decrease the probability of LRB. Further, the Sobel test reveals that JOB_NONFARM cannot play an independent mediating effect in the process of DT_GAP’ impact on LRB, the mediating effect of JOB_NONFARM must rely on DEPENDENCY to be realized. To this point, hypothesis 4 is verified.

4.3. Heterogeneity Analysis: Impact of DT and DT_GAP on LRB

Based on the empirical analysis above, we have interpreted and verified how the information sharing effect of DT exerts a positive impact on LRB and how the information exclusion effect of DT_GAP exerts a negative impact on LRB. Further, for a more comprehensive understanding of the impact of DT and DT_GAP on LRB. We explored the effects of DT and DT_GAP on LRB from the perspective of heterogeneity in regional, age of householder, and household income levels.
Firstly, we examined the impact of DT and DT_GAP on LRB from the perspective of regional heterogeneity. The results of the impact of DT and DT_GAP on LRB from regional heterogeneity perspective are reported in Table 8. The test results show that DT and DT_GAP exert significant effects on LRB in the eastern, central, and western regions, with DT exerting a positive effect and DT_GAP exerting a negative effect. In contrast, in the northeast region, both DT and DT_GAP do not pass the significance test on LRB. From the group regression results, the impact of DT on LRB and DT_GAP on LRB differ between regions at the significance level and extent. However, the differences test does not pass the significance test. Therefore, we can consider that the impact of DT on LRB and DT_GAP on LRB is not significantly different between regions. However, the test of regional grouped regression is not useless. It still illustrates the robustness of the positive effect of DT on LRB and the negative impact of DT_GAP on LRB.
Secondly, we examined the impact of DT and DT_GAP on LRB from the perspective of householder‘s age heterogeneity. Table 9 reports the test results of the impact of DT and DT_GAP on LRB from the perspective of householder‘s age heterogeneity. We divided the age of householder in all samples into four groups: under-30 years old, 30 to 50 years old, 50 to 70 years old, and over-70 years old. Neither DT nor DT_GAP exert a significant effect on LRB in the regressions for the under-30 and over-70 age groups.
From the results of DT’s impact on LRB reported in columns (1)–(3). DT does not exert a significant effect on LRB in the subgroup under-30 years old. The marginal effect of the positive effect of DT on LRB reaches 0.043 in the subgroup regression of 30 to 50 years old. In the subgroup regression of 50–70 years old, the marginal effect of the positive effect of DT on LRB reaches 0.045. Therefore, we conclude that the positive effect of DT on LRB progressively decreases as the age of householder increases in the sample of 30–70 years old.
From the results of impact of DT_GAP on LRB reported in columns (5)–(7). The test results show that DT_GAP does not play a significant effect on LRB in the grouping of under-30. In the subgroup regression of 30 to 50 years old, the marginal effect of the negative effect of DT_GAP on LRB reaches 0.009. In the subgroup regression of 50–70 years old, the marginal effect of DT_GAP on LRB reaches 0.012. Therefore, we conclude that in the sample below 70 years old, as the age of householder increases, the negative effect of the impact of DT_GAP on LRB gradually elevated. Meanwhile, the both of differences tests pass the significance test at the 5% level, indicating that the changes in the effects of DT and DT_GAP on LRB are statistically significant in different householder’s age groups.
Thirdly, we examined the impact of DT and DT_GAP on LRB from the perspective of household income level heterogeneity. Table 10 reports the test results of DT’s and DT_GAP’s impact on LRB from the perspective of household income level heterogeneity. According to the data distribution of the PINCOME_F of all samples, we defined income of households below the 25% quantile as low-income households and income of households above the 75% quantile as high-income households.
Columns (1) and (2) report the impact of DT on LRB with different income level, and the test results show that DT has a more positive effect on LRB of low-income level households compared to high-income. Columns (3) and (4) report the impact of DT_GAP on LRB of households with different income level, and the test results show that DT_GAP has a more negative effect on LRB of low-income level households compared to high-income level households. These results pass the difference test at the 1% significance level. Therefore, we conclude that the information sharing effect of DT is significantly pro-poor, but the information exclusion effect of DT_GAP on low-income households also has a significant preference.

5. Discussion and Conclusions

5.1. Discussion

Digital technologies (e.g., internet, blockchain, etc.) can provide a positive role in facilitating transactions in land, real estate, etc. [58,59]. However, the application of DT in land rental transaction market is still limited in developing countries or regions. Our research, based on a large dataset in China, finds that DT can significantly increase the probability of LRB for farmers (6.5%). It provides new empirical evidence that the application of DT can play the positive role in the process of land rental.
Existing studies have confirmed that Internet use can facilitate famer’s land rental behavior, but there are shortcomings of small dataset and insufficient interpretation of the impact paths. A very important finding in our research is that JOB_NONFARM and DEPENDENCY are mediating variables for the impact of DT on LRB, and JOB_NONFARM needs to rely on DEPENDENCY to exert the mediating effect but cannot exert independently, i.e., path of “DT-DEPENDENCY-JOB_NONFARM-LRB” is feasible, but path of “DT -JOB_NONFARM-LRB” is not. In other words, the conclusion of previous studies that DT can directly impact land rental behavior through JOB_NONFARM is inaccurate or biased [29]. So, our research is based on a large dataset (n = 5233) and fully interprets how DT impacts LRB, improving on the shortcomings of existing studies.
In addition, we focus on the negative effect brought by DT, or namely the information exclusion effect brought by DT_GAP. Our empirical results confirm that DT_GAP has a negative effect on LRB, which means that DT_GAP produces information exclusion and is detrimental to the formation of an efficient land rental market. It compensates for the shortcoming that existing studies have not focused on DT_GAP’s impact on land rental behavior.
The results of the heterogeneity analysis showed that youngers are able to promote LRB more effectively with DT (compared to elders), and information exclusion with DT_GAP appeared to be more effective in elders. The results of such a test fully demonstrate that DT has produced an information exclusion effect on the elderly. It reflects the fact that the aging DT_GAP has become an important manifestation of the DT_GAP [34,60]. Although DT has a positive impact on LRB of low-income groups, it is interesting to note that DT_GAP also has more negative impact on LRB of low-income groups (compared to high-income groups). Such results suggest that DT does mitigate the position of low-income groups in the information market, but it is undeniable that more low-income groups may be informationally deprived due to information asymmetry [61].
The negative impact of DT’s information exclusion effect on the elderly and low-income groups are only parts of many negative effects. As DT_GAP continues to expand, the phenomenon of new social exclusions may be derived [38,62].
Our research findings have implications for policy formulation. On the one hand, the government should promote the digitization of the land rental market to facilitate the efficient allocation of land resources and reduce the rate of land abandonment. On the other hand, the government should improve internet quality (e.g., broadband access rates, etc.), promote internet coverage, especially expand mobile internet coverage in remote rural areas (e.g., 4G and 5G communication base stations, etc.), and optimize the adaptation of digital applications between different groups, with particular attention to the digital divide of the ageing.
However, there are still certain shortcomings in our research. DT measurement variables are limited by data availability, and the measurement variables of DT and DT_GAP are highly homogeneous, which makes it difficult to interpret the net effect of DT’s and DT_GAP’s impact on LRB. In addition, we only use DEPENDENCY and JOB_NONFARM as mediating variables to interpret the impact path of DT and DT_GAP on LRB, it still needs to be strengthened. To this end, further exploring the net effect of DT and DT_GAP on LRB, and the more comprehensive impact path of DT and DT_GAP on land rental behavior (including rent out and rent in) are the next research that needs to focus on.

5.2. Conclusions

Our empirical results validate Hypotheses 1–4, which we propose based on our theoretical analysis. Overall, the findings of our study can be summarized in three points.
First, we found that the information sharing effect of DT exerts a significant positive impact on LRB, while the information exclusion effect of DT_GAP exerts a significant negative effect on LRB.
Second, another important finding is that JOB_NONFARM and DEPENDENCY are mediating variables in process of DT’s and DT_GAP’s impact on LRB, but JOB_NONFARM needs to rely on the transmission of DEPENDENCY to exert a mediating effect and does not exert independently.
Third, the impact of DT on LRB has a clear preference for lower age groups (30–70 age range) as well as a preference for lower income. However, the effect of DT_GAP on LRB has a clear preference for higher age groups (lower-70 age range) as well as a preference for lower income.

Author Contributions

X.Z. contributed to conceptualization; data curation; formal analysis; software; writing—original draft; writing—review & editing. Z.H. contributed to Funding acquisition; Supervision; Validation; Writing—review & editing. All authors have read and agreed to the published version of the manuscript.

Funding

The authors would like to thank the funding support from President’s Youth Fund of Institute of Science and Development, Chinese Academy of Sciences (grant no. E0X3751Q01). We are grateful for the data provided by the ISSS of Peking University.

Institutional Review Board Statement

Not applicable.

Informed Consent Statement

Not applicable.

Data Availability Statement

The CFPS data set used in this manuscript can be downloaded from the following website, http://www.isss.pku.edu.cn/cfps/ (accessed on 7 April 2022).

Conflicts of Interest

The authors declare no conflict of interest.

References

  1. Data Source: ITU. Available online: https://www.itu.int/en/ITU-D/Statistics/Pages/facts/default.aspx (accessed on 7 April 2022).
  2. Data Source: China Internet Network Information Center. Available online: http://www.cnnic.com.cn/IDR/ReportDownloads/ (accessed on 7 April 2022).
  3. Data Source: Ministry of Natural Resources of the People’s Republic of China. Available online: http://www.mnr.gov.cn/dt/zb/2017/tdly/beijingziliao/201401/t20140108_2127423.html/ (accessed on 7 April 2022).
  4. Paunov, C.; Rollo, V. Has the internet fostered inclusive innovation in the developing world? World Dev. 2016, 78, 587–609. [Google Scholar] [CrossRef] [Green Version]
  5. Relich, M. The impact of ICT on labor productivity in the EU. Inf. Technol. Dev. 2017, 23, 706–722. [Google Scholar] [CrossRef]
  6. Subramanian, A. Harnessing digital technology to improve agricultural productivity? PLoS ONE 2021, 16, e0253377. [Google Scholar] [CrossRef] [PubMed]
  7. Nakasone, E.; Torero, M.; Minten, B. The Power of Information: The ICT Revolution in Agricultural Development. Annu. Rev. Res. Econ. 2014, 6, 533–550. [Google Scholar] [CrossRef]
  8. Lakshmi, V.; Corbett, J. How Artificial Intelligence Improves Agricultural Productivity and Sustainability: A Global Thematic Analysis. In Proceedings of the 53rd Hawaii International Conference on System Sciences, Maui, HI, USA, 1 July 2020. [Google Scholar]
  9. Deichmann, U.; Goyal, A.; Mishra, D. Will digital technologies transform agriculture in developing countries? Agri. Econ. 2016, 47, 21–33. [Google Scholar] [CrossRef]
  10. Xu, Z.; Zheng, F.; Chen, J. Digital divided or digital provided? The effective supply of information and the farm-gate price: An empirical study from micro-level. China Econ. Quart. 2013, 12, 1513–1536. [Google Scholar]
  11. Changyu, L.; Jiale, L.; Jing, L. Rural E-commerce and New Model of Rural Development in China: A Comparative Study of ”Taobao Village” in Jiangsu Province. Asian Agri. Resn. 2015, 7, 35. [Google Scholar]
  12. Yi, S. E-commerce strategy for agricultural product transaction market based on information asymmetry. Agr. Food Ind. Hi-Tech 2016, 27, 138–143. [Google Scholar]
  13. Cheni, B.; Mai, N.; Wangi, D. Land Circulation, Agricultural Productivity and Rural Household Income. J. World Econ. 2020, 43, 97–120. [Google Scholar]
  14. Zuo, X.; Lu, J. Effects of agricultural land transfer on rural poverty reduction from the perspective of poverty vulnerability. Res. Sci. 2020, 42, 274–285. [Google Scholar] [CrossRef]
  15. Adamopoulos, T.; Restuccia, D. Land Reform and Productivity: A Quantitative Analysis with Micro Data. Am. Econ. J-Macroecon 2020, 12, 1–39. [Google Scholar] [CrossRef]
  16. Wang, Q.X.; Zhang, X.L. Three rights separation: China’s proposed rural land rights reform and four types of local trials. Land Use Policy 2017, 63, 111–121. [Google Scholar] [CrossRef]
  17. Yan, J.M.; Yang, Y.M.; Xia, F.Z. Subjective land ownership and the endowment effect in land markets: A case study of the farmland “three rights separation” reform in China. Land Use Policy 2021, 101, 105137. [Google Scholar] [CrossRef]
  18. Data source: Department of Policy and Reform, Ministry of Agriculture and Rural Affairs. In 2019 Annual Report on China’s Rural Policy and Reform Statistics; China Agricultural Press: Beijing, China, 2020.
  19. Rogers, S.; Wilmsen, B.; Han, X.; Wang, Z.J.-H.; Duan, Y.; He, J.; Li, J.; Lin, W.; Wong, C. Scaling up agriculture? The dynamics of land transfer in inland China. World Dev. 2021, 146, 105563. [Google Scholar] [CrossRef]
  20. Wang, J.; Xu, Y.; Zou, L.; Wang, Y. Does Culture Affect Farmer Willingness to Transfer Rural Land? Evidence from Southern Fujian, China. Land 2021, 10, 594. [Google Scholar] [CrossRef]
  21. Deng, X.; Xu, D.; Zeng, M.; Qi, Y. Does early-life famine experience impact rural land transfer? Evidence from China. Land Use Policy 2019, 81, 58–67. [Google Scholar] [CrossRef]
  22. Gao, J.; Song, G.; Sun, X. Does labor migration affect rural land transfer? Evidence from China. Land Use Policy 2020, 99, 105096. [Google Scholar] [CrossRef]
  23. Zhang, L.; Cao, Y.; Bai, Y. The impact of the land certificated program on the farmland rental market in rural China. J. Rural Stud. 2019, 93, 165–175. [Google Scholar] [CrossRef]
  24. Zhang, Y.; Halder, P.; Zhang, X.; Qu, M. Analyzing the deviation between farmers’ Land transfer intention and behavior in China’s impoverished mountainous Area: A Logistic-ISM model approach. Land Use Policy 2020, 94, 104534. [Google Scholar] [CrossRef]
  25. Echegaray, F.; Hansstein, F.V. Assessing the intention-behavior gap in electronic waste recycling: The case of Brazil. J. Clean. Prod. 2017, 142, 180–190. [Google Scholar] [CrossRef]
  26. Goyal, A. Information, direct access to farmers, and rural market performance in central India. Amer. Econ. J. App. Econ. 2010, 2, 22–45. [Google Scholar] [CrossRef] [Green Version]
  27. Deng, X.; Xu, D.; Zeng, M.; Qi, Y. Does Internet use help reduce rural cropland abandonment? Evidence from China. Land Use Policy 2019, 89, 104243. [Google Scholar] [CrossRef]
  28. Fei, R.; Lin, Z.; Chunga, J. How land transfer affects agricultural land use efficiency: Evidence from China’s agricultural sector. Land Use Policy 2021, 103, 105300. [Google Scholar] [CrossRef]
  29. Liu, Z.; Xin, X.; Lv, Z. Does farmers’ access to agricultural information on the internet promote the land transfer. J. Agrotech. Econ. 2021, 2, 100–111. [Google Scholar]
  30. Weng, F.; Zhang, Q.; Huo, X. The Impact of Internet Use on Farmland Transfer of Professional Apple Growers: An Analysis of the Mediation Eect of Information Search, Social Capital and Credit Acquisition. China Land Sci. 2021, 35, 63–71. [Google Scholar]
  31. Wang, M.; Yin, Z.; Pang, S.; Li, Z. Does Internet development affect urban-rural income gap in China? An empirical investigation at provincial level. Inf. Dev. 2021, 02666669211035484. [Google Scholar] [CrossRef]
  32. Iske, S. Differences in Internet usage-social inequality and informal education. Soc. Work Soc. 2005, 3, 215–223. [Google Scholar]
  33. Gann, B. Combating digital health inequality in the time of coronavirus. J. Consum. Health Int. 2020, 24, 278–284. [Google Scholar] [CrossRef]
  34. Hargittai, E.; Piper, A.M.; Morris, M.R. From internet access to internet skills: Digital inequality among older adults. Univers. Access Inf. Soc. 2019, 18, 881–890. [Google Scholar] [CrossRef]
  35. Zuo, X.F.; Hong, Z.S. The Impact of Internet Use on Perception of the Poor-Rich Gap: Empirical Evidence from China. Sustainability 2022, 14, 3488. [Google Scholar] [CrossRef]
  36. Kraut, R.; Patterson, M.; Lundmark, V.; Kiesler, S.; Mukophadhyay, T.; Scherlis, W. Internet paradox: A social technology that reduces social involvement and psychological well-being? Am. Psychol. 1998, 53, 1017. [Google Scholar] [CrossRef] [PubMed]
  37. Akerlof, G.A. The market for “lemons”: Quality uncertainty and the market mechanism. In Uncertainty in Economics; Elsevier: Amsterdam, The Netherlands, 1978; pp. 235–251. [Google Scholar]
  38. Tewathia, N.; Kamath, A.; Ilavarasan, P.V. Social inequalities, fundamental inequities, and recurring of the digital divide: Insights from India. Technol. Soc. 2020, 61, 101251. [Google Scholar] [CrossRef]
  39. Jackson, L.A.; Zhao, Y.; Kolenic, A.; Fitzgerald, H.E.; Harold, R.; Von Eye, A. Race, gender, and information technology use: The new digital divide. Cyberpsychology Behav. 2008, 11, 437–442. [Google Scholar] [CrossRef] [PubMed]
  40. Abbey, R.; Hyde, S. No country for older people? Age and the digital divide. J. Inf. Commun. Ethics Soc. 2009, 7, 225–242. [Google Scholar] [CrossRef]
  41. Ogbo, E.; Brown, T.; Gant, J.; Sicker, D. When Being Connected is not Enough: An Analysis of the Second and Third Levels of the Digital Divide in a Developing Country. J. Inf. Policy 2021, 11, 104–146. [Google Scholar] [CrossRef]
  42. Aker, J.C.; Mbiti, I.M. Mobile Phones and Economic Development in Africa. J. Econ. Perspect. 2010, 24, 207–232. [Google Scholar] [CrossRef] [Green Version]
  43. Feldman, D.C.; Klaas, B.S. Internet job hunting: A field study of applicant experiences with on-line recruiting. Hum. Res. Manag. 2002, 41, 175–192. [Google Scholar] [CrossRef]
  44. David, P.A.; Foray, D. Economic fundamentals of the knowledge society. Policy Futur. Edu. 2003, 1, 20–49. [Google Scholar] [CrossRef] [Green Version]
  45. Xu, Q.; Lu, Y. Off-farm employment, social security function of land, and land transfer. Chin. J. Popul. Sci 2018, 5, 30–41. [Google Scholar]
  46. Feng, S.; Heerink, N. Are farm households’ land renting and migration decisions inter-related in rural China? NJAS-Wagening. J. Life Sci. 2008, 55, 345–362. [Google Scholar] [CrossRef] [Green Version]
  47. Stark, O.; Taylor, J.E. Migration incentives, migration types: The role of relative deprivation. Econ. J. 1991, 101, 1163–1178. [Google Scholar] [CrossRef]
  48. Rahman, S. Determinants of agricultural land rental market transactions in Bangladesh. Land Use Policy 2010, 27, 957–964. [Google Scholar] [CrossRef] [Green Version]
  49. From the Introduction of the CFPS on ISSS. Available online: http://www.isss.pku.edu.cn/cfps/ (accessed on 7 April 2022).
  50. Zuo, X.; Kang, M.; Lu, J. The impact of social interaction and Internet use on rural residents’ willingness to sort domestic waste. Res. Sci. 2022, 44, 47–58. [Google Scholar] [CrossRef]
  51. Abdi, H.; Williams, L. Principal component analysis. Wiley Interdiscip. Rev. Comput. Stat. 2010, 2, 433–459. [Google Scholar] [CrossRef]
  52. Hayes, A.F. Introduction to Mediation, Moderation, and Conditional Process Analysis: A Regression-Based Approach; Guilford publications: New York, NY, USA, 2017. [Google Scholar]
  53. Sobel, M.E. Asymptotic confidence intervals for indirect effects in structural equation models. Sociol. Meth. 1982, 13, 290–312. [Google Scholar] [CrossRef]
  54. Serrat, O. The sustainable livelihoods approach. In Knowledge Solutions; Springer: Berlin, Germany, 2017; pp. 21–26. [Google Scholar]
  55. Agresti, A. Categorical Data Analysis. John Wiley & Sons: Hoboken, NJ, USA, 2003. [Google Scholar]
  56. Staiger, D.; Stock, J.H.; Watson, M.W. The NAIRU, unemployment and monetary policy. J. Econ. Perspect. 1997, 11, 33–49. [Google Scholar] [CrossRef] [Green Version]
  57. Greene, W.H. Econometric Analysis; Pearson Education: New Delhi, India, 2003. [Google Scholar]
  58. Saull, A.; Baum, A.; Braesemann, F. Can digital technologies speed up real estate transactions? J. Prop. Investig. Financ. 2020, 38, 349–361. [Google Scholar] [CrossRef]
  59. Lemieux, V.L. Evaluating the use of blockchain in land transactions: An archival science perspective. Eur. Prop. Law J. 2017, 6, 392–440. [Google Scholar] [CrossRef]
  60. Gilleard, C.; Higgs, P. Internet use and the digital divide in the English longitudinal study of ageing. Eur. J. Ageing 2008, 5, 233–239. [Google Scholar] [CrossRef] [Green Version]
  61. Naudé, W.; Vinuesa, R. Data deprivations, data gaps and digital divides: Lessons from the COVID-19 pandemic. Big Data Soc. 2021, 8, 20539517211025545. [Google Scholar] [CrossRef]
  62. Selwyn, N.; Gorard, S.; Williams, S. Digital divide or digital opportunity? The role of technology in overcoming social exclusion in US education. Edu. Polic. 2001, 15, 258–277. [Google Scholar] [CrossRef]
Figure 1. Theoretical analysis framework diagram: impact of DT on LRB.
Agriculture 12 01046 g001
Figure 2. Schematic diagram of the CMM model.
Agriculture 12 01046 g002
Table 1. Variables, definitions, and descriptive statistics.
Variables (n = 5233)DefinitionMeanStd. Dev. 1
LRBWhether the Interviewed household has LRB; 1 = yes, 0 = no0.1550.362
DT1 = using the Internet; 0 = not using the Internet0.2190.414
AGEAge of the householder (years)51.97513.547
GENDERGender of householder, 1 = male, 0 = female0.5630.496
HEALTHSelf-reported health of householder: from 1 = very healthy to 5 = very unhealthy3.2301.261
EDUCATIONYears of education of householder6.1274.213
PARTYHouseholder’s political identity as a member of the Communist Party of China, 1 = yes, 0 = no0.0770.267
AGE_FAverage age of household members (years)48.56712.488
HEALTH_FAverage self-reported health of family members: from 1 = very healthy to 5 = very unhealthy3.1290.966
EDUCATION_FAverage education of family members6.0783.445
MARRY1 = married; 0 = other0.8690.338
FAMILYSIZENumber of family members (living together)4.1011.999
PINCOME_FFamily net income per capita (logarithmic processing, yuan 2)8.6411.181
JOB_NONFARMHousehold members engage in non-farm jobs, 1 = yes, 0 = no0.7200.449
DEPENDENCYDependence on Internet information channels: from 1 = unimportant to 5 = very important1.8291.353
DT_LEARNINGFrequency of using the Internet for learning, from 0 = infrequently to 7 = always0.5891.513
DT_WORKINGFrequency of using the Internet for working, from 0 = infrequently to 7 = always0.4711.340
DT_SOCIALFrequency of using the Internet for social interaction, from 0 = infrequently to 7 = always1.1662.443
DT_ENTERTAINMENTFrequency of using the Internet for entertainment, from 0 = infrequently to 7 = always1.0352.234
DT_TRADEFrequency of using the Internet for business activities, from 0 = infrequently to 7 = always0.4291.095
EASTERN 31 = interviewed household is located in eastern China region, 0 = otherwise0.2450.430
CENTRAL1 = interviewed household is located in central China region, 0 = otherwise0.2650.441
WESTERN1 = interviewed household is located in the western China region, 0 = otherwise0.3670.482
1 Std. Dev. refers to standard deviation. 2 Yuan is the Chinese currency: 1 USD = 6.49 Yuan (31 December 2015 onshore CNY closing price from Forex Capital Markets. New York). 3 According to the classification method of the National Bureau of Statistics of China, the provincial administrative regions of mainland China are divided into eastern, central, western, and northeastern regions. The eastern part includes Beijing, Tianjin, Hebei, Shanghai, Jiangsu, Zhejiang, Fujian, Shandong, Guangdong, and Hainan; The central part includes Shanxi, Anhui, Jiangxi, Henan, Hubei, and Hunan; The western part includes Inner Mongolia, Guangxi, Chongqing, Sichuan, Guizhou, Yunnan, Tibet, Shaanxi, Gansu, Qinghai, Ningxia, and Xinjiang; The northeast part includes Liaoning, Jilin, and Heilongjiang.
Table 2. Relevant test values for the PCA process.
FactorsEigenvalueProportionCumulative
Factor14.6890.7820.782
Factor20.5220.0870.868
Factor30.2980.0500.918
Factor40.2450.0410.959
Factor50.1550.0260.985
Factor60.0910.0151.000
VariablesFactor1Factor2Uniqueness
DT0.930−0.1770.103
DT_LEARNING0.8140.2170.291
DT_WORKING0.7700.2800.329
DT_SOCIAL0.911−0.1830.136
DT_ENTERTAINMENT0.891−0.1700.177
DT_TRADE0.8340.1090.292
Table 3. The impact of DT on LRB: benchmark model test results.
VariablesBenchmark Model: Probit
(1)(2)(3)(4)
DT0.119 **0.304 ***0.289 ***0.065 ***
(0.050)(0.064)(0.064)(0.014)
AGE 0.011 ***0.010 ***0.002 ***
(0.003)(0.003)(0.001)
GENDER −0.143 ***−0.140 ***−0.032 ***
(0.047)(0.048)(0.011)
HEALTH −0.009−0.010−0.002
(0.027)(0.028)(0.006)
EDUCATION 0.0060.0060.001
(0.009)(0.010)(0.002)
PARTY 0.0530.0510.011
(0.081)(0.082)(0.018)
AGE_F 0.008 ***0.008 **0.002 **
(0.003)(0.003)(0.001)
HEALTH_F 0.091 **0.094 **0.021 **
(0.036)(0.036)(0.008)
EDUCATION_F 0.0130.0090.002
(0.012)(0.012)(0.003)
MARRY −0.333 ***−0.344 ***−0.078 ***
(0.060)(0.060)(0.014)
FAMILYSIZE −0.019−0.024*−0.005 *
(0.012)(0.012)(0.003)
PINCOME_F 0.113 ***0.104 ***0.024 ***
(0.020)(0.020)(0.005)
EASTERN 0.229 ***0.052 ***
(0.076)(0.017)
CENTRAL 0.292 ***0.066 ***
(0.076)(0.017)
WESTERN 0.0410.009
(0.078)(0.018)
N5233523352335233
Standard errors in parentheses. * p < 0.1, ** p < 0.05, *** p < 0.01.
Table 4. Robustness test results for DT’s impact on LRB.
VariablesRBP ModelProbit ModelIV-Probit Model
(1)(2)(3)(4)(5)
DT 0.031 ***
(0.005)
DT_Mean0.728 ***
(0.126)
DT_PCA 0.065 ***0.189 ***0.193 ***
(0.014)(0.036)(0.038)
Control variablesYesYesYesYesYes
Regional controlYesYesYesYesYes
Parameter: athrho−0.328 ***///
(0.084)///
Wald test of exogeneity//12.95 ***/
Wald F Statistics//289.93/
N52335233523352335233
Standard errors in parentheses. *** p < 0.01. The IV-Probit model test results are obtained by a two-stage estimation method, column (3) reports the result of second stage. The marginal effect results of column (4) are reported in column (5). “Wald test of exogeneity” passes the significance test, indicating that the model rejects the original hypothesis that the explanatory variables are exogenous, meaning that the IV has strong explanatory power [55]. “Wald F” test value greater than 10, indicates that the IV is not weak [56].
Table 5. Results of CMM model of DT’s impact on LRB.
VariablesLRBDEPENDENCYJOB_NONFARMLRB
(1)(2)(3)(4)
DT0.289 ***1.393 ***0.0730.208 ***
(0.064)(0.049)(0.084)(0.076)
DEPENDENCY 0.042 *0.045 **
(0.024)(0.022)
JOB_NONFARM 0.273 ***
(0.066)
Control variablesYESYESYESYES
Regional controlYESYESYESYES
N5233523352335233
Standard errors in parentheses. * p < 0.1, ** p < 0.05, *** p < 0.01. Based on the data distribution characteristics of the explanatory variables, columns (1), (2), and (4) are estimated using the Probit model, and column (3) is estimated using the Ordered Probit model.
Table 6. Results of the DT_GAP’s impact on LRB.
VariablesProbit ModelIV-Probit Model
(1)(2)(3)(4)
DT_GAP−0.033 ***−0.069 ***−0.065 ***−0.189 ***
(0.010)(0.014)(0.014)(0.036)
Control variablesNOYesYesYes
Regional controlNONOYesYes
Wald test of exogeneity 13.07 ***
Wald F 289.93
N5233523352335233
Standard errors in parentheses. *** p < 0.01. “Wald test of exogeneity” passes the significance test, indicating that the model rejects the original hypothesis that the explanatory variables are exogenous, meaning that the IV has strong explanatory power [55]. “Wald F” test value greater than 10, indicates that the IV is not weak [56].
Table 7. Results of CMM model of DT_GAP’s impact on LRB.
VariablesLRBDEPENDENCYJOB_NONFARMLRB
(1)(2)(3)(4)
DT_GAP−0.065 ***−0.313 ***0.005−0.051 ***
(0.014)(0.011)(0.019)(0.016)
DEPENDENCY 0.056 **0.040 *
(0.024)(0.022)
JOB_NONFARM 0.280 ***
(0.066)
Control variablesYESYESYESYES
Regional controlYESYESYESYES
N5233523352335233
Standard errors in parentheses. * p < 0.1, ** p < 0.05, *** p < 0.01. Based on the data distribution characteristics of the explanatory variables, columns (1), (2), and (4) are estimated using the Probit model, and column (3) is estimated using the Ordered Probit model.
Table 8. Regional heterogeneity: test results of the impact of DT & DT_GAP on LRB.
VariablesEasternCentralWesternNortheast
(1)(2)(3)(4)
DT0.407 ***0.320 ***0.259 **0.017
(0.123)(0.118)(0.115)(0.196)
Control variablesYesYesYesYes
Regional controlNoNoNoNo
Differences test3.08
N128213851918648
VariablesEasternCentralWesternNortheast
(5)(6)(7)(8)
DT_GAP−0.066 ***−0.090 ***−0.050 **−0.024
(0.026)(0.025)(0.025)(0.045)
Control variablesYesYesYesYes
Regional controlNoNoNoNo
Differences test2.04
N128213851918648
Standard errors in parentheses. ** p < 0.05, *** p < 0.01. The Probit model is applied to columns (1)–(8). “Differences test” uses method of seemingly unrelated regression (SUR), see Greene (2003) for the details of the method [57].
Table 9. Age of householder heterogeneity: test results of the impact of DT & DT_GAP on LRB.
VariablesAge < 3030 ≤ Age < 5050 ≤ Age < 70Age ≥ 70
(1)(2)(3)(4)
DT0.1740.223 **0.205 *0.000
(0.257)(0.090)(0.117)(.)
Control variablesYesYesYesYes
Regional controlYesYesYesYes
Differences test10.05 **
N36118412523505
Variablesage < 3030 ≤ age < 5050 ≤ age < 70age ≥ 70
(5)(6)(7)(8)
DT_GAP−0.028−0.045 **−0.056 **0.000
(0.041)(0.020)(0.029)(.)
Control variablesYesYesYesYes
Regional controlYesYesYesYes
Differences test9.67 **
N36118412523505
Standard errors in parentheses. * p < 0.1, ** p < 0.05. The marginal effects of DT on LRB in columns (2) and (3) are 0.043 ** (0.018) and 0.045 * (0.026), respectively. The marginal effects of DT_GAP on LRB in columns (2) and (3) are −0.009 ** (0.004) and −0.012 ** (0.006), respectively. The Probit model is applied to columns (1)–(8). “Differences test” uses method of seemingly unrelated regression (SUR), see Greene (2003) for the details of the method [57].
Table 10. Household income level heterogeneity: test results of the impact of DT & DT_GAP on LRB.
VariablesLow-IncomeHigh-IncomeLow-IncomeHigh-Income
(1)(2)(3)(4)
DT0.513 ***0.139
(0.166)(0.110)
DT_GAP −0.128 ***−0.013
(0.039)(0.022)
Control variablesYesYesYesYes
Regional controlYesYesYesYes
Differences test3.64 *6.89 ***
N1308130813081308
Standard errors in parentheses. * p < 0.1, ** p < 0.05, *** p < 0.01. The marginal effects of DT on LRB in columns (1) and (2) are 0.095 ** (0.031) and 0.037(0.029), respectively. The marginal effects of DT_GAP on LRB in columns (3) and (4) are −0.024 *** (0.007) and −0.004 (0.006), respectively. The Probit model is applied to columns (1)-(8). “Differences test” uses method of seemingly unrelated regression (SUR), see Greene (2003) for the details of the method [57].
Publisher’s Note: MDPI stays neutral with regard to jurisdictional claims in published maps and institutional affiliations.

