Article

Key Region Extraction and Body Dimension Measurement of Beef Cattle Using 3D Point Clouds

1
College of Information and Electrical Engineering, China Agricultural University, Beijing 100091, China
2
National Engineering Research Center for Information Technology in Agriculture, Beijing 100097, China
3
Research Center of Information Technology, Beijing Academy of Agriculture and Forestry Sciences, Beijing 100097, China
4
School of Computer Science, University of Guelph, Guelph, ON N1G 2W1, Canada
5
Advanced Robotics & Intelligent Systems (ARIS) Lab, School of Engineering, University of Guelph, Guelph, ON N1G 2W1, Canada
*
Authors to whom correspondence should be addressed.
Agriculture 2022, 12(7), 1012; https://doi.org/10.3390/agriculture12071012
Submission received: 17 June 2022 / Revised: 8 July 2022 / Accepted: 11 July 2022 / Published: 13 July 2022
(This article belongs to the Special Issue Recent Advancements in Precision Livestock Farming)

Abstract

:
Body dimensions are key indicators for the beef cattle fattening and breeding process. On-animal measurement is relatively inefficient, and can induce severe stress responses among beef cattle and pose a risk for operators, thereby impacting the cattle’s growth rate and wellbeing. To address the above issues, a highly efficient and automatic method was developed to measure beef cattle’s body dimensions, including the oblique length, height, width, abdominal girth, and chest girth, based on the reconstructed three-dimensional point cloud data. The horizontal continuous slice sequence of the complete point clouds was first extracted, and the central point of the beef cattle leg region was determined from the span distribution of the point cloud clusters in the targeted slices. Subsequently, the boundary of the beef cattle leg region was identified by the “five-point clustering gradient boundary recognition algorithm” and was then calibrated, followed by the accurate segmentation of the corresponding region. The key regions for body dimension data calculation were further determined by the proposed algorithm, which forms the basis of the scientific calculation of key body dimensions. The influence of different postures of beef cattle on the measurement results was also preliminarily discussed. The results showed that the errors of calculated body dimensions, i.e., the oblique length, height, width, abdominal girth, and chest girth, were 2.3%, 2.8%, 1.6%, 2.8%, and 2.6%, respectively. In the present work, the beef cattle body dimensions could be effectively measured based on the 3D regional features of the point cloud data. The proposed algorithm shows a degree of generalization and robustness that is not affected by different postures of beef cattle. This automatic method can be effectively used to collect reliable phenotype data during the fattening of beef cattle and can be directly integrated into the breeding process.

1. Introduction

Globally, the ever-increasing consumption of beef products poses high levels of stress on environmental protection and the energy supply [1] and thereby the precise breeding of beef cattle has become the mainstream activity for growers and breeders alike. The precise acquisition of body dimension data plays a vital role in evaluating the body weight [2], breeding value [3], dressing percentage [4], beef yield [4], body fat rate [5], and growth performance [6] of beef cattle, and it is of great significance for beef cattle breeding management, disease warning, yield estimation, and selective breeding. The body dimension measurement of beef cattle is commonly carried out with the assistance of tape measures and measuring sticks [7], which usually takes around 3–5 min per animal. However, the on-animal measurement can induce severe stress responses among beef cattle and pose high risks for farmhands [8]. It was also reported that the animal feed intake and weight gain data were significantly reduced when the body dimensions were measured [9]. In addition, the non-standard and less rigorous measurement adopted at different stages of the cattle lifespan can directly affect the progress of beef cattle breeding [10].
To address the problems above, machine vision technology was used for beef cattle body dimension measurements [11], thereby alleviating the interference caused by the on-animal measurement and improving the accuracy of the final results. Several studies have explored this idea, applied at different levels of complexity on various livestock species. Ruchay et al. [12] manually marked several points in a reconstructed model for non-contact body measurements in cattle, leading to an error of less than 3%. Similarly, Kwon et al. [13] proposed an iterative offset-based method to establish a point cloud mesh model of pigs, where the widest regions of the foreleg, hind leg, and middle torso were manually determined, measuring the body dimensions based on geometric features. Weber et al. [14] measured the hip width, body length, and shoulders from beef cattle images using the ImageJ [15] software based on manual markers, through which the body weight was well estimated. Guo et al. [16] developed a semi-automatic and open-access body dimension measurement tool to deal with point cloud data of cattle and pigs sharing similar characteristics, which helped to extract several parameters, such as the height, chest girth, and body length, by labelling points manually, resulting in measurement errors of 2–7%. Kuzuhara et al. [17] collected 3D digital images of dairy cows using a single-view depth camera, from which several inspection lines were extracted via the measurement function in Artec Studio 9.2. The body dimensions were then successfully measured, and the corresponding body condition score was evaluated afterward.
Although the methods mentioned above can measure the body dimensions of livestock species using contact-free sensors, which greatly reduces the stress on animals during the measurement, experienced workers are required to determine measurement points from point cloud data to complete the task, which typically leads to a degree of contingency and subjectivity in the results. To measure the beef cattle body dimensions automatically, Xu et al. [18] detected the key points of the cattle body from RGB images through the CentreNet network, and extracted the core parameters, including the body length, body oblique length, and wither height, based on the location of key points. Weales et al. [19] divided the cattle body area into three equal regions along the direction of the dorsal line, and the widest slice in each region (from the top view) was recorded to extract the core parameters, such as the wither height, chest girth, and heart circumference, whose average errors were within the 1.9–2.3% range. Wang et al. [20] proposed a method to automatically identify and measure the heart girth regions from pig point clouds, and the results showed an average error of approximately 7.9%. Guo et al. [21] developed a fully automatic pose normalization framework, which can be used to calibrate the principal direction of livestock and automatically measure the body length, wither width, wither height, hip width, and hip height with errors of 3–8%. Yin et al. [22] identified each inflection point of pigs based on the middle point of the ear root and the point of the tail root, according to the distribution law of the density of points. Shi et al. [23] adopted a similar strategy, where the inflection point on the distribution curve was utilized as the key measurement point to extract the core parameters of pigs, such as the wither height, body length, and body width, with average errors of 2.97–4.67%. Li et al. [24] determined the body length values of pigs using the line connecting the ear point and the buttock point. The midpoint of the line was set as the measurement point of the wither height, the error limit of which was approximately 5 cm. These methods enable the automatic location and identification of the measurement points for body dimension calculation, based on geometric relationships. However, the measurement results are easily influenced by the changeable postures and the differences in body shape if the dimensions are only calculated based on the located ‘key points’, which will eventually result in large deviations from the real values.
To cope with the problems described above, a measurement method was proposed to extract the body dimensions of beef cattle, based on the distribution characteristics of reconstructed three-dimensional point cloud data. This method was able to extract the targeted point cloud regions automatically. More precisely, the shoulder, chest, buttocks, abdomen, and other key regions were extracted without any manual intervention, and the body dimensions for beef cattle with different postures were automatically measured. The measurement results could provide solid support for beef cattle production performance determination, body weight prediction, and breeding value estimation.

2. Materials and Methods

2.1. Acquisition of Beef Cattle Point Cloud Data

The 3D point cloud data were collected in the Xunchi Youniu farm (Gulang County, Wuwei City, Gansu Province, China) in September 2021. The 3D point clouds of 10 Holstein bulls aged 11–13 months were collected using the point cloud acquisition equipment for beef cattle described in detail in Li et al. [25]. All the data were automatically collected when the beef cattle passed through the device. A total of 182 sets of point clouds were collected from the beef cattle in various postures. The details of the experimental acquisition equipment and examples of collected point cloud data are shown in Figure 1.
The unit scale of the beef cattle point cloud coordinate system was millimeters. The coordinate calibration was carried out based on an integrated algorithm enabling both the ground normal vector judgment and Principal Components Analysis (PCA) in the acquisition device. The calibrated coordinate system was defined as follows: starting from the origin of the center of mass, the direction from the ground to the head was recorded as the positive direction of the z-axis, and the tail pointing to the head was recorded as the positive direction of the y-axis, while the direction perpendicular to the y–z plane (pointing to the right side of the cattle body) was recorded as the positive direction of the x-axis.

2.2. Definition of Beef Cattle Body Dimensions

According to the assessment criteria of beef cattle body dimensions during the breeding and fattening process, the key body dimensions include the wither height, body oblique length, body width, chest girth, and abdominal girth. The measurement standards of these parameters are listed in Table 1.
According to the definitions given in Table 1, the measurement site for each body dimension is shown in Figure 2.

2.3. Algorithm for Beef Cattle Body Dimension Calculation

The positions of the wither, ischium, and shoulder are the key regions for beef cattle body dimension measurements. For beef cattle on a farm, the bulge on the wither can only be examined by touching, so it is difficult to be identified by visual methods.
It can be clearly seen that the measurement positions of the chest and wither height are closely related to the wither region located at the rear edge of the foreleg. The measurement position of the body oblique length is linked to the shoulder region near the front edge of the foreleg and the rump region near the rear edge of the hind leg. The region for girth measurement is in the middle of the forelegs and the hind legs. Therefore, the key regions for body dimension measurement can be determined by leg region analyses.
Firstly, the front and hind leg regions were located using the y-coordinate and the corresponding three-dimensional point clouds were extracted. Subsequently, the cutting lines of the key regions were identified. Finally, the key body dimensions were automatically calculated based on the features of the extracted regions. A detailed schematic of the algorithm is shown in Figure 3.

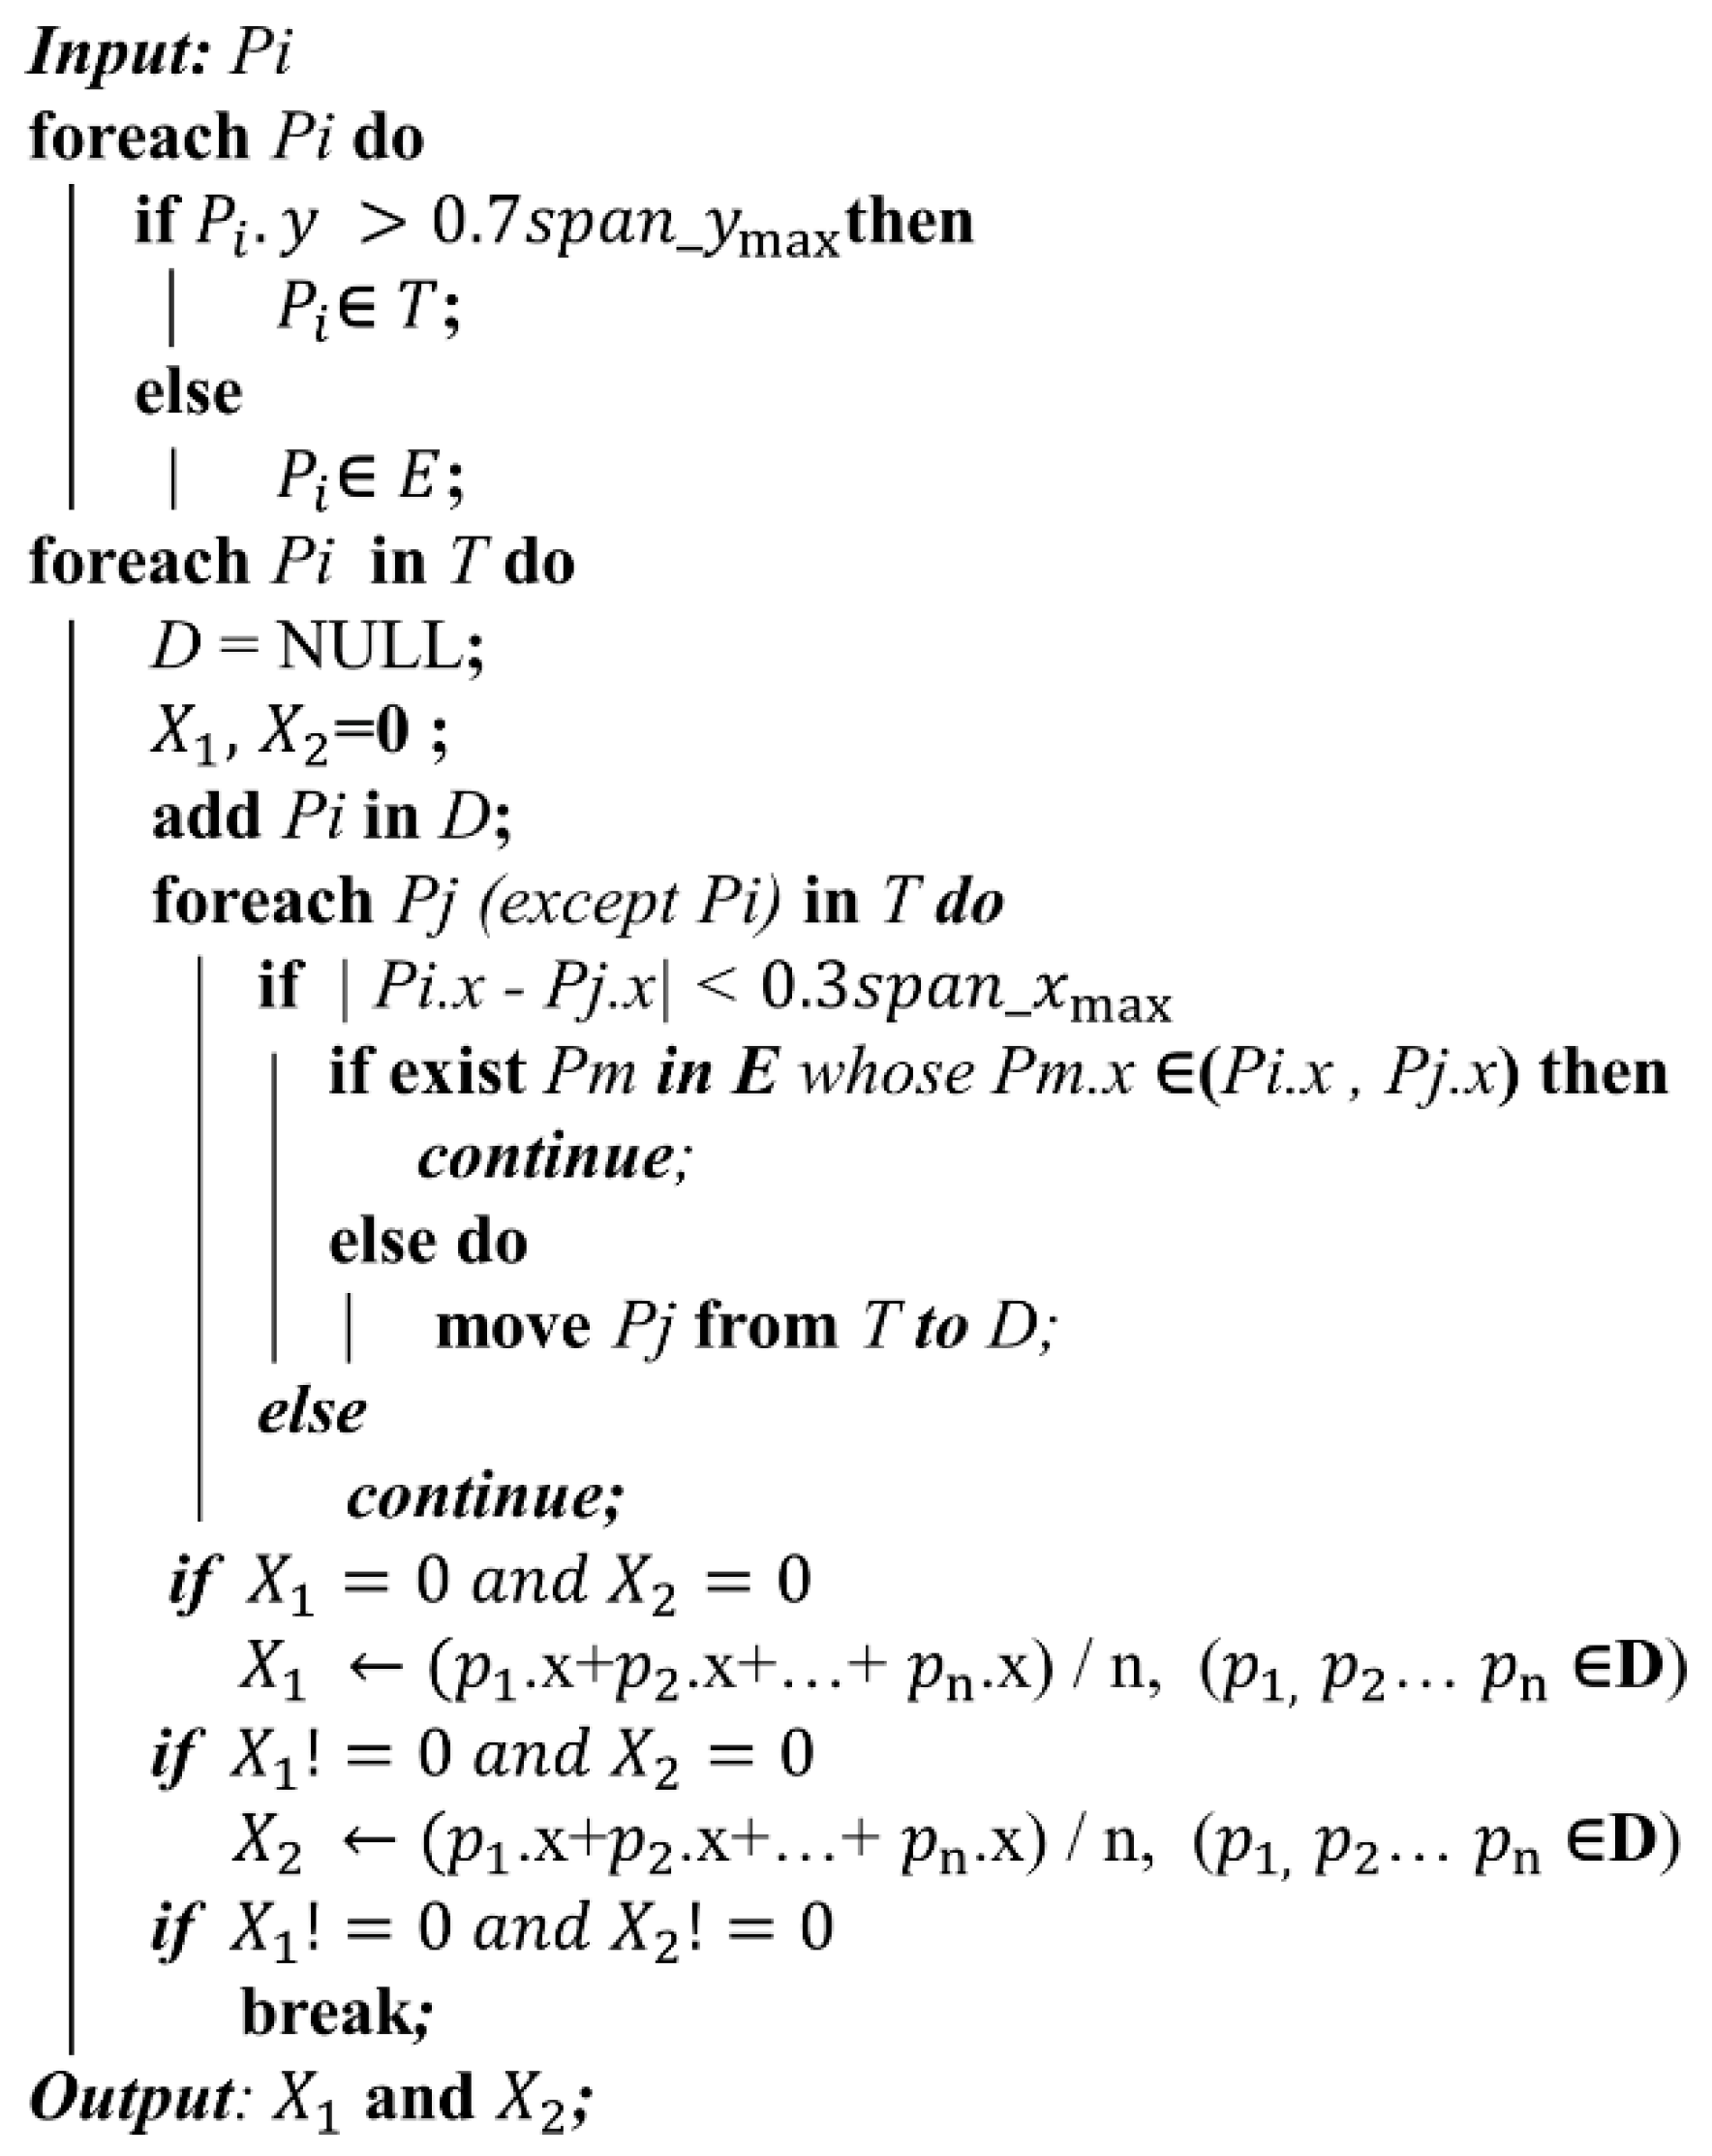
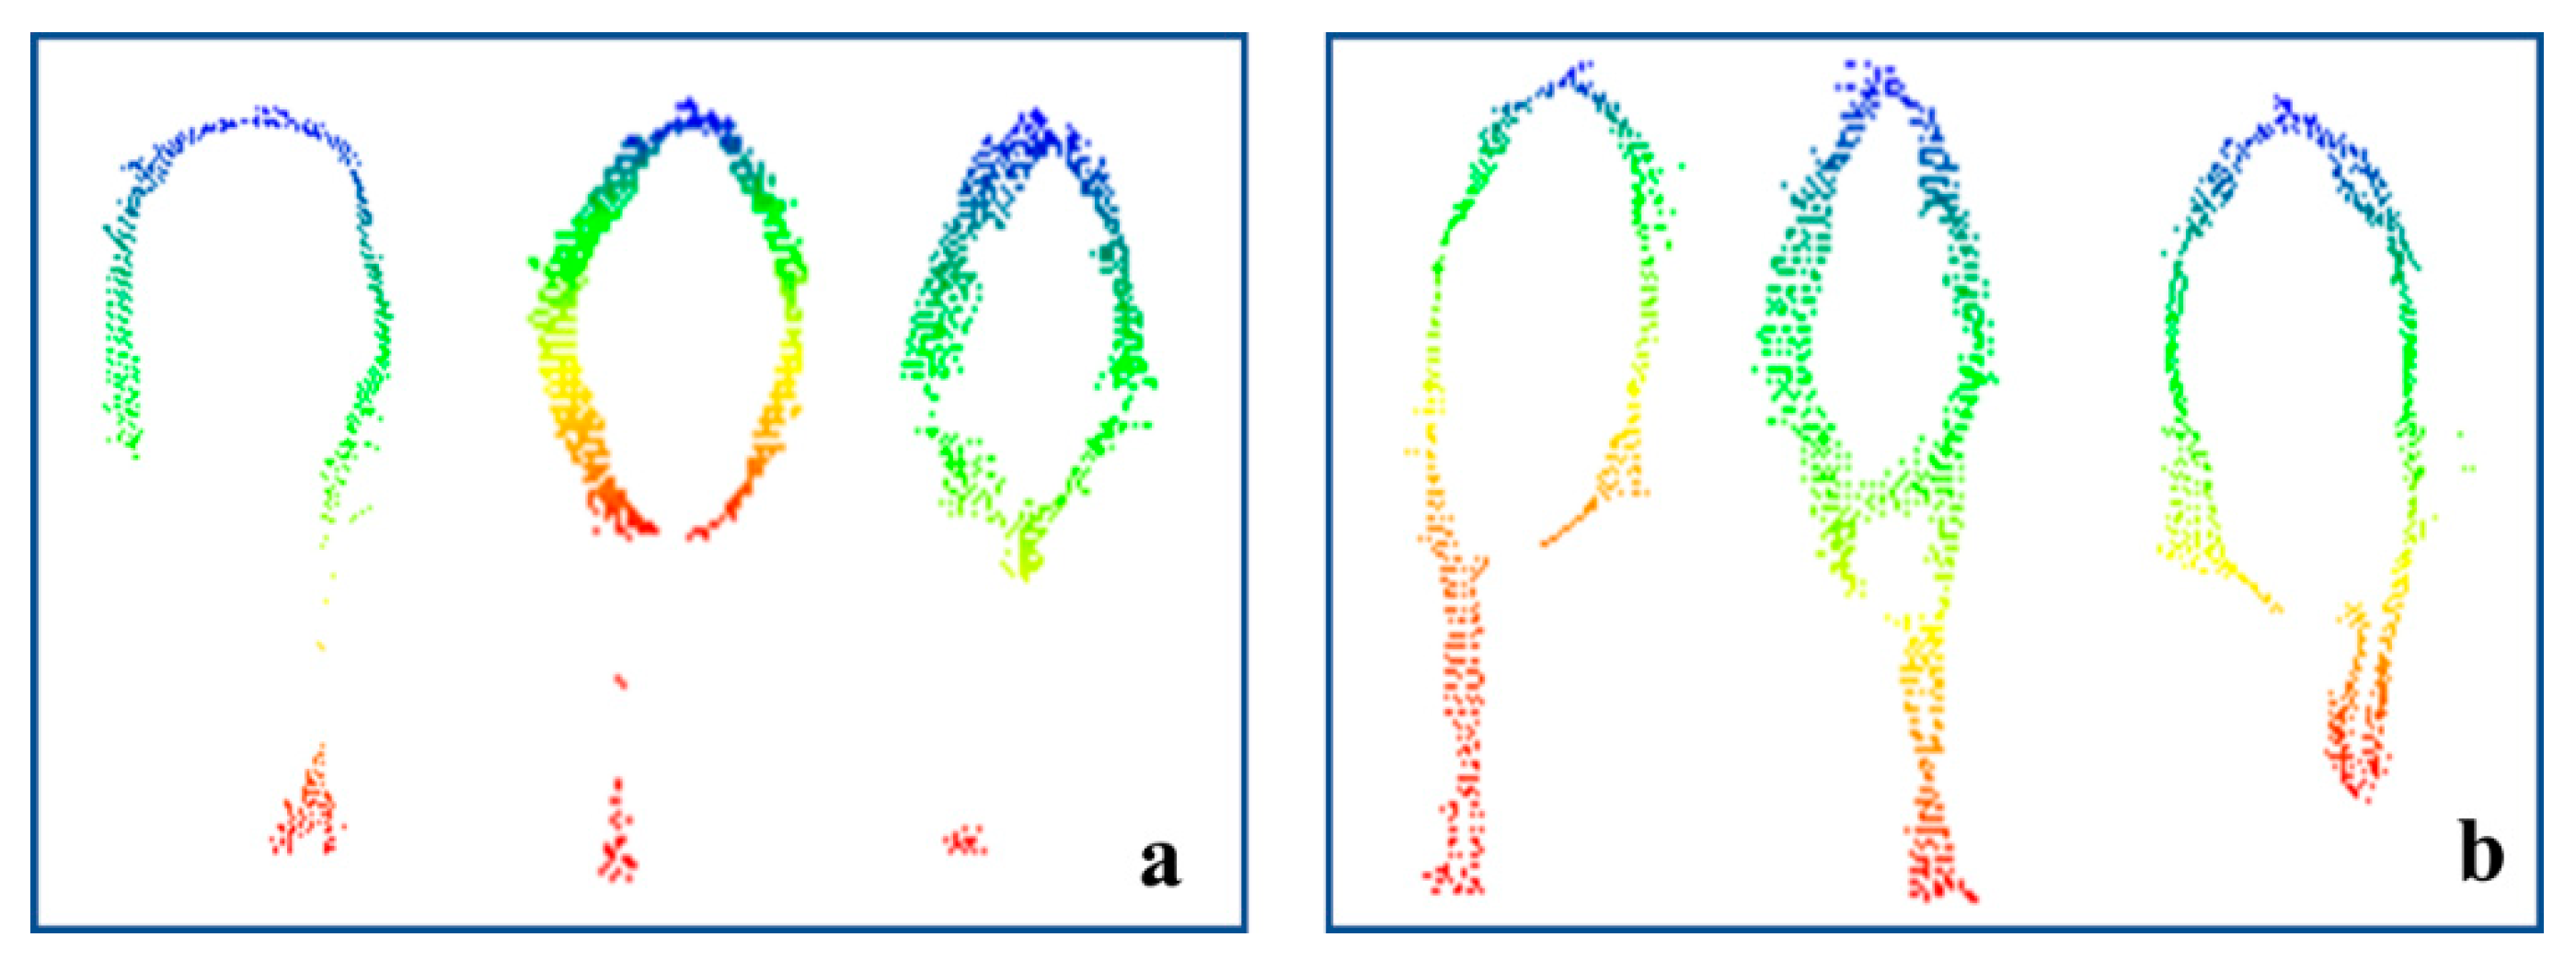
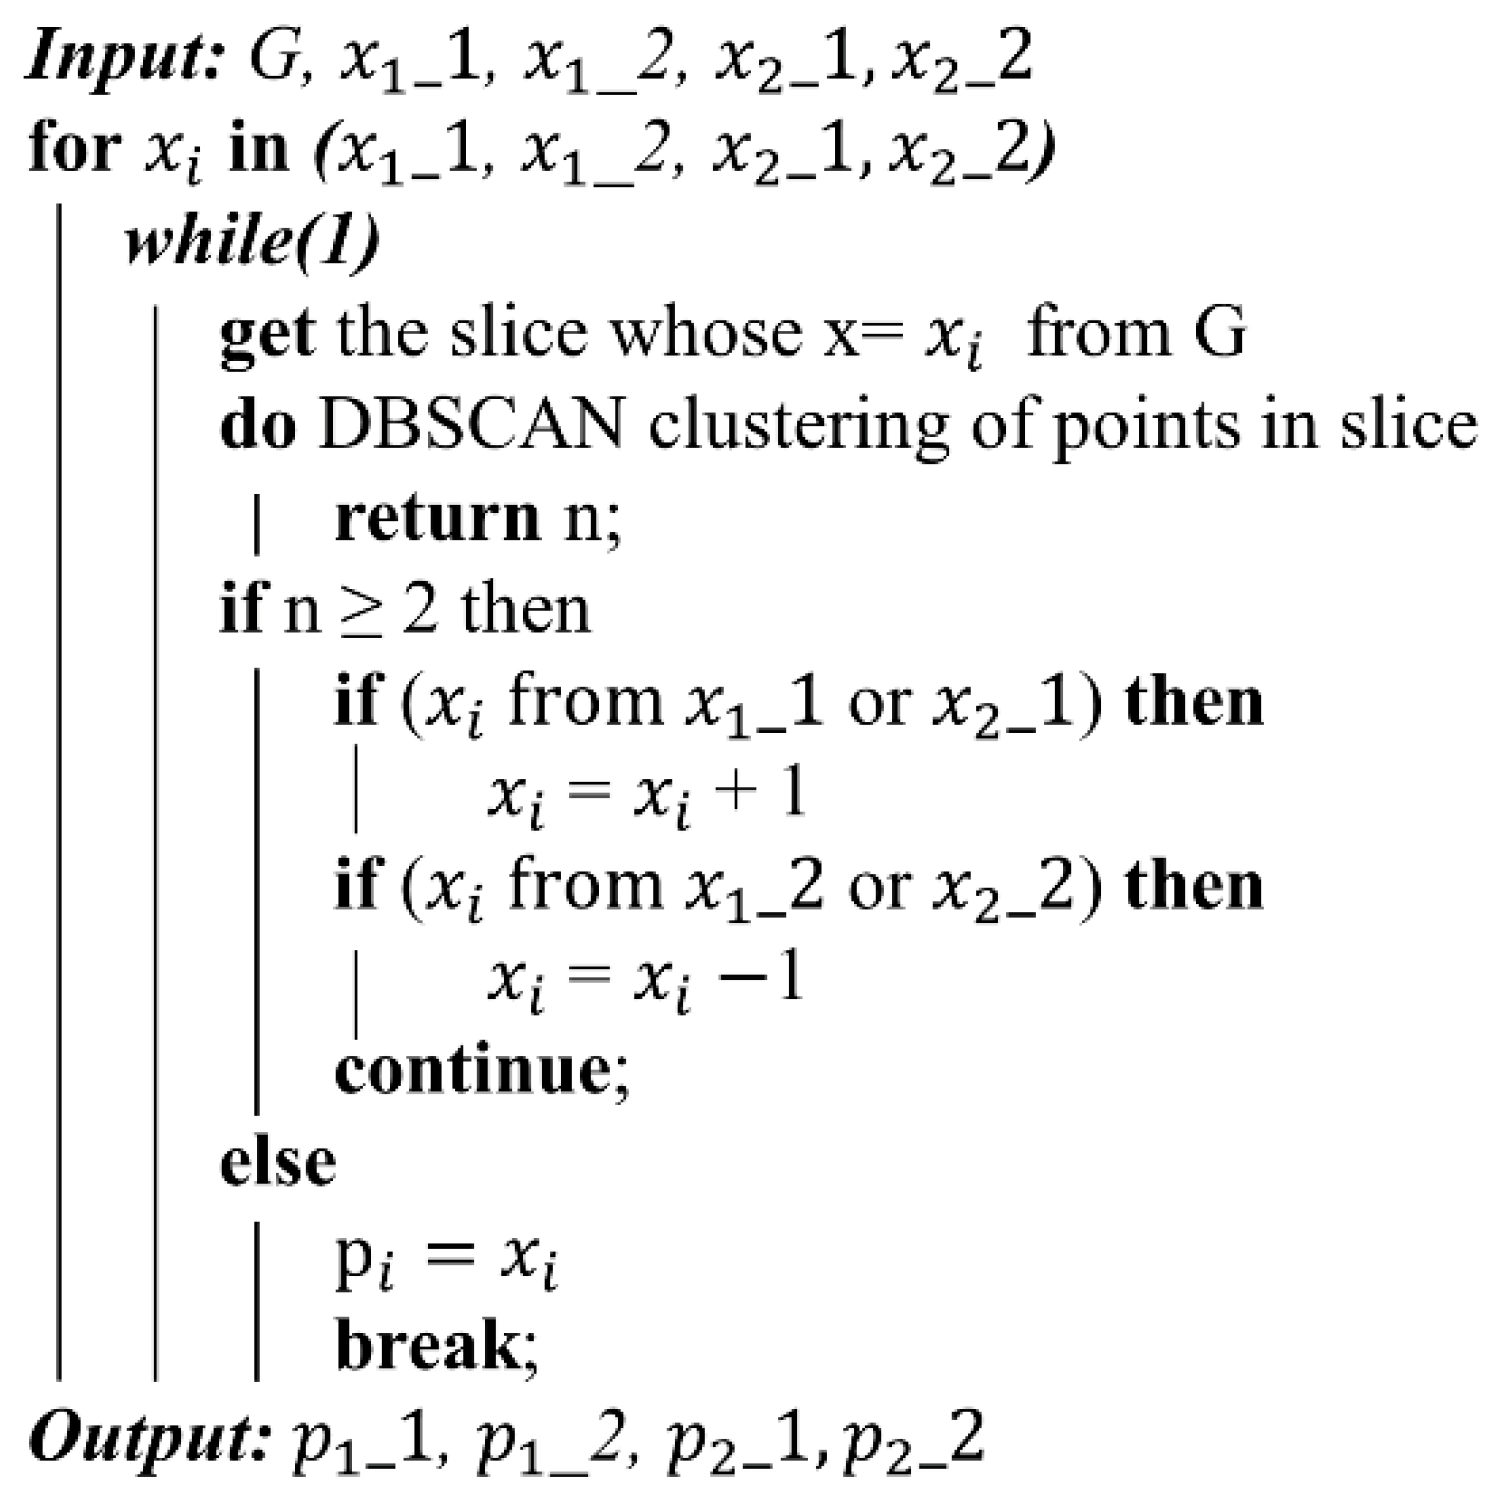
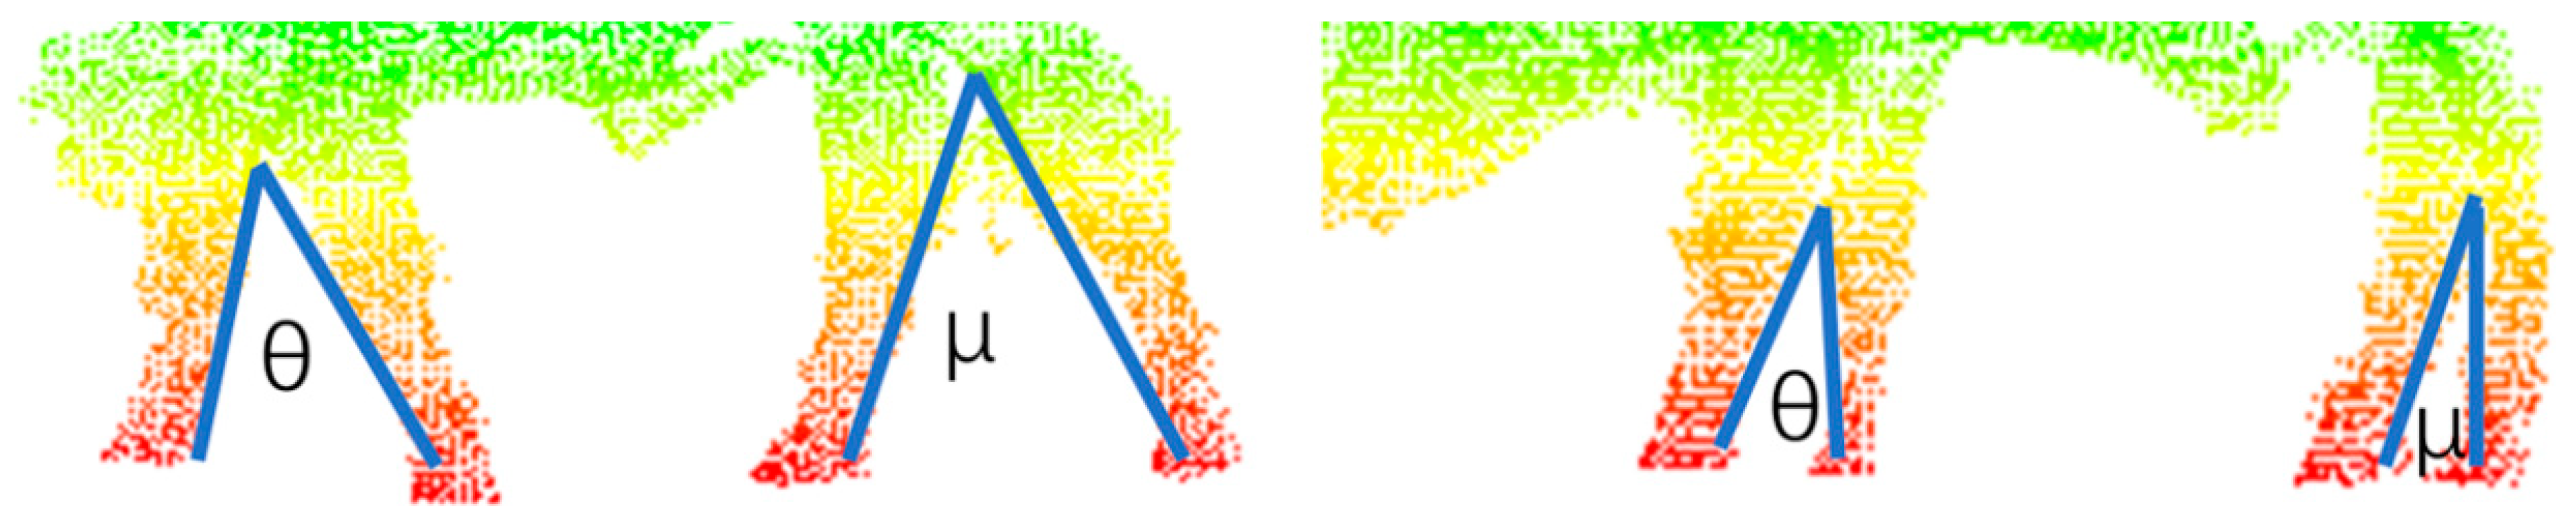
2.4. Identification of Point Clouds of Leg Regions

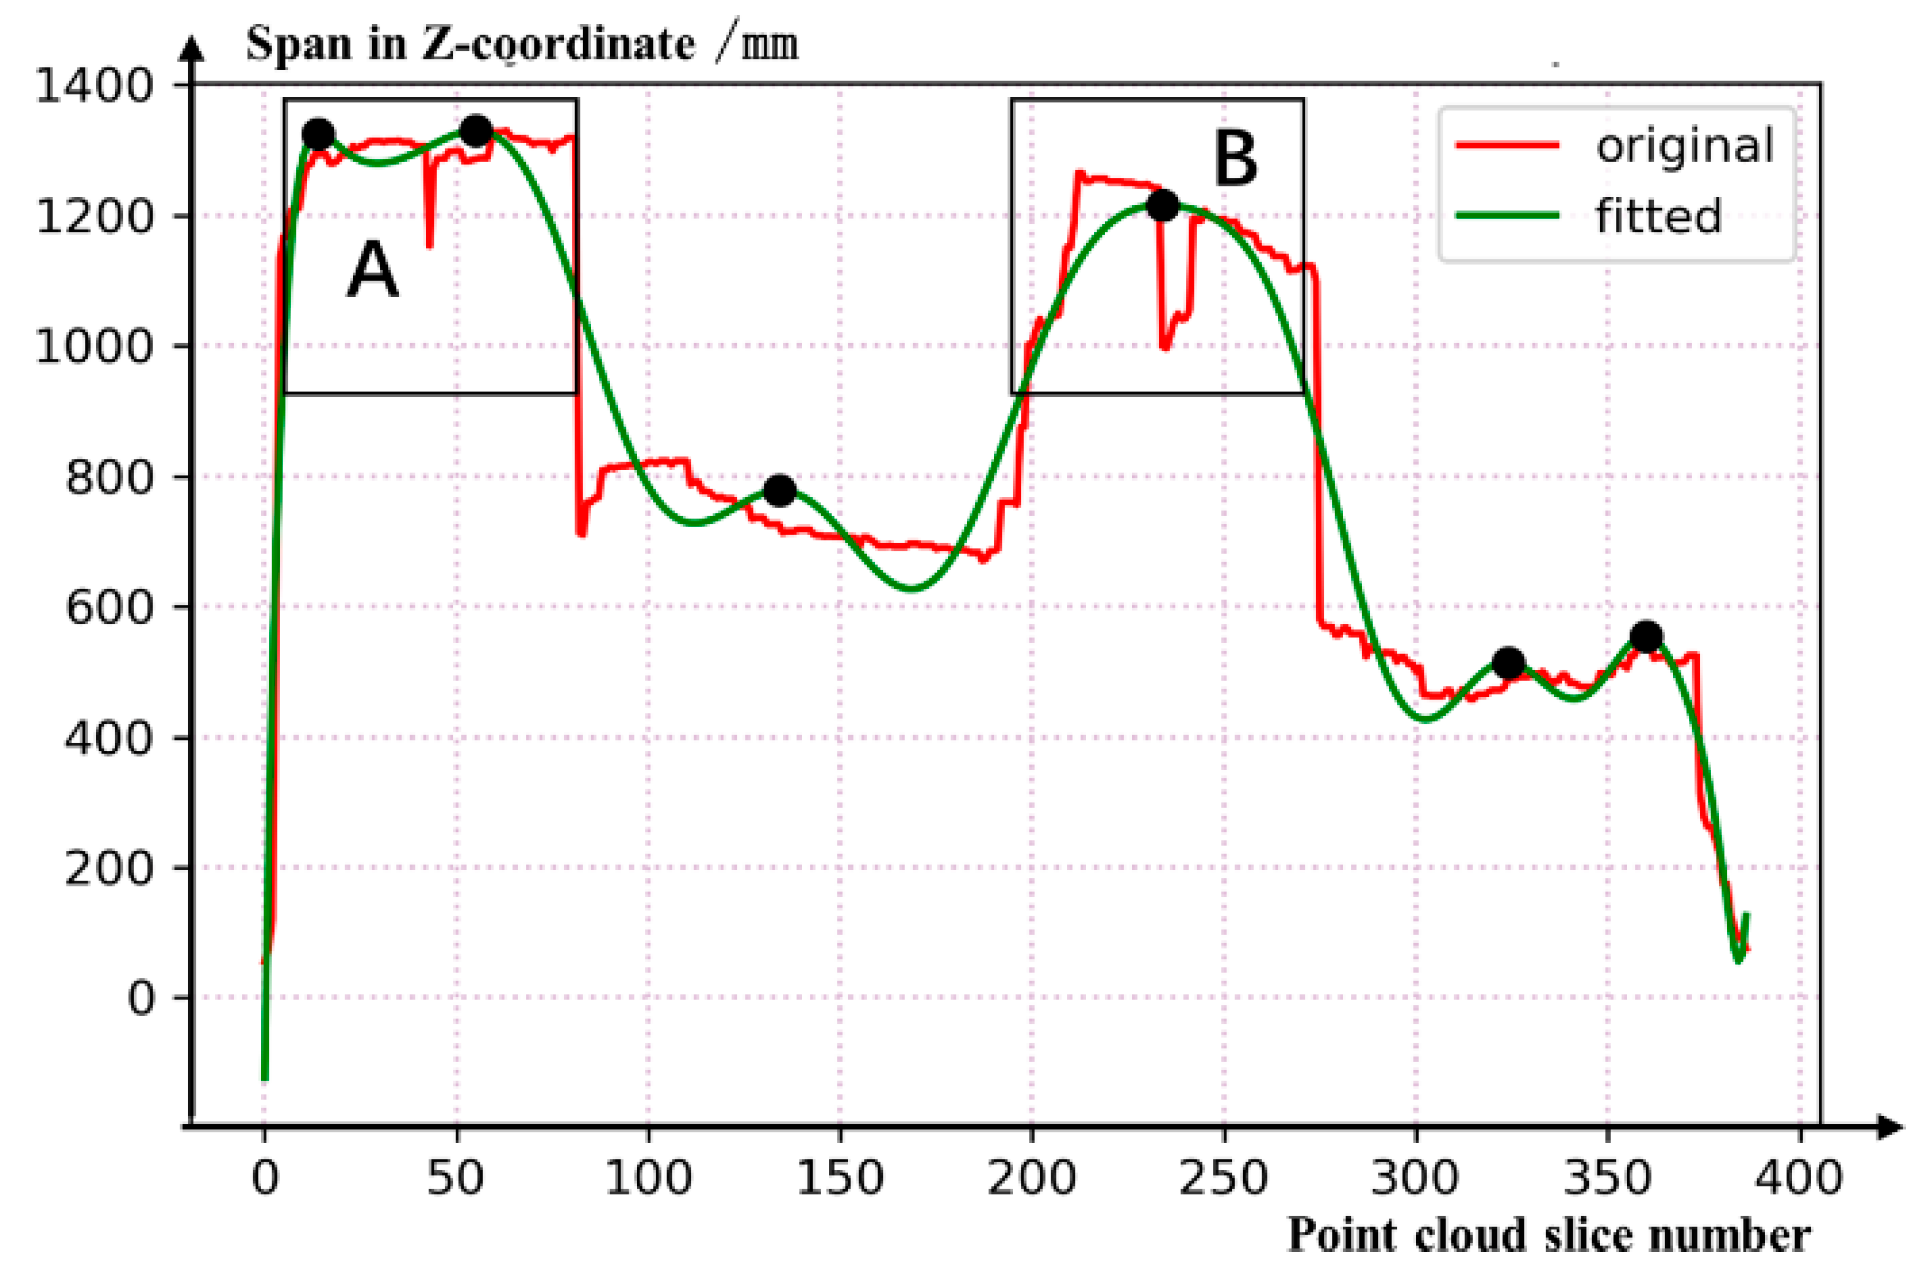
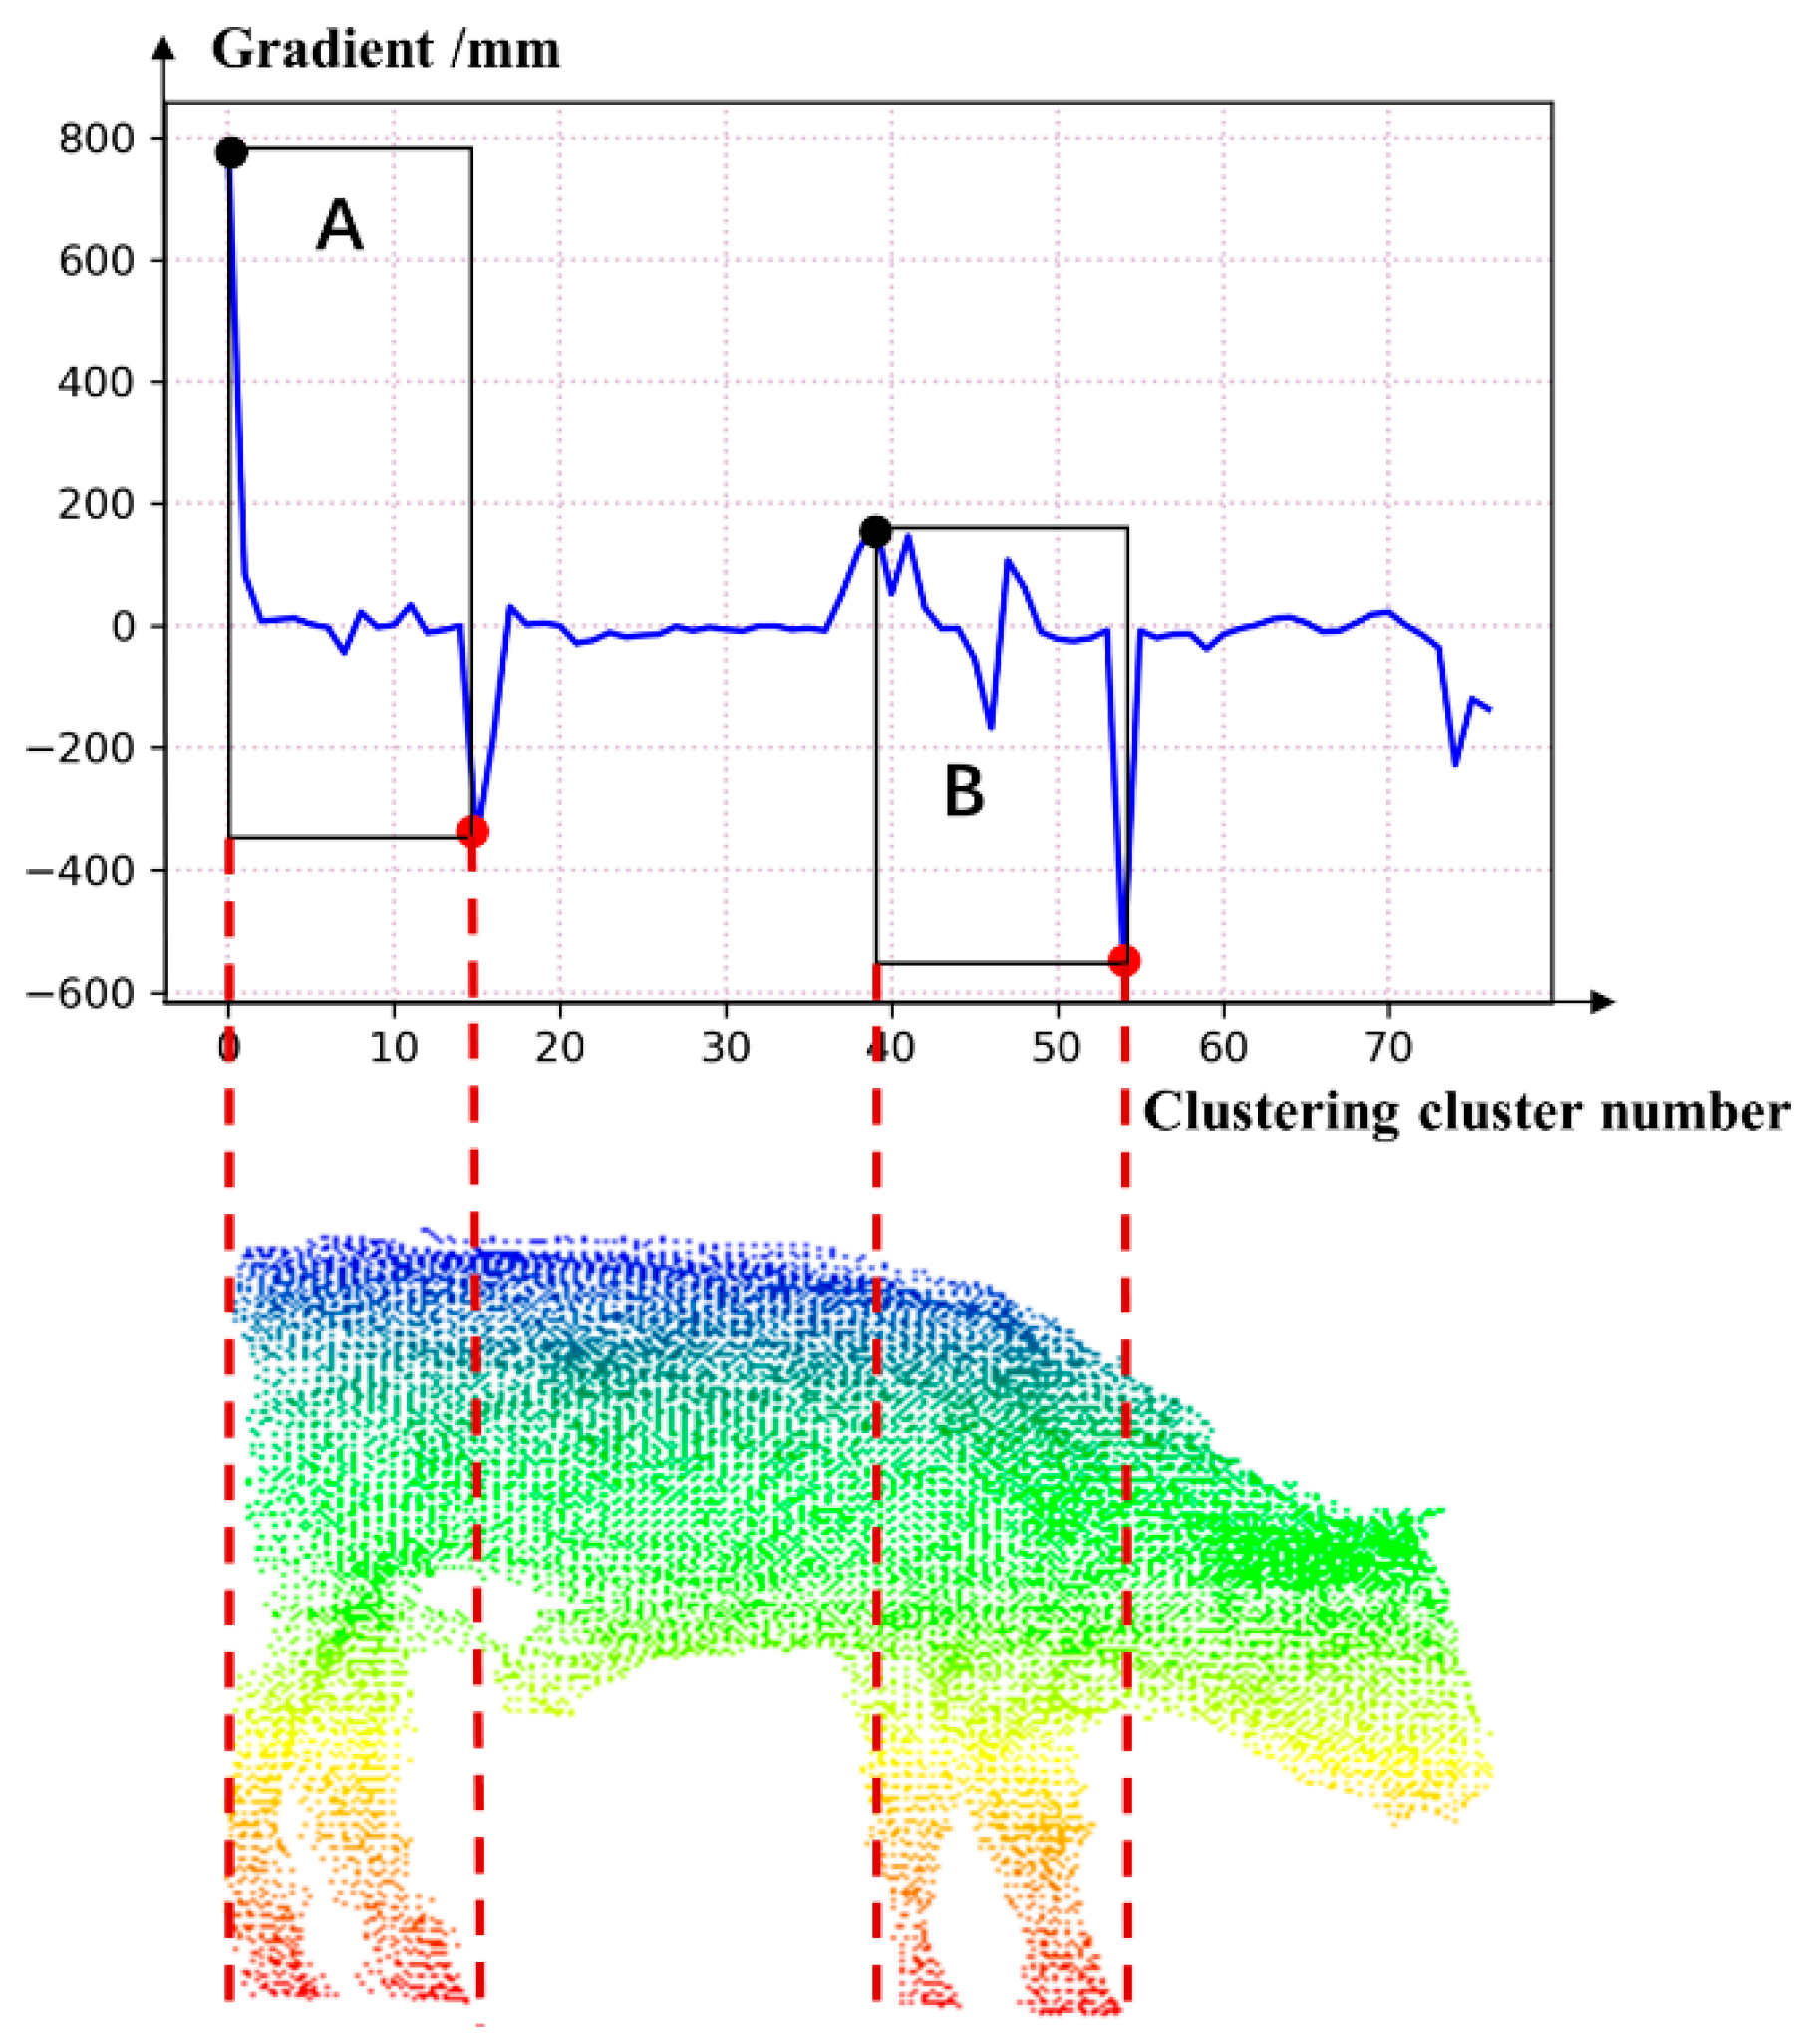
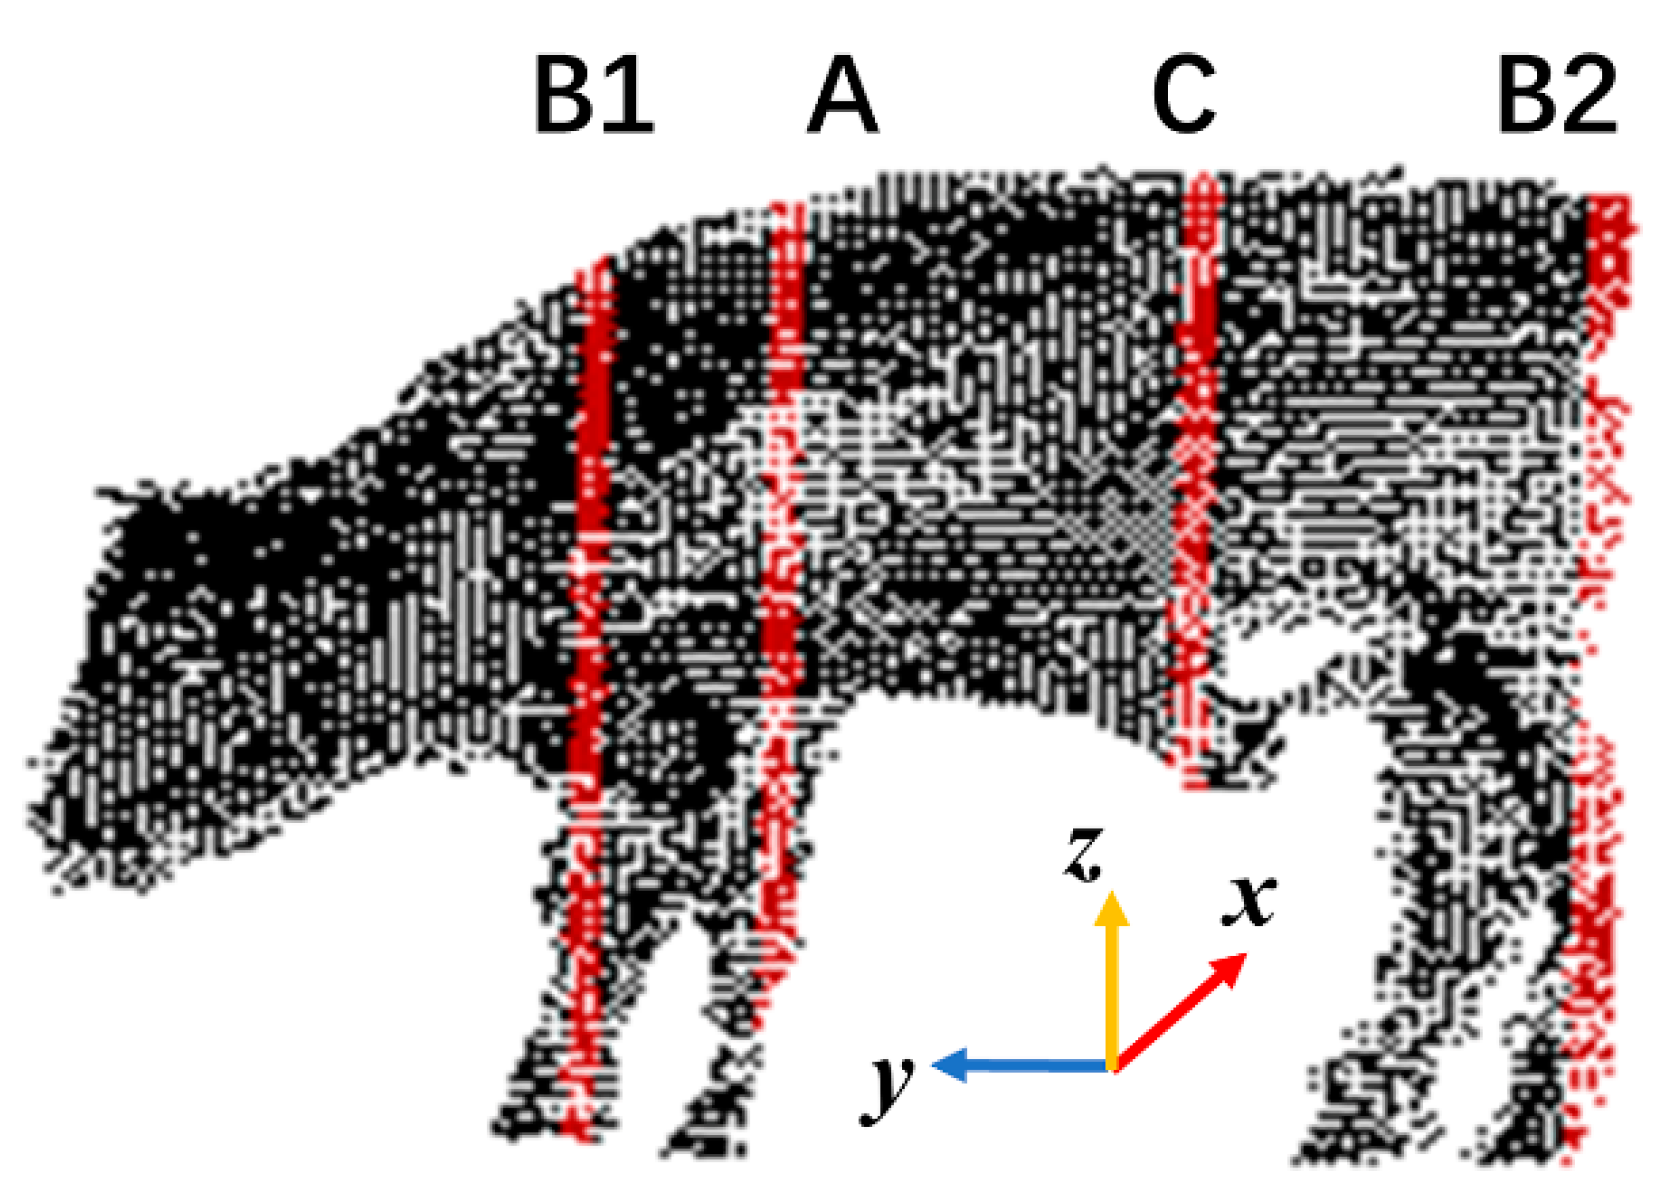
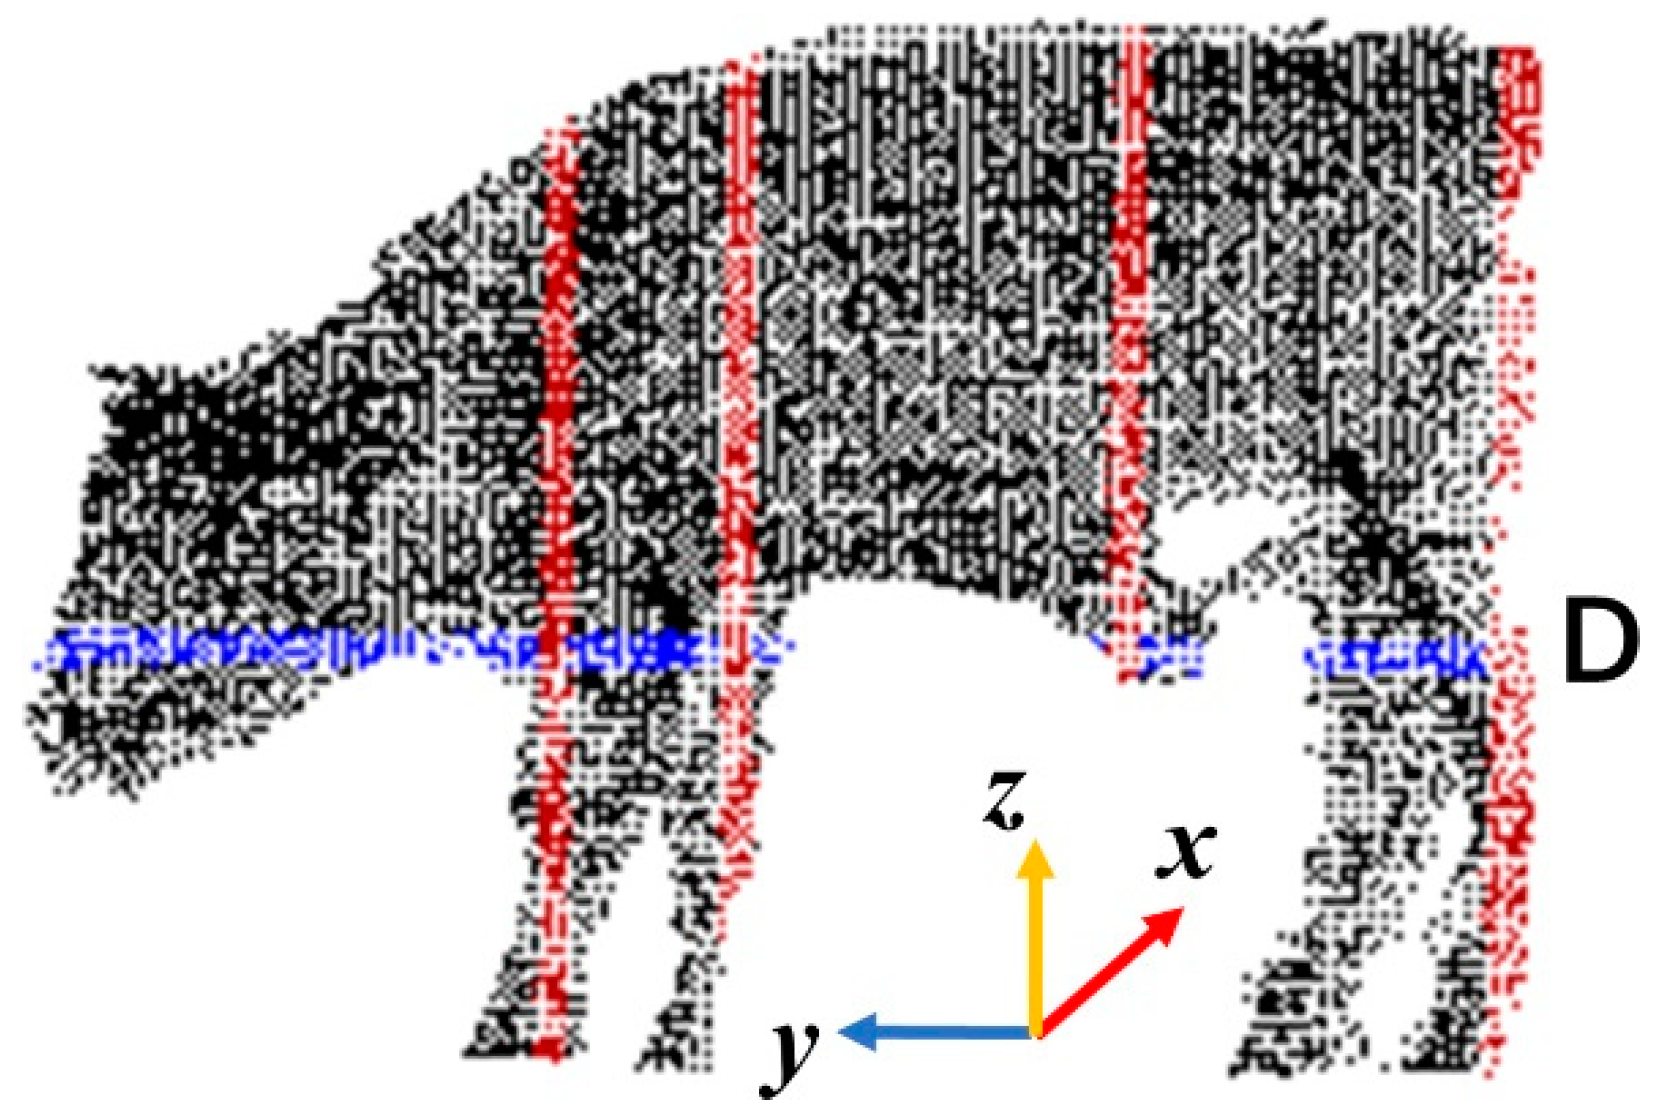
2.4.1. Extraction of Continuous Slices and Span Characteristic Curves

To study the distribution characteristics of beef cattle point clouds, the three-dimensional point clouds were continuously sliced along the y-axis direction with a span of 5 mm in ascending order. For each slice, the span value in the z-axis direction was counted successively. The red curve in Figure 4 represents the original data, and the green curve represents the results after higher-order fitting. The maximum points of the fitted curve were marked as black dots. It can be found that the areas near the two extreme points (A1, A2) with the largest span values (highlighted by the black dotted line) correspond to the leg regions.

2.4.2. Location of the Leg Region

To preliminarily locate the leg region, the central point of the leg was first determined and the regional boundary was then identified on both sides. According to the distribution characteristics of the three-dimensional beef cattle point clouds, there must be extreme points with large span values within the regions of the forelegs and hind legs. However, multiple extreme points might be revealed on the curve (Figure 5).
As Figure 5 shows, region A corresponds to the hind leg, and region B is assigned to the foreleg, and there are two extreme points in region A. When the beef cattle are walking, their legs are spread apart, thereby leading to two or more extreme points in region A or B on the fitted curve. In this case, the approximate central point of the leg region cannot be simply identified by a single extreme point. The algorithm showing the central point extraction for the leg region is presented in Figure 6 by means of pseudocodes, where Pi is the extreme point on the fitted curve (i = 0, 1, 2…), T represents the point set including the extreme points in the leg region, E is the point set excluding the extreme points in the leg region, Pm refers to any point in the set E, D is the point set made up of an extreme point and its surrounding extreme points, Pi.x is the x-coordinate value of a point, Pi.y is the y-coordinate value of a point, span ymax is the span value of the range domain for the fitted curve, xmax is the span value of the domain of the fitted curve, and X1 and X2 represent the x-coordinate values of the approximate midpoint in the leg region.
In this process, the extreme points with similar x-coordinate values are merged, and meanwhile, the merged extreme points need to be located on both sides of the central point of the abdomen, which can ensure that two core points belonging to the leg region are successfully extracted, representing the x-coordinate positions of the fitted curve for the regions of the forelegs and hind leg. The y-coordinate positions of the approximate midpoint in the leg region are therefore determined.
After the approximate central point is determined, it is necessary to further identify the regional boundary, to accurately locate the coordinate area corresponding to the leg region along the direction of the body length (the y-axis direction of the three-dimensional point clouds). On the original distribution curve of span values for continuous slices, the span value at the boundary of the leg region shows attenuation. We proposed a “five-point gradient boundary recognition algorithm” to perform the boundary identification task. Assuming that the adjacent two “five-point clusters” on the span distribution curve are A1 (a1, a2, a3, a4, a5) and A2 (a6, a7, a8, a9, a10), respectively, the average gradient P of these five consecutive points can be calculated from Equation (1):
P = 1 5 ( i = 6 10 a i i = 1 5 a i )
where ai represents the discrete point on the distribution curve of span values. According to the independent variables in ascending order, the average gradient distribution of all the “five-point clusters” on the curve (Figure 5) was sequentially extracted, as shown in Figure 7. The gradient characteristic distribution curve (blue curve in Figure 7) shows that the maximum value (black dot) and the minimum value (red dot) appear at the boundary of the leg region, which is consistent with the geometric distribution characteristics of beef cattle point cloud slices. Therefore, the two points with the maximum gradient were selected as the starting boundary positions for regional segmentation. The two points with the minimum gradient were selected as the ending boundary positions, highlighted by the red dotted line in Figure 7. Each central point of the leg, along with the starting and ending boundaries, forms the regions of the forelegs and hind legs, which means that the automatic extraction of the leg region is implemented.

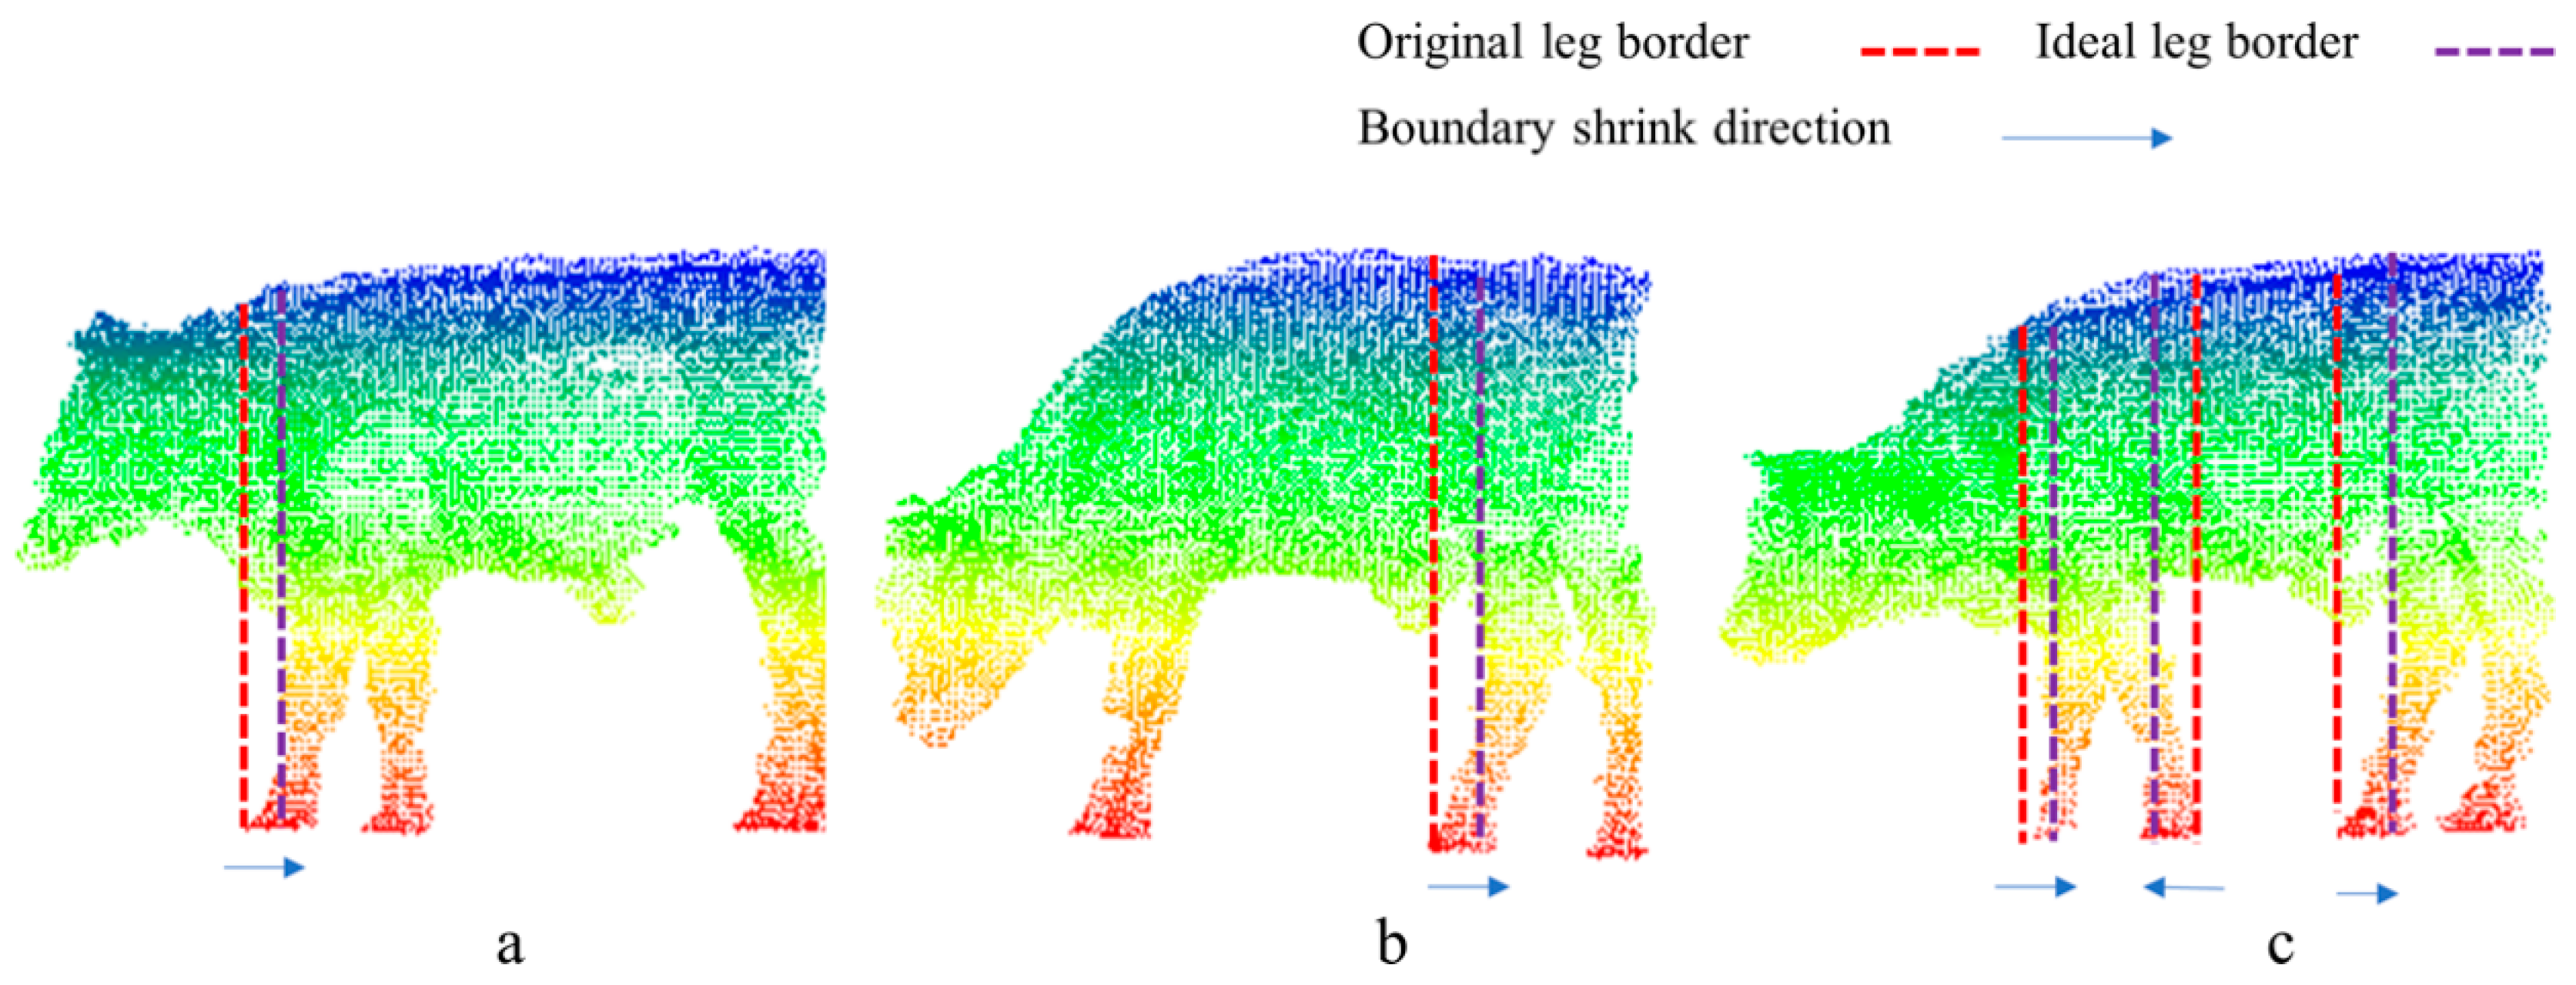
2.4.3. Calibration of Boundaries for the Leg Region

Through the method described in Section 2.4.2, the leg region can be extracted along the x-axis direction. However, for walking beef cattle, the located leg region would be grossly inflated when there were obvious leg crossovers, as shown in Figure 8.
The area highlighted by the red dotted line represents the boundary of the leg region identified by the proposed algorithm. However, for the point clouds of beef cattle in a walking posture, the recognition result showed that the leg region was significantly enlarged (the foreleg region in Figure 8a, the hind leg region in Figure 8b, and both the foreleg and hind leg regions in Figure 8c), thereby lowering the accuracy. By contrast, the area highlighted by the blue dotted line reflects the actual situation for targeted extraction. Before calculating the body dimensions, it is necessary to locate the ideal leg region in the blue area, to reduce the influence of the posture on the calculation results. The longitudinal slices of beef cattle point clouds with the inflated (Figure 9a) and calibrated (Figure 9b) boundaries of the leg region were extracted. In Figure 9, the calf region in the uncalibrated slice is separated from the body region because of the leg crossover during walking, whilst the leg region remains connected to the body region in the calibrated slice. In view of this, the unsupervised DBSCAN clustering algorithm was proposed to calibrate the leg region boundary based on clustering features.
Herein, the point cloud slices at the boundary of the leg region were first extracted, and the DBSCAN algorithm [26] was then used to cluster all the points inside the slices. If there were two or more clusters, the boundary was changed to narrow the range of the leg region until the slice with only one cluster was identified. The pseudocodes of the algorithm are shown in Figure 10, where G represents the original beef cattle point clouds, x1_1 and x1_2 represent the x-coordinates of the front and back boundaries of the foreleg region before calibration, x2_1 and x2_2 represent the x-coordinates of the front and back boundaries of the hind leg region after calibration, p is the x-coordinate corresponding to the boundary of the leg region after calibration, and n is the number of clusters derived from the DBSCAN clustering algorithm.

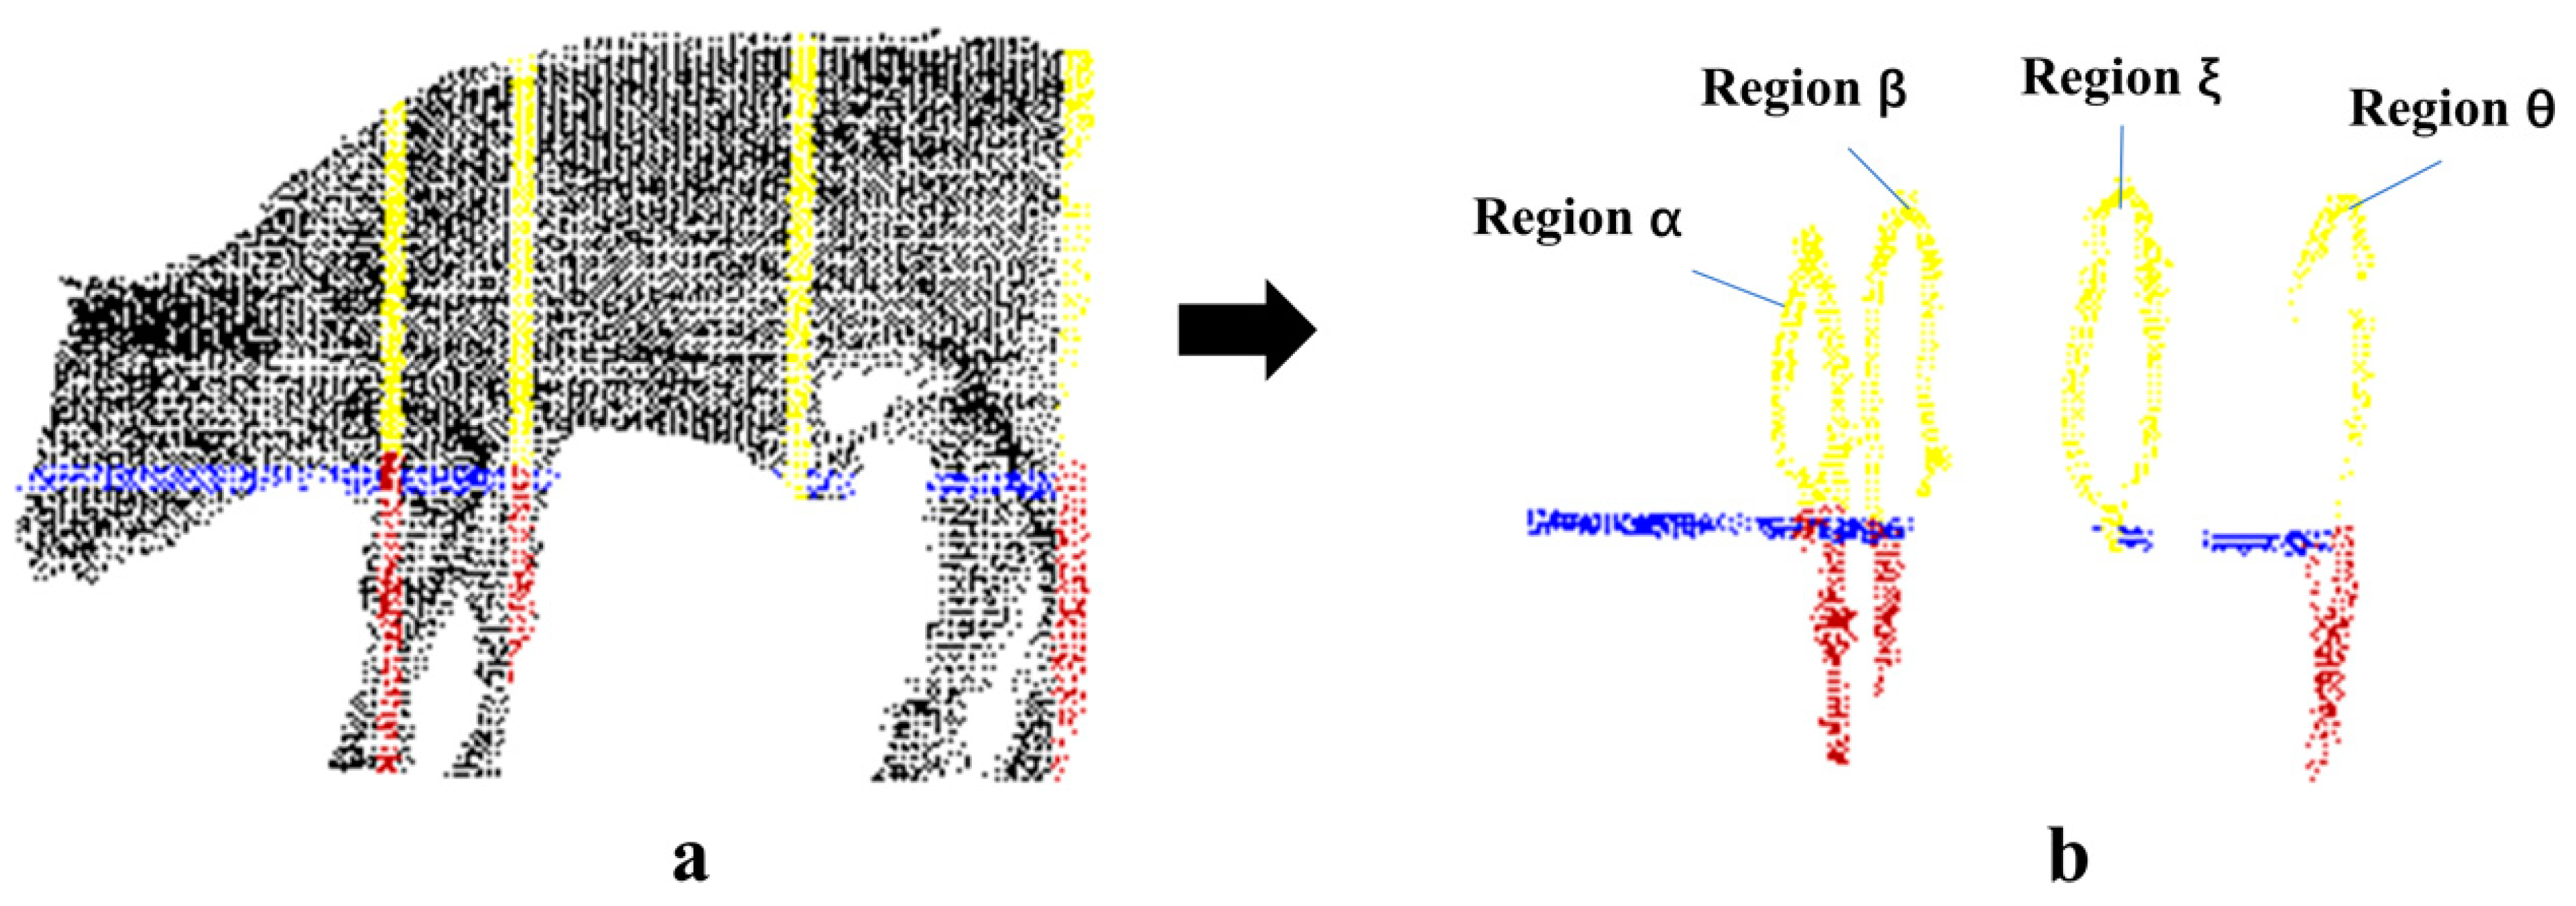
2.5. Extraction of the Key Regions for Body Dimension Calculation

Based on the front and rear edge boundaries of the leg region, the extraction of the key regions for body dimension calculation was achieved.

2.5.1. Determination of the Longitudinal Cutting Plane

The rear edge of the foreleg was utilized to measure the wither height and body width of beef cattle. The rear boundary of the foreleg was selected as the center, where a cutting plane perpendicular to the x–y plane was constructed. In this cutting plane, a slice with a thickness of 30 mm was extracted as the rear edge of the foreleg (slice A in Figure 11). Similarly, at the boundaries of the front edge of the foreleg and the rear edge of the hind leg, two slices with a thickness of 30 mm were extracted, which were assigned to the front edge of the foreleg (slice B1 in Figure 11) and the rear edge of the hind leg (slice B2 in Figure 11), respectively. Slice C (Figure 11) was directly extracted from the span distribution curve of the continuous slices for beef cattle. The extreme point between the leg regions (point B in Figure 4) was used to construct a cutting plane parallel to the x–z plane, where a slice of 30 mm thickness was extracted for the abdomen region. In particular, if the number of the extreme points is not equal to 1 between the front or rear legs, the midpoint between the boundary positions of the rear edge of the foreleg and the front edge of the hind leg will be directly selected as the construction point for slice C.

2.5.2. Determination of the Horizontal Cutting Plane

Slices displayed in Figure 11 (A, B1, B2, etc.) include the point cloud data of the leg region. To extract the parameters such as the chest girth, the torso region without leg information was expected to be determined. Therefore, a cutting plane parallel to the ground based on the minimum z-coordinate value of the abdominal slice (C) was used to extract slice D with a thickness of 30 mm, as shown in Figure 12.

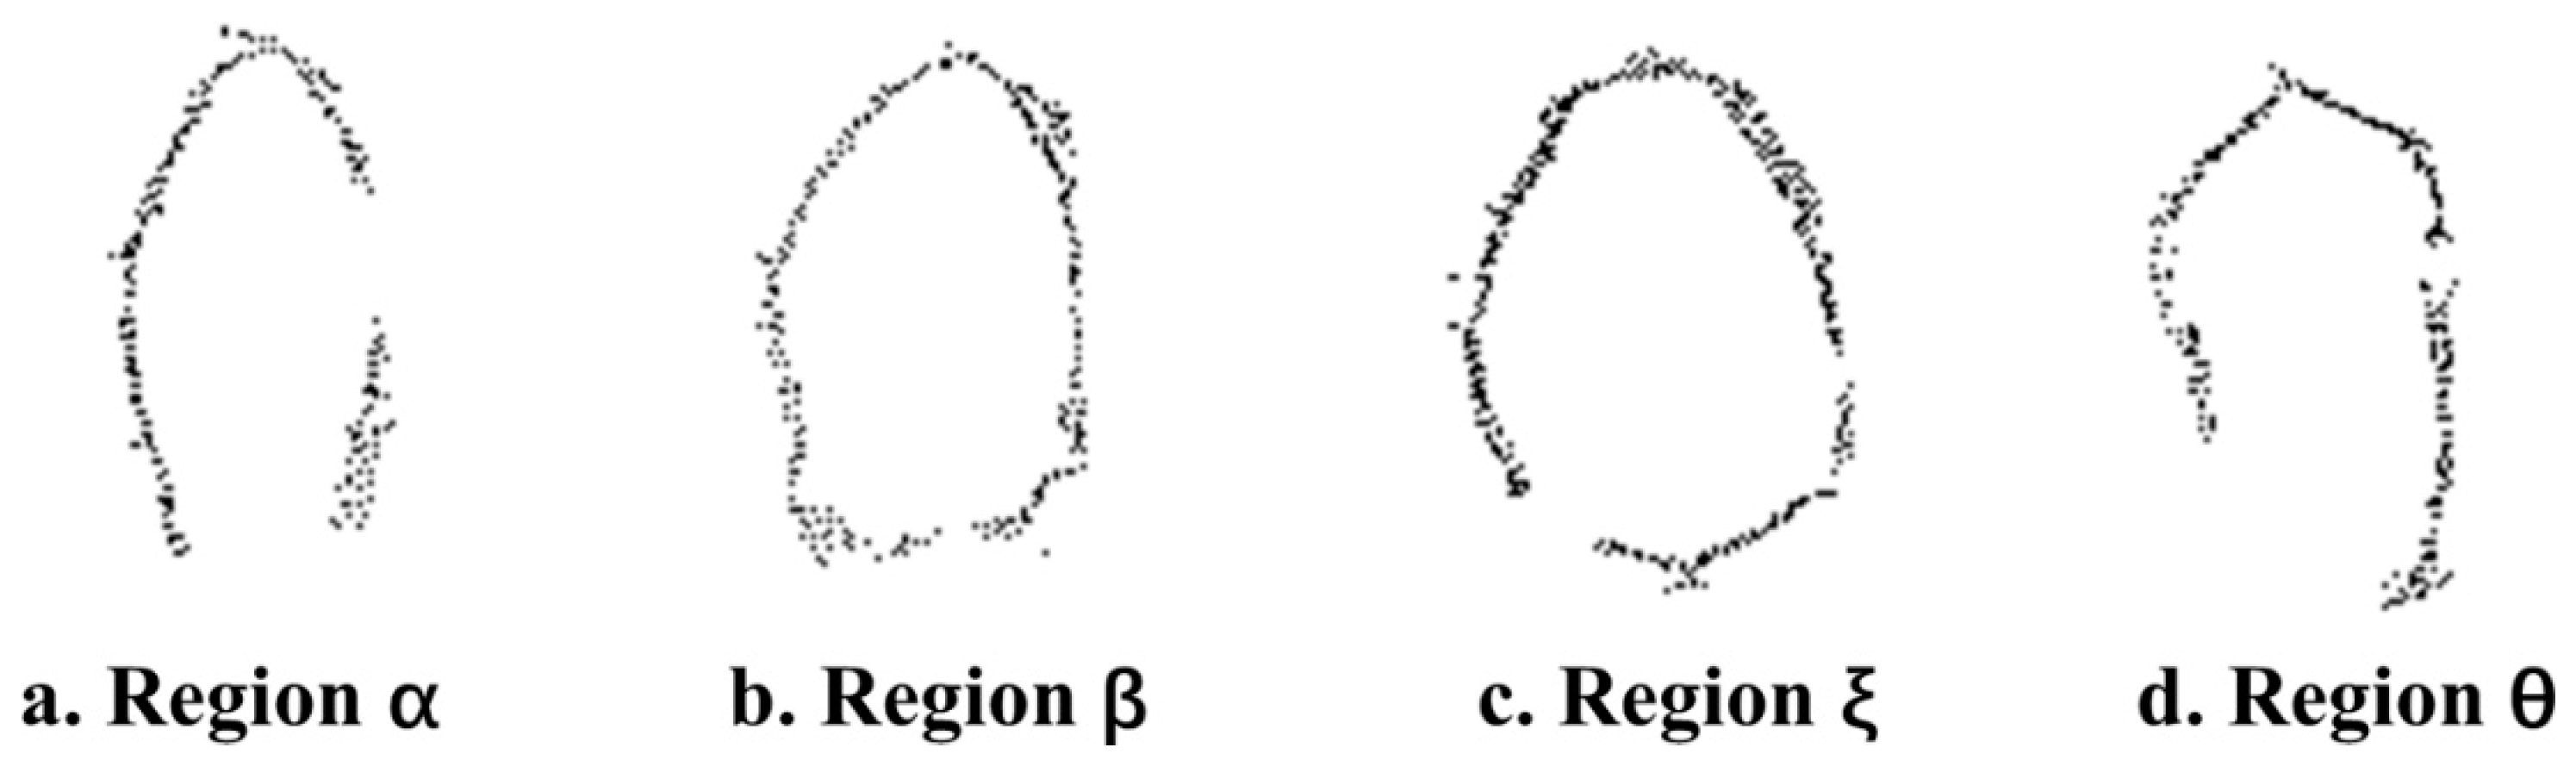
2.5.3. Extraction of Key Regions

Slices A, B1, and B2 were further segmented by slice D. The upper halves of A, B1, and B2 were extracted as the core regions for body dimension calculation, namely region α (shoulder), region β (chest), and region θ (buttock). Slice C itself was recorded as region ξ assigned to the abdomen. The results of key region extraction are highlighted by the yellow lines in Figure 13.

2.6. Extraction of the Key Regions for Body Dimension Calculation

The body dimensions, such as the body oblique length, body width, wither height, chest girth, and abdominal girth, can be automatically calculated based on the extracted key regions.

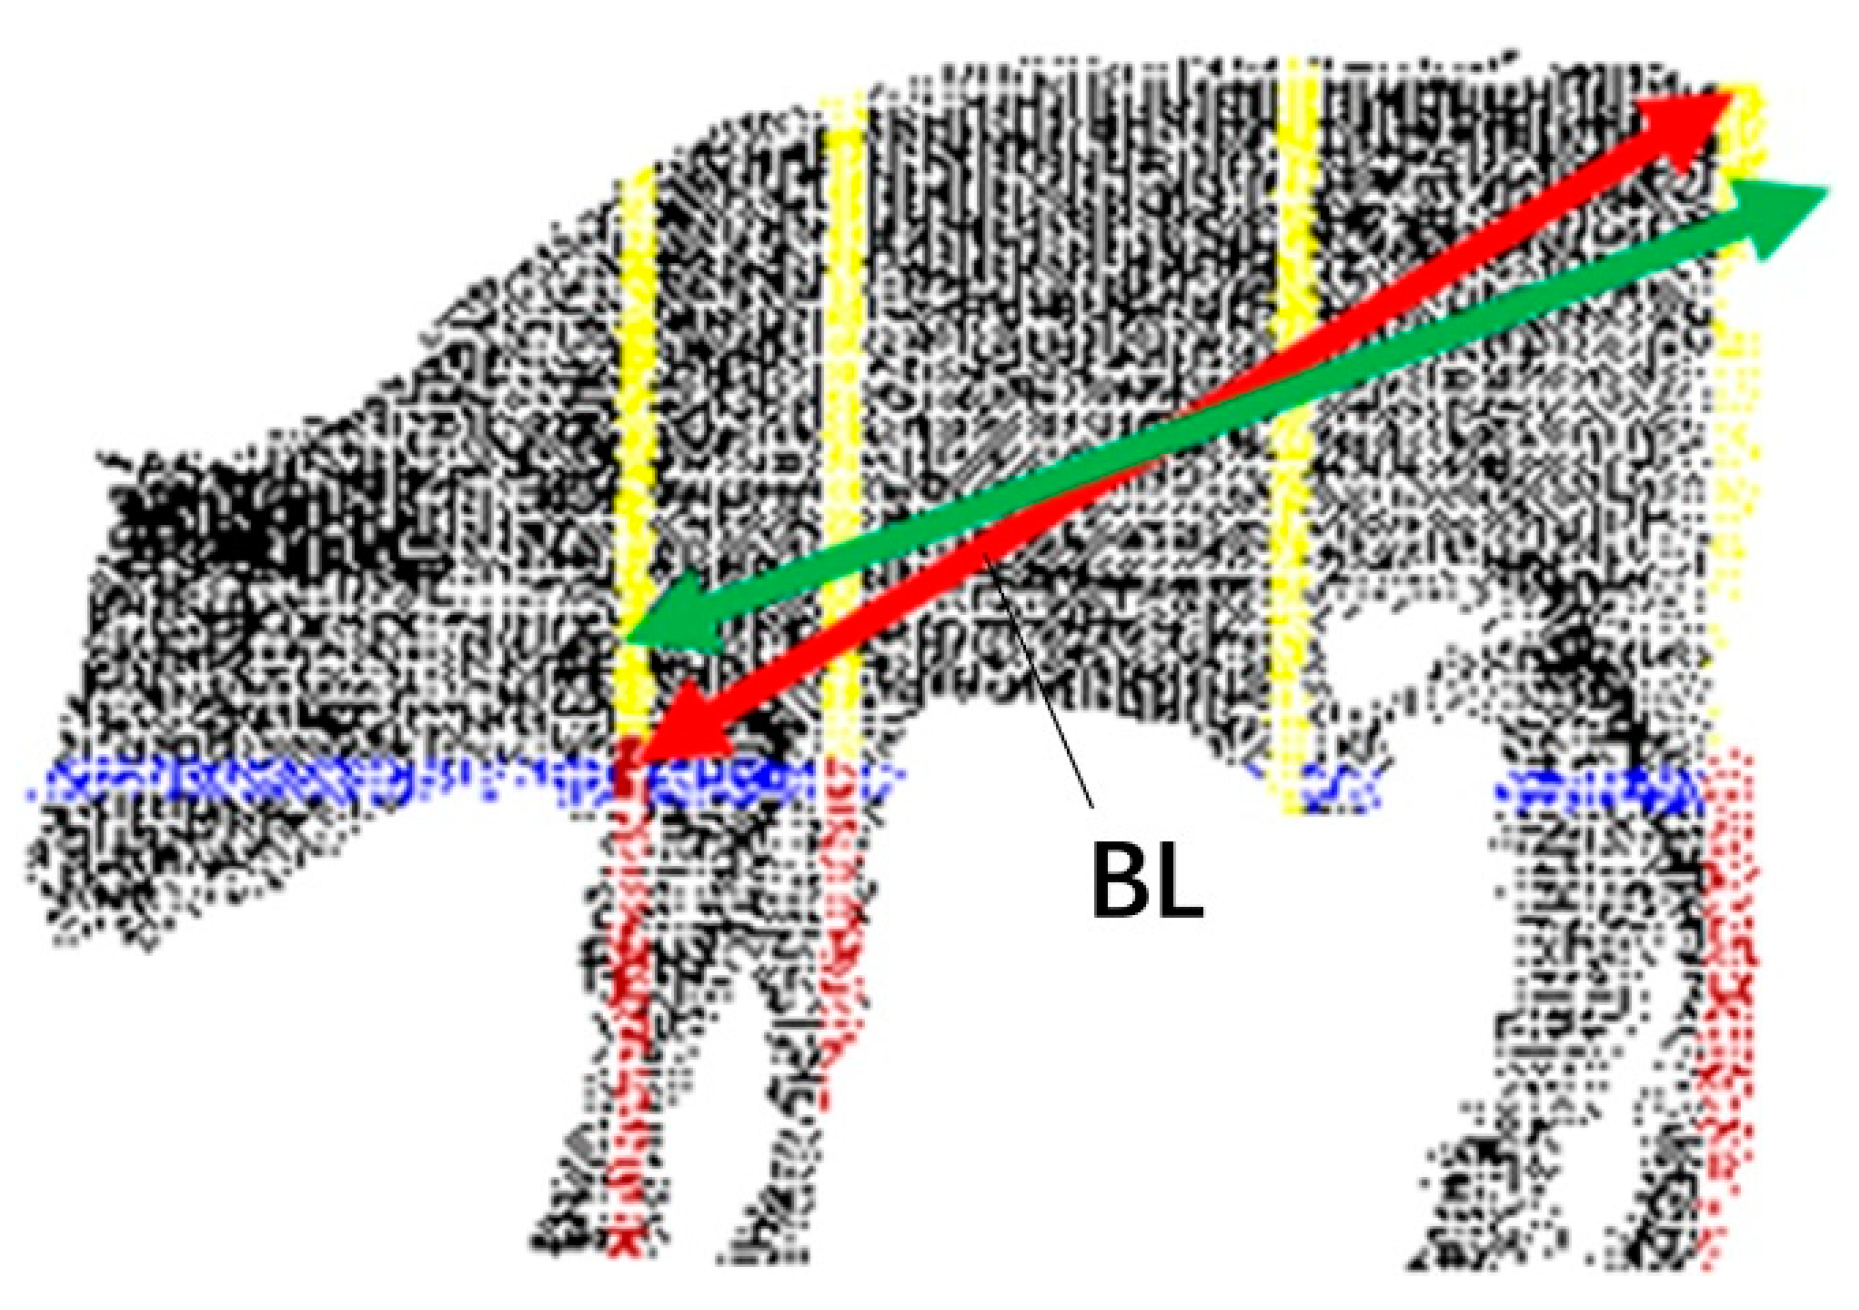
2.6.1. Body Oblique Length
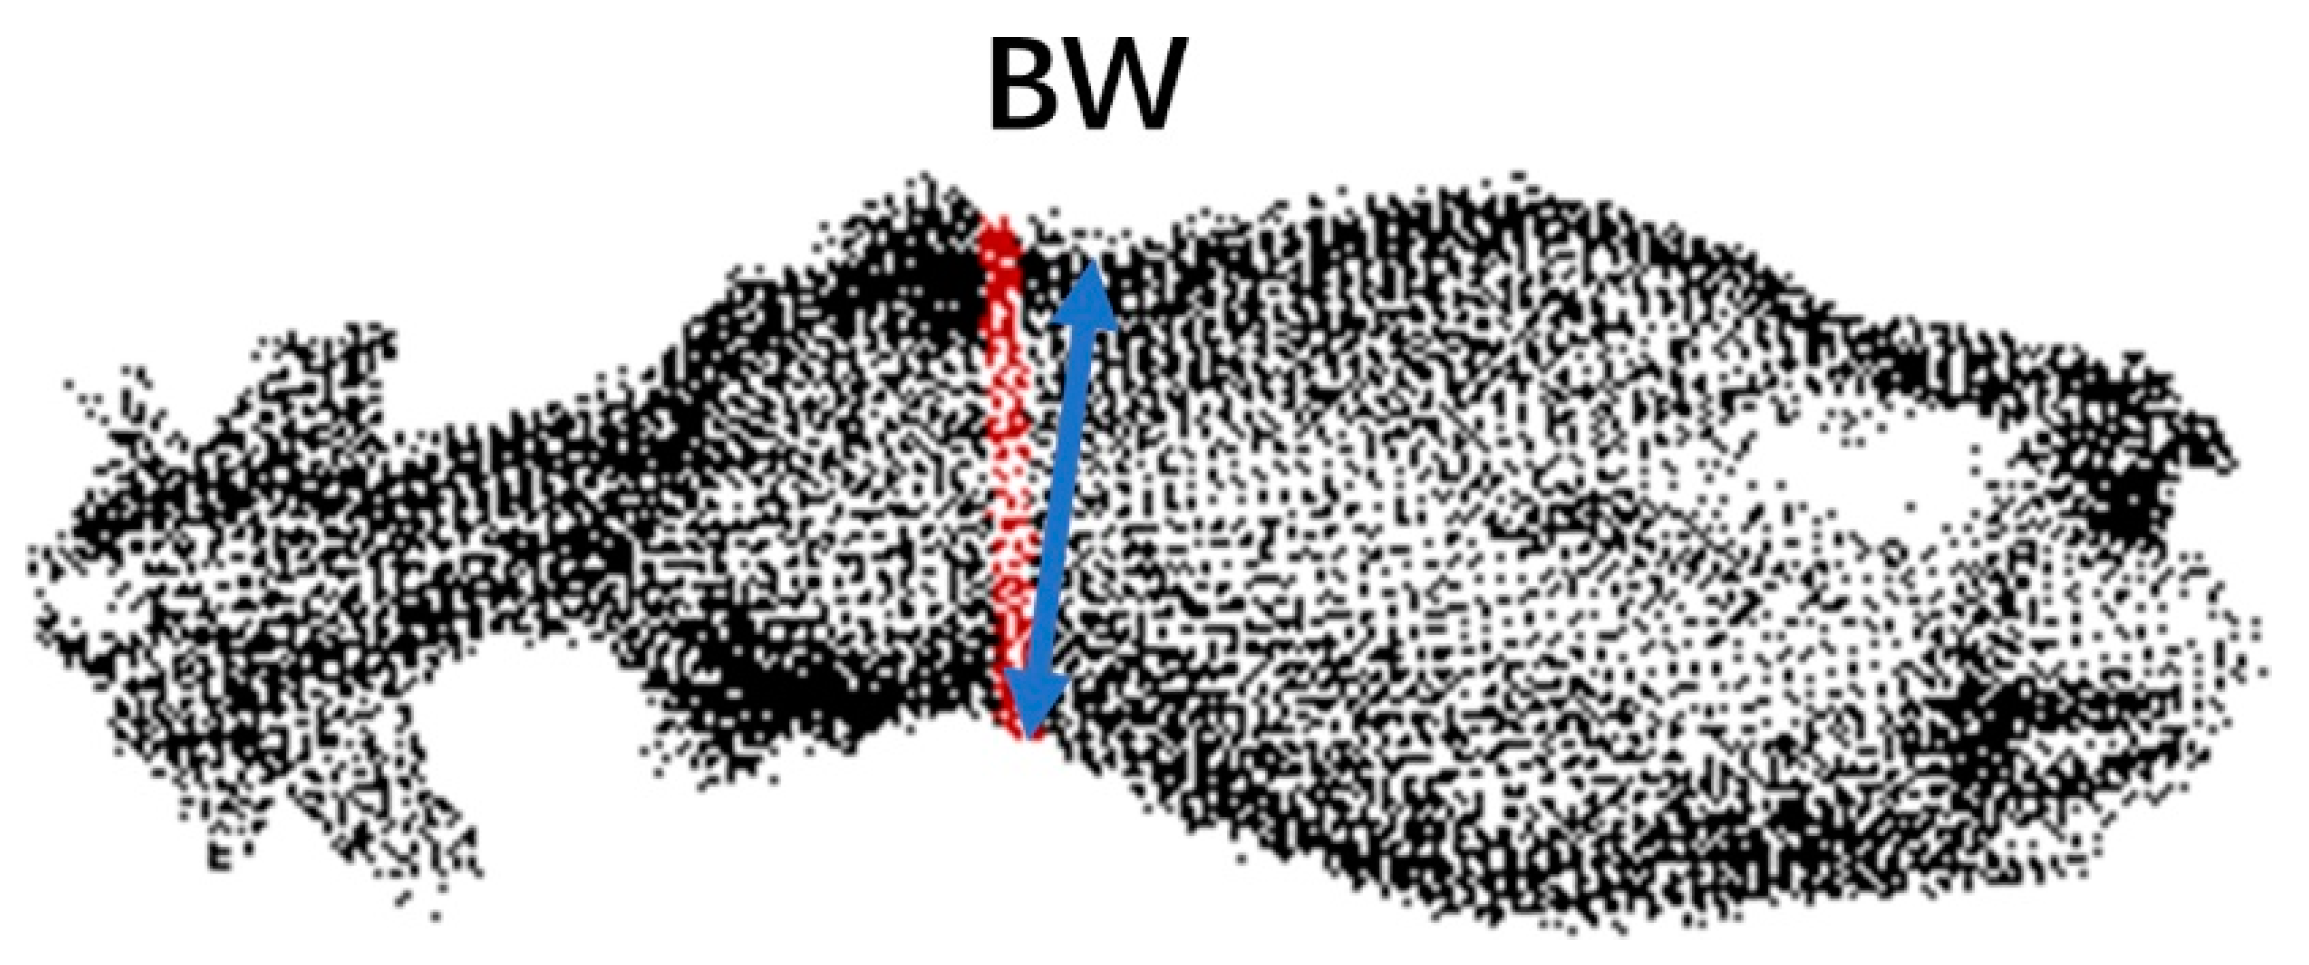
The beef cattle point clouds were projected onto the y–z plane along the x-axis direction. After projection, point Q with the minimum z-coordinate value and point R with the maximum z-coordinate value were extracted in region α and region θ, respectively. The body oblique length (BL) was then calculated from Equation (2), where R.y and R.z are the y- and z-coordinate values of point R, while Q.y and Q.z are the y- and z-coordinate values of point Q.
B L = ( R . y Q . y ) 2 + ( R . z Q . z ) 2

2.6.2. Body Width

According to the definition, the body width was measured using the region β. Region β was projected onto the x–y plane along the z-axis direction. The maximum span value of the x-coordinate in region β was considered as the body width value of the beef cattle, and the corresponding calculation position is marked by the red arrow in Figure 14.

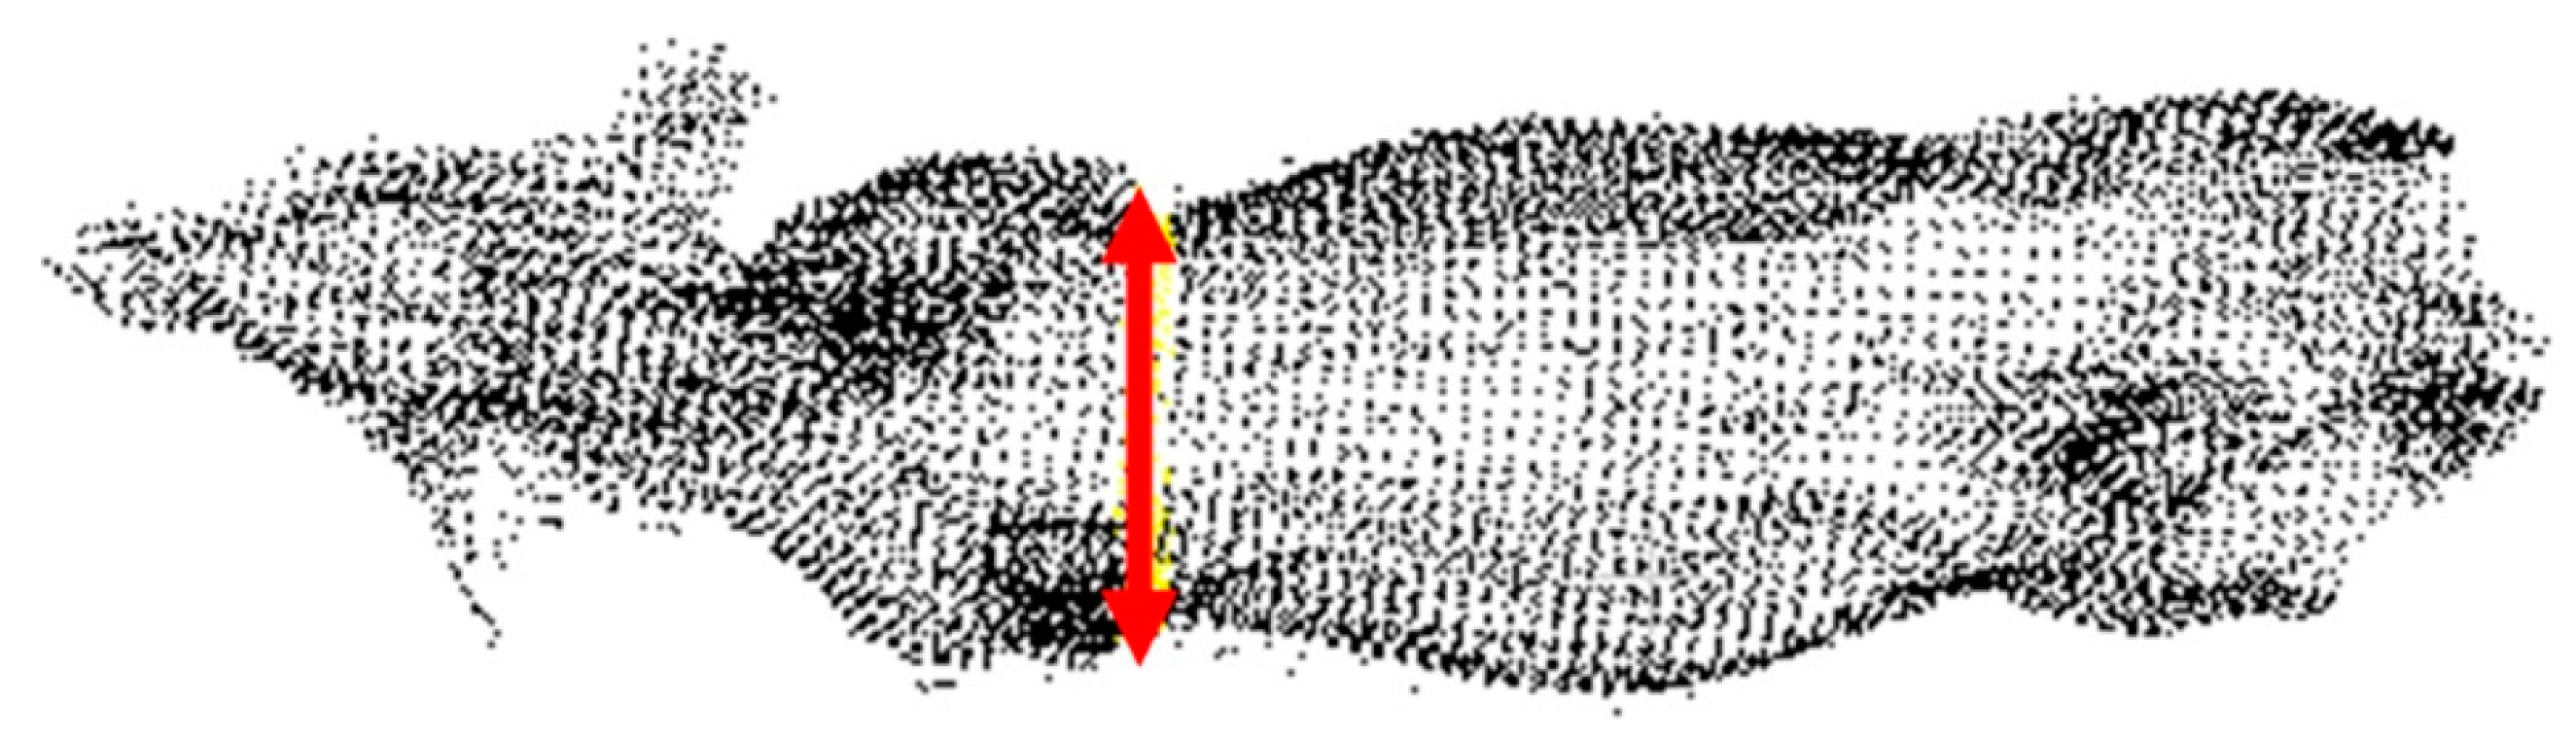
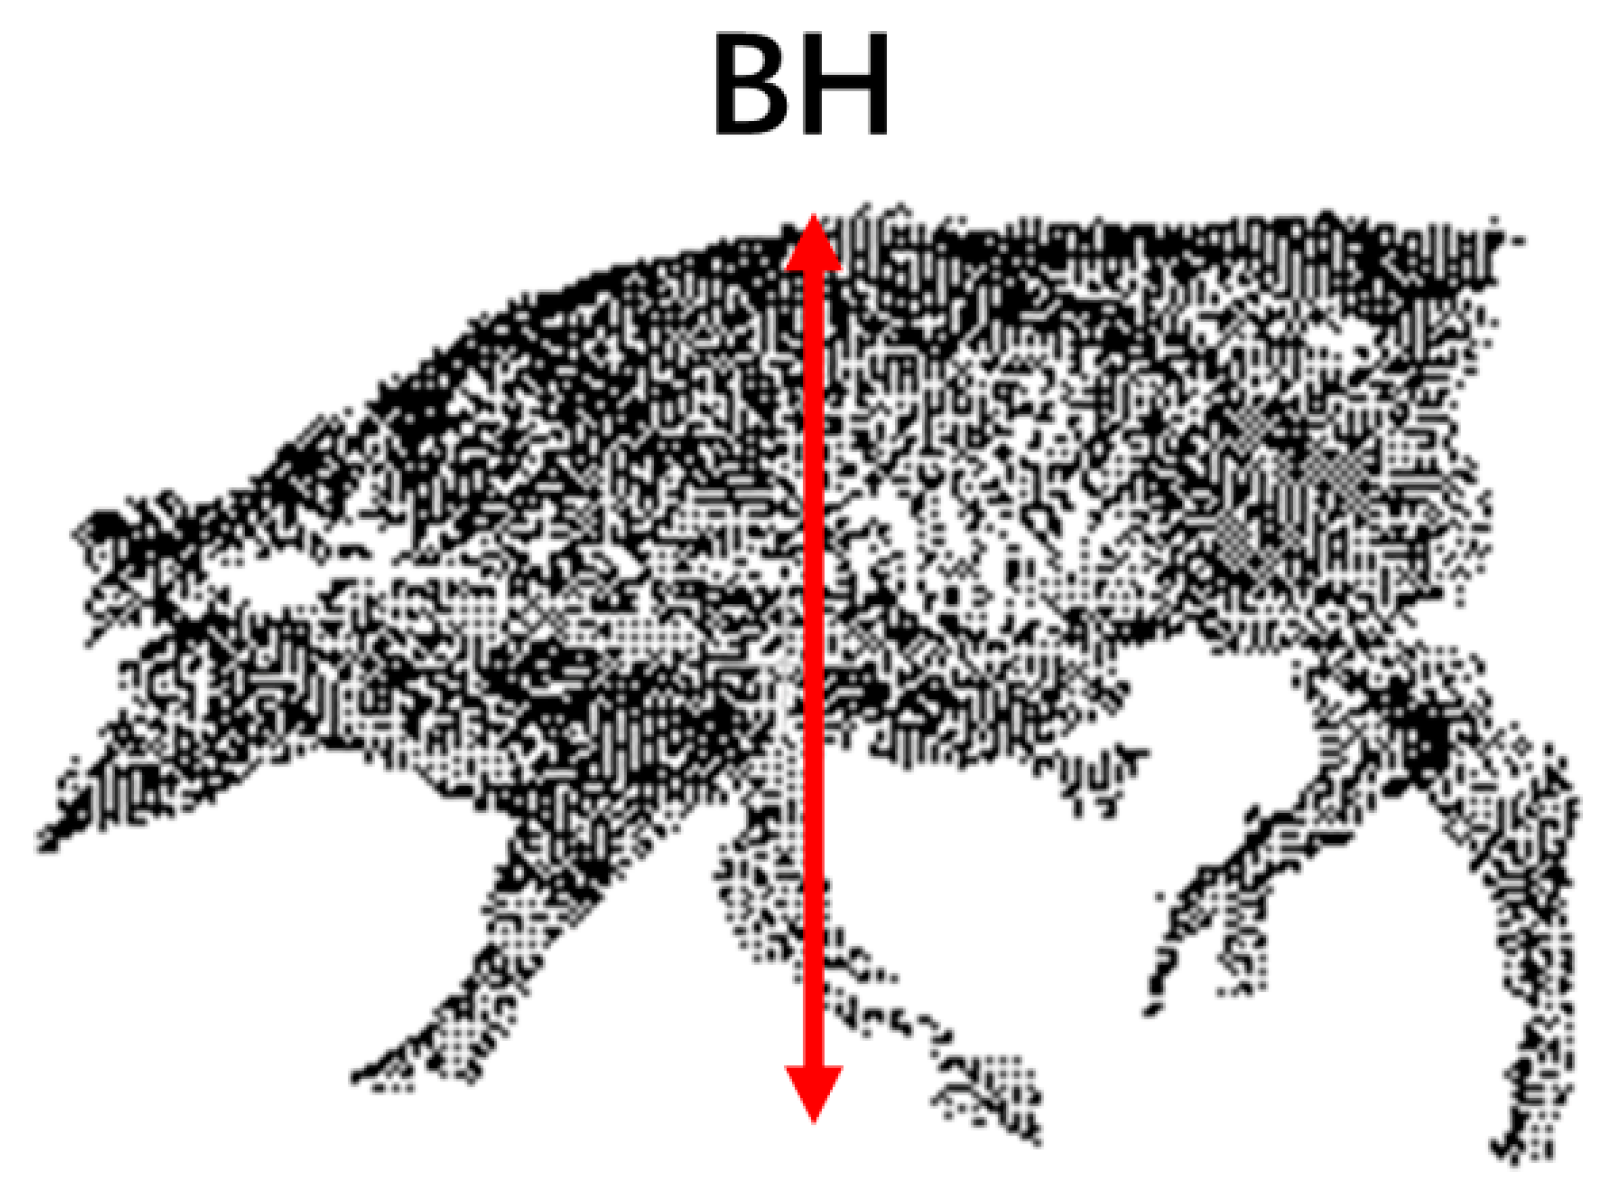
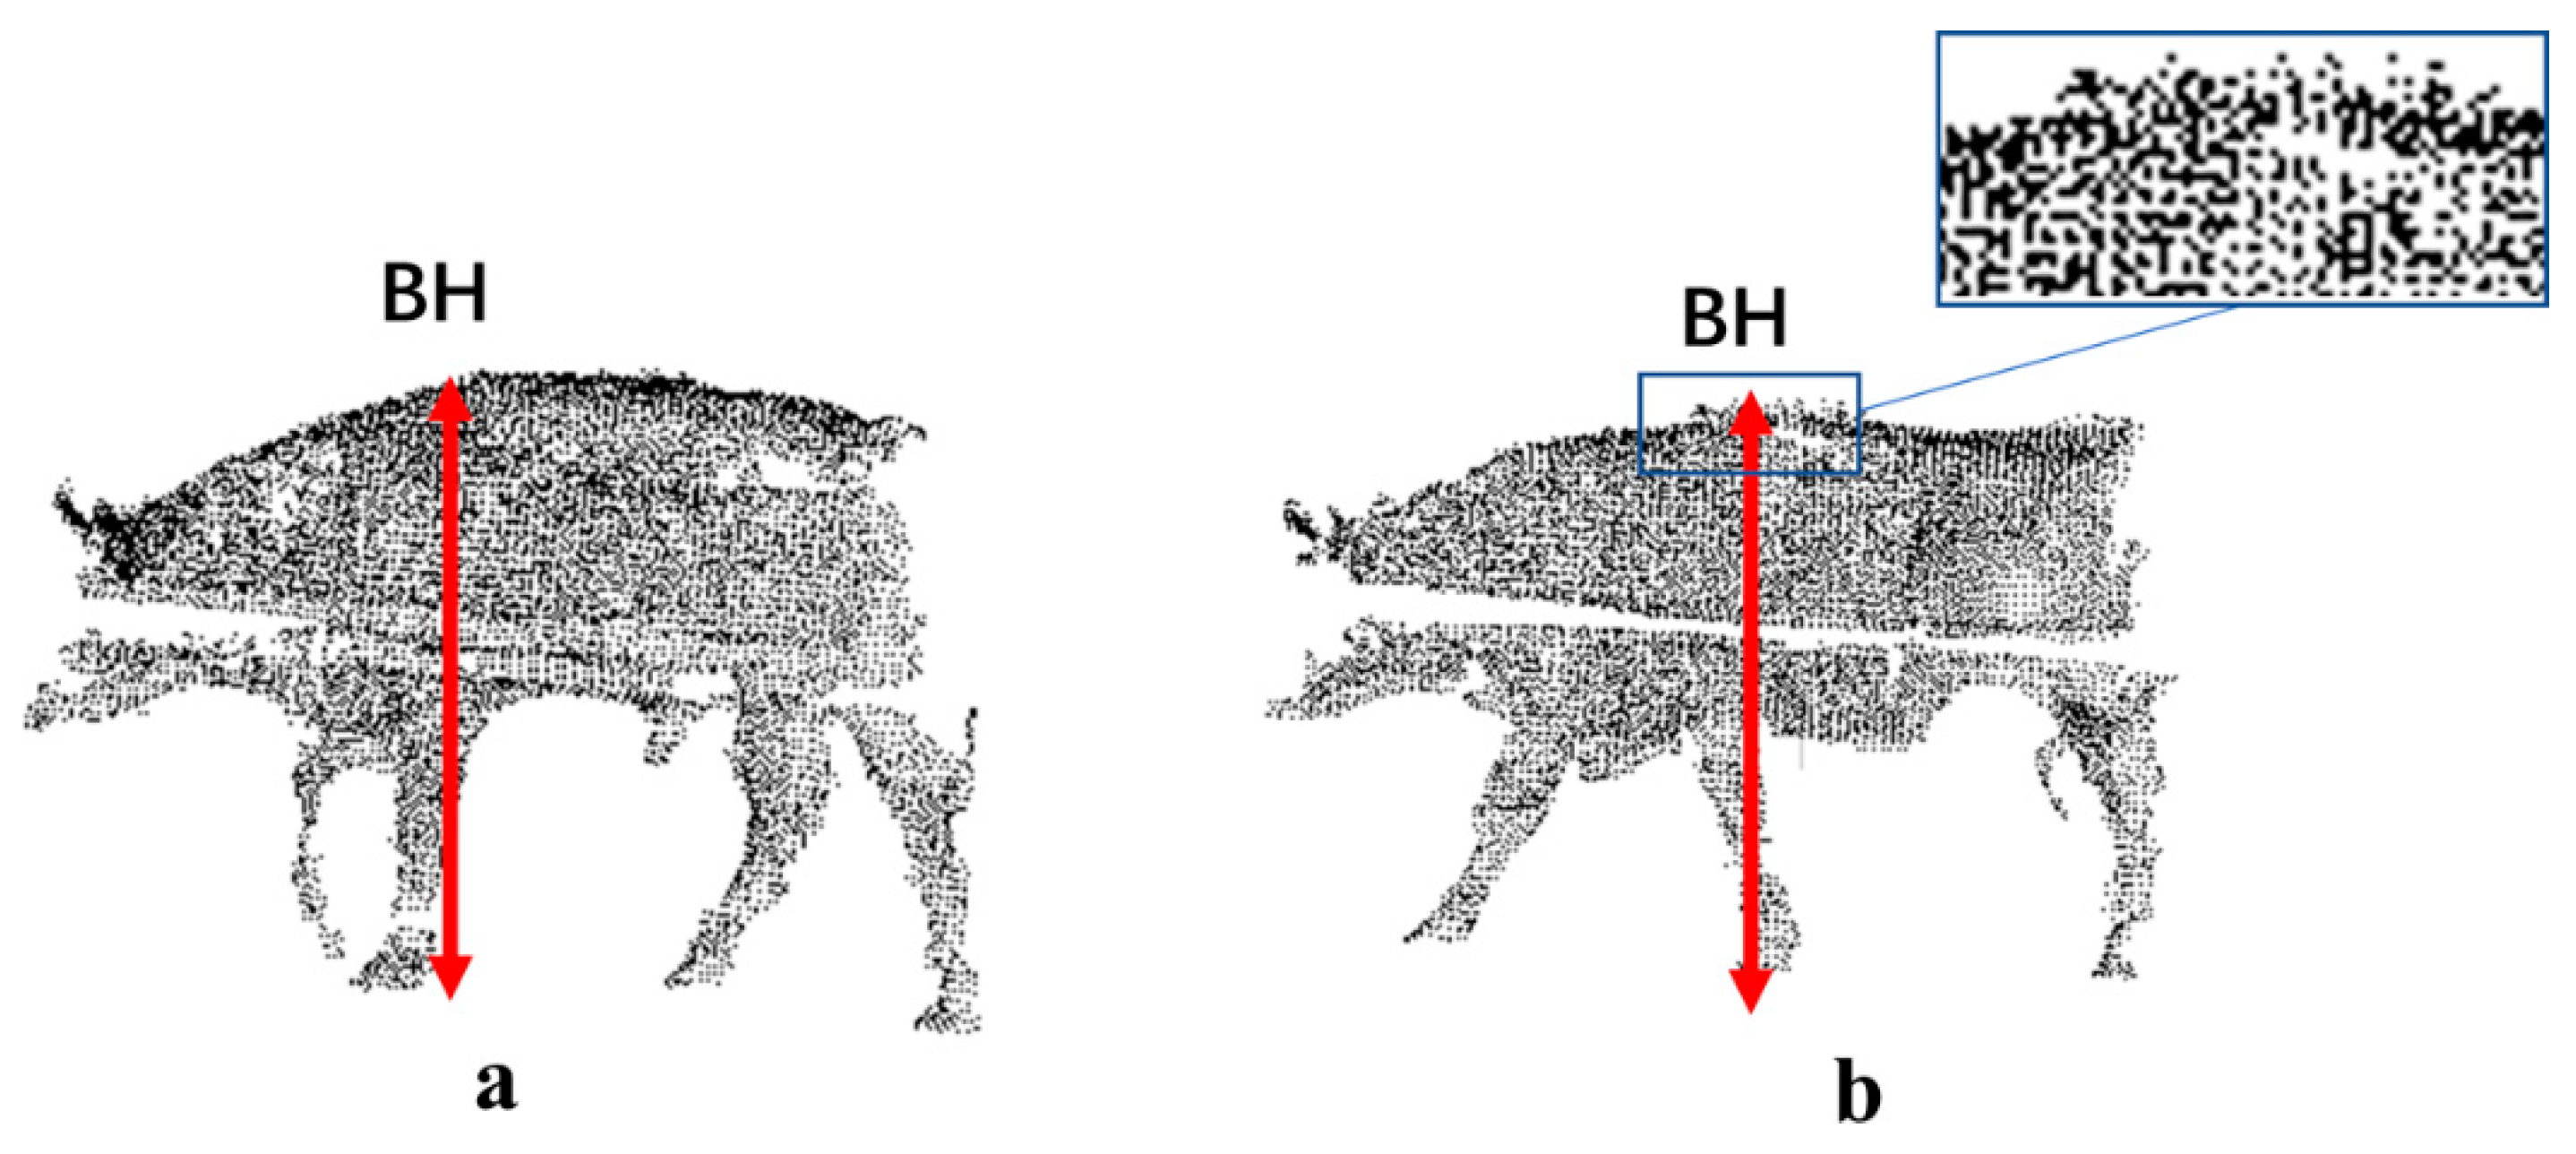
2.6.3. Wither Height

Assuming that the point with the minimum z-coordinate value in the beef cattle point clouds is recorded as K and the point with the maximum z-coordinate value in region β is recorded as T, the wither height (BH) can be then calculated from Equation (3), where T.z and K.z are the z-coordinate values of T and K, respectively.
B H = T . z K . z

2.6.4. Chest and Abdominal Girth

The chest and abdominal girth were calculated based on regions β and ξ, respectively. The targeted point clouds were projected onto the x–z plane along the y-axis direction. The projected point clouds were fitted by the six-point circular ellipse fitting algorithm [27], and the chest girth (BC) and abdominal girth (BS) can be derived from G, where G is the circumference of the chest/abdominal fitted ellipse, and r and R are the minor and major axis lengths of the chest/abdominal fitted ellipse, respectively.
G = 4 [ ( R + r ) ( 4 π ) R r R + r ]

3. Results

In this work, 182 sets of point clouds were collected from 10 beef cattle with different postures, where key regions were extracted for body dimension calculation. In addition, the accuracy and robustness of the proposed algorithm were evaluated.

3.1. Results of Locating Key Regions

The extraction of key regions plays an important role in body dimension calculation. Representative results of key region extraction are shown in Figure 15. The slices can reflect the body dimensions well, despite the presence of an incoherent distribution. For example, region α is the upper half of the front edge of the foreleg, clearly describing the position of the shoulder end. Meanwhile, the lower edge of region α is the starting point for body oblique length measurement. Region β reflects the characteristics of the wither, which is key to the measurement of wither height, chest girth, and body width. Region θ is the slice with the maximum z-axis span in the beef cattle torso, which can be approximately regarded as the abdomen position for circumference estimation. Region ξ is the rear edge of the hind leg, which is very close to the buttocks and tail. Restricted by the quality of the available data, the hip region is incomplete to some extent. However, the point with the maximum z-coordinate value approaches the endpoint of the ischium, which can be used for oblique body length measurement.

3.2. Body Measurement Results

The group of beef cattle were numbered from 1 to 10 in ascending order, from which 24, 16, 19, 26, 14, 22, 20, 11, 18, and 12 sets of point clouds were collected, respectively, resulting in 182 sets of point clouds. The body dimensions for each animal were also manually measured for comparison. The results of both manual and automatic measurements are shown in Table 2. Notably, the automatic measurement data and corresponding errors represent the average values of several rounds of calculation. The body width calculation shows the highest accuracy, with a total average error of 1.6%. However, the average measurement errors of body oblique length, wither height, chest girth, and abdominal girth are 2.3%, 2.8%, 2.8%, and 2.6%, respectively, which indicates that the proposed algorithm shows a significant degree of robustness.
Figure 16 shows the error distribution of each body dimension. The error distributions of the body oblique length, body width, and wither height were relatively stable for automatic measurement, and were evenly distributed on both sides of the manually measured values. However, the girth value obtained by automatic calculation was larger than that measured manually. If multiple measurements are averaged for the same animal, the error can be further reduced to within a 3% range. However, for a single measurement, the maximum error can reach 6–7%.
Generally, the beef cattle body dimensions can be preliminarily calculated via this system in the real production environment. The obtained data are stable and reliable. For practical applications, the same animal can be required to pass through the measurement system several times within a short time interval (1 day or more), and thereby the accuracy can be improved by averaging the values obtained from multiple measurements.

4. Discussion

As the different postures of beef cattle had a negative influence on the measurement results, the specific situations are discussed in detail.

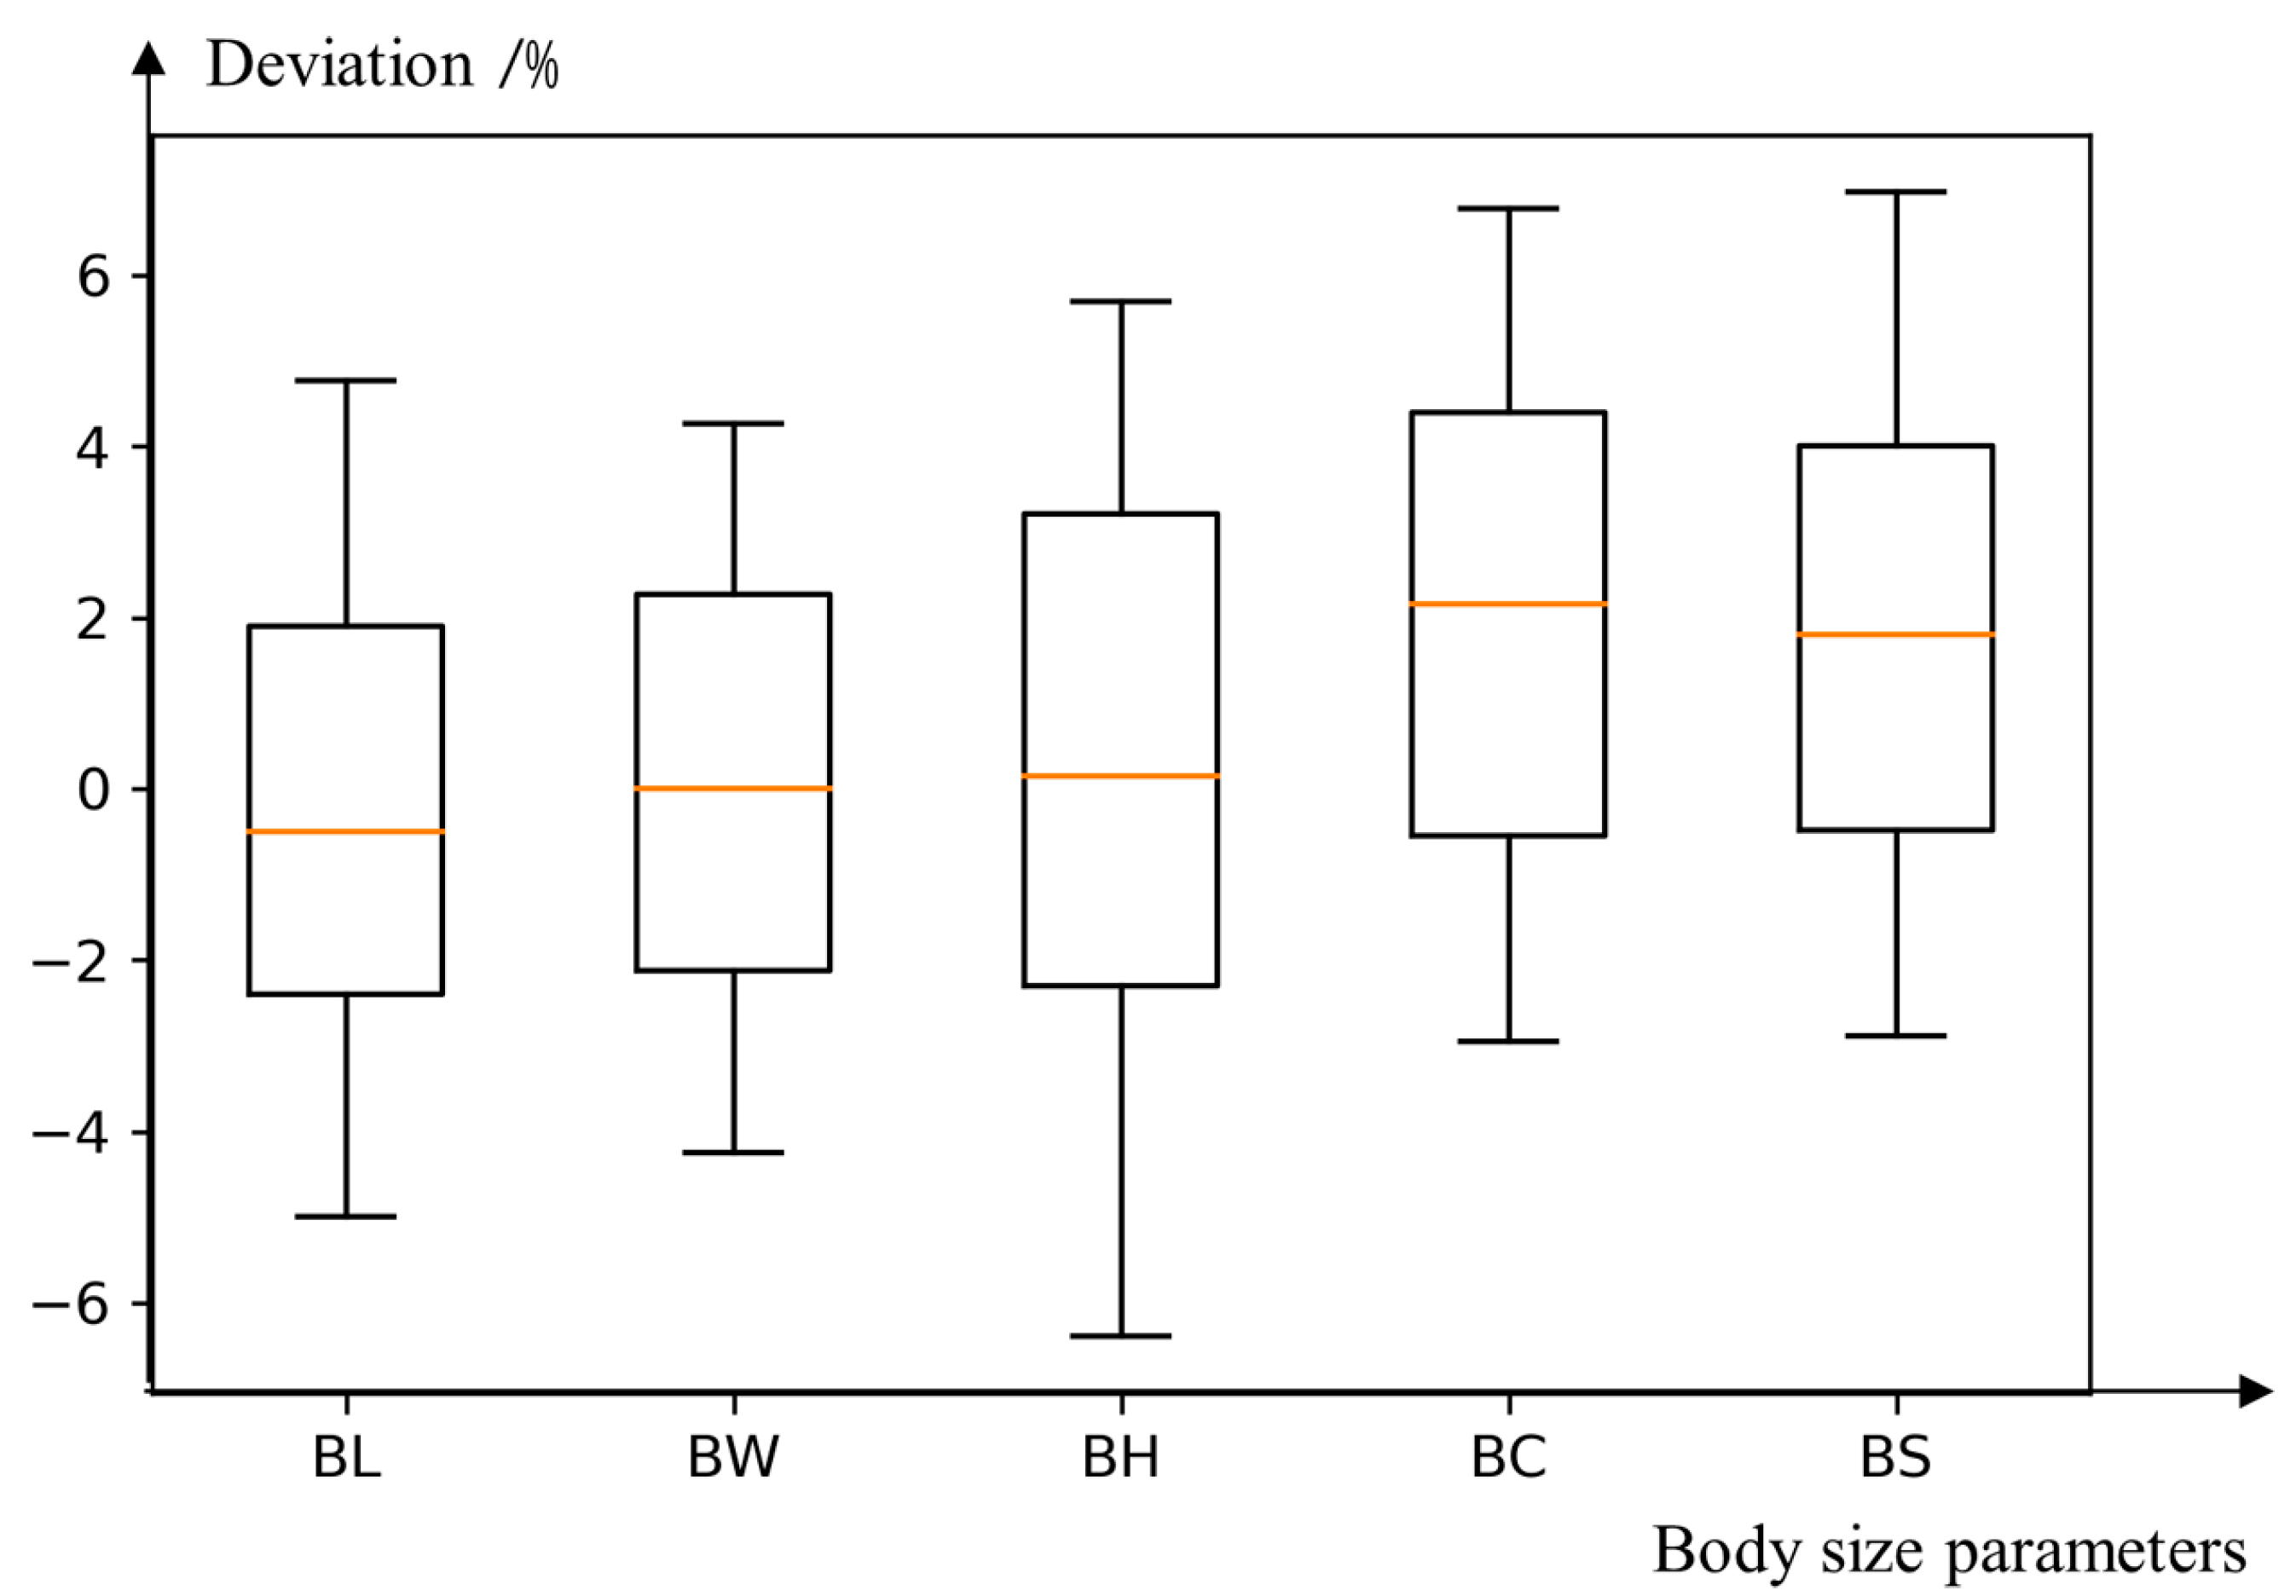
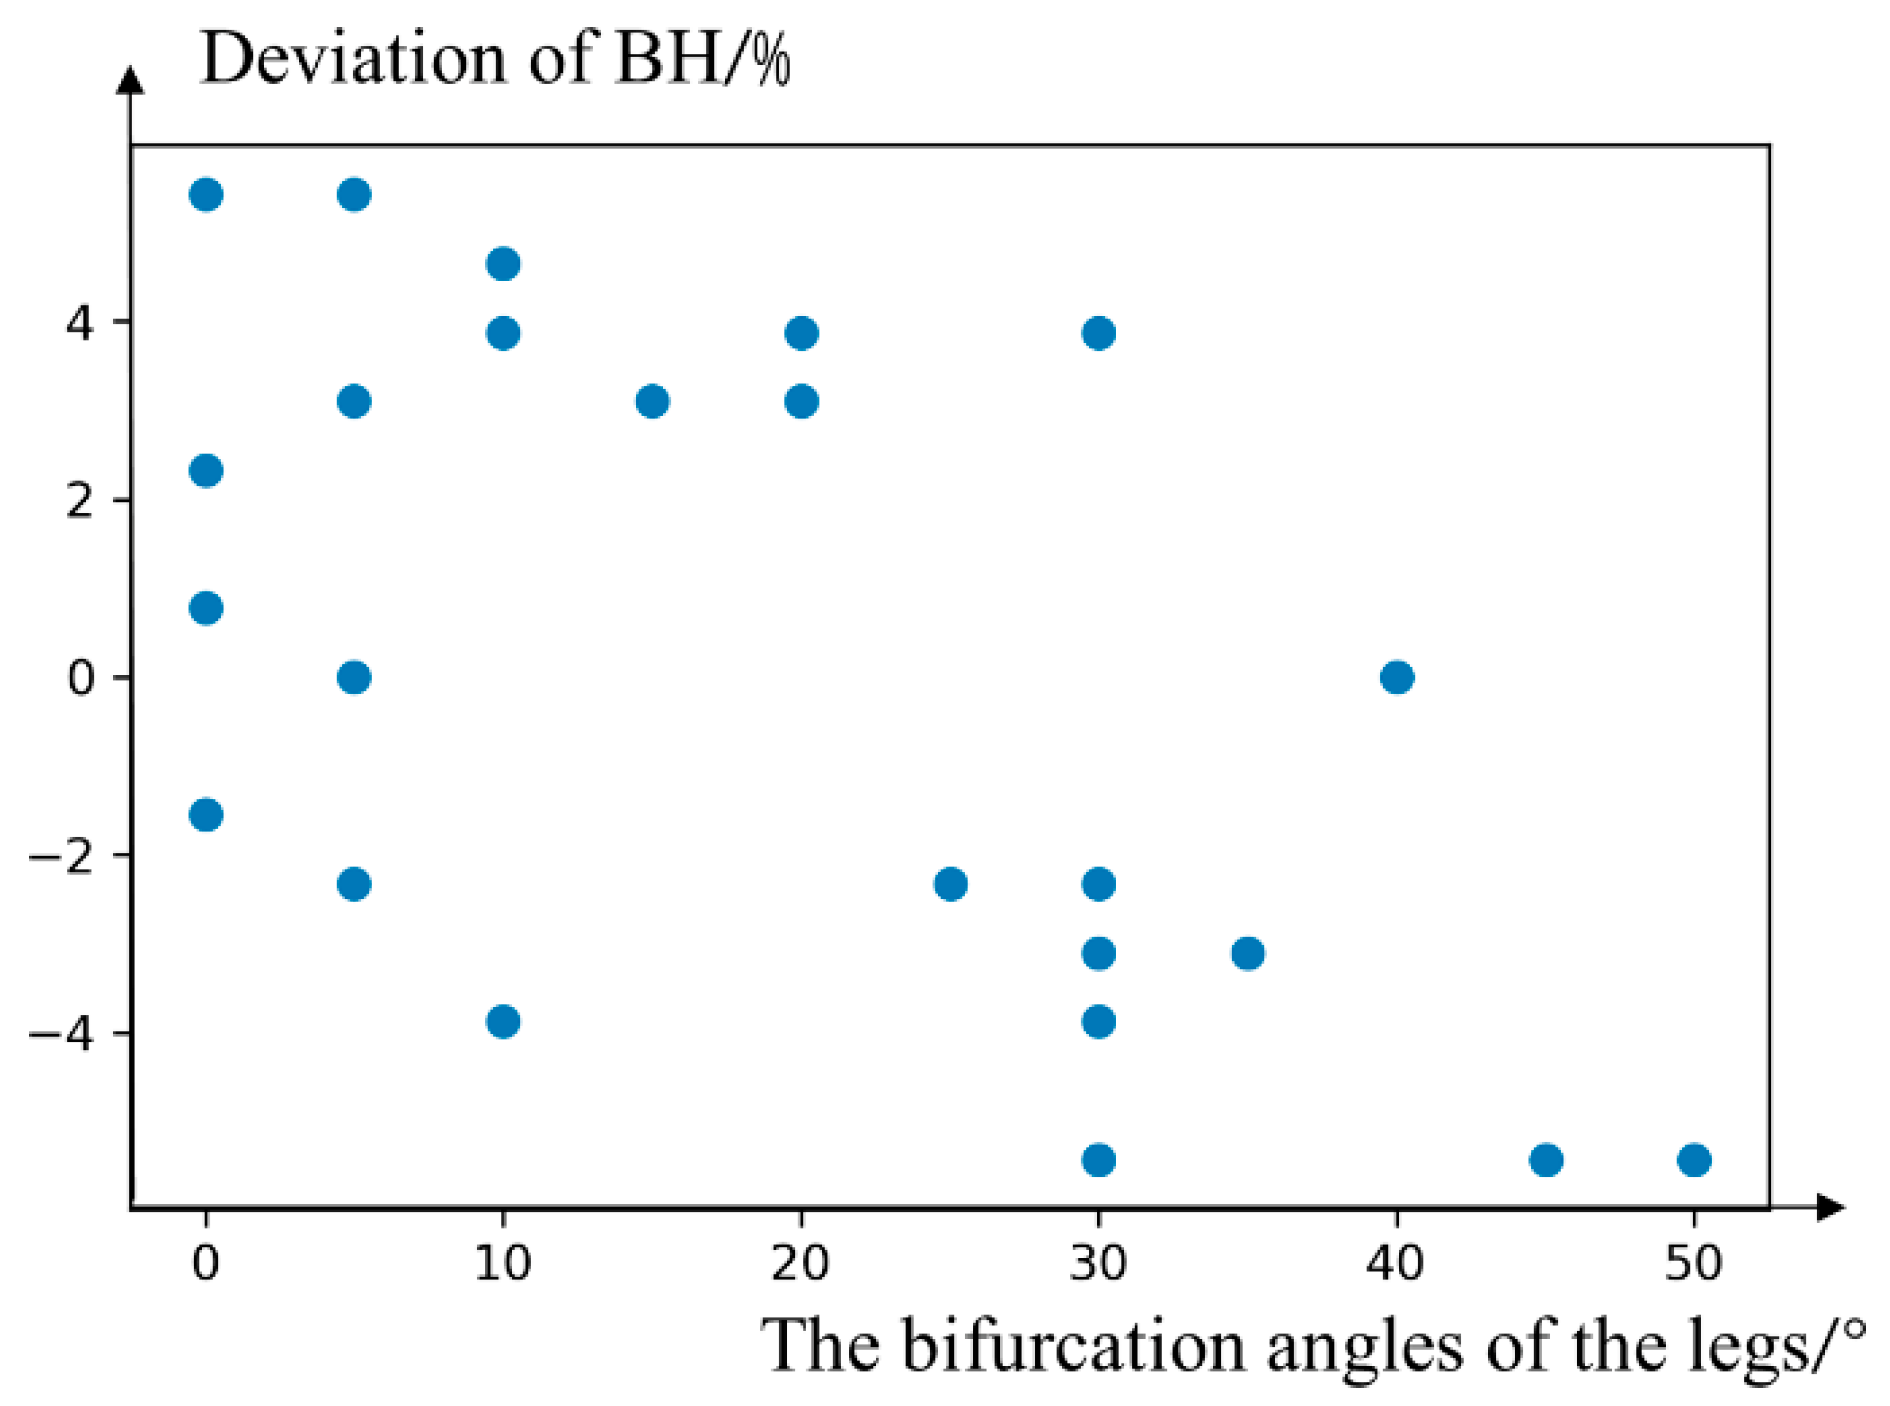
4.1. The Error Analysis of Body Width

Overall, the body width calculation showed high accuracy with relatively small errors, but there were still exceptions whose error was around 4%. The reasons were complex and mostly related to the posture, positioning, morphology, and flexibility of the beef cattle body. On one hand, the beef cattle might be too close to the railing while walking through. In this circumstance, the chest region can overlap with the railing gap, resulting in a loss of data in the x–y plane, which leads to smaller measurement values. On the other hand, there may be some distortions in the beef cattle body, and thus the plane tangent to the principal direction of the beef cattle cannot be accurately extracted. As Figure 17 shows, the accurate line for body width measurement is marked by the blue arrow. However, due to the distorted posture of the beef cattle, the algorithm will misidentify the red line as the measurement line, thereby resulting in larger body width values.

4.2. The Error Analysis of Wither Height

The wither height is usually considered “linear”, and its measurement error is expected to be similar to those of chest girth and abdominal girth. Nevertheless, the error of wither height occasionally exceeded that of the circumference parameters. This abnormal result could be attributed to the differences in height caused by the various postures of the walking beef cattle. Therefore, the bifurcation angles of the forelegs (θ) and hind legs (μ) were averaged in the y–z plane of the beef cattle point clouds artificially, which was used to evaluate the effects of different postures on the wither height values. The extraction of the bifurcation angles is displayed in Figure 18.
To determine the relationship between the bifurcation angles and the errors of wither height, 26 sets of point clouds collected from the same animal (No. 4) were selected for further analysis. In each point cloud, the errors of the bifurcation angle and wither height were extracted and displayed in a scatter plot, as shown in Figure 19.
As Figure 19 shows, a larger bifurcation angle was generated when the calculated wither height was significantly smaller than the real value, which indicated that the leg crossover can lead to reduction in wither height (Figure 20).
There were two main reasons for the enlarged wither height. When an animal walked with an arched back, the measurement point of the wither height could be raised (Figure 21a). Furthermore, the upper part of region β showed obvious hair lift, which could be misidentified by the algorithm, thereby resulting in a large wither height value (Figure 21b). However, the current data were inadequate to support the quantification of wither height calibration, and hence the statistical regularity needs to be investigated in the future.

4.3. The Error Analysis of Body Oblique Length

The biological definition of beef cattle body oblique length was “the straight-line length from the front edge of shoulder end to the outer edge of the ischial end”, and these two positions were not easily distinguished and thus were difficult to locate in the beef cattle point clouds (indicated by the green arrows in Figure 22). In this work, the lower vertex of the α region and the upper vertex of the β region were selected as the starting and ending points of the measurement (indicated by the red arrow in Figure 22). As Figure 22 shows, the green arrow represents the standard calculation line of body oblique length, and the red arrow represents the alternative calculation line of body oblique length extracted by the proposed algorithm. For beef cattle with a regular body shape, the alternative calculation line was quite similar to the standard calculation line. However, when the beef cattle had a “slender” body shape (the y-coordinate span is large, and the chest and abdomen girth are small), the calculated values will be lower and vice versa. Similarly, the calculation error of body oblique length will also be larger for a walking animal (Figure 20).

4.4. The Error Analysis of Chest and Abdomen Girth

The chest and abdominal girth showed the largest measurement errors among different body dimensions, and the measured values were consistently larger than the real values. Similar to the body width measurement, the extracted slices were not completely tangent to the principal direction when the beef cattle body was distorted, thereby leading to large calculation values. Moreover, unstable ellipse fitting could be revealed when the slices are incomplete, which may cause random deviations. In addition, the ellipse fitting cannot accurately restore the enclosing curves of the chest and abdomen, which will generate slight deviations. In the near future, we plan to apply specific methods such as curvature estimation and integration to further improve the accuracy of this measurement.

5. Conclusions

A method for key region extraction and body dimension measurement was proposed for the reconstructed 3D point cloud data of beef cattle, and the automatic measurement method of body dimensions is based on the 3D region features of point clouds. This method is also applicable to incomplete point clouds, and the method is predominantly invariable to different animal postures, thereby demonstrating a degree of theoretical research value and practical application significance.
(1)
Based on the span distribution curve of continuous slices, a method for identifying the position and boundary of the leg region was proposed, and a method for key region extraction in the leg region was proposed to calculate the body dimensions. The shoulder, chest, abdomen, and buttock regions were accurately identified and extracted.
(2)
Based on the features of the key regions, the body oblique length, wither height, body width, chest girth, and abdominal girth were calculated, and the average measurement errors were 2.3%, 2.8%, 1.6%, 2.8%, and 2.6%, respectively. Compared with the method based on the “point” features, this method, focusing on the “region” features, is more suitable to deal with incomplete point clouds and poses limited requirements regarding animal postures, which shows its higher robustness.

Author Contributions

Conceptualization, J.L., Q.L. and W.M.; methodology, J.L., W.M. and Q.L.; software, J.L.; investigation, J.L. and X.X.; resources, W.M.; data curation, W.M. and J.L.; writing—original draft preparation, J.L.; writing—review and editing, D.T. and S.X.Y.; visualization, J.L.; supervision, C.Z. and W.M.; project administration, W.M.; funding acquisition, Q.L. All authors have read and agreed to the published version of the manuscript.

Funding

This research was funded by the National Key R&D Program of China (CN) (Funding Number: 2018YFE0108500).

Institutional Review Board Statement

The animal study protocol was approved by the Laboratory Animal Welfare and Animal Ethics Review Committee of China Agricultural University (Approval Number: AW30111202-5-1).

Data Availability Statement

The data presented in this study are available on request from the corresponding author.

Acknowledgments

The authors are grateful for the great support of Xunchi Youniu farm (Gulang County, Wuwei City, Gansu Province, China).

Conflicts of Interest

The authors declare no conflict of interest.

References

  1. Malafaia, G.C.; Mores, G.D.V.; Casagranda, Y.G.; Barcellos, J.O.J.; Costa, F.P. The Brazilian beef cattle supply chain in the next decades. Livest. Sci. 2021, 253, 104704. [Google Scholar] [CrossRef]
  2. Cominotte, A.; Fernandes, A.F.A.; Dorea, J.R.R.; Rosa, G.J.M.; Ladeira, M.M.; van Cleef, E.H.C.B.; Pereira, G.L.; Baldassini, W.A.; Neto, O.R.M. Automated computer vision system to predict body weight and average daily gain in beef cattle during growing and finishing phases. Livest. Sci. 2020, 232, 103904. [Google Scholar] [CrossRef]
  3. Yao, Z.; Li, J.; Zhang, Z.; Chai, Y.; Liu, X.; Li, J.; Huang, Y.; Li, L.; Huang, W.; Yang, G.; et al. The relationship between MFN1 copy number variation and growth traits of beef cattle. Gene 2022, 811, 146071. [Google Scholar] [CrossRef] [PubMed]
  4. Rezagholivand, A.; Nikkhah, A.; Khabbazan, M.H.; Mokhtarzadeh, S.; Dehghan, M.; Mokhtabad, Y.; Sadighi, F.; Safari, F.; Rajaee, A. Feedlot performance, carcass characteristics and economic profits in four Holstein-beef crosses compared with pure-bred Holstein cattle. Livest. Sci. 2021, 244, 104358. [Google Scholar] [CrossRef]
  5. Nguyen, D.V.; Nguyen, O.C.; Malau-Aduli, A.E.O. Main regulatory factors of marbling level in beef cattle. Vet. Anim. Sci. 2021, 14, 100219. [Google Scholar] [CrossRef]
  6. Imaz, J.A.; Garcia, S.; González, L.A. Using automated in-paddock weighing to evaluate the impact of intervals between liveweight measures on growth rate calculations in grazing beef cattle. Comput. Electron. Agric. 2020, 178, 105729. [Google Scholar] [CrossRef]
  7. Ouédraogo, D.; Soudré, A.; Ouédraogo-Koné, S.; Zoma, B.L.; Yougbaré, B.; Khayatzadeh, N.; Burger, P.A.; Mészáros, G.; Traoré, A.; Mwai, O.A.; et al. Breeding objectives and practices in three local cattle breed production systems in Burkina Faso with implication for the design of breeding programs. Livest. Sci. 2020, 232, 103910. [Google Scholar] [CrossRef]
  8. Petherick, J.C.; Doogan, V.J.; Venus, B.K.; Holroyd, R.G.; Olsson, P. Quality of handling and holding yard environment, and beef cattle temperament: 2. Consequences for stress and productivity. Appl. Anim. Behav. Sci. 2009, 120, 28–38. [Google Scholar] [CrossRef]
  9. Augspurger, N.R.; Ellis, M. Weighing affects short-term feeding patterns of growing-finishing pigs. Can. J. Anim. Sci. 2002, 82, 445–448. [Google Scholar] [CrossRef]
  10. Mehtiö, T.; Pitkänen, T.; Leino, A.-M.; Mäntysaari, E.A.; Kempe, R.; Negussie, E.; Lidauer, M.H. Genetic analyses of metabolic body weight, carcass weight and body conformation traits in Nordic dairy cattle. Animal 2021, 15, 100398. [Google Scholar] [CrossRef]
  11. Qiao, Y.; Kong, H.; Clark, C.; Lomax, S.; Su, D.; Eiffert, S.; Sukkarieh, S. Intelligent perception for cattle monitoring: A review for cattle identification, body condition score evaluation, and weight estimation. Comput. Electron. Agric. 2021, 185, 106143. [Google Scholar] [CrossRef]
  12. Ruchay, A.; Kober, V.; Dorofeev, K.; Kolpakov, V.; Miroshnikov, S. Accurate body measurement of live cattle using three depth cameras and non-rigid 3-D shape recovery. Comput. Electron. Agric. 2020, 179, 105821. [Google Scholar] [CrossRef]
  13. Kwon, K.; Mun, D. Iterative offset-based method for reconstructing a mesh model from the point cloud of a pig. Comput. Electron. Agric. 2022, 198, 106996. [Google Scholar] [CrossRef]
  14. Weber, V.A.D.M.; Weber, F.D.L.; Gomes, R.D.C.; Oliveira Junior, A.D.S.; Menezes, G.V.; Abreu, U.G.P.D.; de Souza Belete, N.A.; Pistori, H. Prediction of Girolando cattle weight by means of body measurements extracted from images. Rev. Bras. Zootec. 2020, 49. [Google Scholar] [CrossRef] [Green Version]
  15. Abramoff, M.D.; Magalhaes, P.J.; Ram, S.J. Image Processing with ImageJ. Biophotonics Int. 2004, 11, 36–42. [Google Scholar]
  16. Guo, H.; Ma, X.; Ma, Q.; Wang, K.; Su, W.; Zhu, D. LSSA_CAU: An interactive 3d point clouds analysis software for body measurement of livestock with similar forms of cows or pigs. Comput. Electron. Agric. 2017, 138, 60–68. [Google Scholar] [CrossRef]
  17. Kuzuhara, Y.; Kawamura, K.; Yoshitoshi, R.; Tamaki, T.; Sugai, S.; Ikegami, M.; Kurokawa, Y.; Obitsu, T.; Okita, M.; Sugino, T.; et al. A preliminarily study for predicting body weight and milk properties in lactating Holstein cows using a three-dimensional camera system. Comput. Electron. Agric. 2015, 111, 186–193. [Google Scholar] [CrossRef]
  18. Xu, H.X. Intelligent Measurement Algorithm of Cattle Body dimensions based on Improved CenterNet. Infrared Laser Eng. 2022, 1–7. (In Chinese) [Google Scholar]
  19. Weales, D.; Moussa, M.; Tarry, C. A robust machine vision system for body measurements of beef calves. Smart Agric. Technol. 2021, 1, 100024. [Google Scholar] [CrossRef]
  20. Wang, K.; Zhu, D.; Guo, H.; Ma, Q.; Su, W.; Su, Y. Automated calculation of heart girth measurement in pigs using body surface point clouds. Comput. Electron. Agric. 2019, 156, 565–573. [Google Scholar] [CrossRef]
  21. Guo, H.; Li, Z.; Ma, Q.; Zhu, D.; Su, W.; Wang, K.; Marinello, F. A bilateral symmetry based pose normalization framework applied to livestock body measurement in point clouds. Comput. Electron. Agric. 2019, 160, 59–70. [Google Scholar] [CrossRef]
  22. Yin, L.; Cai, G.; Tian, X.; Sun, A.; Shi, S.; Zhong, H.; Liang, S. Three dimensional point cloud reconstruction and body size measurement of pigs based on multi-view depth camera. Trans. Chin. Soc. Agric. Eng. 2019, 35, 201–208. [Google Scholar]
  23. Shi, S.; Yin, L.; Liang, S.; Zhong, H.; Tian, X.; Liu, C.; Sun, A.; Liu, H. Research on 3D surface reconstruction and body dimensions measurement of pigs based on multi-view RGB-D cameras. Comput. Electron. Agric. 2020, 175, 105543. [Google Scholar] [CrossRef]
  24. Li, G.; Liu, X.; Ma, Y.; Wang, B.; Zheng, L.; Wang, M. Body dimensions measurement and live body weight estimation for pigs based on back surface point clouds. Biosyst. Eng. 2022, 218, 10–22. [Google Scholar] [CrossRef]
  25. Li, J.; Ma, W.; Li, Q.; Zhao, C.; Tulpan, D.; Yang, S.; Ding, L.; Gao, R.; Yu, L.; Wang, Z. Multi-view real-time acquisition and 3D reconstruction of point clouds for beef cattle. Comput. Electron. Agric. 2022, 197, 106987. [Google Scholar] [CrossRef]
  26. Chen, H.; Liang, M.; Liu, W.; Wang, W.; Liu, P.X. An approach to boundary detection for 3D point clouds based on DBSCAN clustering. Pattern Recognit. 2022, 124, 108431. [Google Scholar] [CrossRef]
  27. Thurnhofer-Hemsi, K.; López-Rubio, E.; Blázquez-Parra, E.B.; Ladrón-de-Guevara-Muñoz, M.C.; de-Cózar-Macías, Ó.D. Ensemble ellipse fitting by spatial median consensus. Inf. Sci. 2021, 579, 310–324. [Google Scholar] [CrossRef]
Figure 1. Beef cattle point cloud data acquisition equipment (a), user interface (b), and examples of collected point cloud data (front view (c,d), top view (e)).
Agriculture 12 01012 g001
Figure 2. The measurement standard for key body dimensions of beef cattle.
Agriculture 12 01012 g002
Figure 3. A schematic showing the detailed process for beef cattle body dimension measurement.
Agriculture 12 01012 g003
Figure 4. The distribution curve of span values for continuous slices.
Agriculture 12 01012 g004
Figure 5. The distribution curve of span values with multiple extreme points.
Agriculture 12 01012 g005
Figure 6. The algorithm for the center point extraction for leg region.
Agriculture 12 01012 g006
Figure 7. The gradient characteristic distribution curve of the “five-point clusters”.
Agriculture 12 01012 g007
Figure 8. The errors arising from boundary calibration for beef cattle leg region. ((a) Broadened foreleg region, (b) broadened hind leg region, (c) broadened regions of forelegs and hind legs).
Agriculture 12 01012 g008
Figure 9. The longitudinal slices of beef cattle point clouds with the inflated and calibrated boundaries of the same leg regions. (a) The slice with the broadened width, (b) the slice with the desired width.
Agriculture 12 01012 g009
Figure 10. The algorithm for calibration of leg regional boundaries.
Agriculture 12 01012 g010
Figure 11. The extracted slices in the key region for body dimension measurement.
Agriculture 12 01012 g011
Figure 12. The location of the horizontal slice for beef cattle.
Agriculture 12 01012 g012
Figure 13. The results of key region extraction for (a) the original beef cattle point clouds and (b) the extracted regions for body dimension calculation.
Agriculture 12 01012 g013
Figure 14. The location of the body width calculation position.
Agriculture 12 01012 g014
Figure 15. Extracted different key regions from beef cattle clouds.
Agriculture 12 01012 g015
Figure 16. The error distribution of each body dimension (calculated for 182 sets of point clouds corresponding to 10 beef cattle).
Agriculture 12 01012 g016
Figure 17. Calculated body widths of the beef cattle.
Agriculture 12 01012 g017
Figure 18. The extraction of bifurcation angles.
Agriculture 12 01012 g018
Figure 19. Relationship between the bifurcation angles and wither height errors.
Agriculture 12 01012 g019
Figure 20. Reduction in wither height caused by leg crossover.
Agriculture 12 01012 g020
Figure 21. Two enlarged wither height cases. ((a) Animal with an arched back, (b) animal with hair lift).
Agriculture 12 01012 g021
Figure 22. The location of beef cattle body oblique length calculation.
Agriculture 12 01012 g022
Table 1. The assessment criteria of beef cattle body dimensions.
ParametersSymbolMeasurement Standard
Wither heightBHThe length of the vertical line from the beef stinger to the ground
Body oblique lengthBLDistance from shoulder to the ischial end of beef cattle
Body widthBWMaximum horizontal width at beef wither
Chest girthBCPerimeter of the vertical body axis at the back of the wither
Abdominal girthBSMaximum vertical circumference of the belly of beef cattle
Table 2. Beef cattle body dimension measurement results.
Beef Cattle IdOblique LengthBody WidthWither HeightChest GirthAbdominal Girth
MAEMAEMAEMAEMAE
11601582.8%47472.6%1301293.0%1841883.0%2082133.0%
21581582.4%45451.5%1331332.4%1951992.9%2092122.6%
31591592.1%43431.5%1311322.5%1821873.4%1921973.1%
41561572.2%46461.3%1291293.3%1821832.3%2012042.5%
51621603.0%36362.2%1321332.5%1651703.6%1931972.8%
61571572.5%39391.7%1251252.7%1581602.8%1962002.7%
71691682.4%44451.3%1301312.9%1851892.9%2232283.1%
81471492.4%48480.8%1271293.4%1921973.3%2042102.9%
91531522.2%39391.7%1241242.6%1691733.5%1891922.5%
101551582.5%38382.0%1231263.9%1641661.8%1901912.0%
Note: M stands for the manual measurement results; A stands for automatic measurement results; E stands for mean absolute error.
Publisher’s Note: MDPI stays neutral with regard to jurisdictional claims in published maps and institutional affiliations.

