Article

Transformer Help CNN See Better: A Lightweight Hybrid Apple Disease Identification Model Based on Transformers

College of Information Engineering, Northwest A&F University, Xianyang 712100, China
*
Author to whom correspondence should be addressed.
Agriculture 2022, 12(6), 884; https://doi.org/10.3390/agriculture12060884
Submission received: 11 May 2022 / Revised: 11 June 2022 / Accepted: 14 June 2022 / Published: 19 June 2022
(This article belongs to the Section Crop Protection, Diseases, Pests and Weeds)

Abstract

:
The complex backgrounds of crop disease images and the small contrast between the disease area and the background can easily cause confusion, which seriously affects the robustness and accuracy of apple disease- identification models. To solve the above problems, this paper proposes a Vision Transformer-based lightweight apple leaf disease- identification model, ConvViT, to extract effective features of crop disease spots to identify crop diseases. Our ConvViT includes convolutional structures and Transformer structures; the convolutional structure is used to extract the global features of the image, and the Transformer structure is used to obtain the local features of the disease region to help the CNN see better. The patch embedding method is improved to retain more edge information of the image and promote the information exchange between patches in the Transformer. The parameters and FLOPs (Floating Point Operations) of the model are significantly reduced by using depthwise separable convolution and linear-complexity multi-head attention operations. Experimental results on a complex background of a self-built apple leaf disease dataset show that ConvViT achieves comparable identification results (96.85%) with the current performance of the state-of-the-art Swin-Tiny. The parameters and FLOPs are only 32.7% and 21.7% of Swin-Tiny, and significantly ahead of MobilenetV3, Efficientnet-b0, and other models, which indicates that the proposed model is indeed an effective disease-identification model with practical application value.

1. Introduction

Apple is a major fruit species today and is very popular [1]. However, apple leaf diseases seriously affect its yield and quality. Therefore, timely and accurate identification of apple leaf diseases is essential to improve apple yield and quality and promote the apple industry’s healthy development. Farmers relied on planting experience and expert guidance to diagnose diseases in the early days. However, with the expansion of the planting scale, this method could no longer meet practical needs. The development of machine learning has provided a new approach to crop disease identification. Using traditional machine-learning methods for apple leaf disease identification requires manual extraction of features such as color, shape, and texture of the disease, followed by feature reduction using traditional artificial intelligence algorithms such as Principal Component Analysis (PCA), genetic algorithm (GA), Support Vector Machine (SVM), and K-Nearest Neighbor (KNN), and finally classification and identification of the disease. For example, Ref. [2] extracted the color, shape, and texture features of apple leaf lesions and used SVM to achieve automatic disease recognition. Ref. [3] proposed a feature fusion-based plant disease-recognition method and obtained 96% recognition accuracy on the apple leaf disease dataset. Ref. [4] overcame the difficulty of feature extraction and selection in classical plant disease recognition methods by mapping observed sample points in high-dimensional space to low-dimensional subspace and obtained more than 90% recognition accuracy on the apple leaf disease dataset. However, their dataset was relatively small, the model’s generality was rather poor, and the recognition accuracy was not high in scenarios with high noise, such as uneven lighting.
With the development of deep learning techniques, especially the success of convolutional neural networks (CNNs) in computer vision, some scholars have started applying CNNs to the apple leaf disease recognition task. Ref. [5] first proposed to use AlexNet and GoogLeNet to identify apple leaf diseases and obtained 97.62% recognition accuracy. Ref. [6] used global average pooling to replace fully connected layers and used an improved Softmax classifier to identify apple leaf diseases, significantly reducing the model’s training and recognition time. Ref. [7] enhanced the feature extraction capability of the model by combining XDNet with DenseNet and Xception, and achieved the recognition of five apple leaf diseases with 98.82% recognition accuracy with a small number of parameters. However, the dataset they used contained a relatively homogeneous background, which was ineffective in practical application scenarios. Under natural conditions in the field, complex environments such as weather conditions, brightness changes, occlusions, and other objects in the disease images can adversely affect the performance of the model, which requires the model to give less attention to irrelevant features such as background and more attention to the disease region itself. Thus, ref. [8] proposed a self-attention convolutional neural network and obtained 95.33% and 98.0% recognition accuracy on AES-CD9214 and MK-D2 datasets. Ref. [9] proposed integrating attention into the EfficientNet network and got 98.92% recognition accuracy on self-built apple leaf disease datasets. However, the attention mechanism they used is different and specialized, which is not general, and using only a single attention mechanism can potentially cause the overfitting of the model. The parameters and FLOPs of their model are relatively large and difficult to deploy on resource-constrained edge devices. So, ref. [10] proposed to use MobileNet for apple leaf disease recognition, which effectively reduced the parameters and FLOPs of the model but only obtained 73.5% recognition accuracy, which obviously could not meet the practical needs.
Transformer structure, a standard paradigm in Natural Language Processing (NLP) [11], is a general form of attention mechanism that has recently caused a stir in the field of computer vision (Vision Transformer) [12,13,14,15,16,17]. Vision Transformer inherits the Transformer’s approach in NLP, dividing the input image into small non-overlapping patches and flattening them into one-dimensional vectors for input into the cascaded Transformers. The multi-head attention mechanism in Transformer can establish long-distance dependence of the input image, providing different attention to different positions of the image. This property of the Transformer is naturally suitable for apple leaf disease recognition in complex environments. However, Transformer lacks the inductive bias of CNN structure, so a large amount of data is required for training. The Transformer is a weighty structure with a large number of parameters and FLOPs, which is not conducive to practical applications. Therefore, reasonably combining the advantages of Transformer and CNN structures and improving the Transformer structure become the key to improving the disease recognition effect of CNNs in complex environments. We combine the advantages of Transformer and CNN structures to propose a general-purpose, lightweight model for apple disease identification in complex environments—ConvViT. ConvViT connects the Transformer structure after the CNN structure and optimizes the output feature map to get the important features for the final prediction. To retain more image edge information, promote the information exchange between patches, and protect the local continuity of image information, the patch embedding method of the original model is improved to overlapping patch embedding. Average pooling is used before the multi-head attention layer of the Transformer to reduce the complexity of MHA. Reducing linear complexity and using depth-separable convolution instead of standard convolution significantly reduces the parameters and FLOPs of the model, ensuring that ConvViT can be deployed on resource-constrained devices. Experimental results on a self-built apple leaf disease dataset with a complex background show that ConvViT is an effective and efficient apple disease-identification model. The core contributions of this paper can be summarized as follows:
(1)
We propose using the Transformer structure to solve the problem that the complex background of apple disease images and the slight contrast between the disease area and the background in apple disease recognition using CNN can easily cause confusion and affect the identification effect. Vision Transformer, based on the self-attention mechanism, can guide the CNN structure to focus on the effective features for identification results and make the CNN see better.
(2)
We adopt lightweight designs and improve the patch embedding method of Transformer. The depthwise separable convolution reduces the computational complexity of the convolution structure, and the Global Average Pooling reduces the computational complexity of the Transformer structure to linear complexity before performing the attention operation. The improved overlapping patch embedding approach promotes the information exchange between adjacent patches, preserves the information of image edges, and ensures the continuity of image local information.
(3)
An effective, lightweight apple disease-identification model is proposed. ConvViT fully combines the advantages of CNN and Transformer and obtains competitive results on the self-built apple disease dataset with much lower parameters and computational effort than other similar identification effect models.

2. Materials and Methods

2.1. Apple Leaf Disease Dataset

This paper acquired images of apple foliar diseases using iPhone and Android cell phones. Five typical apple foliar diseases, namely Alternaria leaf spot, Brown spot, Mosaic, Gray spot, and Rust, were selected as research objects, as shown Figure 1.
To enhance the diversity of the dataset, images of apple foliar diseases were collected at the Baishui Apple Experiment Station, the Luochuan Apple Experiment Station, and the Qingcheng Apple Experiment Station of Northwest A&F University, respectively. The datasets were mainly acquired under good light conditions on sunny days, and some images were collected on cloudy and rainy days. The different acquisition conditions further enhanced the diversity of the datasets. A limited number of images of five apple foliar diseases were collected in this paper, including 411 Alternaria leaf spot, 435 images of Brown spot, 375 images of Mosaic disease, 370 images of Grey spot, and 438 images of Rust, for a total of 2029 disease images. In this study, the dataset is randomly divided into the training set, test set, and validation set according to a ratio of 6:3:1.
The collected raw dataset could not meet the requirements of network training. To reduce the overfitting problem in the later network training stage, improve the anti-interference ability of complex conditions, and improve the model’s generalization ability. In this paper, data enhancement is used to increase the diversity of training samples and expand the data set to improve the robustness of the model, avoid overfitting, and meet the data volume requirements in the network training phase. In this paper, the acquired images are preprocessed. The preprocessing operations include image rotation, horizontal and vertical mirroring, a sharpness value, brightness value and contrast adjustment, and Gaussian blurring for the original disease images. This extension creates a dataset containing 15,834 images of apple leaf diseases in the training sample, which included 3211 images of Alternaria leaf spot, 3393 images of Brown spot, 2886 images of Grey spot, 2925 images of Mosaic disease, and 3419 images of Rust. The amount of data for each category is shown in Table 1.

2.2. Methods

2.2.1. Model Overview

Our model is designed with reference to ViT, MLP-Mier [18], and CNN. Figure 2 shows the general architecture of our model. The architecture contains four stages, each containing several convolutional and Transformer structures and a downsampling structure. It also contains patch embedding, Global Average Pooling, and a linear classifier auxiliary module.
The model uses a multi-stage design, which is an important mechanism to improve the performance of networks based on CNN architecture. Unlike the single-stage design, the input of the multi-stage design model has a higher resolution to ensure sufficient information input. It also reduces redundancy through downsampling, thus reducing the computational effort. Due to the limitation of computation, the single-stage input can only use lower image resolution, which loses a lot of information and leads to poor performance of the final model. The model’s four stages correspond to 4, 8, 16, and 32 times downsampling, the height and width of the feature map are reduced, the number of channels is increased, and the dimensionality of the features at the same stage remains the same. After downsampling, the dimensionality becomes twice the original. Due to the extremely high computational cost of Transformer on the high-resolution feature maps, only the convolution structure is used in the first and second stages of the model. In the third and fourth stages of the model, the convolutional and Transformer structures are used alternately. Patch embedding is the first step of image processing by Transformer, where the input image is sliced into small patches and transformed into one-dimensional directions for subsequent operations. The Global Average Pooling and linear classifier are used to integrate the global spatial information of the feature map and output the disease classes. The detailed parameters of the proposed network are shown in Table 2. Next, the design of each component will be explained in detail.

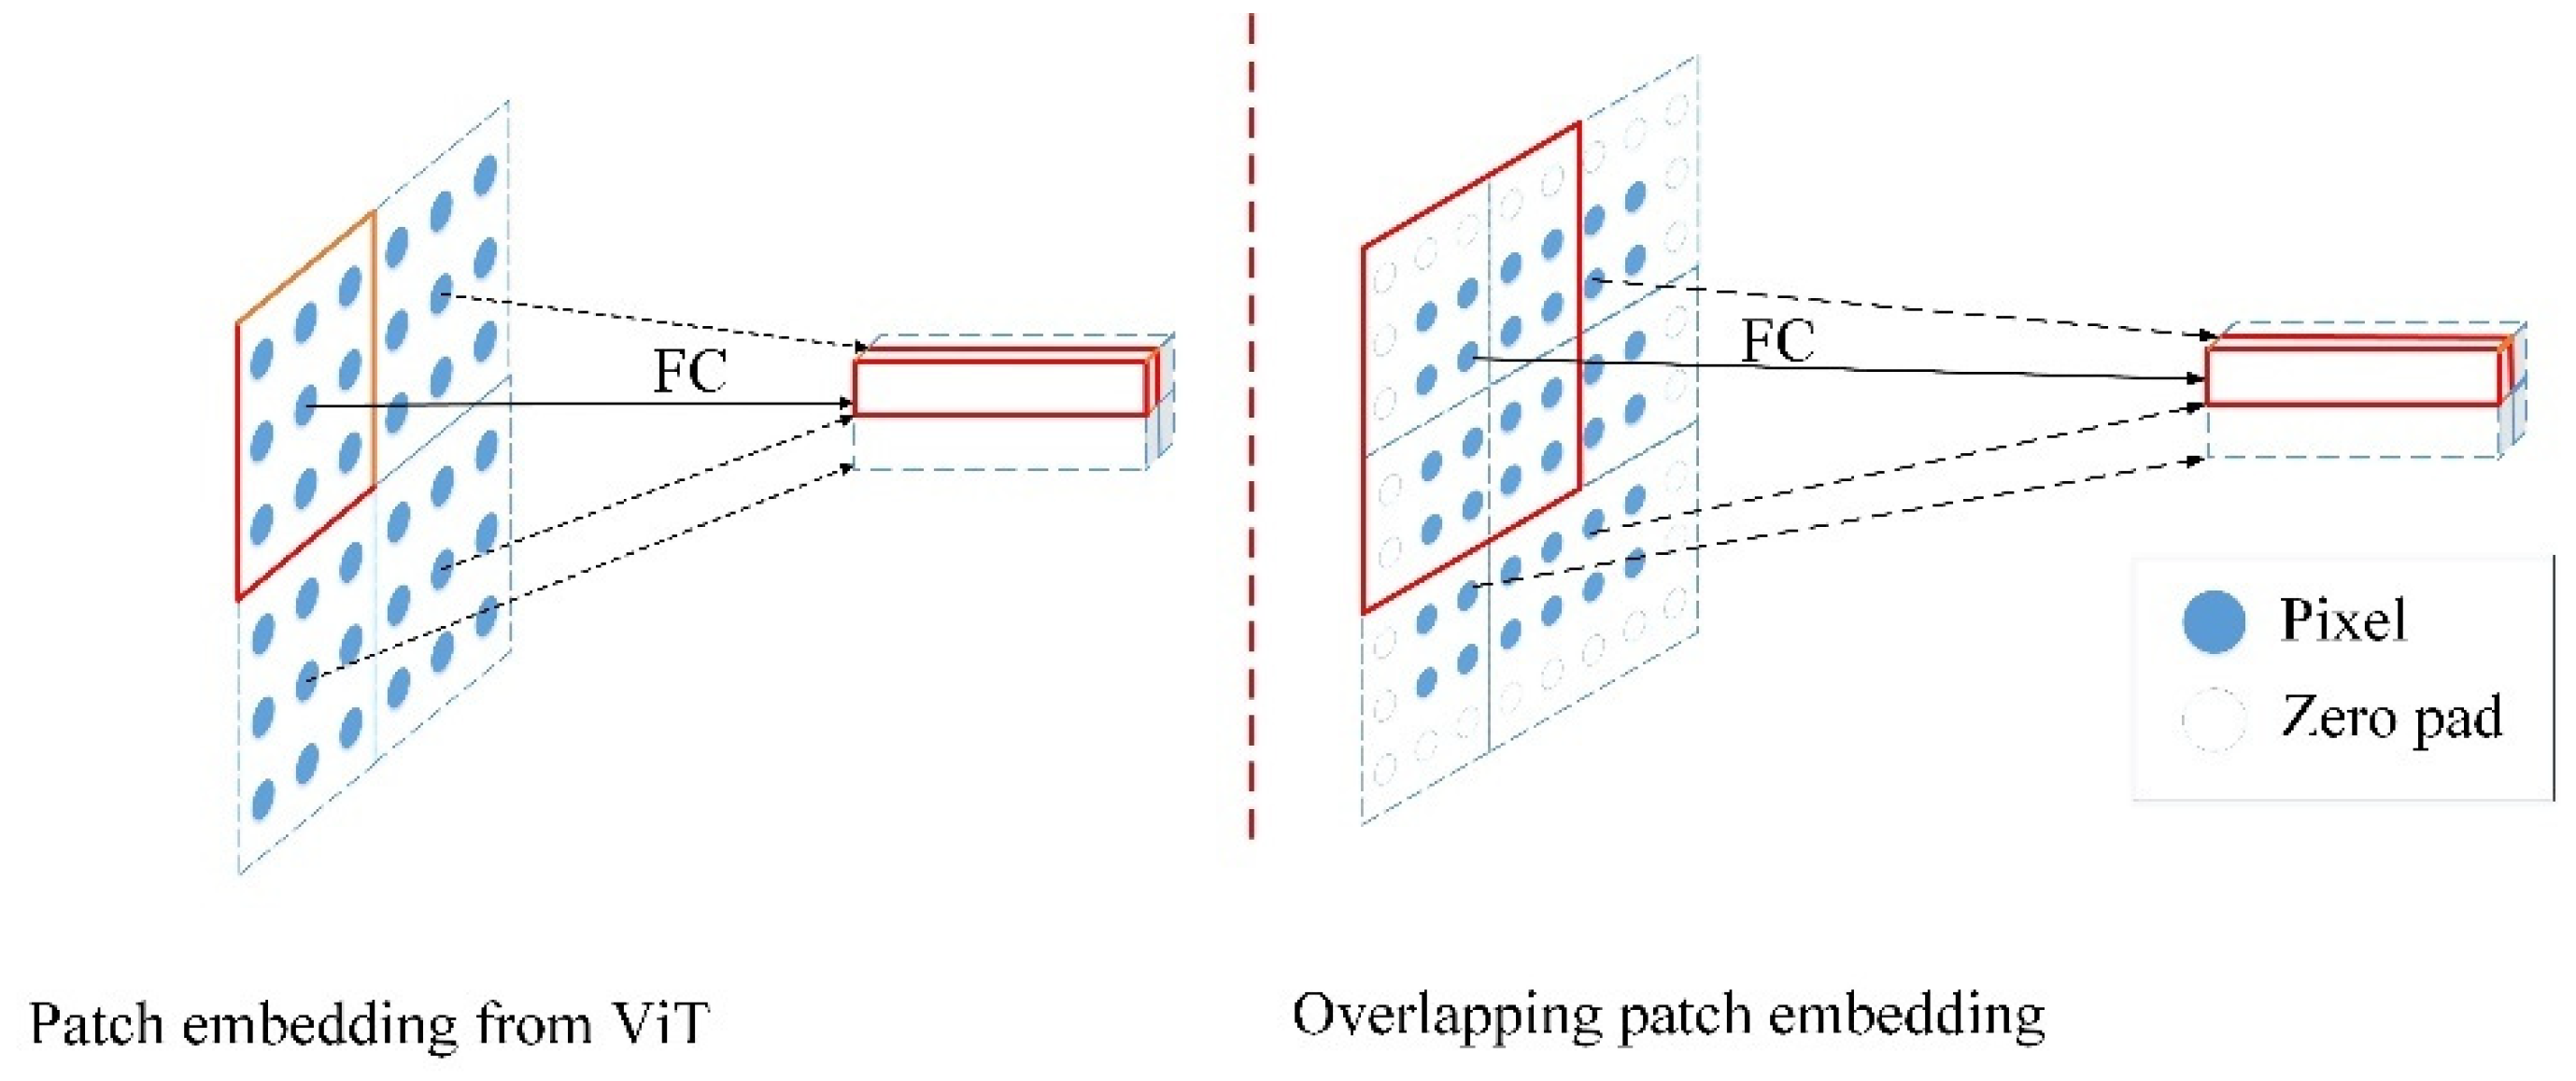
2.2.2. Overlapping Patch Embedding

The transformer receives a sequence of one-dimensional token embeddings as input. To process 2D image X H × W × C , where H, W is the resolution image of the original image, C is the number of channels, it is shaped into a sequence of flattened 2D patches X p N × P 2 × C , the resolution size of each image patch is (P, P), and N is the number of patches. The Transformer uses a vector of fixed size D to pass through all its layers, so the flattened patches are mapped to the D dimension in a trainable linear mapping. We take the output of this mapping as patch embedding.
When performing a concrete implementation, original ViT uses a non-overlapping convolution operation for patch partitioning, which can disrupt the continuity of the local information of the image, and the edge part of the image may be discarded because the size is smaller than the size of the convolution kernel, resulting in the loss of image information. To improve the above situation, we improve the patch embedding method to overlapping patch embedding, which is a 0 padding method for image edges and retains the information of image edges, using a convolutional kernel of size 3 × 3 and stride 2 for patch division. Thus, the overlapping patch division method enhances the information exchange between neighboring patches and protects the local information of images. This overlapping patch embedding division enhances the information exchange between adjacent patches and protects the continuity of local information of the image. The schematic diagrams of the two approaches are shown in Figure 3.

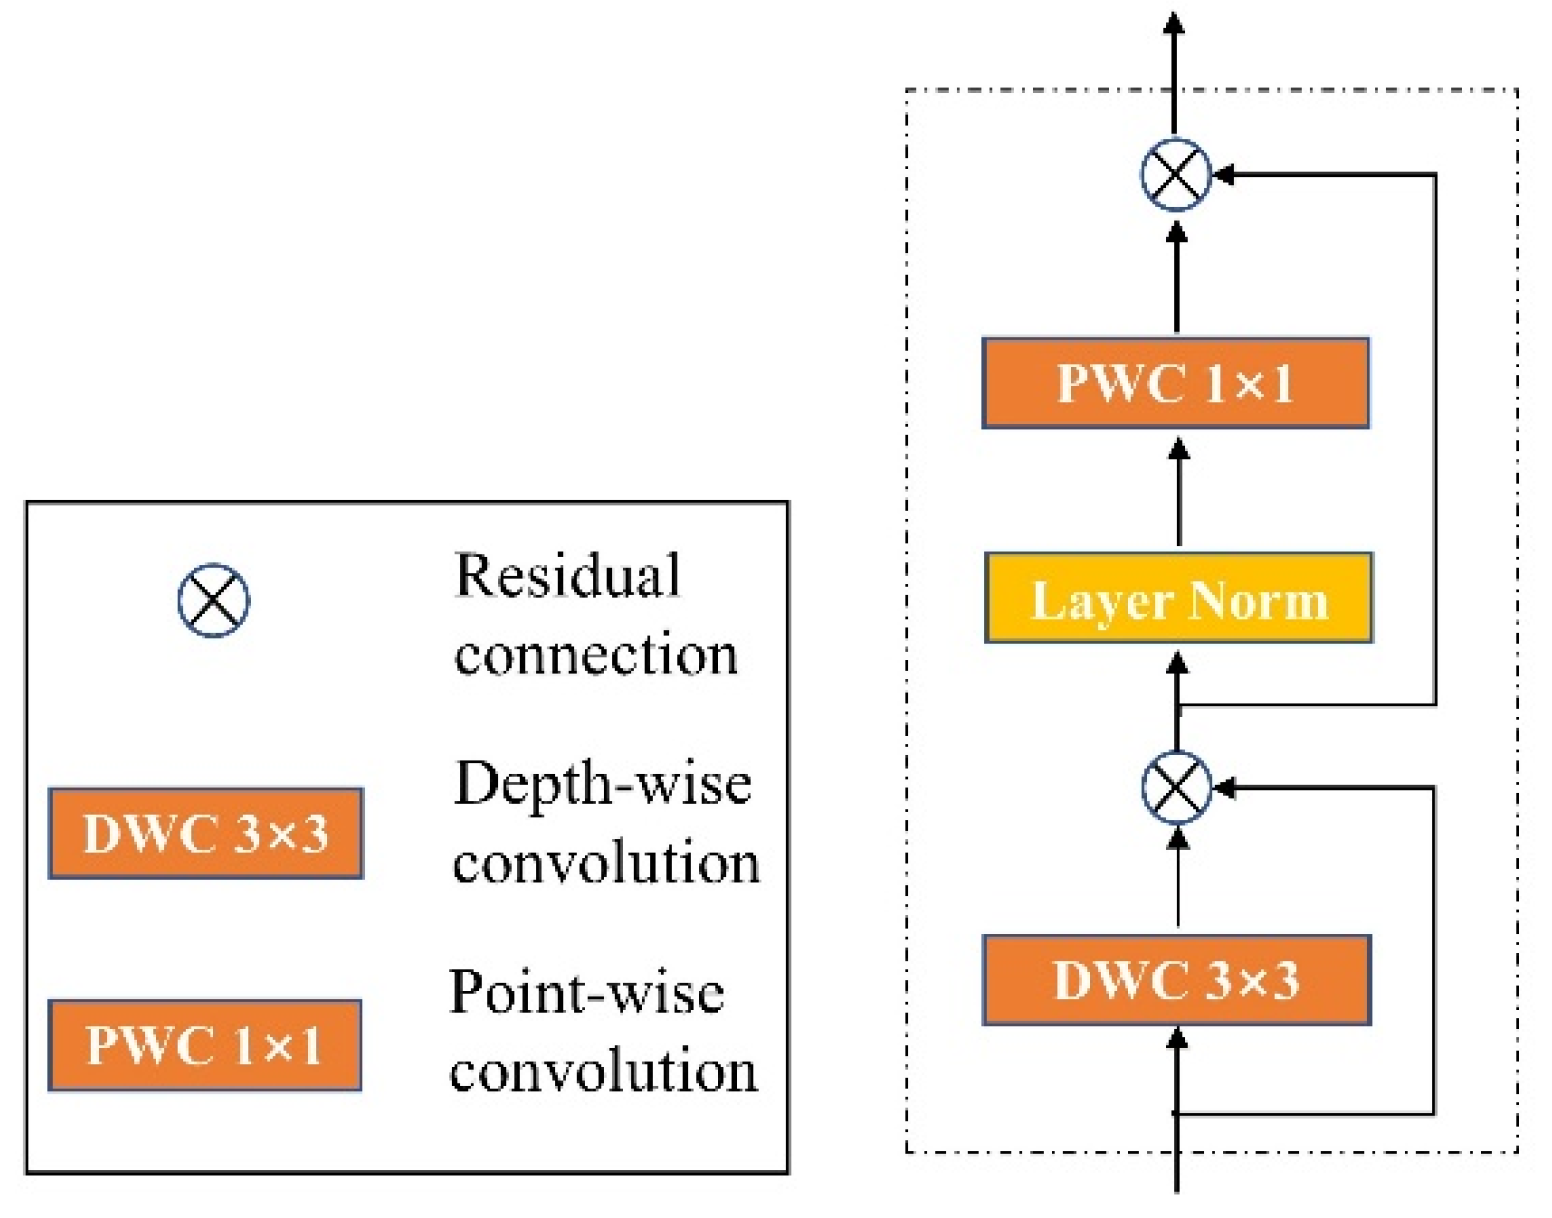
2.2.3. The Design of Convolution Structure

The design of the convolution structure is shown in Figure 4. The input disease image X H × W × C , where H represents the input image height, W represents the input image width, and C represents the number of input image channels. A 3 × 3 depthwise convolution operation is first performed when entering the convolution structure, and the spatial location information is aggregated together for local modeling. Subsequently, the channel information is fused into the feature map by 1 × 1 convolution (also called point-wise convolution). Residual connections and layer regularization are also added.
The convolution operations involved in our proposed model are based on the depthwise separable convolution design [19]. Compared with the traditional convolution, the depthwise separable convolution has fewer parameters and is less computationally intensive. As shown in Figure 5 and Figure 6, the depthwise separable convolution divides the traditional convolution operation into two steps. The first step is depthwise convolution, where the number of channels of the convolution kernel is 1. The number of convolution kernels is the same as the number of channels of the input feature map. The second step is point-wise convolution, where the feature map is fused in depth, using a convolution kernel of size 1 to obtain the final feature map.
It is worth noting that the number of channels of the convolution kernel is the same as the number of channels of the feature map extracted in the previous step. It can be seen that the dimensionality of the feature maps extracted by the depthwise separable convolution module is the same as that of the conventional convolutional module. The computational and parametric quantities of the depth-separable convolutional module and the traditional convolutional neural network are shown in Equations (1)–(4).
D W C o n v = K × K × C i n × H × W + C i n × C o u t × H × W
C o n v = K × K × H × W
D W C o n v = K × K × C i n + C i n × C o u t
C o n v = K × K × C i n × C o u t
where K is the size of the convolution kernel, H and W are the length and width of the output feature map, respectively, C i n is the number of channels of the input feature map, and C o u t is the number of channels of the output feature map. It can be seen that the depthwise separable convolution module reduces the computation and number of parameters of the model to a great extent compared with the traditional convolution module.

2.2.4. The Design of Transformer Structure

The Transformer structure is a Transformer encoder. For the input image, the fusion of spatial feature information is achieved by multi-head attention, using MLP to fuse the feature channels and adding the necessary layer regularization and residual concatenation, as shown in Figure 7.
By overlapping patch embedding, the input image is divided into overlapping patches, and the patches are flattened into vectors of length N = H W / P 2 and dimension D in the Transformer (Equation (5)).
The position embedding is added to the patch embedding to preserve the location information. A standard learnable 1 D position embedding is used. The generated sequence of embedding vectors is used as the input to the Transformer encoder. The Transformer encoder consists of alternating multi-head attention layers (MSA and MLP blocks (Equations (6) and (7)). LayerNorm (LN) is applied before each block, and the residual connection is applied after each block. The MLP contains two layers of GELU nonlinear activation functions. The original Vision Transformer model uses class token as the basis for final classification. Still, since it loses a lot of information, this paper uses Global Average Pooling and linear layers to achieve classification after the last Transformer of the model.
z 0 = x p 1 E ; x p 2 E ; x p N E + E p o s , E P 2 × C × D , E p o s N + 1 × D
z = M S A L N z 1 + z 1 , = 1 , 2 L
z = M L P L N Z + z , = 1 , 2 L
MSA comprises multiple standard qkv self-attention (SA). SA is a popular building block of neural architecture. For each element in the input sequence z, we compute a weighted sum of all values v in the sequence. The attention weights A i , j are based on the similarity between two elements in the sequence and their respective query q i and key k j representations.
q , k , v = z U q k v , U q k v D × 3 D h
A = s o f t m a x q k T D h , A N × N
S A z = A v
Multi-head attention (MHA) is an extension of Self-Attention (SA) in which k SA operations called “heads” are run in parallel and mapped to the output of the splice. When changing k, D h (Equation (11)) is usually set to D/k to keep the number of computations and parameters constant.
M S A z = S A 1 z ; S A 2 z ; ; S A k z U m s a , U m s a k × D h × D
The MHA layer contributes the highest computational cost of the Transformer block. To reduce the high computational cost caused by the attention operation, we refer to the design of PVT V2 [20] and reduce the computational complexity of MHA to linear complexity. As shown in Figure 8, the original MHA receives a query Q, a key K, and a value V as input and outputs a refined feature. The difference is that the linear complexity MHA reduces the spatial scale of K and V before the attention operation, largely reducing the computation/memory overhead.
For an image or intermediate feature map with input space dimension h  ×  w  × c, the original MHA’s complexity and the linear MHA’s complexity are Equations (12) and (13), where P is the pooling size of the linear MHA and is set to 7.
Ω M H A = 2 h 2 w 2 c + 2 w c 2
Ω l i n e a r   M H A = 2 h w P 2 c

2.3. Evaluation Indicators and Experimental Environment

2.3.1. Evaluation Indicators

In this paper, the applicability of ConvViT in real-world scenarios was evaluated by six metrics: Accuracy, Model Size, FLOPs, Precision, Recall, and F1 score. Accuracy, Precision, Recall, and F1 score are calculated as shown in the Equations (14)–(17). TP, FP, TN, and FN are the number of true positives, false positives, true negatives, and false negatives, respectively. FLOPs measures the run time of the model; it refers to the number of floating-point operations performed throughout the forward process—the lower the FLOPs, the less computation and execution time the model requires. The parameters determine the size of the model. The smaller the model is, the lower the hardware requirements and the higher the model’s applicability, provided that the task requirements are met.
a c c u r a c y =   T P + T N / T P + T N + F P + F N
p r e c i s i o n =   T P / T P + F P
r e c a l l =   T P / T P + F N
F s c o r e =   2 / 1 / p r e c i s i o n + 1 / r e c a l l

2.3.2. Experimental Parameters Settings

Our training scheme uses the training settings taken in DeiT [13]. The specific configuration is shown below. The research experiments were performed in Ubuntu 20.04 environment (processor: Intel Core i9 10900X, RAM: 48 GB, graphics card GeForce RTX: 3090 × 2). The deep learning framework is Pytorch, combined with Cuda 11.1 for training. During the experimental design and comparison, the network batch size for the training and validation sets was set to 256. Specifically, we trained our model for 100 epochs. We scaled the learning rate linearly to 0.0005. The weight decay was set to 0.05. We used the AdamW optimizer and employed powerful data enhancement strategies including Mixup, CutMix, AutoAug, ColorJitter, Random Erase, etc. We also used label smoothing and DropPath. The resolution of the input image was adjusted to 224 × 224.

3. Results

3.1. Comparisons with State-of-the-Art Methods

To verify that the model proposed in this paper is effective, we chose CNN architecture-based models and Transformer-based models. Figure 9 and Figure 10 show the process of the experiments.
All the models start to converge at 20 epochs and finally converge to stability at 100 epochs. Among all the models, Swin-tiny [17] obtained the highest recognition accuracy of 96.94%, our model ranked second with 96.85%, and MobilenetV3 [21] obtained the lowest recognition accuracy of 87.42%. The recognition results of the model based on the Transformer structure are generally better than those of the model based on the CNN architecture. We conjecture that this is related to the complex background information of the dataset, and the Transformer structure-based model can establish the long-distance dependence of the disease images, reducing the complex background’s effect on the recognition results.
Table 3 shows the specific experimental results. Although our proposed model’s recognition accuracy lags behind Swin-tiny by 0.09%, the parameter ConvViT is only 32.7% of that of Swin-tiny. The FLOPs are only 21.7% of that of Swin-tiny FLOPs, which is perfectly acceptable for edge devices with strict resource constraints. Compared with Resnet-18 [22], which is comparable to our model in terms of recognition and parameter, our FLOPs are only 57.3% of its FLOPs, thanks to our extensive lightweight design.

3.2. Analysis of Model Performance on Each Apple Disease Category

To observe the recognition effect of the model on each disease category, corresponding experiments were conducted, and the experimental results are shown in Figure 11. The model achieved identification accuracy of up to 99% on the Brown Spot. Mosaic disease categories have the worst recognition effect on the Grey spot category diseases, only about 95%. The Alternaria leaf spot and ConvViT can exclude the influence of complex background to some extent. Still, Grey spot contains a lot of images with a complex background, which also causes its recognition effect to be poor compared with other categories. However, compared with other models, the recognition effect is still improved to some extent.

3.3. Is the Combination of Convolution Structure and Transformer Structure Reasonable?

Previous experimental results showed that the ConvViT model obtained competitive experimental results on the apple leaf disease dataset, and on the one hand, the proposed model in this paper is based on the design of existing work [17]. However, on the other hand, it is also based on experience. Thus, an ablation experiment was designed and conducted to verify whether the proposed multi-stage design and the combination of convolution structure and Transformer structure in each stage were reasonable. According to the different proportions, four models, including ConvViT, were designed, named ConvViT1, ConvViT2, ConvViT, and ConvViT4, and the specific configurations of these models are shown in Table 4.
ConvViT2 has been fully transformed into a model based on convolutional structure only, and it can be said that ConvViT4 has also been transformed into a model based on ViT structure, and the other settings default to the basic settings of ConvViT. Table 5 shows the detailed experimental results.
The Figure 12 shows that all four models show a stable upward trend, but there is a vast difference in recognition accuracy. After 100 epochs of training, ConvViT obtains the best recognition accuracy of 96.85%. In contrast, ConvViT2 only obtains 75.73% recognition accuracy. There is a huge difference between them, and the other two models also have different degrees of difference with ConvViT, which shows that our design is effective. The reasonable use of convolution structure and Transformer structure can obtain better results.

3.4. Is the Overlapping Patch Embedding Valid?

This paper conducted ablation experiments to analyze the effectiveness of overlapping patch embedding. As shown in Table 6, the experiments were conducted on the dataset using the ConvViT model, with “ConvViT+” representing the use of overlapping patch embedding and “ConvViT” representing the use of the original patch embedding method. From the experimental results, overlapping patch embedding obtained a 1.49% improvement in recognition accuracy on the apple disease dataset, which indicates that overlapping patch embedding is effective for the apple disease recognition task.

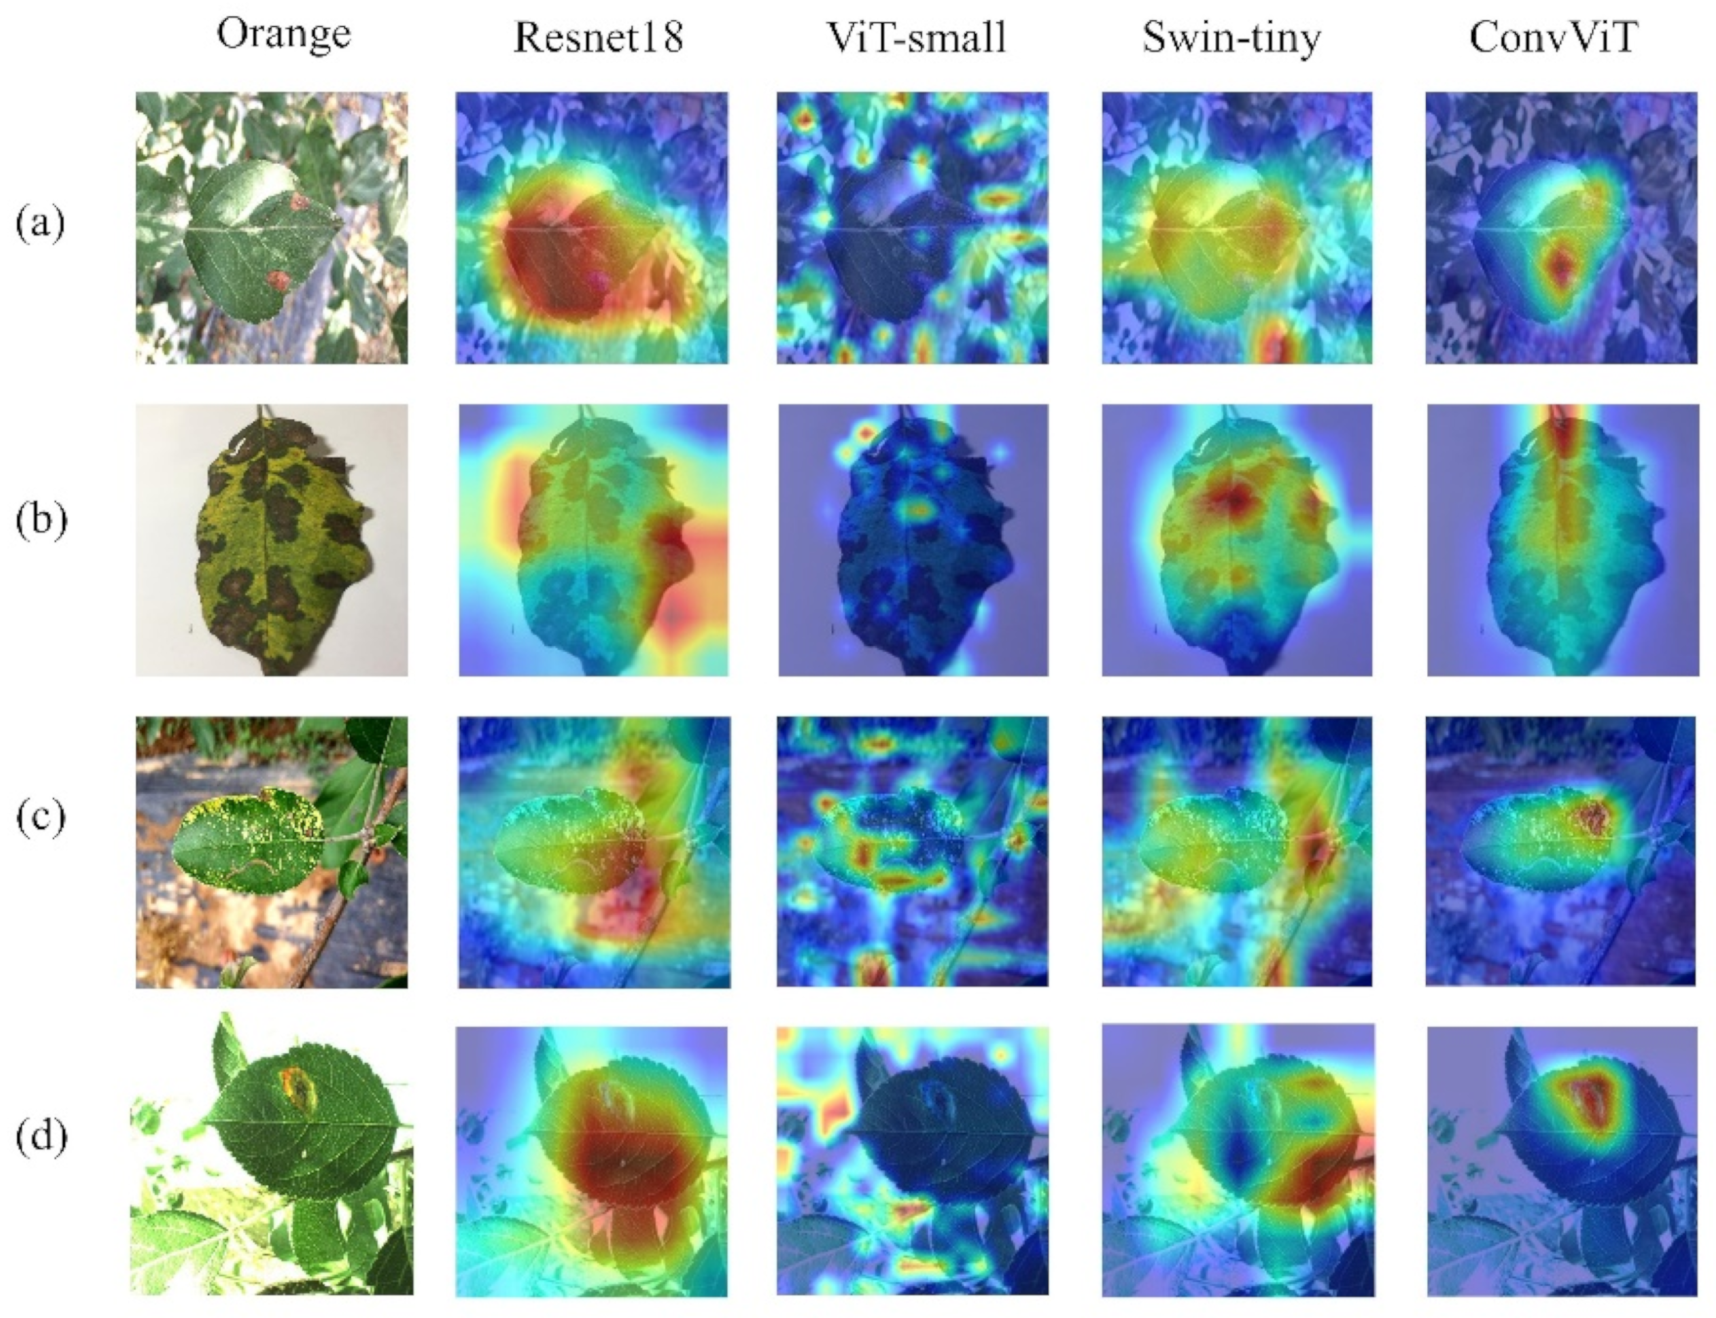
3.5. Visualization of Results

In addition, we use gradient-weighted class activation maps [23] to visualize the disease recognition process of the model. As shown in Figure 13, the darker the red area in the image, the more the model focuses on this part of the image, followed by a focus on the yellow area. The model infers that if the heat map color is blue, this region is prone to redundancy and minor disease differentiation. The shaded part of the image has been a limiting problem for image classification. The Resnet18 model, based on convolutional structure, can find disease-related regions completely and introduce features in the transition region between disease regions that do not work for recognition results, which can affect the recognition effect.
In contrast, ViT-small, a model-based entirely on the Transformer structure, did not focus on contiguous leaf regions. Still, it did not focus enough on disease areas. Instead of focusing on many non-disease areas, it lost many disease-related features; this is related to the fact that it cuts the input image into non-overlapping patches. The best-performing Swin-Tiny model in the above experiments can focus better on the lesion regions and pays significantly less attention to the transition regions between lesions, thanks to its window-based patch embedding approach that facilitates the exchange of local information in the input image. This mechanism plays a similar role to the convolutional structure. However, it is still obvious that it focuses on features other than the disease region, and ConvViT can accurately identify almost all disease regions without the influence of complex background on the recognition effect, which indicates the effectiveness of our approach.

4. Discussion

This paper proposes a generalized lightweight apple disease-identification model based on CNN structure and Transformer structure for apple disease identification in complex environments through a series of improvements. The model effectively solves the disease identification problem in complex environments and improves the robustness and accuracy of the disease-recognition model in complex backgrounds. Compared with other lightweight models based on Transformer, the model has strong practicality by significantly reducing the model’s parameters and FLOPs with no identification accuracy loss. Compared with the lightweight models based on CNN structure, identification accuracy for apple leaf diseases in complex backgrounds gains substantial improvement.
Ref. [24] proposed to solve cucumber disease recognition in complex backgrounds using global pooling and dilated convolution. In comparison, our model has less parameters, is more scalable, and is higher in identification accuracy by 2.11%. However, the nature of the ViT structure leads to greater difficulty in training the model proposed in this paper. Ref. [25] proposed to use Effecentnet -b4 combined with Ranger optimizer to obtain a maximum recognition accuracy of 97% on a cucumber disease dataset with a complex background, which is slightly higher than the recognition accuracy of this paper (96.85%). Its number of parameters is more than 4.6 times the number of parameters of our model. Again, our model faces greater training difficulty. In [8], a self-attention convolutional neural network was proposed and obtained 95.33% and 98.0% recognition accuracy on AES-CD9214 and MK-D2 datasets, respectively. In contrast, our proposed model provides a general form using a self-attention structure with better mobility, and the multi-head attention mechanism in ViT can effectively prevent model overfitting. Compared to single-head attention, the multi-head attention mechanism in ViT also increases the number of parameters and FLOPs of our model. Ref. [26] proposed to suppress the interference of irrelevant information by optimizing the channels and obtained 99.74% recognition accuracy, which is slightly higher than this paper’s, but the dataset size is relatively small, and the model parameters are much higher than our model. In addition, Many researchers [27,28,29,30,31] used a detection-based approach, there are also many researchers [32,33,34] used a segmentation-based approach to solve the recognition problem in complex backgrounds, both of which reported good experimental results. However, the performance in practice is not very satisfactory. They have in common that the feature extraction networks are CNN networks. The spatial locality of CNN networks limits the performance of the above work on unknown datasets, and the long-range modeling nature of ViT structure makes up for the deficiency of CNN, so our model is more robust to unknown complex conditions and more suitable for crop disease identification in complex backgrounds. Although our model achieves better disease identification in complex backgrounds, Transformer leads to our model having many parameters and FLOPs. Although we have made a series of improvements, there is still room for improvement compared to lightweight CNN models. In addition, Transformer also increases the training difficulty of the model, which is the direction of our future research.

5. Conclusions

This paper found that the Transformer-based CNNs model can significantly improve the identification of apple leaf diseases in complex backgrounds.
First, the input image is modeled locally using the convolutional structure to extract image features; the local nature of the convolutional operation makes it difficult to communicate between features that are far away, resulting in the extracted features containing parts with complex backgrounds, which affects the identification results. We solve this problem by connecting the Transformer structure after the convolutional structure. The Transformer optimizes the feature map by modeling the feature map at long distances, which is equivalent to guiding the CNN structure to focus on features useful for recognition, helping the CNN to see better.
Secondly, the original patch embedding method is improved to retain more edge information of the input disease image and increase the continuity of the local information of the image.
Finally, the computational complexity of the convolutional operation is reduced by using a depth-separable convolution method, and the computational complexity of the MHA algorithm is effectively reduced to linear complexity by using Global Average Pooling before performing the attention operation. The model’s parameters and FLOPs are significantly reduced, enabling ConvViT to be applied to real-world scenarios. Compared with experimental results on other dominant network structures, the model achieves competitive recognition accuracy on a self-built apple dataset with much lower parameters and FLOPs than other models with the same performance.

Author Contributions

Conceptualization, X.L.; methodology, X.L.; software, X.L.; validation, X.L.; formal analysis, X.L.; investigation, X.L.; resources, X.L.; data curation, X.L.; writing—original draft preparation, X.L.; writing—review and editing, X.L.; visualization, S.L.; supervision, S.L.; project administration, S.L.; funding acquisition, S.L. All authors have read and agreed to the published version of the manuscript.

Funding

This research was funded by the National Key Research and Development Program of China (Grants 2020YFD1100600 and 2020YFD1100601). The authors appreciate the funding organization for its financial support.

Institutional Review Board Statement

Not applicable.

Informed Consent Statement

Not applicable.

Data Availability Statement

The data presented in this study are available upon request from the corresponding author. The data are not publicly available due to the privacy policy of the authors Institution.

Acknowledgments

We thank all of the funders.

Conflicts of Interest

The authors declare no conflict of interest.

Abbreviations

CNNConvolutional Neural Networks
ViTVision Transformer
FLOPsFloating Point Operations

References

  1. Huo, X.; Liu, T.; Liu, J.; Wei, Y.; Yao, X.; Ma, X.; Lu, F. 2020 China Apple Industry Development Report (Simplified Version). Chin. Fruit 2022, 42, 1–6. [Google Scholar]
  2. Wang, N.; Ning, F.; Lu, S. Research on identification method of apple leaf diseases based on support vector machine. Shandong Agric. 2015, 141, 122–125. [Google Scholar]
  3. Li, C.; Pang, J.; Zhang, S. Apple leaf disease identification method based on feature fusion and local discriminant mapping. Guangdong Agric. Sci. 2016, 43, 134–139. [Google Scholar]
  4. Shi, Y.; Huang, W.; Zhang, S. Apple disease recognition based on two-dimensionality subspace learning. Comput. Eng. Appl. 2017, 53, 180–184. [Google Scholar]
  5. Liu, B.; Zhang, Y.; He, D.; Li, Y. Identification of apple leaf diseases based on deep convolutional neural networks. Symmetry 2017, 10, 11. [Google Scholar] [CrossRef] [Green Version]
  6. Zhang, S.; Zhang, Q.; Li, P. Apple disease recognition based on improved deep convolution neural network. J. For. Eng. 2019, 4, 107–112. [Google Scholar]
  7. Chao, X.; Sun, G.; Zhao, H.; Li, M.; He, D. Identification of apple tree leaf diseases based on deep learning models. Symmetry 2020, 12, 1065. [Google Scholar] [CrossRef]
  8. Zeng, W.; Li, M. Crop leaf disease recognition based on Self-Attention convolutional neural network. Comput. Electron. Agric. 2020, 172, 105341. [Google Scholar] [CrossRef]
  9. Wang, P.; Niu, T.; Mao, Y.; Zhang, Z.; Liu, B.; He, D. Identification of Apple Leaf Diseases by Improved Deep Convolutional Neural Networks With an Attention Mechanism. Front. Plant Sci. 2021, 12, 723294. [Google Scholar] [CrossRef]
  10. Bi, C.; Wang, J.; Duan, Y.; Fu, B.; Kang, J.R.; Shi, Y. MobileNet based apple leaf diseases identification. Mob. Netw. Appl. 2022, 27, 172–180. [Google Scholar] [CrossRef]
  11. Devlin, J.; Chang, M.; Lee, K.; Toutanova, K. Bert: Pre-training of deep bidirectional transformers for language understanding. arXiv 2018, arXiv:1810.04805. [Google Scholar]
  12. Dosovitskiy, A.; Beyer, L.; Kolesnikov, A.; Weissenborn, D.; Zhai, X.; Unterthiner, T.; Dehghani, M.; Minderer, M.; Heigold, G.; Gelly, S. An image is worth 16x16 words: Transformers for image recognition at scale. arXiv 2020, arXiv:2010.11929. [Google Scholar]
  13. Touvron, H.; Cord, M.; Douze, M.; Massa, F.; Sablayrolles, A.; Jégou, H. Training data-efficient image transformers & distillation through attention. In Proceedings of the International Conference on Machine Learning, Vienna, Austria, 18–24 July 2021; pp. 10347–10357. [Google Scholar]
  14. Yuan, L.; Chen, Y.; Wang, T.; Yu, W.; Shi, Y.; Jiang, Z.; Tay, F.E.H.; Feng, J.; Yan, S. Tokens-to-token vit: Training vision transformers from scratch on imagenet. In Proceedings of the IEEE/CVF International Conference on Computer Vision, Montreal, QC, Canada, 11–17 October 2021; pp. 558–567. [Google Scholar]
  15. Han, K.; Xiao, A.; Wu, E.; Guo, J.; Xu, C.; Wang, Y. Transformer in transformer. Adv. Neural Inf. Process. Syst. 2021, 34, 15908–15919. [Google Scholar]
  16. Wang, W.; Xie, E.; Li, X.; Fan, D.; Song, K.; Liang, D.; Lu, T.; Luo, P.; Shao, L. Pyramid vision transformer: A versatile backbone for dense prediction without convolutions. In Proceedings of the IEEE/CVF International Conference on Computer Vision, Montreal, QC, Canada, 11–17 October 2021; pp. 568–578. [Google Scholar]
  17. Liu, Z.; Lin, Y.; Cao, Y.; Hu, H.; Wei, Y.; Zhang, Z.; Lin, S.; Guo, B. Swin transformer: Hierarchical vision transformer using shifted windows. In Proceedings of the IEEE/CVF International Conference on Computer Vision, Montreal, QC, Canada, 11–17 October 2021; pp. 10012–10022. [Google Scholar]
  18. Tolstikhin, I.O.; Houlsby, N.; Kolesnikov, A.; Beyer, L.; Zhai, X.; Unterthiner, T.; Yung, J.; Steiner, A.; Keysers, D.; Uszkoreit, J. Mlp-mixer: An all-mlp architecture for vision. Adv. Neural Inf. Process. Syst. 2021, 34, 24261–24272. [Google Scholar]
  19. Howard, A.G.; Zhu, M.; Chen, B.; Kalenichenko, D.; Wang, W.; Weyand, T.; Andreetto, M.; Adam, H. Mobilenets: Efficient convolutional neural networks for mobile vision applications. arXiv 2017, arXiv:1704.04861. [Google Scholar]
  20. Wang, W.; Xie, E.; Li, X.; Fan, D.; Song, K.; Liang, D.; Lu, T.; Luo, P.; Shao, L. PVT v2: Improved baselines with Pyramid Vision Transformer. Comput. Vis. Media 2022, 8, 415–424. [Google Scholar] [CrossRef]
  21. Howard, A.; Sandler, M.; Chu, G.; Chen, L.C.; Chen, B.; Tan, M.; Adam, H. Searching for mobilenetv3. In Proceedings of the IEEE/CVF International Conference on Computer Vision, Seoul, Korea, 27 October–2 November 2019; pp. 1314–1324. [Google Scholar]
  22. He, K.; Zhang, X.; Ren, S.; Sun, J. Deep residual learning for image recognition. In Proceedings of the IEEE Conference on Computer Vision and Pattern Recognition, Las Vegas, CA, USA, 26–30 June 2016; pp. 770–778. [Google Scholar]
  23. Elvaraju, R.R.; Cogswell, M.; Das, A.; Vedantam, R.; Parikh, D.; Batra, D. Grad-cam: Visual explanations from deep networks via gradient-based localization. In Proceedings of the IEEE International Conference on Computer Vision, Venice, Italy, 22–29 October 2017; pp. 618–626. [Google Scholar]
  24. Zhang, S.; Zhang, S.; Zhang, C.; Wang, X.; Shi, Y. Cucumber leaf disease identification with global pooling dilated convolutional neural network. Comput. Electron. Agric. 2019, 162, 422–430. [Google Scholar] [CrossRef]
  25. Zhang, P.; Yang, L.; Li, D. EfficientNet-B4-Ranger: A novel method for greenhouse cucumber disease recognition under natural complex environment. Comput. Electron. Agric. 2020, 176, 105652. [Google Scholar] [CrossRef]
  26. Gao, R.; Wang, R.; Feng, L.; Li, Q.; Wu, H. Dual-branch, efficient, channel attention-based crop disease identification. Comput. Electron. Agric. 2021, 190, 106410. [Google Scholar] [CrossRef]
  27. Liu, C.; Zhu, H.; Guo, W.; Han, X.; Chen, C.; Wu, H. EFDet: An efficient detection method for cucumber disease under natural complex environments. Comput. Electron. Agric. 2021, 189, 106378. [Google Scholar] [CrossRef]
  28. Zhang, J.; Karkee, M.; Zhang, Q.; Zhang, X.; Yaqoob, M.; Fu, L.; Wang, S. Multi-class object detection using faster R-CNN and estimation of shaking locations for automated shake-and-catch apple harvesting. Comput. Electron. Agric. 2020, 173, 105384. [Google Scholar] [CrossRef]
  29. Gao, F.; Fu, L.; Zhang, X.; Majeed, Y.; Li, R.; Karkee, M.; Zhang, Q. Multi-class fruit-on-plant detection for apple in SNAP system using Faster R-CNN. Comput. Electron. Agric. 2020, 176, 105634. [Google Scholar] [CrossRef]
  30. Xu, Z.; Jia, R.; Sun, H.; Liu, Q.; Cui, Z. Light-YOLOv3: Fast method for detecting green mangoes in complex scenes using picking robots. Appl. Intell. 2020, 50, 4670–4687. [Google Scholar] [CrossRef]
  31. Shi, R.; Li, T.; Yamaguchi, Y. An attribution-based pruning method for real-time mango detection with YOLO network. Comput. Electron. Agric. 2020, 169, 105214. [Google Scholar] [CrossRef]
  32. Zhang, S.; You, Z.; Wu, X. Plant disease leaf image segmentation based on superpixel clustering and EM algorithm. Neural Comput. Appl. 2019, 31, 1225–1232. [Google Scholar] [CrossRef]
  33. Xiong, Y.; Liang, L.; Wang, L.; She, J.; Wu, M. Identification of cash crop diseases using automatic image segmentation algorithm and deep learning with expanded dataset. Comput. Electron. Agric. 2020, 177, 105712. [Google Scholar] [CrossRef]
  34. Karlekar, A.; Seal, A. SoyNet: Soybean leaf diseases classification. Comput. Electron. Agric. 2020, 172, 105342. [Google Scholar] [CrossRef]
Figure 1. Examples of self-built apple leaf disease dataset in complex backgrounds.
Agriculture 12 00884 g001
Figure 2. The overview of the model. The dots around the input image that is split into patches are filled with 0. Patch Embedding is the spreading of the input image patch into a one-dimensional vector as the input of Transformer structure, Convolution stands for convolution structure, Downsample stands for downsampling, which consists of convolution, and Transformer stands for Transformer structure.
Agriculture 12 00884 g002
Figure 3. Comparison of original Patch embedding form ViT and improved Overlapping patch embedding.
Agriculture 12 00884 g003
Figure 4. The design of the convolutional structure. The solid box on the left shows the meaning of each component.
Agriculture 12 00884 g004
Figure 5. The depthwise separable convolution feature extraction process.
Agriculture 12 00884 g005
Figure 6. The conventional convolution feature extraction process.
Agriculture 12 00884 g006
Figure 7. The design of Transformer Block, “PE” stands positional encoding.
Agriculture 12 00884 g007
Figure 8. The comparison of original MHA and linear MHA.
Agriculture 12 00884 g008
Figure 9. Performance comparison with the state-of-the-art methods.
Agriculture 12 00884 g009
Figure 10. Loss comparison with the state-of-the-art methods.
Agriculture 12 00884 g010
Figure 11. Comparison of verification accuracy for different types of apple diseases.
Agriculture 12 00884 g011
Figure 12. Selecting the best model for comparison experiments in the study.
Agriculture 12 00884 g012
Figure 13. The visual analysis of identification results of different models on the apple disease dataset, (ad) are several leaf disease samples in the dataset.
Agriculture 12 00884 g013
Table 1. The specific distribution of apple leaf disease dataset training set after data enhancement.
DiseaseNumber of Images
Alternaria leaf spot3211
Brown spot3393
Gray spot2886
Mosaic2925
Rust3419
Total15,834
Table 2. Parameter setting of each block in the model.
StageOperatorInput ChannelOutput ChannelKernel SizeStride
Patch embeddingOverlapping3332
Stage1 Conv 2 D × 2 3331
Downsample3632
Stage2 Conv 2 D × 2 6632
Downsample61232
Stage3 Conv 2 D × 2 121231
Transformer × 4   1212
Downsample122432
Stage4 Conv 2 D × 1 242431
Transformer × 1 2424
Feature FusionAvg pooling484871
Table 3. Specific experimental metrics for comparison with the state-of-the-art methods.
ModelAccuracyParamsFLOPsRecallPrecisionF1 Score
Vgg1696.13%138 M15.5 G96.2%96.19%96.20%
Resnet1895.19%11.5 M1.71 G95.19%95.27%95.23%
MobilenetV387.42%5.4 M0.22 G87.11%87.27%87.19%
Efficientnet-b090.44%5.3 M0.41 G90.19%90.23%90.21%
ViT-small96.51%22 M4.24 G96.27%96.35%96.31%
DeiT-small95.56%5.0 M1.3 G95.66%95.65%95.66%
Swin-tiny96.94%29 M4.5 G95.19%95.27%95.23%
ConvViT (ours)96.85%9.5 M0.98 G95.19%95.21%95.19%
Table 4. The parameters setting of ConvViT level model, “Conv” indicates Convolution Structure, “Trans” indicates Transformer Structure.
ModelBlock NumStage 1Stage 2Stage 3Stage 4
ConvViT1Conv2261
Trans 1
ConvViT2Conv2262
Trans
ConvViTConv2221
Trans 41
ConvViT4Conv22
Trans 62
Table 5. Comparison of specific experimental results of different models.
ModelAccuracyParamsFLOPs
ConvViT185.99%11.6 M1.56 G
ConvViT275.73%12.6 M1.7 G
ConvViT96.85%9.5 M0.98 G
ConvViT480.56%7.2 M0.73 G
Table 6. Comparison test results of original patch embedding and overlapping patch embedding on apple diseases datasets. “ConvViT” stands for adopting original patch embedding, while “ConvViT+” stands for adopting overlapping patch embedding.
ModelIdentification Accuracy
ConvViT95.36%
ConvViT+96.85%
Publisher’s Note: MDPI stays neutral with regard to jurisdictional claims in published maps and institutional affiliations.

