
A Conceptual Model for Development of Small Farm Management Information System: A Case of Indonesian Smallholder Chili Farmers


Abstract
:1. Introduction
1.1. Background
1.2. Previous Work
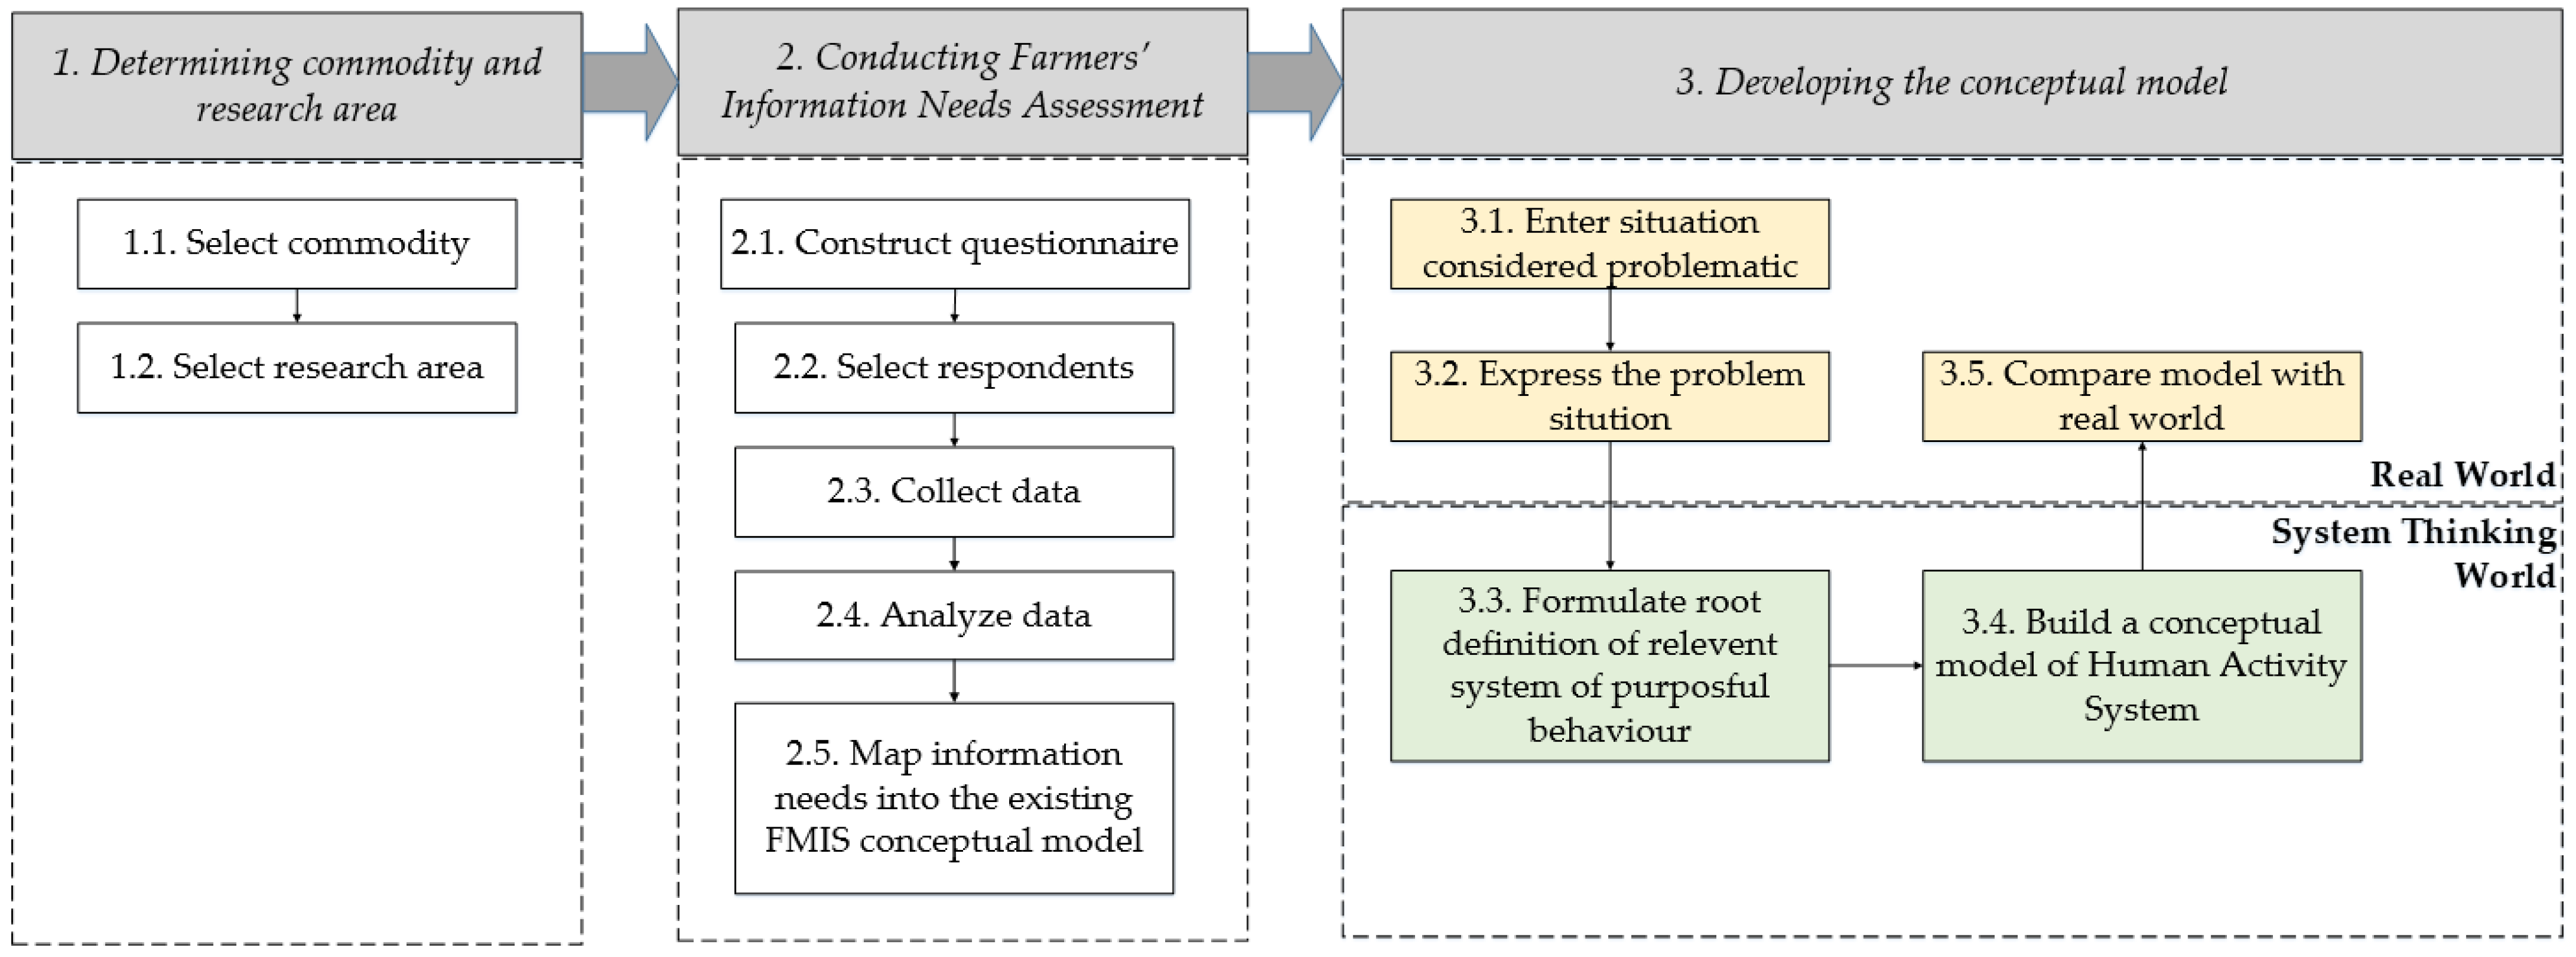
2. Methodology
2.1. Determining Commodity and Research Area
2.1.1. Select Commodity
2.1.2. Select Research Area
2.2. Conducting Farmers’ Information Needs Assessment
2.2.1. Construct a Qualitative Questionnaire
2.2.2. Select Respondents and Conduct Data Collection
2.2.3. Analyze the Data
2.2.4. Map Information Needs into the Existing FMIS functionality
2.3. Developing the Conceptual Model
2.3.1. Identify the Existing Problem Situation
2.3.2. Convert the Problem Situation into a Structured Problem
2.3.3. Formulate Root Definition of Relevant System
2.3.4. Build a Conceptual Model of the Human Activity System
2.3.5. Compare the Conceptual Model with the Identified Problem Situation
3. Results
3.1. Farmers’ Information Needs
3.1.1. Analyzing the Respondent’s Characteristics
Respondents’ Profiles
Mobile Phones Ownership
3.1.2. Analyzing the Farmers’ Information Needs
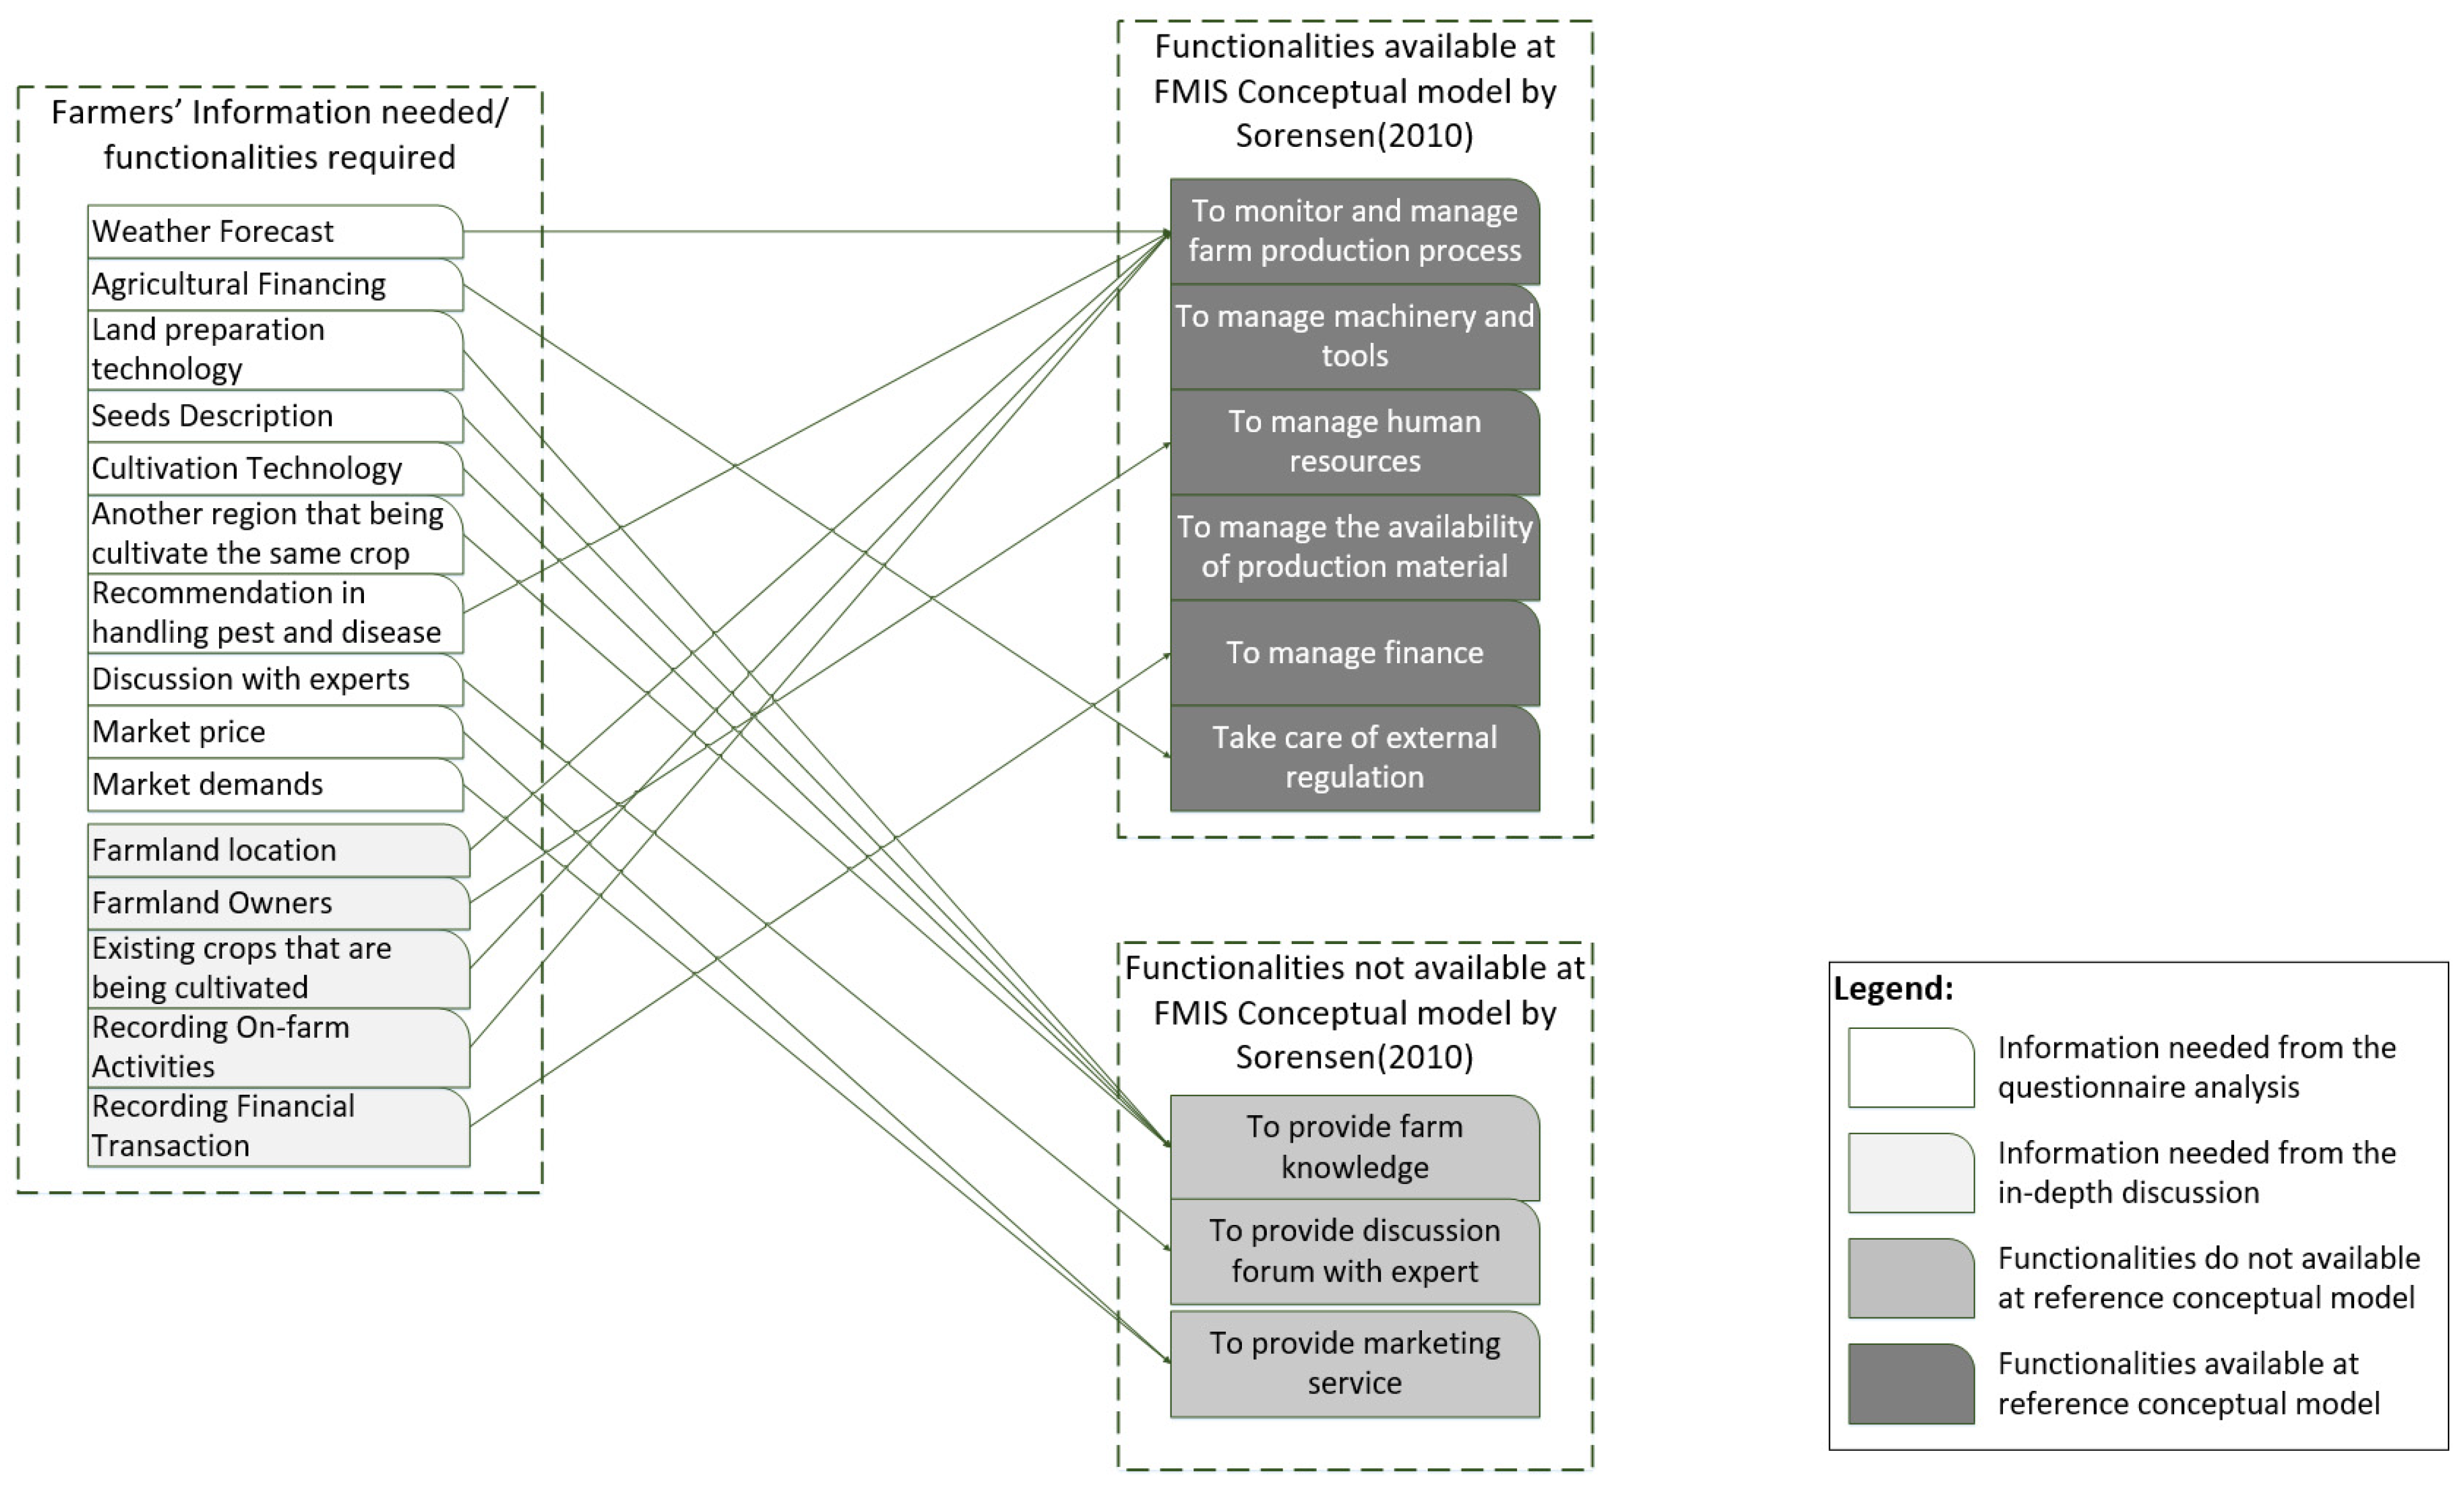
3.1.3. Mapping Farmers’ Information Needs into Existing FMIS Functionalities
3.2. Develop a Conceptual Model
3.2.1. Identifying the Existing Problem Situation
- Where do the data sources for each piece of information come from? Is this data available online?;
- What is the quality of each candidate’s data source? Are all external data sources eligible for extraction, transformation, and loading?;
- Data sources are available in many formats, what method is used to extract each data source into a temporary database?;
- What is the process of transforming and loading data from the temporary database into the application database? How the algorithm could tackle the data interoperability problems that may arise in transforming and loading data process?;
- How can information be presented to users in an easy, inexpensive, and user-friendly way?
3.2.2. Converting the Problem Situation into a Structured Problem
- External data source quality assessment;
- Data extraction for each eligible candidate’s external data source into the temporary database;
- Data loading and transformation can handle data interoperability problems that may arise.
- A friendly User Interface (UI).
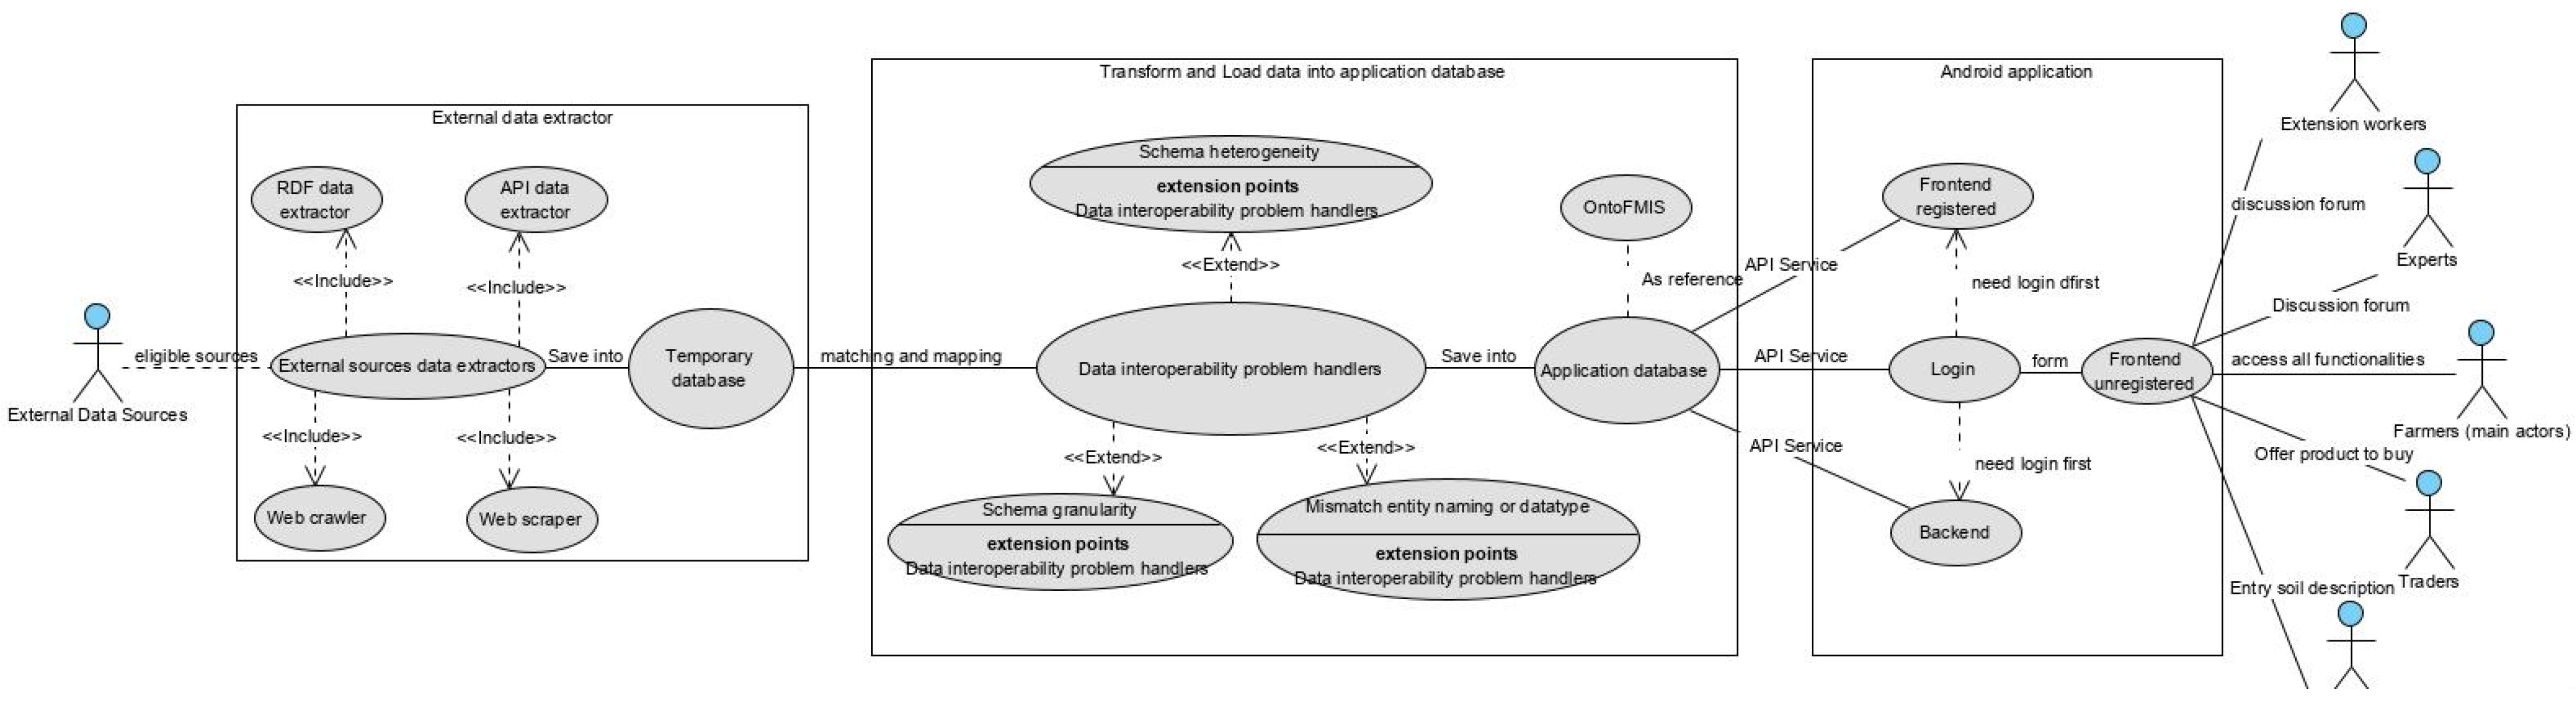
- Customer: the primary actor of this model is the farmer, and the secondary actors are traders, experts/extension workers, and local government officers;
- Actors: the primary actors of this system are external websites that supplied data to support the android application. Whereas secondary actors are a group of users that interact with the android application, such as farmland owners, farmers, traders, and other data providers;
- Transformation process: in collecting and inputting data, manually inputting data transformed into an automatic process through extracting and loading data from many external data sources;
- Worldview: external data sources that can potentially be reused by the system to help farmers decide on aspects related to their farm;
- Owners: the primary owner of this system is the researcher who develops the system, while the secondary owners are the organizations who implement and manage the system;
- Environmental constraints: the primary constraints in developing the systems are the quality of data provided by an external website and access rights to external data sources. Whereas the secondary constraints are quality of infrastructure. Minor constraints are the quality of network or Internet infrastructure when collecting data from external data sources.
3.2.3. Formulating the Root Definitions of Relevant Systems
- What does the system do? The system can collect data from many external websites and conduct the assessment of the quality of data sources, extract data, transform them and load them into the application storage using the Android application;
- How does it function? The system will perform some functions, starting with identifying candidate sources of data, collecting data from many external websites, assessing the quality of the data sources, extracting, transforming, and loading data into the application storage, and providing an android application as the interface between system and users;
- What is its purpose? The system should be easy to use by smallholder farmers. Moreover, this system should provide information deemed necessary by users. Additionally, the system should have the capability to interact with smallholder farmers, especially in managing their crop production process;
3.2.4. Building a Conceptual Model of the Human Activity System
- a
- Farmers’ Information Needs Layer
- b
- The data quality assessment layer
- c
- Data extraction layer
- d
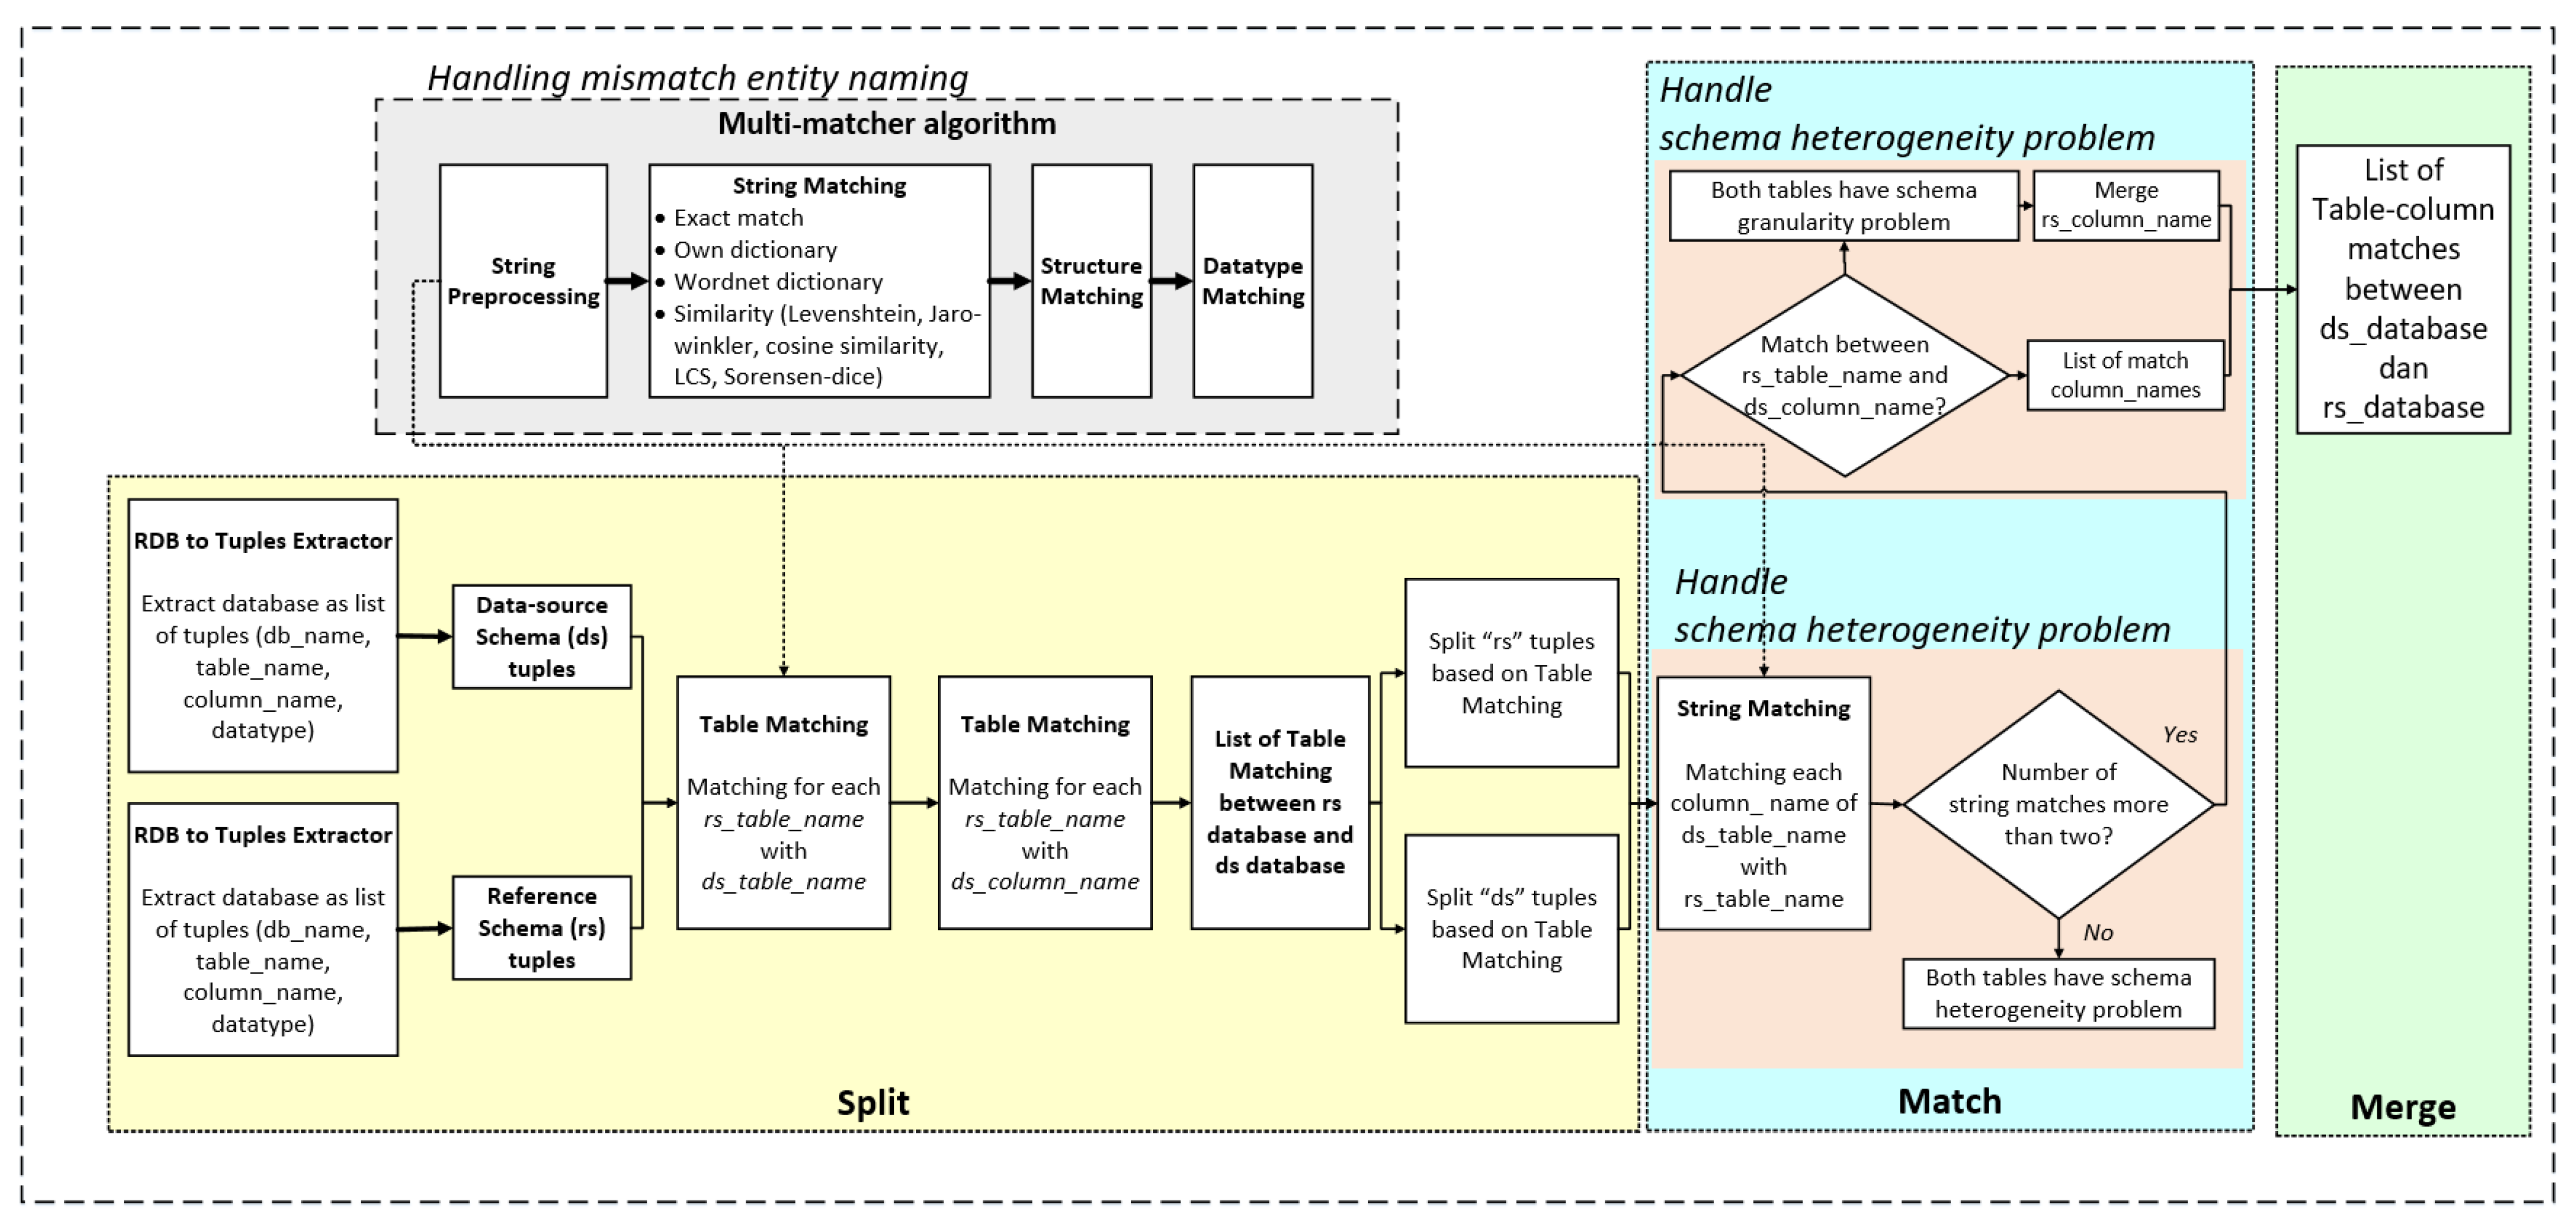
- Split, match, and merge layer
- Exact-matcher: a matcher to find whether two words exactly match;
- Word synonym: a matcher to check whether two strings are synonyms. A total of 3 sources were used as of dictionary, namely (1) Wordnet in English, (2) Wordnet in the Indonesian Language, and (3) creating own dictionary;
- Similarity matcher: a matcher to find the similarity of two terms. This study uses a hybrid model as a combination of five string-similarity algorithms, namely: (1) Levenshtein, (2) Jaro-Winkler, (3) Cosine similarity, (4) Longest Common Substring (LCS), and (5) Sorensen-dice. The result for each algorithm was normalized and following with calculation the average similarity with the acceptance score is 0.9.
- Mismatch entity naming. The mismatch entity naming is conducted by matching each entity naming of the temporary database with all entity naming of the application database. There are 236 terms extracted from the temporary database and 251 terms were extracted from the application database. Table 5 present the calculation confusion matrix for handling the mismatch entity naming problem.
- Schema heterogeneity problem. The handling schema heterogeneity problem is executed through two steps, matching the table name, and matching the entity naming for each matched table. Table 6 presents the calculation of the confusion matrix in handling the schema heterogeneity problem.
- Schema granularity problem. The handling schema granularity problem is executed by matching the entity naming of the table of the application database into the table name of the temporary database and matching the entity naming of the table of the temporary database into the table name of the application database. The confusion matrix in handling schema heterogeneity problem is presented in Table 7.
- Handling data interoperability problems comprehensively. Besides the performance in handling data interoperability problems individually, the algorithm performance evaluation is also conducted in handling data interoperability problems comprehensively. Table 6 present the result of the confusion matrix of TP, TN, FP, and FN.
- e
- Presentation/user interface layer
3.2.5. Comparing the Conceptual Model with the Identified Problem Situation
4. Discussion
5. Conclusions
Author Contributions
Funding
Institutional Review Board Statement
Informed Consent Statement
Data Availability Statement
Acknowledgments
Conflicts of Interest
Appendix A

| No. | Agribusiness Sub-System | Information Needed | Occurrence Frequency |
| 1 | Pre-planting | agricultural financing | 106 |
| land preparation | 97 | ||
| another region with the same crop | 60 | ||
| seed description | 59 | ||
| machinery description | 46 | ||
| agricultural machinery | 23 | ||
| agricultural insurance | 15 | ||
| seed production technology | 9 | ||
| soil characteristic | 6 | ||
| seed availability | 5 | ||
| fertilizer and seed subsidies | 3 | ||
| 2 | Planting | cultivation technology | 233 |
| handling pest and disease | 65 | ||
| weather forecast | 54 | ||
| seed recommendation | 4 | ||
| labor availability | 2 | ||
| 3 | Harvesting | packaging | 22 |
| storage technology | 19 | ||
| grading | 5 | ||
| yield processing | 3 | ||
| Warehouse | 2 | ||
| 4 | Marketing | market price | 128 |
| market demand | 68 | ||
| marketing | 42 | ||
| transportation | 41 | ||
| 5 | Support | consultation | 96 |
| training | 40 | ||
| assistance | 20 | ||
| regulation | 11 | ||
| management | 10 | ||
| technical support | 4 | ||
| Total | 1298 |
Appendix B
| No. | Functionalities | Candidate Data Sources (If Available) |
| 1 | Farmland location | Google Map, Open Street Map |
| 2 | Weather forecast | Open Weather Map, BMKG, World Bank |
| 3 | On-farm activities | Manual data entry |
| 4 | Handling pest and disease | Opete, IAARD, ICHORT, MyAgri, SIPINDO |
| 5 | Existing crops that are being cultivated | Manual data entry |
| 6 | Farmland owners’ profile | Manual data entry |
| 7 | Financial transaction recording | Manual data entry |
| 8 | Agricultural financing | KUR (Kredit Usaha Rakyat)/people’s business credit from Ministry Coordinator of Finance, Google News |
| 9 | Land preparation technology | Cyber extension, IAARD, Youtube |
| 10 | Seeds description | PPVT, IAARD, MyAgri, DBVaritas |
| 11 | Cultivation technology | Cyber extension, IAARD, Youtube, Repositori Publikasi, SIPINDO, ITani, Digitani |
| 12 | Another region cultivating the same crop | Generate by application |
| 13 | Consultation | Manual data entry |
| 14 | Market demand | Manual data entry |
| 15 | Market price | Toko tani BKP, PIHPS, Shopee, Bukalapak, Sayurbox, Tanihub, Info pangan Jakarta |
Appendix C
| No. | Functionality | Candidate External Data Source | Access w = 0.28 | Lice w = 0.22 | Sour w = 0.17 | Conn w = 0.13 | Accu w = 0.09 | Comp w = 0.06 | Cons w = 0.04 | Time w = 0.2 | Total Score | Decision ≥8 |
| 1 | Farmland location | Open Street Map | 2.52 | 1.76 | 1.53 | 1.04 | 0.81 | 0.48 | 0.36 | 0.18 | 8.68 | accepted |
| Google Map | 2.52 | 1.98 | 1.53 | 1.17 | 0.81 | 0.54 | 0.36 | 0.18 | 9.09 | accepted | ||
| 2 | Weather forecast | Forecast—OWN | 2.24 | 1.76 | 1.53 | 1.17 | 0.81 | 0.54 | 0.32 | 0.18 | 8.55 | accepted |
| BMKG | 2.52 | 1.54 | 1.53 | 1.04 | 0.81 | 0.42 | 0.32 | 0.16 | 8.34 | accepted | ||
| World Bank | 2.24 | 1.76 | 1.53 | 1.17 | 0.81 | 0.42 | 0.36 | 0.16 | 8.45 | accepted | ||
| 3 | Agricultural Financing | Ministry Coordinator of Finance | 2.52 | 1.98 | 1.53 | 0.91 | 0.81 | 0.54 | 0.28 | 0.18 | 8.75 | accepted |
| News—Google search | 2.52 | 1.98 | 1.53 | 0.91 | 0.81 | 0.54 | 0.28 | 0.18 | 8.75 | accepted | ||
| 4 | Land Preparation | IAARD | 2.52 | 1.98 | 1.53 | 0.91 | 0.72 | 0.54 | 0.32 | 0.18 | 8.70 | accepted |
| Youtube | 2.52 | 1.98 | 1.53 | 0.78 | 0.81 | 0.48 | 0.32 | 0.16 | 8.58 | accepted | ||
| Cyber extension | 2.52 | 1.98 | 1.53 | 0.91 | 0.81 | 0.54 | 0.32 | 0.16 | 8.77 | accepted | ||
| 5 | Cultivation technology | IAARD | 2.52 | 1.98 | 1.53 | 0.91 | 0.81 | 0.48 | 0.32 | 0.16 | 8.71 | accepted |
| Youtube | 2.24 | 1.98 | 1.36 | 1.17 | 0.72 | 0.54 | 0.32 | 0.18 | 8.51 | accepted | ||
| Cyber extension | 2.52 | 1.98 | 1.53 | 0.91 | 0.81 | 0.54 | 0.32 | 0.16 | 8.77 | accepted | ||
| Repositori publikasi | 2.52 | 1.98 | 1.53 | 0.91 | 0.81 | 0.54 | 0.32 | 0.16 | 8.77 | accepted | ||
| Sipindo | 1.40 | 1.10 | 1.36 | 0.65 | 0.81 | 0.42 | 0.20 | 0.16 | 6.10 | rejected | ||
| Itani | 1.40 | 1.10 | 1.53 | 0.65 | 0.81 | 0.42 | 0.20 | 0.16 | 6.27 | rejected | ||
| Digitani | 1.40 | 1.10 | 1.53 | 0.65 | 0.81 | 0.42 | 0.20 | 0.16 | 6.27 | rejected | ||
| 6 | Seed description | PPVT | 1.40 | 1.10 | 1.53 | 0.65 | 0.81 | 0.48 | 0.32 | 0.10 | 6.39 | rejected |
| DBVaritas—DG of Horticulture | 2.52 | 1.98 | 1.19 | 0.91 | 0.72 | 0.48 | 0.28 | 0.16 | 8.24 | accepted | ||
| MyAgri | 1.40 | 1.10 | 1.53 | 0.65 | 0.81 | 0.42 | 0.20 | 0.16 | 6.27 | rejected | ||
| 7 | Handling Pest disease | IAARD | 2.52 | 1.98 | 1.53 | 0.91 | 0.81 | 0.36 | 0.32 | 0.16 | 8.59 | accepted |
| OPETE | 2.52 | 1.98 | 1.19 | 0.91 | 0.81 | 0.36 | 0.32 | 0.16 | 8.25 | accepted | ||
| MyAgri | 1.40 | 1.10 | 1.53 | 0.65 | 0.81 | 0.42 | 0.20 | 0.16 | 6.27 | rejected | ||
| Sipindo | 1.40 | 1.10 | 1.36 | 0.65 | 0.81 | 0.42 | 0.20 | 0.16 | 6.10 | rejected | ||
| Expert system—ICHORD | 2.52 | 1.98 | 1.53 | 0.91 | 0.81 | 0.36 | 0.32 | 0.14 | 8.57 | accepted | ||
| 8 | Market price | Toko tani—BKP | 2.52 | 1.98 | 1.53 | 0.91 | 0.72 | 0.42 | 0.28 | 0.16 | 8.52 | accepted |
| PIHPS | 2.52 | 1.98 | 1.53 | 0.91 | 0.72 | 0.42 | 0.28 | 0.16 | 8.52 | accepted | ||
| Shopee | 2.52 | 1.98 | 1.19 | 0.91 | 0.72 | 0.54 | 0.28 | 0.16 | 8.30 | accepted | ||
| Bukalapak | 2.52 | 1.98 | 1.19 | 0.91 | 0.72 | 0.54 | 0.28 | 0.16 | 8.30 | accepted | ||
| Sayurbox | 2.52 | 1.98 | 1.19 | 0.91 | 0.72 | 0.48 | 0.28 | 0.16 | 8.24 | accepted | ||
| Tanihub | 2.52 | 1.98 | 1.19 | 0.91 | 0.72 | 0.42 | 0.28 | 0.16 | 8.18 | accepted | ||
| info pangan jakarta | 2.52 | 1.98 | 1.53 | 0.78 | 0.63 | 0.42 | 0.24 | 0.16 | 8.26 | accepted |
References
- Burlacu, G.; Costa, R.; Sarraipa, J.; Jardim-Goncalves, R.; Popescu, D. A conceptual model of Farm Management Information System for Decision Support. In Technological Innovation for Collective Awareness Systems; DoCEIS 2014. IFIP Advances in Information and Communication Technology; Springer: Berlin/Heidelberg, Germany, 2014; Volume 423. [Google Scholar] [CrossRef] [Green Version]
- Fountas, S.; Carli, G.; Sørensen, C.G.G.; Tsiropoulos, Z.; Cavalaris, C.; Vatsanidou, A.; Liakos, B.; Canavari, M.; Wiebensohn, J.; Tisserye, B. Farm management information systems: Current situation and future perspectives. Comput. Electron. Agric. 2015, 115, 40–50. [Google Scholar] [CrossRef] [Green Version]
- Tummers, J.; Kassahun, A.; Tekinerdogan, B. Obstacles and features of Farm Management Information Systems: A systematic literature review. Comput. Electron. Agric. 2019, 157, 189–204. [Google Scholar] [CrossRef]
- Husemann, C. The Model of Farm Management Information System: A Case-Study of Diversified German Farm Model. DETUROPE Cent. Eur. J. Reg. Dev. Tour. 2012, 4, 76–90. [Google Scholar] [CrossRef]
- Fountas, S.; Sorensen, C.G.; Tsiropoulos, Z.; Cavalaris, C.; Liakos, V.; Gemtos, T. Farm machinery management information system. Comput. Electron. Agric. 2015, 110, 131–138. [Google Scholar] [CrossRef]
- Kaloxylos, A.; Groumas, A.; Sarris, V.; Katsikas, L.; Magdalinos, P.; Antoniou, E.; Politopoulou, Z.; Wolfert, S.; Brewster, C.; Eigenmann, R.; et al. A cloud-based farm management system: Architecture and implementation. Comput. Electron. Agric. 2014, 100, 168–179. [Google Scholar] [CrossRef]
- Graeub, B.E.; Chappell, M.J.; Wittman, H.; Ledermann, S.; Kerr, R.B.; Gemmill-Herren, B. The State of Family Farms in the World. World Dev. 2016, 87, 1–15. [Google Scholar] [CrossRef] [Green Version]
- Nguo, J.; Mwangi, S.; Melly, S. Family Farmers: Feeding the World, Caring for the Earth; FAO-The United Nations: Rome, Italy, 2014; pp. 1–3. [Google Scholar]
- Calcaterra, E. Defining Smallholders Suggestions for a RSB Smallholder Definitions; Aidenvironment: Amsterdam, The Netherland, 2013. [Google Scholar]
- Henriyadi, B.; Esichaikul, V.; Anutariya, C. Split-Match-Merge Method with Multi-matcher Algorithm to Handle Data Interoperability Problems in Small Farm Management Information System. In Proceedings of the 17th International Conference on Computing and Information Technology (IC2IT 2021), Bangkok, Thailand, 13–14 May 2021; Volume 1, pp. 1–12. [Google Scholar]
- Bachhav, N.B. Information Needs of the Rural Farmers: A Study from Maharashtra, India: A Survey. 2012. Paper 866. Available online: https://digitalcommons.unl.edu/libphilprac/866/ (accessed on 14 April 2022).
- Meitei, L.S.; Purnima, T. Farmers information needs in rural Manipur: An assessment. Ann. Libr. Inf. Stud. 2009, 56, 35–40. [Google Scholar]
- Yusuf, S.F.G.; Masika, P.; Ighodaro, D.I. Agricultural Information Needs of Rural Women Farmers in Nkonkobe Municipality: The Extension Challenge. J. Agric. Sci. 2013, 5, 107. [Google Scholar] [CrossRef]
- Daramola, C.F.; Adebo, T.I.; Adebo, G.M. Challenges and Information Needs Assessment of Dry Season Vegetable Farmers in Akure Metropolis, Ondo State. IOSR J. Agric. Vet. Sci. Ver. I 2016, 9, 52–58. [Google Scholar] [CrossRef]
- Subash, S.; Gupta, J.; Babu, G.P. Information Needs Assessment and Prioritization of Dairy Farmers. J. Krishi Vigyan 2015, 4, 51. [Google Scholar] [CrossRef]
- Babu, S.C.; Glendenning, C.J.; Asenso-Okyere, K.; Govindarajan, S.K. Farmers’ Information Needs and Search Behaviors: Case Study in Tamil Nadu; IFPR: New Delhi, India, 2012. [Google Scholar]
- Elly, T. Agricultural information needs and sources of the rural farmers in Tanzania A case of Iringa rural district. Libr. Rev. 2013, 62, 266–292. [Google Scholar] [CrossRef] [Green Version]
- Naveed, M.A.; Anwar, M.A. Agricultural information needs of Pakistani farmers. Malays. J. Libr. Inf. Sci. 2013, 18, 13–23. [Google Scholar]
- John, O.; Wakilu, O.; Olateju, A. Agricultural information needs of farmers in Lagos. Int. J. Agric. Sci. Res. 2013, 2, 116–123. [Google Scholar]
- Husemann, C.; Novkovic, N.; Novković, N. Farm management information systems: A case study on a German multifunctional farm. Ekon. Poljopr. 2014, 61, 441–453. [Google Scholar] [CrossRef] [Green Version]
- Wolfert, S.; Ge, L.; Verdouw, C.; Bogaardt, M.J. Big Data in Smart Farming—A review. Agric. Syst. 2017, 153, 69–80. [Google Scholar] [CrossRef]
- Kruize, J.W.; Wolfert, J.; Scholten, H.; Verdouw, C.N.; Kassahun, A.; Beulens, A.J.M. Original papers A reference architecture for Farm Software Ecosystems. Comput. Electron. Agric. 2016, 125, 12–28. [Google Scholar] [CrossRef] [Green Version]
- Cruz, I.F. AgreementMaker: Efficient Matching for Large Real-World Schemas and Ontologies. In Proceedings of the VLDB ‘09, Lyon, France, 24–28 August 2009; pp. 1586–1589. [Google Scholar]
- Aumueller, D.; Do, H.-H.; Massmann, S.; Rahm, E. COMA++—Schema and ontology matching with COMA. In Proceedings of the 2005 ACM SIGMOD International Conference on Management of Data, Baltimore, MA, USA, 14–16 June 2005; p. 906. [Google Scholar] [CrossRef]
- Madhavan, J.; Bernstein, P.A.; Rahm, E.; Bernstein, P.A. Generic Schema Matching with Cupid. VLDB 2001, 10, 49–58. [Google Scholar] [CrossRef] [Green Version]
- Hu, W.; Qu, Y. Falcon-AO: A practical ontology matching system. Web Semant. 2008, 6, 237–239. [Google Scholar] [CrossRef]
- Shvaiko, P.; Giunchiglia, F.; Yatskevich, M. Semantic Matching with S-Match. In Semantic Web Information Management: A Model-Based Perspective; de Virgilio, R., Giunchiglia, F., Tanca, L., Eds.; Springer: Berlin/Heidelberg, Germany, 2010; pp. 1–20. ISBN 978-3-642-04328-4. [Google Scholar]
- Jain, S.; Tanwani, S. Schema matching technique for heterogeneous web database. In Proceedings of the 2015 4th International Conference on Reliability, Infocom Technologies and Optimization (ICRITO) (Trends and Future Directions), Noida, India, 2–4 September 2015; 2. [Google Scholar] [CrossRef]
- Rachman, M.A.F.; Saptawati, G.A.P. Database integration based on combination schema matching approach (case study: Multi-database of district health information system). In Proceedings of the2017 2nd International Conferences on Information Technology, Information Systems and Electrical Engineering (ICITISEE), Yogyakarta, Indonesia, 1–2 November 2017; pp. 430–435. [Google Scholar] [CrossRef]
- Do, H.H. Schema Matching and Mapping-Based Data Integration; Interdisciplinary Center for Bioinformatics and Department of Computer Science University of Leipzig Germany: Leipzig, Germany, 2006. [Google Scholar]
- Giua, C.; Materia, V.C.; Camanzi, L. Management information system adoption at the farm level: Evidence from the literature. Br. Food J. 2021, 123, 884–909. [Google Scholar] [CrossRef]
- Purnawan, E.; Brunori, G.; Prosperi, P. Small Family Farms; A Perspective from Indonesia, Challenges and Investment. No. Dec. 2020. [Google Scholar] [CrossRef]
- Masriwilaga, A.A.; Munadi, R.; Rahmat, B. Wireless Sensor Network for Monitoring Rice Crop Growth. MESA Tek. Mesin Tek. Elektro 2018, 5, 47–52. [Google Scholar]
- Fitriana, G.F.; Prasetyo, N.A.; Engineering, S.; Java, C.; Sprint, M. Rice Planting Calendar Application Development using Scrum. IJCCS Indones. J. Comput. Cybern. Syst. 2022, 16, 169–180. [Google Scholar] [CrossRef]
- Srihartanto, E.; Widodo, S. The Potency of the Rice Crop Index Development through Adjustment of Agroclimate and Water Management Situated in Rainfed Field Gunungkidul. Agromet 2020, 34, 75–88. [Google Scholar] [CrossRef]
- Hakim, V.A.A.; Wibowo, A.; Wibowo, H.; Bhandralia, A.; Arya, R.; Panda, S.N.; Ahuja, S.; Fitriana, G.F.; Prasetyo, N.A.; Engineering, S.; et al. Analisa Pengembangan Drone Penyemprotan Hama Tanaman Dengan Jenis Nosel Dan Ketinggian Untuk Mengetahui Luas Semprotan. Int. J. Adv. Appl. Sci. 2019, 5, 64–69. [Google Scholar] [CrossRef]
- Bhandralia, A.; Arya, R.; Panda, S.N.; Ahuja, S. Polyhouse Agricultural Marketing System Using Big Data Hadoop. Int. J. Adv. Appl. Sci. 2016, 5, 78–84. [Google Scholar] [CrossRef] [Green Version]
- Yanuarti, A.R.; Afsari, M.D. Profil Komoditas Barang Kebutuhan Pokok dan Barang Penting Komoditas Cabai; Direktorat Jenderal Perdagangan Dalam Negeri Kementerian Perdagangan: Jakarta, Indonesia, 2016; p. 68. [Google Scholar]
- Direktorat Kredit BPR dan UKM Bank Indoensia PPUK-Budidaya Cabai Merah; Bank Indonesia: Jakarta, Indonesia, 2014.
- Sørensen, C.G.; Fountas, S.; Nash, E.; Pesonen, L.; Bochtis, D.; Pedersen, S.M.; Basso, B.; Blackmore, S.B. Conceptual model of a future farm management information system. Comput. Electron. Agric. 2010, 72, 37–47. [Google Scholar] [CrossRef] [Green Version]
- Checkland, P. Information systems and systems thinking: Time to unite? Int. J. Inf. Manag. 1988, 8, 239–248. [Google Scholar] [CrossRef]
- Checkland, P.; Poulter, J. Soft System Methodology. In Systems Approaches to Managing Change: A Practical Guide; Reynolds, M., Holwell, S., Eds.; Springer: Berlin/Heidelberg, Germany, 2010; pp. 191–242. ISBN 978-1-84882-809-4. [Google Scholar]
- Mehregan, M.R.; Hosseinzadeh, M.; Kazemi, A. An application of Soft System Methodology. Procedia-Soc. Behav. Sci. 2012, 41, 426–433. [Google Scholar] [CrossRef] [Green Version]
- Zaveri, A.; Rula, A.; Maurino, A.; Pietrobon, R.; Lehmann, J. Quality Assessment for Linked Data: A Survey. Semant. Web 2012, 1, 63–93. [Google Scholar] [CrossRef]
- Vetrò, A.; Canova, L.; Torchiano, M.; Minotas, C.O.; Iemma, R.; Morando, F. Open data quality measurement framework: Definition and application to Open Government Data. Gov. Inf. Q. 2016, 33, 325–337. [Google Scholar] [CrossRef] [Green Version]
- Assaf, A.; Senart, A. Data Quality Principle in the Semantic Web. In Proceedings of the 2012 IEEE Sixth International Conference on Semantic Computing, Palermo, Italy, 19–21 September 2012. [Google Scholar]
- Veiga, A.K.; Saraiva, A.M.; Chapman, A.D.; Morris, P.J.; Gendreau, C.; Schigel, D.; Robertson, T.J. A conceptual framework for quality assessment and management of biodiversity data. PLoS ONE 2017, 12, e0178731. [Google Scholar] [CrossRef] [PubMed] [Green Version]
- Batini, C.; Cappiello, C.; Francalanci, C.; Maurino, A. Methodologies for data quality assessment and improvement. ACM Comput. Surv. 2009, 41, 1–52. [Google Scholar] [CrossRef] [Green Version]
- Cai, L.; Zhu, Y.; Weiskopf, N.G.; Weng, C.; Webzell, S. Methods and dimensions of electronic health record data quality assessment: Enabling reuse for clinical research. J. Am. Med. Inform. Assoc. 2013, 20, 144–151. [Google Scholar] [CrossRef] [Green Version]
- Wickham, H. The Split-Apply-Combine Strategy for Data Analysis. J. Stat. Softw. 2011, 40, 1–29. [Google Scholar] [CrossRef] [Green Version]
- Murakami, E.; Saraiva, A.M.; Ribeiro, L.C.M.; Cugnasca, C.E.; Hirakawa, A.R.; Correa, P.L.P. An infrastructure for the development of distributed service-oriented information systems for precision agriculture. Comput. Electron. Agric. 2007, 58, 37–48. [Google Scholar] [CrossRef]
- Wang, W.; Reani, M. The rise of mobile computing for Group Decision Support Systems: A comparative evaluation of mobile and desktop. Int. J. Hum. Comput. Stud. 2017, 104, 16–35. [Google Scholar] [CrossRef] [Green Version]


| Variable | Total Respondents n = 50 | p-Value |
|---|---|---|
| Age (mean ± SD, range (in years old)) | 37.6 ± 9.7 (16–57) | <0.01 |
| Education Level (n, %) | ||
| Primary school | 25 (50%) | |
| Secondary School | 16 (32%) | <0.01 |
| High school | 8 (16%) | |
| Bachelor | 1 (2%) | |
| Experience (mean ± SD, range, in years) | 13.5 ± 9.2 (1–35) | <0.01 |
| Land ownership (n, %) | ||
| Owned | 10 (20%) | |
| Rental | 39 (78%) | <0.01 |
| Owned and rental | 1 (2%) | |
| Cultivation area (mean ± SD, range, in Ha) | 0.57 ± 0.48 (0.1–2) | <0.01 |
| Variable | Criteria/Range | Frequency | Percentage |
|---|---|---|---|
| Mobile phone ownership | No | 14 | 28% |
| Yes | 36 | 72% | |
| Total | 50 | 100% | |
| Mobile phone operating system | Android | 31 | 62% |
| Feature phone | 5 | 10% | |
| No phone | 14 | 28% | |
| IOS | 0 | 0% | |
| Total | 50 | 100% | |
| Subscription to an Internet package | No | 7 | 14% |
| Yes | 24 | 48% | |
| No phone | 14 | 28% | |
| Feature phone | 5 | 10% | |
| Total | 50 | 100% | |
| Average expenditure on monthly | 0–25,000 | 3 | 6% |
| data package (in IDR) | 25,001–50,000 | 7 | 14% |
| 50,001–75,000 | 6 | 12% | |
| 75,001–100,000 | 8 | 16% | |
| No phone | 14 | 28% | |
| Not support | 5 | 10% | |
| Total | 50 | 100% |
| Source of Data | Information Needed | Occurrence Frequency |
|---|---|---|
| Word frequency analysis | cultivation technology | 233 |
| market price | 128 | |
| agricultural financing | 106 | |
| land preparation | 97 | |
| consultation | 96 | |
| market demand | 68 | |
| handling pest and disease | 65 | |
| another region with the same crop | 60 | |
| seed description | 59 | |
| weather forecast | 54 | |
| In-depth discussion | farmland location | n.a |
| Farmland owner | n.a | |
| the existing crop that is being cultivated | n.a | |
| financial record keeping | n.a | |
| recording their cultivation activities | n.a |
| Weighting Score | Scoring Criteria | ||||||
|---|---|---|---|---|---|---|---|
| No. | Dimensions | 5 | 6 | 7 | 8 | 9 | |
| 1 | Accessibility | 0.28 | protected | login and sent via email | login and download file | free with key | free access |
| 2 | License | 0.22 | copyright | limited free for registered user | free for registered user | free limited service | free |
| 3 | Source reliability | 0.17 | personal blog/others | others’ company | Other organization | well-known company | Government/international org |
| 4 | Connectedness | 0.13 | others | html | XLS/csv | API/RDF | |
| 5 | Accuracy | 0.09 | very low | low | medium | high | very high |
| 6 | Completeness | 0.06 | 20% | 40% | 60% | 80% | 100% |
| 7 | Format Consistency | 0.04 | not use standard, inconsistent | not use standard, inconsistent | not use standard, consistent | use standard, inconsistent | use standard, consistent |
| 8 | Timeliness | 0.02 | never | seldom | sometime | often | always |
| Manual Checking | |||
|---|---|---|---|
| True | False | ||
| A split-match-merge method with a multi-matcher algorithm | Positive | TP = 138 | FP = 18 |
| Negative | TN = 59,068 | FN = 4 | |
| Manual Checking | |||
|---|---|---|---|
| True | False | ||
| A split-match-merge method with a multi-matcher algorithm | Positive | TP = 186 | FP = 6 |
| Negative | TN = 6874 | FN = 8 | |
| Manual Checking | |||
|---|---|---|---|
| True | False | ||
| A split-match-merge method with a multi-matcher algorithm | Positive | TP = 88 | FP = 5 |
| Negative | TN = 30,139 | FN = 12 | |
Publisher’s Note: MDPI stays neutral with regard to jurisdictional claims in published maps and institutional affiliations. |
© 2022 by the authors. Licensee MDPI, Basel, Switzerland. This article is an open access article distributed under the terms and conditions of the Creative Commons Attribution (CC BY) license (https://creativecommons.org/licenses/by/4.0/).
Share and Cite
Henriyadi, H.; Esichaikul, V.; Anutariya, C. A Conceptual Model for Development of Small Farm Management Information System: A Case of Indonesian Smallholder Chili Farmers. Agriculture 2022, 12, 866. https://doi.org/10.3390/agriculture12060866
Henriyadi H, Esichaikul V, Anutariya C. A Conceptual Model for Development of Small Farm Management Information System: A Case of Indonesian Smallholder Chili Farmers. Agriculture. 2022; 12(6):866. https://doi.org/10.3390/agriculture12060866
Chicago/Turabian StyleHenriyadi, Henriyadi, Vatcharaporn Esichaikul, and Chutiporn Anutariya. 2022. "A Conceptual Model for Development of Small Farm Management Information System: A Case of Indonesian Smallholder Chili Farmers" Agriculture 12, no. 6: 866. https://doi.org/10.3390/agriculture12060866