Article

Carbonated Irrigation Assessment of Grapevine Growth, Nutrient Absorption, and Sugar Accumulation in a Tempranillo (Vitis vinifera L.) Vineyard

1
Departament de Bioquímica i Biotecnologia, Facultat d’Enologia de Tarragona, Universitat Rovira i Virgili, Campus Sescelades, Marcel·lí Domingo s/n, 43007 Tarragona, Spain
2
Unité de Recherche Œnologie, Molécules d’Intérêt Biologique, Université de Bordeaux, ISVV, EA 4577, USC 1366 INRA, 210 Chemin de Leysotte, F-33882 Villenave d’Ornon, France
*
Author to whom correspondence should be addressed.
Agriculture 2022, 12(6), 792; https://doi.org/10.3390/agriculture12060792
Submission received: 26 April 2022 / Revised: 25 May 2022 / Accepted: 27 May 2022 / Published: 30 May 2022

Abstract

:
Iron chlorosis is common in vineyards grown on calcareous soils, and consists of a chlorophyll deficiency caused by a disorder in iron nutrition. It is manifested by interveinal yellowing of the youngest leaves and decreased growth and production. Most of the vineyards in Spain are planted on calcareous soils, so iron chlorosis is frequent, even in tolerant rootstocks. In the case of Spain, Tempranillo accounts for 20.8% of the total Spanish wine area, with this red variety being the most planted. The study of iron chlorosis and the availability of nutrients is essential for improving the qualitative balance of the wine, as it is one of the most representative in our country. The aim of this work was to evaluate how carbonated irrigation modifies soil pH and increases the absorption of nutrients, as well as to assess the impact of chlorosis on the physiology of the variety and the composition of the grape. In the first instance, a test was carried out on bare soil of calcareous composition, evaluating three different levels of carbonated water, and seeing what response it gave to the pH level. The result showed that the dose of 400 ppm of CO2 provided the optimal pH. Subsequently, in a potted soil, the dose of 400 ppm of CO2 was evaluated on the variety cv. Tempranillo, in three different compositions of calcareous soil. Results showed that carbonated irrigation increased the levels of chlorophyll impacting on primary metabolism (acids and sugar), plant growth, and higher crop yield, improving the optimal grape ripeness. Given that irrigation with 400 ppm CO2 increased the ability to control ferric chlorosis, this strategy could be an easy-to-use alternative to iron-based chelates for preventing Fe deficiency in the grapevine as well as moderating the different levels of iron chlorosis. This strategy could be an alternative to the use of synthetic Fe chelates as EDTA or o,o-EDDHA for preventing Fe chlorosis in susceptible Tempranillo (Vitis vinifera L.) vineyard in calcareous soils, with less of a risk to the environment.

1. Introduction

Calcareous soils are characterized by high pH, decreased micronutrient absorption [1], and increase in iron deficiency chlorosis [2]. Bicarbonate content in the soil has been highlighted as the major cause of chlorosis [2,3,4], which is a disease that causes an iron blockage and, consequently, inhibits the synthesis of chlorophyll until finally the symptoms of chlorosis appear [4]. It was proposed in a previous hypothesis that bicarbonate-induced chlorosis is caused by the transport of bicarbonate into the plant, leading to an alkalization of the xylem sap and, in turn, of the leaf apoplast [5]. However, there are other results showing that bicarbonate does not cause a physiologically relevant increase in the xylem sap/leaf apoplastic fluid pH in several plant species, including grapes (Vitis vinifera L.) [6].
Iron deficiency chlorosis in grapevines causes strong morphological and physiological parameter limitations [7,8]. Physiological stress caused by calcareous soil conditions has a great impact on vegetative growth, fruit yield, and grape composition and quality [9,10]. Cultivated plants, grapevines included, differ in their susceptibility to iron deficiency in calcareous soils. Some are only mildly affected (tolerant varieties) [11], while others show severe leaf chlorosis symptoms (sensitive varieties), depending on the variety and rootstock [12,13]. Tolerant varieties have developed physiological changes, such as an increase in the iron reductase capacity and proton extrusion in the rhizosphere region that increases the Fe absorption [14]. In contrast, it has also been demonstrated that tolerant grapevine genotypes may increase the activity of the enzyme phosphoenolpyruvate carboxylase (PEPC) and the concentration of organic acids in roots (particularly citric acid) as a response to iron deficiency [9]. Under iron starvation conditions, modification of the expression of genes involved in iron uptake and transport also occurs [15].
A traditional method used to prevent iron chlorosis has been the use of Fe deficiency-tolerant rootstocks such as 140 Ruggeri [2,13,14,16,17]. The use of American rootstocks became necessary in grapevine cultivars after the plague of phylloxera, and an added benefit was that they prevented iron-deficiency chlorosis [18]. In some important viticultural areas, especially from the Mediterranean area, such as Spain, France, and Italy, with limestone soils [17,19,20,21,22,23], growers often apply synthetic Fe chelates to prevent the occurrence of Fe deficiency [2,14], and other viable techniques are the addition of organic matter [9,24,25] to the soil to increase the exchange capacity between cations and iron chelates. The use of acid irrigation has been adopted to decrease soil pH and increase nutrient absorption to prevent Fe-deficiency symptoms, although the use of chemical products such as HNO3 or H2SO4 is not very friendly to the environment in some cases. A temporary decrease in soil pH increases the availability of nutrients and facilitates their absorption by the plant, thus producing higher yields [18]. There are few data available on the effect of acid irrigation in grapevines using CO2, although different trials have been carried out on other crops, such as cucumber [26,27], cotton [28], strawberry [29,30], and tomato [31]. This was the main reason to set up an experiment to determine the influence of carbonated irrigation on grapevine and subsequently add knowledge to prevent Fe-deficiency in calcareous soils.
The objective of the present study was to evaluate the ability of carbonated irrigation to decrease the pH of the soil and increase the absorption of nutrients such as iron, to control or decrease ferric chlorosis in vines grown in calcareous soils. In the present work, cv. Tempranillo grapevines were grown in pots and documented the influence of carbonated irrigation on plant growth, sugar/acid metabolism in leaves, berry metabolism and yield, and fruit composition.

2. Materials and Methods

2.1. Experiment 1 in Bare Soil Pots: Effects of Acidified Water Irrigation on Soil pH and Mineral Composition

Ten plastic 40-L (50-cm Ø) bare soil pots were set up in the open air with a substratum of soil as average for the Tempranillo commercial cultivar in the Tarragona wine growing area (Spain). Tempranillo red variety is the most important in Spain, there are more than 215,000 hectares planted, ahead of Garnacha, therefore it is widespread in the Mediterranean area, an area characterized by calcareous soils. This was the main reason why Tempranillo was chosen as the variety to carry out the trial. Medium calcareous soil with 10.4% limestone, pH 8.08, and 24.03% CaCO3 was used. In order to establish the optimum CO2 water solution irrigation to be used for the experiment, several solutions of acidified water of CO2 at different dosages (low, 200 ppm; medium, 400 ppm; and high, 800 ppm) were prepared by dissolving CO2 gas in tap water (pH 7.5) (Table 1). Once every solution was acidified at the three concentrations, irrigation was immediately applied to each replicated pot. The experiment consisted of three replicates per treatment. To prepare the different acidified water of CO2 at different dosages, first, the 800-ppm solution was prepared dissolving CO2 gas under 1 atmosphere of pressure for 15 min, in 35 L of tap water inside an irrigation water tank. From the initial 800 ppm solution, 400 ppm and 200 ppm solutions were prepared as described in Table 1.
Acid irrigation was performed from May to August by a drip irrigation system, performed 3 times a week, totaling 48 irrigation events. To determine the irrigation doses, the evapotranspiration (ETc) values were used. The values of ETc were determined according to a modified Penman–FAO method [32]. According to results obtained in a previous irrigation experiment with Tempranillo grapevine in the same area [33], the implemented strategy irrigation was Regulated Deficit Irrigations (RDI). A total of 35% of the ETc was applied according to previous results [33], and after verifying that the dose of 60%, also with good qualitative results, supposed losses of water by leaching. Each dose of water applied during May–June was 0.75 L per pot. The dose of water increased to 1.1 L during July–August due to the increase in crop evapotranspiration (ETc). The total water applied per pot during the experiment was 44.4 L, corresponding to 17.76 g CO2 added in the 400-ppm treatment. The RDI strategy used to improve harvest quality, did not allow leachate to be collected from the pots.

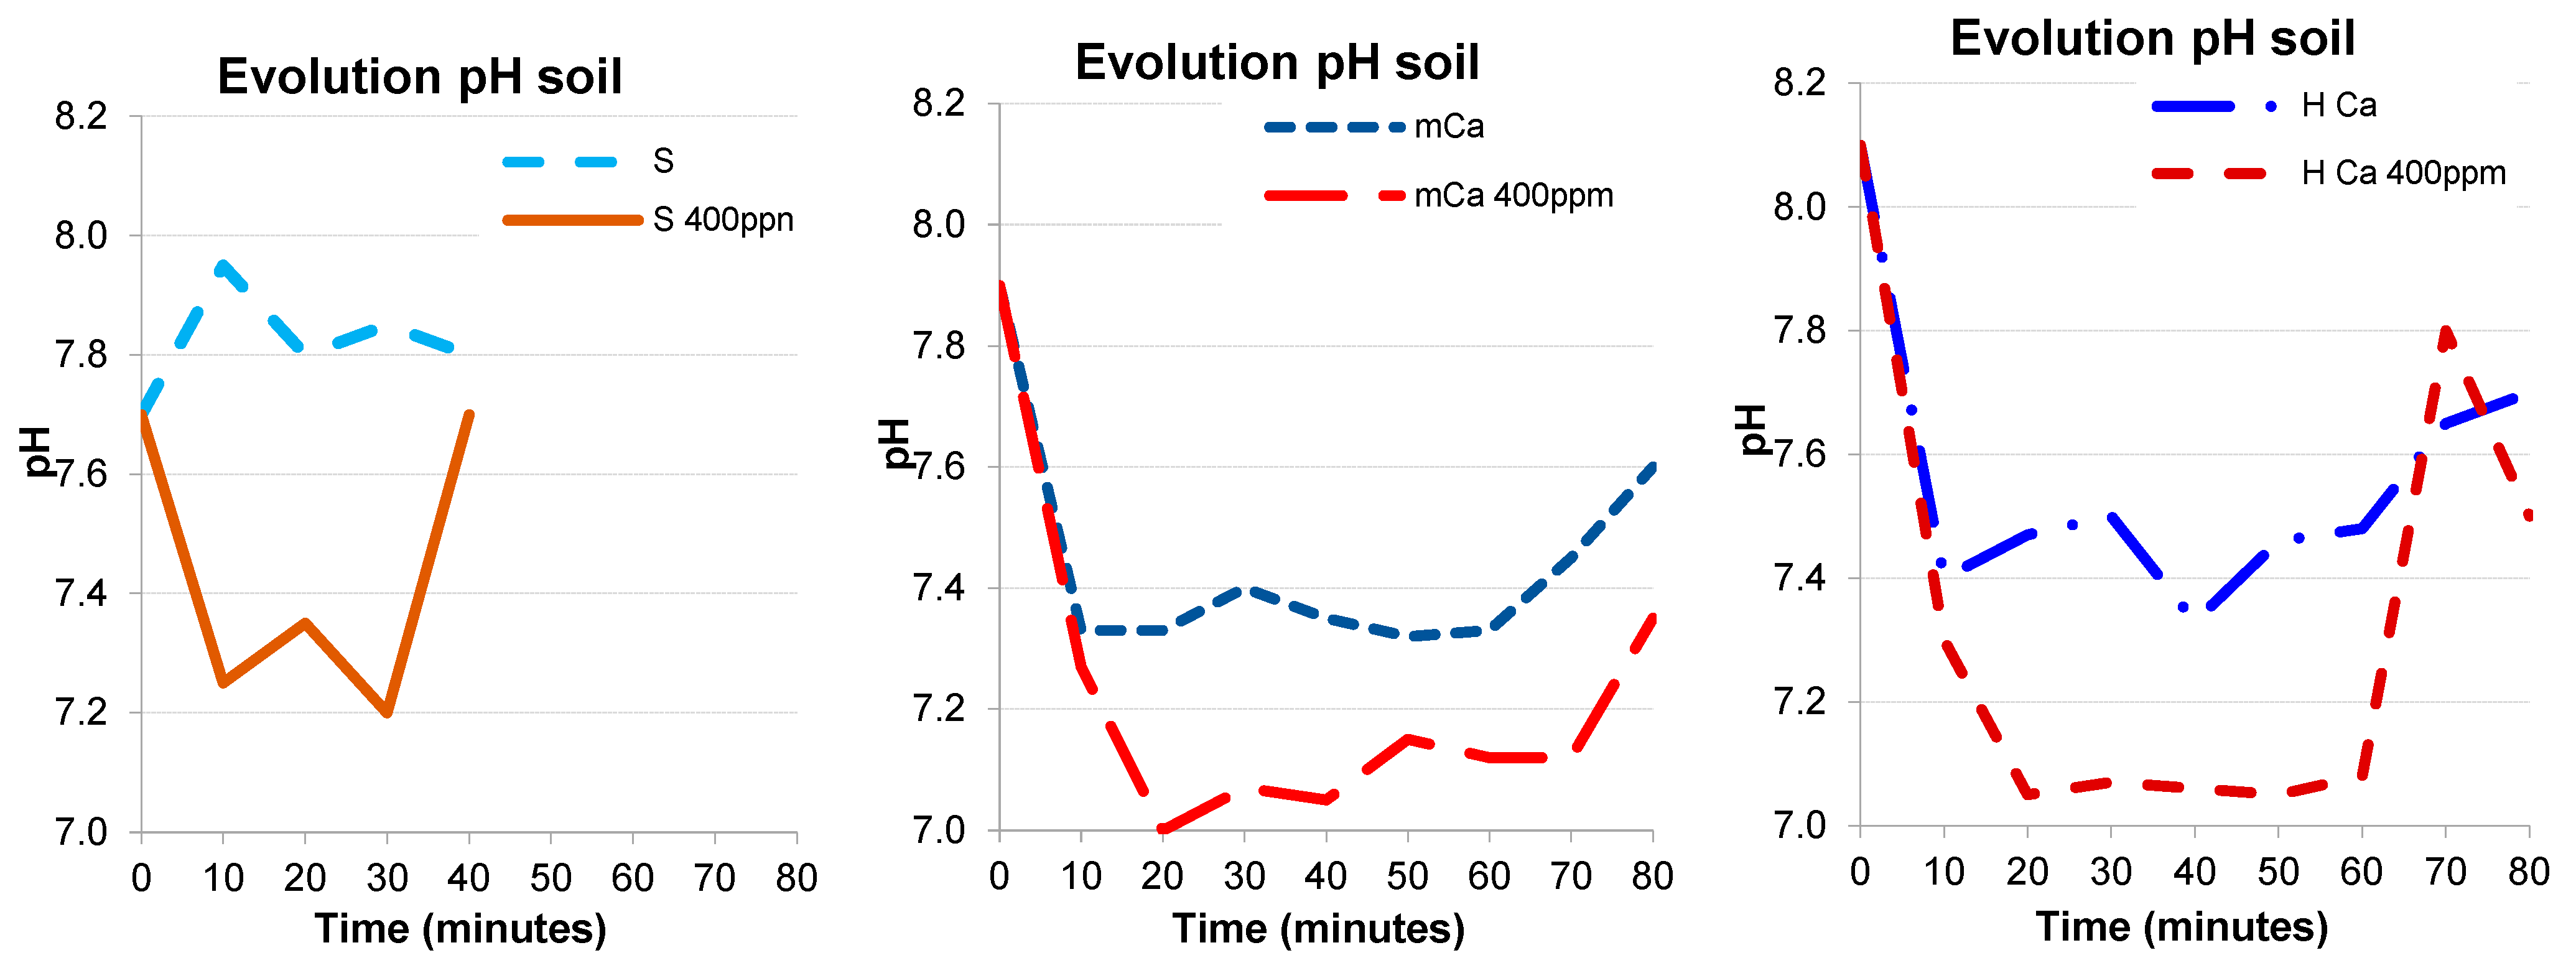
2.2. Experiment 2 in Planted cv. Tempranillo Pots: Effects of Acidified Water Irrigation with 3 Different Limestone Composition

Experiment 2 was carried out over a period of 3 years; Tempranillo grapevines (Vitis vinifera L.) were grown on 40 L plastic (50-cm Ø) pots as used in experiment 1. Three-year-old plants grafted onto 110 Richter rootstocks were used. Tempranillo was chosen as it is the most important in Spain; there are more than 215,000 hectares planted, widespread in the Mediterranean area, where soils are mostly calcareous, and this can affect the color and aromatic fraction of the wine [20]. Two variables were defined: soil type and pH of water irrigation. Three types of soil with different concentrations of active limestone were chosen, representing the soil of the three areas where there is more Tempranillo in the Tarragona region. The three types of soils were characterized as (Table 2): (A) schist driven neutral soil (control) with satisfactory drainage capacity, 0% limestone, pH 7.7, and 11.6% CaCO3; (B) medium calcareous soil with 10.4% limestone, pH 7.9, and 32.6% CaCO3; and (C) highly calcareous soil with 12.8% limestone, pH 8.1, and 43.5% CaCO3. Calcareous soils are characterized by a rich texture with fine particles. The acidified water dose used for irrigation was 400 ppm CO2, which provided the best results in Experiment 1, and was compared to an irrigation control with non-acidified water. The three types of soil previously defined and the pH of the irrigation water, control and 400 ppm CO2, resulted in six combinations: Schist control, Schist 400 ppm CO2, medium calc-clay control, medium calc-clay, 400 ppm CO2, highly calcareous clay control, and highly calcareous clay 400 ppm CO2.
To determine the irrigation doses, the evapotranspiration (ETc) values were used. Regulated Deficit Irrigations (RDI) is the strategy used. It was decided to apply 35% according to the results obtained in previous irrigation tests on the same Tempranillo variety and same wine growing area [33]; the values of ETc were determined according to a modified Penman-FAO method [32]. Plants were irrigated three times a week from bud burst (March) to the end of August. The RDI strategy used in order to improve harvest quality (35% ETc) did not allow leachate to be collected from the pots. The annual amount of water applied was 35 L per plant, corresponding to 14 g CO2 400 ppm added. The CO2 concentration in the water used for irrigation was regulated with an Orion electrode (ORION Research Inc., model 95-02 Waltham, MA, USA), immediately after dissolving the CO2 gas and just before irrigation The pH of the soil was determined with a pH meter in a 1/2.5 soil/water solution.

2.3. Soil Mineral Composition

Representative soil samples were collected after the end of each experiment. In the first experiment where bare soil pots were used, soil samples were collected after a 4-month period. In the second experiment, in which the pots contained planted cv. Tempranillo, samples were collected at harvest (September) for 3 years, after 6 months of regular irrigation. Soil samples were subjected to official methods of analysis according to AOAC International [34]. For K, Mg, Ca, Cu, and Mn determination, extraction in ammonia acetate 1 N, pH 7, was used. In the case of Fe and Zn, extraction in ammonia acetate 1 N, pH 4.8, was used. In both cases, 25 g of soil was mixed with 100 mL of ammonia acetate. Ca, Mg, Fe, Cu, Mn, and Zn were determined by AAS (Atomic Absorption Spectroscopy), and potassium (K) was measured by FES (Flame Emission Spectrometry). The amount of limestone and carbonates in the soil were assessed by a Bernard Calcimeter (which is a simple device with optimal performance to determine the carbonate in limestones, soils, and minerals) by adding HCl 6M (6N) Honeywell Fluka 72033-1L, and measuring the CO2 issued.

2.4. Plant Vegetative Weight

For each treatment, three plant organs (roots, leaves, and shoots) were harvested before leaf fall. The procedure for measuring the fresh weight consisted of removing plant organs from the soil and washing off any loose soil, then blotting plants gently with a soft paper towel to remove any free surface moisture, and, finally, weighing immediately (plants have a high composition of water so waiting to weigh them may lead to some drying and therefore produce inaccurate data). To determine the dry weight of the plant organs, first fresh weight was collected, then plants were dried in an oven set to low heat (80 °C) overnight. Once plants had cooled in a dry environment (with a Ziploc bag moisture was kept out), plant organs were weighed on a scale.

2.5. Leaf and Shoot Composition

Leaf samples were collected at 8:00 a.m. at the beginning of ripening (V) (1 August), maturation (M) (15 August), and harvesting (H) (15 September), every year for 3 years. Six plants were used for each sampling of which two leaves per plant were collected. They were frozen until the analysis was performed. To determine the nutrients in the leaves, freshly frozen leaves were digested with concentrated nitric acid (9 mL HNO3 69% PanReac AppliChen to 0.9 g sample) and hydrogen peroxide (24 mL H2O2 35% PanReac AppliChen to 0.9 g sample) by boiling for 7 h in a heating block (120 °C). Concentrations of Ca, Mg, Fe, Cu, Mn, and Zn were determined by AAS (Atomic Absorption Spectroscopy), and potassium (K) was measured by FES (Flame Emission Spectrometry). Phosphorous (P) was determined by the phosphomolybdate method [35]. The chlorophyll in the leaves was measured using the Arnon method, modified by Davies [36]. For the determination of starch concentration in leaves, the DuBois method, modified by Buysse [37], was used. Leaves were hydrolyzed with 3% HCl at 100 °C for 3 h, and the pellet obtained for determining soluble sugars was subsequently analyzed by the enzymatic method.
At the end of the vegetative growing cycle, sucrose, glucose, fructose, malic acid, and tartaric acid in the leaves, shoots, and roots were analyzed. The carbohydrate molecules were extracted with 80% ethanol. The glucose and fructose concentration were determined by the glucose-oxidase enzymatic method [38] to calculate the glucose/fructose ratio. To determine sucrose, disaccharide was converted to glucose and fructose by invertase, and later, the monosaccharides were determined by the fructose-oxidase enzymatic method. Citrate and malate were determined by enzymatic methods: R-Biopharm D-Malic and R-Biopharm Citric Acid; both determinations are UV-methods (340 nm). Tartaric acid was analyzed using a modified Rebelein method with colorimetric reaction [39].
After pruning, shoot samples were collected from each plant, rinsed in deionized water, weighed, and freeze-dried for starch analysis. Starch was extracted with CaCl2 in acetic acid on a powder sample of comminuted wood with liquid nitrogen, and after reaction with iodine, the absorbance was read at 570 nm.

2.6. Berry Composition

In order to analyze grape maturity, whole-bunch samples were collected. A sample of 100 grapes was used to determine the sugar level (°Brix), acidity (g·L−1 tartaric acid), and pH. The probable alcoholic degree was tested by refractometer, and total acidity (TA) and pH were determined according to OIV methods [39]. Furthermore, a sample of 60 grapes was used to analyze skin anthocyanins by extraction with 200 mL HCl and 800 mL ethanol, and absorbance was read at 535 nm. Cluster weight (g), clusters per vine, yield (kg/vine), and Ravaz Index (yield/pruning weight) were determined at harvest.

2.7. Data Analysis

Chemical analysis, growth, plant vigor, and yield data were evaluated through one-way analysis of variance (Factorial ANOVA); p < 0.05, and the Tukey’s post-hoc test were used with IBM SPSS Statistics software version 27.0 (SPSS version 27.0, Chicago, IL, USA). Data were replicated three times per treatment.

3. Results

3.1. Experiment 1: Effects of Acidified Water Irrigation on Soil pH and Mineral Composition

When different concentrations of acid were added (Table 1), the soil pH, carbonates, and mineral composition of nutrients in non-calcareous soil (Table 3) showed that adding 800 ppm CO2 (pH 6) the solubility of calcium increased. When 400 ppm CO2 (pH 6.5) was added, the solubility of Fe, Zn, Mn, and P were highest, it increased by 241%, 31%, 131%, and 128%, respectively, compared to the control. The treatment with 400 turned out to be, therefore, the one that demonstrated the greatest increase in Fe, Zn, P, and Mn solubility; that is the reason why this dose was to be used in experiment 2.
The evolution of the soil pH after irrigation with acidified water containing 400 ppm CO2, in bare soil pots and with three soil substrata, is shown in Figure 1. The changes in pH were measured every 10 min for 80 min. In all soil treatments, the decrease in pH was highest after irrigation with acidified water in comparison with the control treatment, with 0.7 decimal points for non-calcareous soils and 0.3–0.4 decimal points for calcareous soils. The pH of calcareous soils partially recovered in approximately 80 min after irrigation, but only 40 min was required for soils with schist.

3.2. Experiment 2: Effects of Irrigation with Acidified Water at 400 ppm CO2 on Soil and Grape Plants in Pots with 3 Different Soils

Concerning the effects of acidified water irrigation on nutrients (Table 4), no significant differences were observed in carbonates after acidified irrigation in Medium and Highly calcareous soils. The solubility of micronutrients (Fe, Mn, Zn, and Cu) mainly increased in Medium and Highly calcareous soils that received carbonated irrigation: Fe increased by 43% in Highly calcareous soil, Zn by 140% in schists and highly calcareous soils and 70% in Medium calcareous soils, Mn increased by 60% in schists and by 140% in Highly calcareous soils, and Cu was higher by 50% in schist and by 65% in Medium calcareous soils.
Regarding the biomass analysis to the plant after carbonated irrigation, the soil influenced the chlorophyll concentration in leaves (Table 5), which was higher in all the soil treatments except for Medium calcareous soil after irrigation with acidified water when compared to the treatments with regular tap water during the 3 years of study. In the third year, the chlorophyll content increased by 70% in schist and in Highly calcareous soil. The solubility of iron, manganese, and magnesium mainly increased in Highly calcareous soils that received carbonated irrigation.
Table 6 shows the concentration of osmotically active solutes in grapevines leaves. The amount of soluble sugar was higher for monosaccharides in all cases with carbonated irrigation. Sucrose decreased in highly calcareous soil receiving the same irrigation. Starch in leaves tends to decrease in schist soils and to increase in calcareous soils when acidified water is applied. The ratio of soluble to insoluble carbohydrates was higher in soils with neutral soil, and carbonated irrigation increased the ratio in all soils.
At harvest, there was an increase in tartaric and malic acids with carbonated irrigation in all the soils (Table 7). No differences were found in grape ripening or maturation.
The results of shoot and root starch (Table 8) tests showed an increase of 100% when acidified water was used in all the treatments except for shoot starch in schist. The root starch concentration was usually higher than that of leaves. Citric acid in roots increased in schist and Medium calcareous soils.
Regarding plant growth, showed in Table 9, measurements showed that root biomass increased by 25% in medium and highly calcareous soils in the second year after irrigation with acidified water. Significant differences in the length of shoots and leaves were found in medium calcareous soil when irrigated with acidified water.
The results of yield component and grape compositional analyses on the three-year old plant (Table 10) showed that grape yield increased by 30% in schist neutral soils and 40% in medium calcareous soils. No differences were found in pH or malic in the grape juice analysis. Total soluble solids increased in medium calcareous soils. Plants in highly calcareous soils were so stressed by the high content of active limestone that in the third year they had not yet produced grapes. Results for dried root weight, dried shoot weight and shoot length in the second year show that the plants were stressed, and this could affect grape production in the third year of life.

4. Discussion

The results obtained in Experiment 1 for soil nutrient solubility in plastic pots holding soil, but without plants (Table 3), indicated that the effect of decreasing pH depends on the concentration of CO2.
Our results for the temporal decrease in soil pH (Figure 1) from 0.7 to 0.3 after treatment with 400 ppm CO2 confirm those reported by other authors. In a previous study, there were variations of 0.9–1 in pH reverting to values similar to initial ones approximately 2 h after irrigation [40], with a decrease of 0.4 in pH between treated plants and control in a sand:vermiculite:peat (1:1:1) substrate after treatment with an injected concentration of 1500–1800 ppm CO2. Other authors also reported a temporary effect from CO2 treatments with a concentration of 150 ppm [27], and a decrease in pH by 0.3 with a concentration of 350 ppm. This temporary effect may be due to the soil-buffering capacity, i.e., the ability of the soil to resist changes in pH. It is unlikely that a short-term reduction of less than a pH unit, at best for one hour every 3 days for 4 months, could result in an increase in mineral absorption by the plant.
In experiment 2, when three types of soil calcareous are being used, small changes occurred in the macronutrients Ca, Mg, K, and p after irrigation with acidified water (Table 4). In schist soils, Ca and Mg were significantly decreased, while P decreased in highly calcareous soils. The authors of Ref. [41] reported an increase in P solubilization in a sandy loam calcareous soil under simulated acid precipitation. The authors of Ref. [42] reported less Ca and Mg in roots that received carbonated irrigation using H2SO4. In the present work, there was a decrease in active limestone, while carbonates increased in schist soils, and no significant differences were found in medium and highly calcareous soil. These results are encouraging because one of the principal problems that could result from irrigation with CO2 is that carbonates of calcium and magnesium are solubilized in the form of bicarbonates, which release calcium and magnesium to the soil [43], and this situation did not happen in the experiments carried out in the current study.
It has been shown that the presence of bicarbonate in the nutrient solution changes phosphoenolpyruvate carboxylase (PEPC) enzyme activity in roots. PEPC activity increases the concentration of organic acids in roots (particularly citric acid) in response to iron deficiency. In an experiment conducted on Vitis vinifera L. cv. Cabernet Sauvignon on the Fe-chlorosis susceptible Vitis riparia, grown in pots filled with calcareous soil [43], it has been shown that iron deficiency increased the activity of PEPC in roots. An increase in root PEPC activity induced by Fe deficiency catalyzes the incorporation of bicarbonate into a C3 organic acid, phosphoenolpyruvate, generating oxalacetate, which is converted to malate by malate dehydrogenase. This is the reason why PEPC activity was proposed a biochemical marker for iron deficiency status in tolerant species [9,17,18] like some tolerant rootstock vines that increase the activity of the root PEPC enzyme [14]. Bicarbonate also enhanced leaf chlorophyll content with a clear independent effect on Fe nutrition [43,44]. However, calcium carbonate (active lime consists of calcium carbonate particles with a very small size) might react with CO2 to form soluble bicarbonate ions as well as calcium and/or magnesium and maintain the flocculation of clay. The results of these reactions could decrease the amount of carbonate and increase bicarbonate and active lime, which would favor chlorosis, although according to the results observed in Table 3, this did not occur.
The results obtained in our experiment corroborate the hypothesis that the reduction of the pH may benefit iron availability in soil. In plastic pots containing grown vines, the iron solubility increased by 43% in highly calcareous soil after 6 months of irrigation with carbonated water (Table 4). Other authors found higher concentrations of several nutrients after using similar doses of CO2, artificial substrates, and hydroponic cultures, where there were increased concentrations of Ca and Fe in silty clay soils used to grow cultured tomatoes [45], increases from 0.28 ppm of Fe in the control to 2.34 and 2.11 ppm in tomato samples treated with 200 and 300 ppm CO2, respectively, and similar behavior for Zn, but decreased Ca by 30% in soils treated with CO2 [46]. Other authors, however, reported no change in soil nutrients in eggplant culture with CO2 concentrations between 300 and 150,000 ppm [47].
Lime-stress conditions cause an important nutritional plant disorder. Variation in the maintenance of essential mineral nutrient status may be a crucial factor in plant tolerance to calcareous soil conditions. Some authors reported important reductions in leaf Fe concentration in V. vinifera (L.) ssp. sylvestris and in V. vinifera (L.) cv. Pinot Blanc under exposure to 19.3% active lime [11,48,49]. According to our study, the amount of Fe and chlorophyll in the leaves increased with carbonated irrigation (Table 5), with chlorophyll being produced in all the soils, while iron only appeared in plants grown in highly calcareous soils at 193 μg Fe/g dry weight against 95 μg Fe/g in the control. For the acidified water treatments, the increased iron and chlorophyll in the leaves was observed in parallel with the increased iron content in the soil. The chlorophyll concentrations in grapevine leaves were like those reported by other authors [50,51].
Some authors did not observe iron chlorosis in an experiment in field-grown grapevines in calcareous soils, although they did record a decreased chlorophyll concentration and a 50% decrease in plant growth [52]. Vines are frequently subjected to iron deficiency when growing in calcareous soil. These plants show variable responses to bicarbonate-induced iron deficiency depending on genotype [13,53], which also occurs in other crops [44,54,55], and the decrease in the growth of plants with chlorosis grown in calcareous soils was lower in resistant genotypes. The morphological and physiological parameters show different behavior depending on the tolerance of varieties, whether grapevines varieties were medium tolerant or sensitive [12,56]. In this study, the increase in chlorophyll in medium and highly calcareous soils that received carbonated irrigation resulted in an improvement in physiological parameters, including shoot length, plant dry weight, chlorophyll concentration [32], and increased yield and fruit quality.
The values of osmotically active solutes in grapevines leaves were similar to those that have been documented by other authors [50]. Many studies have reported that drought stress leads to a general depletion of soluble sugars and starch in leaves [57,58] that results in the inhibition of photosynthesis, where stomata close and the internal CO2 concentration decreases [22,59,60]. Nevertheless, experiments by other authors have reported that soluble sugars accumulate in leaves during drought stress [61]. They propose that soluble sugars might contribute to osmoregulation. Plants respond to drought stress by intracellular net accumulation of soluble carbohydrates to decrease leaf water potential (more negative osmotic potential) and, thus, avoid becoming dehydrated.
Another aspect to take into consideration is the role of inorganic ions and amino acids in osmosis. As shown in Table 6, carbonated irrigation produces increases in monosaccharides in the leaves of plants growing in all calcareous soils. In this work, between 50 mg and 350 mg of sucrose/g dry weight (d.w.) were measured, which were higher than the values registered by other authors: 20–40 mg sucrose/g d.w. [62] and 30–80 mg sucrose/g d.w. [63].
Carbonated irrigation increased the accumulation of sucrose in Medium calcareous but not in Highly calcareous soil. It might be suggested to increase carbon dioxide in water (400 ppm CO2 at pH 6), given that the current dose was insufficient in this soil, or it resulted in sucrose hydrolysis to increase glucose and fructose. Additionally, soils in this study with large amounts of limestone are affected by a double stress: a deficit of water and higher quantities of calcium carbonate. In some works, it was reported that starch in leaves in calcareous soils decreases by migrating to shoot and roots, or by undergoing hydrolysis [64]. In the present work, the amount of starch in leaves was also lower in calcareous soil when compared with non-calcareous soils, but it increased with carbonated irrigation. Alternatively, CO2 can activate starch hydrolysis to increase the total soluble carbohydrates to decrease leaf water potential, which has previously been reported.
We can conclude that CO2 in water can improve stomatal behavior and gas exchange, and when photosynthesis increases, the amount of carbohydrate in leaves also increases. Another explanation for the beneficial effect of carbonated irrigation with CO2 on physiological processes, plant growth, and chlorosis could be the uptake of CO2 by roots. The bulk of CO2 dissolved in irrigation water can be fixed by roots and converted to malic and citric acids and sugars. Many studies have documented this possibility in different crops, such as with Avena sativa and Hordeum vulgar [65], where there is direct absorption through the roots [66] and increases in 14 CO2 by approximately 18% [67].
Others works reported an incorporation of CO2 in organic acids and sugars after absorption by roots and recovered 82% of the radioactivity applied [47]. Nevertheless, in studies with cotton, it was concluded that none of the carbon in lint samples was derived from the CO2 in the irrigation water [28]. They postulated that there was an increased uptake of Zn and Mn by carbonic anhydride, which supported a more robust photosynthetic apparatus that resulted in a significant increase in the yield of the treated plants.
Organic acids contribute to decreased iron deficiency in crops when they are cultivated in calcareous and alkaline soils. The solubility of Fe-oxides is pH dependent in alkaline and calcareous soils, and Fe availability is far below that required to satisfy plant demand. An increase in bicarbonate in limestone soils can stimulate malic acid in leaves to decrease the cellular pH and then proceed with the reduction step from Fe3+ to Fe2+ [68]. Some mechanisms have been described for increasing the reductase activity in the roots and leaves of resistant plants such as Cabernet Sauvignon and obtaining higher amounts of malic acid in leaves growing in calcareous soils [1]. In the current study, the amount of malic acid in leaves at harvest was higher in plants that received carbonated irrigation (Table 7). Malic acid can lower the cellular pH to prevent the occurrence of Fe deficiency and to improve plant growth [23].
In the management of the rhizosphere and soil pH, some authors found higher amounts of organic acids (mainly citrate) in the roots of Fe chlorosis-tolerant grapevine genotypes [49,69,70,71]. This fact gives rise to highlight this to be used in regenerative agriculture techniques. Citric acid has an important role in Fe absorption and xylem transport of Fe in Fe-deficient plants, and citrate metabolism may be associated with proton extrusion and Fe (III) reduction activity [17,72]. It has been reported in some studies that the excretion of H+ decreased the rhizosphere pH [1,3,15,73]. Studies Refs. [42,74] described approximately 2 units in calcareous soils. In the present work, the higher amounts of citric acid in roots obtained with acid irrigation (Table 8) confirmed that this organic acid is involved in the transport of iron to leaves, where it accumulates in higher concentrations in the leaves of plants irrigated with carbonated water. However, the importance of H+ release by roots is due to depression of pH in the root apoplast by neutralizing HCO3 and, thus, providing more optimal conditions for the reduction of iron in calcareous soils [2,5].
Starch reservoirs in shoots and roots (Table 8) increase with acidified irrigation at the end of a vegetative cycle, with 150% in highly calcareous soil and 50% in medium calcareous soil in comparison with the control. These result in stronger sprouts in the next year, with root mass (Table 9) that increased due to receiving acidified irrigation, and the differences between treatments increased with the amount of calcium carbonate in the soil. The starch concentrations in shoots and roots were like figures reported by other authors, at 8–15% in shoots and 12–30% in roots [75,76].
Changes in root biomass in high limestone soils over a 2-year period (Table 9) showed that there was a suitable increase in the performance of calcareous soils when these were irrigated with acidified water [74]. In highly calcareous soils with a compact texture; however, there was a decrease in shoot length. Stimulation of root growth by CO2 was similar in calcareous soils with 10.4% and 12.8% limestone. Nevertheless, the growth of roots and shoots in medium and highly calcareous soils during the first year was strongly inhibited, probably due to the compact soil texture in highly calcareous soils that produces stress and other difficulties for root expansion, and thus reduces aerial growth. This inhibition disappeared during the next year due to the ability of grapevines to adequately adapt to stress conditions, and growth clearly increased with acidified water treatments. The increase in root biomass indicates the beneficial effect of enriching water with CO2.
Soils containing high concentrations of limestone have a greater ability to retain water. A carbonated agent can, therefore, act longer, leading to a decrease in pH and an increase in growth at the root level. It was found that the growth of lettuce roots decreased when the soil was treated with a solution containing CO2 at a concentration of 200 ppm [77]. Some studies with barley and peas showed stimulated growth of roots at 500 ppm, although growth was somewhat inhibited in both cultures at 1000 ppm and totally inhibited in peas at 1500 ppm [65]. However, in cereals at the same concentrations, there were no appreciable effects. The toxicity of CO2 at high concentrations (1000 ppm and more) can explain why the growth of roots is stimulated with moderate concentrations (400 ppm or 500 ppm) and why it is inhibited with high concentrations when plants are irrigated with carbonated water. Increases have been documented in stolon length, root systems, and overall dry weight of potato plants that received CO2 applications to the root zone [67,78].
In the grape juice from grapevines grown in pots, carbonated irrigation increased the assimilated synthesis, and the grapes contained higher amounts of sugar and less acid (Table 10). Data are not available in the literature regarding the effect of carbonated irrigation water on grape quality. With other crops, there have been reported increases of approximately 30% for crude protein, crude fat, ash, and carbohydrates in hydroponic peanut seeds grown with CO2-enriched irrigation water [79]. In the present work, an increase was obtained between 30% and 42% for kg grape/vine with 400 ppm CO2 irrigation water when compared with the control treatment. Other authors have documented higher yields with carbonated irrigation of different crops, such as cantaloupe, potato, and wheat, with high variability depending upon the CO2 concentration, substrata, and plant species [80].
The authors of Ref. [26] measured an increase of approximately 44% for the fruit yield of cucumber with carbonated irrigation. The authors of Ref. [27] used CO2-enriched water at 150 ppm and reported increases in cucumber yield by 10–25%. A previous study [28] grew cotton in a glasshouse with 1500–1800 ppm CO2 and measured increases in yield of 53–80%. Other studies [29,30] obtained moderate results with strawberry yield and fruit size when the plants were treated with 1000 ppm and 2000 ppm CO2 (with only increases of 2% and 6–8%, respectively). The authors of Ref. [31] documented no increase in tomato or cucumber yield with treatments of 500 ppm and 1000 ppm CO2. Another study [40] also did not observe an increase in gladiolus yield with the same CO2 concentration in water.

5. Conclusions

Our results confirm that when vineyards of Vitis vinifera (L.) cv. Tempranillo are irrigated with acidified water in calcareous soils, the availability of nutrients in the soil increases. This has several advantages for viticulture and the environment, such as improving the development of the plant, increasing the production and quality of the grape, and reducing the use of synthetic fertilizers, which are harmful to the environment. The carbonated irrigation, when compared with schist soil (non-calcareous), has been shown to modify soil pH and increase the absorption of nutrients, as well as assess the impact of chlorosis on the physiology of the variety, improve primary metabolism, and stimulate the synthesis of chlorophyll. The control of chlorosis also increases growth and yield, as well as the composition of the grape. Globally, treatment with 400 ppm CO2-enriched water provides the most optimal results. In any case, the solubility of nutrients depends on the type of soil, the pH of the irrigation water, the substrate used for acidification, and the type of culture. The higher levels of chlorophyll, obtained in calcareous treatments, can support the thesis that irrigation with CO2 enables more efficient control of ferric chlorosis. The dose and frequency of irrigation are important for a vineyard because they determine how long the drop in pH lasts and what its effects will be. Thus, vineyards located in areas with low annual rainfall are the ones most suitable for using carbonated water in irrigation. Our data provide evidence of the effectiveness and physiological responses of agronomic strategies, as an alternative to the use of synthetic Fe chelates as EDTA or o,o-EDDHA for preventing Fe chlorosis in susceptible Tempranillo (Vitis vinifera L.) vineyard in calcareous soils, with less of a risk to the environment.

Author Contributions

Conceptualization, M.L. and M.N.; methodology, M.L., A.M. and A.S.-O.; formal analysis, M.L., A.M. and J.V.; investigation, M.L. and M.N.; resources, A.M. and J.V.; writing—review and editing, M.L. and A.S.-O.; supervision, M.N. and A.S.-O.; project administration, M.L. and A.S.-O. All authors have read and agreed to the published version of the manuscript.

Funding

This research was funded by Carburos Metálicos SA and the National Project “Contribution of rootstocks to water and carbon balances National Project”: structural and dynamic components and relative to production and quality grapes and wine.

Institutional Review Board Statement

Not applicable.

Informed Consent Statement

Not applicable.

Data Availability Statement

Data were obtained from experimental vineyard of the public university, URV, and from a private company, Raimat, with the permission of both.

Acknowledgments

The authors acknowledge the support of Carburos Metálicos SA and Raimat Wineries for allowing the performance of part of the experiment in their vineyards, in Raimat (Lerida).

Conflicts of Interest

The authors declare no conflict of interest.

References

  1. Brancadoro, L.; Vanoli, M.; Zoocchi, G. Adaptive responses to high concentration of HCO3 in Cabernet Sauvingnon. Acta Hort. 1996, 427, 75–81. [Google Scholar] [CrossRef]
  2. López-Rayo, S.; Sanchis-Pérez, I.; Ferreira, C.; Lucena, J. [S,S]-EDDS/Fe: A new chelate for the environmentally sustainable correction of iron chlorosis in calcareous soil. Sci. Total Environ. 2019, 647, 1508–1517. [Google Scholar] [CrossRef] [PubMed]
  3. Dell’orto, M.; Brancadoro, L.; Scienza, A.; Zocchi, G. Use of biochemical parameters to select grapevine varieties resistant to iron-chlorosis. J. Plant Nutr. 2000, 23, 1767–1775. [Google Scholar] [CrossRef]
  4. Dell’orto, M.; De Nisi, P.; Pontiggia, A.; Zocchi, G. Fe deficiency responses in Parietaria diffusa: A calcicole plant. J. Plant Nutr. 2003, 26, 2057–2068. [Google Scholar] [CrossRef]
  5. Mengel, K. Iron availability in plant tissues-iron chlorosis on calcareous soils. Plant Soil 1994, 165, 275–283. [Google Scholar] [CrossRef]
  6. Nikolic, M.; Römhel, V. The Dynamics of Iron in the Leaf Apoplast. Significance for the Iron Nutrition of Plants. In The Apoplast of Higher Plants: Compartment of Storage, Transport, and Reactions. The Significance of the Apoplast for the Mineral Nutrition of Higher Plants; Sattelmacher, B., Horst, W.J., Eds.; Springer: Dordrecht, The Netherlands, 2007; pp. 353–371. [Google Scholar]
  7. Bavaresco, L.; Bertamini, M.; Iacono, F. Lime-induced chlorosis and physiological responses in grapevine (Vitis vinifera L. cv. Pinot blanc) leaves. Vitis 2006, 45, 45–46. [Google Scholar]
  8. Römheld, V. The chlorosis paradox: Fe inactivation as a secondary event in chlorotic leaves of grapevine. J. Plant Nutr. 2000, 23, 1629–1643. [Google Scholar] [CrossRef]
  9. Rombolà, A.D.; Tagliavini, M. Iron Nutrition of Fruit Tree Crops. In Nutrition in Plants and Rhizospheric Microorganisms; Abadía, J., Barton, L., Eds.; Springer: Berlin, Germany, 2006; pp. 61–83. [Google Scholar]
  10. Tangolar, S.G.; Ünlü, G.; Tangolar, S.; Daşgan, Y.; Yilmaz, N. Use of in vitro method to evaluate some grapevine varieties for tolerance and susceptibility to sodium bicarbonate-induced chlorosis. Vitr. Cell. Dev. Biol.-Plant 2008, 44, 233–237. [Google Scholar] [CrossRef]
  11. Cambrollé, J.; García, J.L.; Ocete, R.; Figueroa, M.E.; Cantos, M. Evaluating tolerance to calcareous soils in Vitis vinifera ssp. sylvestris. Plant Soil 2015, 396, 97–107. [Google Scholar] [CrossRef] [Green Version]
  12. Alcántara, E.; Cordeiro, A.M.; Barranco, D. Selection of olive varieties for tolerance to iron chlorosis. J. Plant Physiol. 2003, 160, 1467–1472. [Google Scholar] [CrossRef] [Green Version]
  13. Ksouri, R.; Gharsalli, M.; Lachaal, M. Physiological responses of Tunisian grapevine varieties to bicarbonate-induced iron deficiency. J. Plant Physiol. 2005, 162, 335–341. [Google Scholar] [CrossRef]
  14. Covarrubias, J.I.; Rombolà, A.D. Physiological and biochemical responses of the iron chlorosis tolerant grapevine rootstock 140 Ruggeri to iron deficiency and bicarbonate. Plant Soil 2013, 370, 305–315. [Google Scholar] [CrossRef]
  15. Mukherjee, I.; Campbell, N.H.; Ash, J.S.; Connolly, E. Expression profiling of the Arabidopsis ferric chelate reductase (FRO) gene family reveals differential regulation by iron and car. Plant Sci. 2006, 223, 1178–1190. [Google Scholar] [CrossRef]
  16. Díaz, I.; del Campillo, M.C.; Cantos, M.; Torrent, J. Iron deficiency symptoms in grapevine as affected by the iron oxide and carbonate contents of model substrates. Plant Soil 2009, 322, 293–302. [Google Scholar] [CrossRef] [Green Version]
  17. Covarrubias, J.I.; Pisi, A.; Rombolà, A.D. Evaluation of sustainable management techniques for preventing iron chlorosis in the grapevine. Aust. J. Grape Wine Res. 2014, 20, 149–159. [Google Scholar] [CrossRef]
  18. Jiménez, S.; Ollat, N.; Debordec, C.; Maucourtc, M.; Rellán-Álvareze, R.; Morenoa, M.A.; Gogorcena, Y. Metabolic response in roots of Prunus rootstocks submitted to iron chlorosis. J. Plant Physiol. 2011, 168, 415–423. [Google Scholar] [CrossRef] [Green Version]
  19. Bavaresco, L.; van Zeller de Macedo Basto Gonçalves, M.A.; Civardi, S.; Gatti, M.; Ferrari, F. Effects of traditional and new methods on overcoming lime-induced chlorosis of grapevine (Vitis vinifera L. cv. Pinot blanc) leaves. Am. J. Enol. Vitic. 2010, 61, 186–190. [Google Scholar]
  20. Sánchez, R.; González, M.R.; Ilanova, M.; Rodríguez-Nogales, J.M.; Martín, P. Aroma composition of Tempranillo grapes as affected by iron deficiency chlorosis and vine water status. Sci. Agric. 2021, 78, e20190112. [Google Scholar] [CrossRef]
  21. Hunter, J.J.; Skrivan, R.; Ruffner, H.P. Diurnal and seasonal physiological changes in leaves of Vitis vinifera L.: CO2 assimilation rates, sugar levels and sucrolytic enzyme activity. Vitis 1994, 33, 184–195. [Google Scholar]
  22. Schulze, E.D. Whole-plant responses to drought. Aust. J. Plant Physiol. 1986, 13, 127–141. [Google Scholar] [CrossRef]
  23. Piagnani, C.; De Nisi, P.; Espen, L.; Zocchi, G. Adaptive responses to iron-deficiency in callus cultures of two cultivars of Vitis spp. J. Plant Physiol. 2003, 160, 865–870. [Google Scholar] [CrossRef] [PubMed]
  24. Lucena, J.J. Synthetic Iron Chelates to correct Iron Deficiency in Plants. In Iron Nutrition in Plants and Rhizospheric Microorganisms; Springer: Dordrecht, The Netherlands, 2006; pp. 103–128. [Google Scholar]
  25. López-Rayo, S.; Di Foggia, M.; Bombai, G.; Yunta, F.; Rodrigues Moreira, E.; Filippini, G.; Pisi, A.; Rombolà, A.D. Blood-derived compounds can efficiently prevent iron deficiency in the grapevine. Aust. J. Grape Wine Res. 2015, 21, 135–142. [Google Scholar] [CrossRef]
  26. Peet, M.M.; Willits, D.H. Greenhouse CO2 enrichment. Effects of increasing concentration or duration of enrichment on cucumber yield. J. Am. Hort. Sci. Soc. 1987, 112, 236–241. [Google Scholar]
  27. Ibrahimm, A.A. Response of plant to irrigation with CO2-enriched water. Acta Hortic. 1992, 323, 205–214. [Google Scholar] [CrossRef]
  28. Mauney, J.R.; Hendrix, D.L. Responses of glasshouse grown cotton to irrigation with carbon dioxide-saturated water. Crop Sci. 1988, 28, 835–838. [Google Scholar] [CrossRef] [Green Version]
  29. Mannini, P.; Gallina, D. Effetti dellírrigazione della fragola con acqua carbonicata. Riv. Irr. Dren. 1995, 42, 18–21. [Google Scholar]
  30. Arienzo, M.; Basile, G.; D’Andria, R.; Magliulo, V.; Zena, A. Irrigazione con acqua carbonicata e disponibilità di elementi nutritivi. Prova su coltura di fragola. Agrochimica 1995, 39, 61–72. [Google Scholar]
  31. Hartz, T.K.; Holt, D.B. Root-zone carbon dioxide enrichment in field does not improve tomato or cucumber yield. HortScience 1991, 26, 1423. [Google Scholar] [CrossRef] [Green Version]
  32. Lampreave, M. Fisiologia de L’absorció en L’ecosistema Vitícola Sòl-Planta-Atmosfera i Repercussions en la Qualitat del Raïm. Ph.D. Thesis, Department of Bioquímica i Biotecnologia, URV, Tarragona, Spain, 2002. [Google Scholar]
  33. Doorenbos, J.; Pruitt, W.O. Guidelines for Predicting Crop Water Requirements, 2nd ed.; lrrigation and Drainage, Paper 24; Food and Agriculture Organization: Rome, Italy, 1984; 144p. [Google Scholar]
  34. AOAC. International, Official Methods of Analysis; AOAC: Rockville, MD, USA, 1990. [Google Scholar]
  35. Olsen, R.S.; Cole, V.C.; Watanabe, F.S.; Dean, L.A. Estimation of Available Phosphorus in Soils by Extraction with Sodium Bicarbonate; 4 Circular 939; USDA: Washinghton, DC, USA, 1954. [Google Scholar]
  36. Davies, D.H. Carotenoids. Chemistry and Biochemistry of Algal Pigments; Goodwin, T.W., Ed.; Academic Press: New York, NY, USA, 1976; Volume 2, pp. 38–165. [Google Scholar]
  37. Buysse, J.; Merckx, R. An improved colorimetric method to quantify sugar content of plant tissue. J. Exp. Bot. 1993, 44, 1627–1629. [Google Scholar] [CrossRef]
  38. Barham, D.; Trinder, P. An improved color reagent for the determination of blood glucose by the oxidase system. Analyst 1972, 97, 142–145. [Google Scholar] [CrossRef]
  39. OIV. Recueil des Méthodes Internationales D’analyse des Vins et des Moûts; Office International de la vigne et du vin: Paris, France, 1990. [Google Scholar]
  40. Alvino, A.; D’Andria, R.; Cerio, L.; Mori, M.; Sorrentino, G. Physiological response of Gladiolus to carbonated water application under two water regimes. Adv. Hort. Sci. 1997, 12, 145–152. [Google Scholar]
  41. Jalali, M.; Naderi, E. The impact of acid rain on phosphorus leaching from a sandy loam calcareous soil of western Iran. Environ. Earth Sci. 2012, 66, 311–317. [Google Scholar] [CrossRef]
  42. Hahn, G.; Marschner, H. Cation concentrations of short roots of Norway spruce as affected by acid irrigation and liming. Plant Soil 1998, 199, 23–27. [Google Scholar] [CrossRef]
  43. Covarrubias, J.I.; Retamales, C.; Donnini, S.; Rombolà, D.; Pastenes, C. Contrasting physiological responses to iron deficiency in Cabernet Sauvignon grapevines grafted on two rootstocks. Sci. Hortic. 2016, 199, 1–8. [Google Scholar] [CrossRef]
  44. Vannozzi, A.; Donnini, S.; Vigani, G.; Corso, M.; Valle, G.; Vitulo, N.; Bonghi, C.; Zocchi, G.; Lucchin, M. Transcriptional Characterization of a Widely-Used Grapevine Rootstock Genotype under Different Iron-Limited Conditions. Plant Sci. 2017, 7, 1994. [Google Scholar] [CrossRef] [Green Version]
  45. D’Andria, R.; Magliulo, V.; Maggio, A.; Basile, G.; Arienzo, M. Soil and plant nutrient modifications in response to irrigation with CO2 enriched water on tomato. Act. Hortic. 1993, 335, 557–562. [Google Scholar] [CrossRef]
  46. Aguilera, C.; Checa, A.B. Efectos de la fertirrigación carbónica en tomate. Frutic. Hortic. Floric. 2000, 227, 747–755. [Google Scholar]
  47. Baron, J.J.; Gorski, S.F. Response of eggplant to a root environment enriched with CO2. Hortscience 1986, 21, 496–498. [Google Scholar]
  48. Karimi, R.; Salimi, F. Iron-chlorosis tolerance screening of 12 commercial grapevine (Vitis vinifera L.) cultivars based on phytochemical indices. Sci. Hortic. 2021, 283, 110111. [Google Scholar] [CrossRef]
  49. Shahsavandi, F.; Eshghi, S.; Gharaghani, A.; Ghasemi-Fasaei, R.; Jafarinia, M. Effects of bicarbonate induced iron chlorosis on photosynthesis apparatus in grapevine. Sci. Hortic. 2020, 270, 109427. [Google Scholar] [CrossRef]
  50. Hunter, J.J.; Visser, J.H. The effect of partial defoliation, leaf position and developmental stage of the vine on leaf chlorophyll concentration in relation to the photosynthetic activity and light intensity in the canopy of Vitis vinifera L. cv. Cabernet Sauvignon. S. Afr. J. Enol. Vitic. 1989, 10, 67–73. [Google Scholar] [CrossRef] [Green Version]
  51. Cartechini, A.; Palliotti, A. Effect of shanding on vine morphology and productivity and leaf gas exchange characteristics in grapevines in the fields. Am. J. Enol. Vitic. 1995, 46, 227–234. [Google Scholar]
  52. Gruber, B.; Kosegarten, H. Depressed growth of non-chlorotic vine grown in calcareous soil is an iron deficiency symptom prior to leaf chlorosis. J. Plant Nutr. Soil Sci. Z. Pflanzenernahr. Bodenkd. 2002, 165, 111–117. [Google Scholar] [CrossRef]
  53. Shahsavandi, F.; Eshghi, S. Effects of bicarbonate and Fe sources on vegetative growth and physiological traits of four grapevine cultivars. Commun. Soil Sci. Plant Anal. 2021, 52, 2401–2413. [Google Scholar] [CrossRef]
  54. Cinelli, F.; Fisichella, M.; Mulero, R. Morpho-physiological approaches to investigate lime-induced chlorosis in deciduous fruit tree species. J. Plant Nutr. 2003, 26, 2277–2294. [Google Scholar] [CrossRef]
  55. Pestana, M.; De Varennes, A.; Abadía, J.; Araújo, F. Differential tolerance to iron deficiency of citrus rootstock grown in nutrient solution. Sci. Hortic. 2005, 104, 25–36. [Google Scholar] [CrossRef] [Green Version]
  56. Charlson, D.V.; Cianzio, S.R.; Shoemaker, R.C. Associating SSR markers with soybean resistance to iron deficiency chlorosis. J. Plant Nutr. 2003, 26, 2267–2276. [Google Scholar] [CrossRef]
  57. Hanson, A.D.; Hitz, W.D. Metabolic responses of mesophytes of plant water deficits. Annu. Rev. Plant Physiol. 1982, 33, 163–203. [Google Scholar] [CrossRef]
  58. Huber, S.C.; Rogers, H.M.; Mowry, F.L. Effects of water stress on photosynthesis and carbon partitioning in soybean (Glycine max L. Merr) plants grown in the field at different CO2 levels. Plant Physiol. 1984, 76, 244–249. [Google Scholar] [CrossRef] [Green Version]
  59. Turner, N.C.; Stern, W.R.; Evans, P. Water Relations and Osmotic Adjustment of leaves and Roots of Lupins in Response to Water Deficits. Crop Sci. 1978, 27, 977–983. [Google Scholar] [CrossRef]
  60. Sanchez, R.; Gonzalez, M.R.; Martin, P. Relationships between chlorophyll content of vine leaves, predawn leaf water potential at veraison, and chemical and sensory attributes of wine. J. Sci. Food Agric. 2020, 100, 5251–5259. [Google Scholar] [CrossRef]
  61. Morgan, J.M. Osmoregulation and water stress in higher plants. Annu. Rev. Plant Physiol. Plant Mol. Biol. 1984, 35, 299–319. [Google Scholar] [CrossRef]
  62. Hunter, J.J.; Ruffner, H.P. Assimilate transport in grapevines-effect of phloem disruption. Aust. J. Grape Wine Res. 2001, 7, 118–126. [Google Scholar] [CrossRef]
  63. Patakas, A. Changes in the solutes contributing to osmotic potential during leaf ontogeny in grapevine leave. Am. J. Enol. Vitic. 2000, 51, 223–225. [Google Scholar]
  64. Salisbury, F.; Ross, C. Fisiología de las Plantas. Bioquímica Vegetal; Thomson, P., Ed.; Paraninfo: Madrid, Spain, 2006; Volume 2, ISBN 978-84-283-2718. [Google Scholar]
  65. Stolwijk, J.A.J.; Thimann, K.V. On the uptake of carbon dioxide and bicarbonate by roots, and its influence on growth. Plant Physiol. 1957, 32, 513–520. [Google Scholar] [CrossRef] [Green Version]
  66. Bergquist, N.O. Absorption of carbon dioxide by plant roots. Bot. Not. 1964, 117, 249–261. [Google Scholar]
  67. Arteca, R.N.; Poovaiah, B.W. Absorption of 14CO2 by potato roots and its subsequent translocation. J. Am. Soc. Hortic. Sci. 1982, 107, 398–401. [Google Scholar]
  68. Gonzalo, M.J.; Moreno, M.A.; Gogorcena, Y. Physiological responses and differential gene expression under iron deficiency conditions. J. Plant Physiol. 2011, 168, 887–893. [Google Scholar] [CrossRef] [Green Version]
  69. Brancadoro, L.; Rabotti, G.; Scienza, A.; Zoocchi, G. Mechanisms of Fe-efficiency in roots of Vitis spp. in response to iron deficiency stress. Plant Soil 1995, 171, 229–234. [Google Scholar] [CrossRef]
  70. López-Millán, A.F.; Morales, F.; Gogorcena, Y.; Abadía, A.; Abadía, J. Metabolic responses in iron-deficient tomato plants. J. Plant Physiol. 2009, 166, 375–384. [Google Scholar] [CrossRef]
  71. Jiménez, S.; Pinochet, J.; Abadía, A.; Moreno, M.A.; Gogorcena, Y. Tolerance Response to Iron Chlorosis of Prunus Selections as Rootstocks. HortScience 2008, 43, 304–309. [Google Scholar] [CrossRef] [Green Version]
  72. Abadía, J.; López-Millán, A.F.; Rombolà, A.; Abadía, A. Organic acids and Fe deficiency: A review. Plant Soil 2002, 241, 75–86. [Google Scholar] [CrossRef]
  73. Jiménez, S.; Gogorcena, Y.; Hévin, C.; Rombolà, A.D.; Ollat, N. Nitrogen nutrition influences some biochemical responses to iron deficiency in tolerant and sensitive genotypes of Vitis. Plant Soil 2007, 290, 343–355. [Google Scholar] [CrossRef] [Green Version]
  74. Hahn, G.; Marschner, H. Effect of acid irrigation and liming on root growth of Norway spruce. Plant Soil 1998, 199, 11–22. [Google Scholar] [CrossRef]
  75. Marastoni, L.; Lucini, L.; Varanini, Z. Changes in physiological activities and root exudation profile of two grapevine rootstocks reveal common and specific strategies for Fe acquisition. Sci. Rep. 2020, 10, 18839. [Google Scholar] [CrossRef]
  76. Winkler, A.J.; Williams, W.O. Starch and sugars of Vitis vinifera. Plant Physiol. 1945, 20, 412–432. [Google Scholar] [CrossRef] [Green Version]
  77. Wees, D.; Stewart, K. The influence of bicarbonate enrichment and aeration on dissolved carbon dioxide and oxygen in NFT nutrient solutions used for lettuce production. Soil. Cult. 1987, 3, 50–62. [Google Scholar]
  78. Arteca, R.N.; Poovaiah, B.W. Changes in phosphoenolpyruvate carboxylase and ribulose-1,5-bisphospahte carboxylase in Solanum tuberosum L. as affected by root-zone application of CO2. HortScience 1982, 17, 396–398. [Google Scholar]
  79. Wen-Hsin, W.; Lu, J.; Jones, A.R.; Mortley, G.; Loretan, P.A.; Bonsi, C.K.; Hill, W. Proximate composition, amino acid profile, fatty acid composition, and mineral content of peanut seeds hydroponically grown at elevated CO2 levels. J. Agric. Food Chem. 1997, 45, 3863–3866. [Google Scholar]
  80. Nakayama, F.S.; Bucks, D.A. Using subsurface trickle system for carbon dioxide enrichment. In Proceedings of the 15th National Agricultural Plastics Congress, Tucson, AZ, USA, 13–17 April 1980; Jensen, M.H., Oebker, N.F., Eds.; National Agricultural Plastics Association: Manchester, MO, USA; pp. 13–18. [Google Scholar]
Figure 1. Evolution of the soil pH after irrigation with carbonated water in pots without plants and with 3 substrates. Treatments: schist neutral soil (S), clay medium calcareous soil (m Ca), and highly calcareous soil (H Ca) treated with non-carbonated water (pH 7.5) and 400 ppm CO2-carbonated water (pH 6.5).
Agriculture 12 00792 g001
Table 1. CO2 irrigation levels per pot (g/pot). Barrel soil pots. Irrigation treatment: Control, 200 ppm CO2, 400 ppm CO2, and 800 ppm CO2.
Irrigation TreatmentsWater pHPreparation of CO2 SolutionCalculated CO2 Gas Applied per Pot (CO2 g/pot)
Control CO2 at 0 ppm7.5No CO2 added (regular tap water)0
High: CO2 at 800 ppm6.0CO2 gas dissolved under 1 atmosphere of pressure during 15 min in 35 L of tap water 37.52
Medium: CO2 at 400 ppm6.51 L of 800 ppm CO2 solution, added to 1.75 L tap water17.76
Low: CO2 at 200 ppm7.0250 mL of 800 ppm CO2 solution, added to 2.5 L tap water8.88
Table 2. Soil analysis for the three types of soil chosen: pH, limestone %, and Ca2CO3 %.
Treatment/Type of SoilpHLimestone %CaCO3 %
Neutral calcareous soil (Control)7.71 (±0.02)0.00 (±0.0)11.61 (±0.1)
Medium calcareous clayey soil7.93 (±0.03)10.41 (±0.1)32.63 (±0.2)
Highly calcareous clayey soil8.17 (±0.01)12.81 (±0.1)43.50 (±0.1)
Table 3. Experiment 1. Bare soil pots. Quantitation of soil pH, carbonates, and mineral composition in a Medium calcareous soil with 10.4% limestone, pH 8.08, and 24.03% CaCO3. Soil samples were taken after irrigation for 4 months. Different carbonated irrigation treatments: control (tap water pH 7.5), CO2 at 200 ppm (pH 7), CO2 at 400 ppm (pH 6.5), and CO2 at 800 ppm (pH 6). Values with different letters denote a statistically significant difference (p < 0.05). “ns” means no differences. The results show the mean value.
Treatment
Bare Soil Pots/CO2 Doses
pHCaCO3 (%)Ca (meq/100 g Soil)Mg (meq/100 g Soil)
Control CO2 at 0 ppm pH 7.58.08 ± 1.15ns24.0 ± 2.61ab88.7 ± 9.75b4.6 ± 0.23a
Low: CO2 at 200 ppm pH 78.1 ± 1.09ns24.9 ± 2.35a110.5 ± 8.37b3.5 ± 0.15a
Medium: CO2 at 400 ppm pH 6.58.03 ± 0.98ns24.9 ± 2.87a106 ± 11.51b1.4 ± 0.08b
High: CO2 at 800 ppm pH 67.94 ± 1.06ns20.9 ± 2.05b283.3 ± 9.44a4.8 ± 0.31a
Treatment
Bare Soil Pots/CO2 Doses
p (ppm)Fe (ppm)Mn (ppm)Zn (ppm)
Control CO2 at 0 ppm pH 7.54.4 ± 0.36b1.2 ± 0.12b3.8 ± 1.01c3.0 ± 0.23b
Low: CO2 at 200 ppm pH 77.4 ± 0.89ab1.5 ± 0.25b5.2 ± 1.24b2.9 ± 0.15b
Medium: CO2 at 400 ppm pH 6.59.9 ± 1.74a4.1 ± 1.05a8.6 ± 0.78a3.9 ± 0.08a
High: CO2 at 800 ppm pH 66.6 ± 0.45b2.1 ± 0.39b4.4 ± 0.66bc2.2 ± 0.31b
Table 4. Mineral composition of the soil in pots with plants with three substrates. Type of soil: schist neutral soil, medium calcareous clay soil (medium calc-clay), and highly calcareous clay soil. Treatment: treated with non-acidified water (Control pH 7.5) and water carbonated with 400 ppm CO2. The results correspond to the third-year experiment on post-harvest samples (after 6 months of carbonated irrigation). a,b: different letters denote a statistically significant difference (p < 0.05) between treatment for the same type of soil. The results show the mean value and standard deviation.
Type of SoilIrrigation TreatmentsFe (mg/kg Soil)Zn (mg/kg Soil)Mn (mg/kg Soil)Cu (mg/kg Soil)Carbonates (%)
Schist Neutral SoilControl 0 ppm CO2 1.88 ± 0.751.90 ± 0.24 b4.67 ± 0.23 b0.34 ± 0.03 b28.42 ± 3.23 b
Schist Neutral Soil400 ppm CO21.62 ± 0.524.82 ± 0.0 a7.54 ± 3.63 a0.65 ± 0.02 a42.29 ± 4.63 a
Medium calc-clayControl6.20 ± 0.1 a1.75 ± 0.06 b2.77 ± 0.270.87 ± 0.09 b33.58 ± 3.27
Medium calc-clay400 ppm CO25.08 ± 0.19 b2.54 ± 0.17 a2.73 ± 0.231.33 ± 0.09 a37.83 ± 2.23
Highly calcareous clayControl4.08 ± 0.2 b2.38 ± 0.41 b2.36 ± 0.49 b1.17 ± 0.1636.79 ± 3.49
Highly calcareous clay400 ppm CO25.34 ± 0.83 a5.34 ± 0.36 a5.13 ± 0.19 a1.01 ± 0.1533.29 ± 2.19
Table 5. Quantitation of chlorophyll (mg/g d.w.), magnesium (Mg mg/g d.w.), iron (Fe µ/g d.w.) and manganese (Mn µ/g d.w.) in dried (d.w.) leaves of V. vinifera cv. Tempranillo. Plants in pots with three different substrates. Treatments: schist soil, medium calcareous soil clay (medium calc-clay), and highly calcareous clay treated with non-acidified water (Control pH 7.5) and 400 ppm CO2-acidified water (pH 6.5). a,b: different letters denote a statistically significant difference (p < 0.05) between treatment for the same type of soil. The results show the mean value and standard deviation.
FIRST YEAR
Type of SoilIrrigation TreatmentsChlorophyll (mg/g d.w.)Fe (µg/kg d.w.)Mn (mg/g d.w.)Mg (mg/g d.w.)
Schist Neutral SoilControl 0 ppm CO2 0.669 ± 0.03 b68.83 ± 8.4668.94 ± 12.282.97 ± 0.25
Schist Neutral Soil400 ppm CO21.074 ± 0.02 a83.01 ± 17.9164.02 ± 7.111.66 ± 0.39
Medium calc-clayControl 0 ppm CO2 0.881 ± 0.0499.60 ± 21.43 a64.19 ± 11.614.66 ± 0.68 a
Medium calc-clay400 ppm CO20.916 ± 0.0565.77 ± 4.58 b55.44 ± 9.391.75 ± 0.50 b
Highly calcareous clayControl 0 ppm CO2 0.732 ± 0.07 b95.67 ± 8.33 b29.39 ± 2.86 b5.03 ± 1.06
Highly calcareous clay400 ppm CO21.013 ± 0.01 a193.36 ± 0.31 a54.75 ± 3.91 a3.66 ± 0.12
SECOND YEAR
Type of SoilIrrigation TreatmentsChlorophyll (mg/g d.w.)Fe (πg/kg d.w.)Mn (mg/g d.w.)Mg (mg/g d.w.)
Schist Neutral SoilControl 0 ppm CO2 1.467 ± 0.03 b38.12 ± 4.36 a88.89 ± 2.37 a3.67 ± 0.27 a
Schist Neutral Soil400 ppm CO22.033 ± 0.08 a28.49 ± 3.16 b75.32 ± 4.95 b2.69 ± 0.12 b
Medium calc-clay Control 0 ppm CO2 1.351 ± 0.1131.61 ± 6.3247.14 ± 4.19 a3.43 ± 0.17
Medium calc-clay400 ppm CO21.574 ± 0.0929.49 ± 4.4835.29 ± 3.39 b3.44 ± 0.16
Highly calcareous clayControl 0 ppm CO2 1.254 ± 0.17 b22.94 ± 0.92 b48.12 ± 1.68 b3.81 ± 0.09 b
Highly calcareous clay400 ppm CO22.007 ± 0.10 a26.60 ± 1.35 a61.41 ± 1.12 a4.64 ± 0.13 a
THIRD YEAR
Type of SoilIrrigation TreatmentsChlorophyll (mg/g d.w.)
Schist Neutral SoilControl 0 ppm CO2 2.49 ± 0.3 b
Schist Neutral Soil400 ppm CO23.46 ± 0.8 a
Medium calc-clayControl 0 ppm CO2 2.29 ± 0.11
Medium calc-clay400 ppm CO22.68 ± 0.19
Highly calcareous clayControl 0 ppm CO2 2.13 ± 0.17 b
Highly calcareous clay400 ppm CO23.41 ± 0.10 a
Table 6. Quantitation of sucrose, glucose, fructose, and starch in harvest leaves of V. vinifera (L.) cv. Tempranillo. Plants in pots with three different substrates. Treatments: schist soil, medium calcareous clay soil (medium calc-clay), and highly calcareous clay soil, treated with non-acidified water (control pH 7.5) and 400 ppm CO2-acidified water (pH 6.5). a,b: different letters denote a statistically significant difference (p < 0.05) between treatment for the same type of soil Values with different letters denote a statistically significant difference (p < 0.05). Results show the mean value and standard deviation.
Type of SoilIrrigation TreatmentsSucrose (mg/g d.w.)Glucose (mg/g d.w.)Fructose (mg/g d.w.)Starch (mg/g d.w.)
Schist Neutral SoilControl 0 ppm CO2 146.3 ± 1.93 b31.9 ± 8.81 b27.2 ± 6.9 b23.22 ± 4.84 a
Schist Neutral Soil400 ppm CO2266.5 ± 26.2 a42.8 ± 6.32 a38.5 ± 5.4 a13.01 ± 2.53 b
Medium calc-clayControl 0 ppm CO2 207.9 ± 31.8 b19.9 ± 4.73 b22.3 ± 3.8 b6.66 ± 1.09 b
Medium calc-clay400 ppm CO2342.9 ± 45.1 a54.2 ± 3.61 a39.2 ± 0.5 a10.05 ± 1.75 a
Highly calcareous clayControl 0 ppm CO2 194.4 ± 24.9 a41.7 ± 3.44 b14.3 ± 2.2 b3.52 ± 0.73 b
Highly calcareous clay400 ppm CO249.3 ± 17.6 b65.6 ± 10.9 a41.4 ± 5.3 a10.82 ± 1.69 a
Table 7. Quantitation of malic and tartaric acid in leaves of V. vinifera (L.) cv. Tempranillo, at beginning to ripen (V), maturation (M), and harvest (H). Plants in pots with three different substrates. Treatments: schist soil, medium calcareous clay soil (medium calc-clay), and highly calcareous clay soil, treated with non-acidified water (control pH 7.5) and 400 ppm CO2-acidified water (pH 6.5). a,b: different letters denote a statistically significant difference (p < 0.05) between treatment for the same type of soil. Values with different letters denote a statistically significant difference (p < 0.05). The results show the mean value and standard deviation.
Type of SoilIrrigation TreatmentsMalic (mg/g d.w.) VMalic (mg/g d.w.) MMalic (mg/g d.w.) HTartaric (mg/g d.w.) VTartaric (mg/g d.w.) MTartaric (mg/g d.w.) H
Schist Neutral SoilControl 0 ppm CO2 18.35 ± 1.119.13 ± 1.217.2 ± 0.7 b141.7 ± 13.1163.4 ± 14.6 b151.1 ± 6.91 b
Schist Neutral Soil400 ppm CO219.74 ± 1.918.06 ± 1.022.7 ± 0.4 a204.8 ± 14.5336.3 ± 64.0 a174.5 ± 15.4 a
Medium calc-clayControl 0 ppm CO2 20.99 ± 3.820.73 ± 1.417.5 ± 0.9 b197.0 ± 39.7366.3 ± 39.6154.8 ± 4.1 b
Medium calc-clay400 ppm CO215.54 ± 1.519.94 ± 0.624.8 ± 1.1 a262.4 ± 40.7364.6 ± 31.9195.3 ± 7.8 a
Highly calcareous clayControl 0 ppm CO2 20.36 ± 0.821.89 ± 1.912.6 ± 1.9 b209.9 ± 25.1317.5 ± 68.1 a109.7 ± 10.5 b
Highly calcareous clay400 ppm CO219.98 ± 1.921.11 ± 1.926.4 ± 3.4 a201.7 ± 14.4214.5 ± 50.1 b205.9 ± 26.2 a
Table 8. Quantitation of shoot and root starch, and citric and tartaric acid in roots of V. vinifera (L.) cv. Tempranillo. Plants in pots with three different substrates. Treatments: schist soil, medium calcareous clay soil (medium calc-clay), and highly calcareous clay soil, treated with non-acidified water (control pH 7.5) and 400 ppm CO2-acidified water (pH 6.5). a,b: different letters denote a statistically significant difference (p < 0.05) between treatment for the same type of soil. Values with different letters denote a statistically significant difference (p < 0.05). The results show the mean value and standard deviation.
Type of SoilIrrigation TreatmentsShoot Starch (% d.w.)
1st Year
Root Starch (% d.w.)
1st Year
Root Citric Acid (mg/g d.w.)
2nd Year
Root Tartaric Acid (mg/g d.w.) 2nd Year
Schist Neutral SoilControl 0 ppm CO2 7.8 ± 0.912.7 ± 0.6 b3.0 ± 0.5 b380.2 ± 74.1 b
Schist Neutral Soil400 ppm CO28.7 ± 0.729.8 ± 5.9 a8.6 ± 0.7 a505.8 ± 56.3 a
Medium calc-clayControl 0 ppm CO2 5.7 ± 0.8 b14.5 ± 0.9 b4.2 ± 1.4 b579.9 ± 52.6 a
Medium calc-clay400 ppm CO210.9 ± 0.7 a23.1 ± 4.3 a10.3 ± 0.6 a254.3 ± 19.6 b
Highly calcareous clayControl 0 ppm CO2 5.2 ± 0.5 b12.7 ± 1.3 b5.7 ± 0.81506.1 ± 485.9 a
Highly calcareous clay400 ppm CO29.9 ± 0.6 b32.9 ± 2.1 a5.9 ± 0.7326.9 ± 19.27 b
Table 9. Quantitation of dried weight (g), shoot length (cm), dried root weight (g), and leaf surface (cm2) of V. vinifera (L.) cv. Tempranillo plants in pots with three different substrates. Treatments: schist soil, medium calcareous clay soil (medium calc-clay), and highly calcareous clay soil, treated with non-acidified water (control pH 7.5) and 400 ppm CO2-acidified water (pH 6.5). a,b: different letters denote a statistically significant difference (p < 0.05) between treatment for the same type of soil. Values with different letters denote a statistically significant difference (p < 0.05). The results show the mean value and standard deviation.
FIRST YEAR
Type of SoilIrrigation TreatmentsDried Root Weight (g)Dried Shoot Weight (g)Shoot Length (cm)
Schist Neutral SoilControl 0 ppm CO2 82.61 ± 3.827.91 ± 3.2 b97.12 ± 7.3
Schist Neutral Soil400 ppm CO282.39 ± 9.439.89 ± 2.1 a101.64 ± 8.6
Medium calc-clayControl 0 ppm CO2 58.25 ± 15.617.29 ± 3.862.21 ± 2.9
Medium calc-clay400 ppm CO254.33 ± 5.216.96 ± 2.172.29 ± 1.13
Highly calc-clayControl 0 ppm CO2 21.53 ± 2.4 a12.70 ± 0.7 a19.71 ± 3.5
Highly calc-clay400 ppm CO27.67 ± 2.9 b1.84 ± 0.3 b19.51 ± 5.8
SECOND YEAR
Type of SoilIrrigation TreatmentsDried Root Weight (g)Dried Shoot Weight (g)Shoot Length (cm)Leaf Surface (cm2)
Schist Neutral SoilControl 0 ppm CO2 95.49 ± 9.562.54 ± 7.0899.2 ± 8.43274.3 ± 467.9
Schist Neutral Soil400 ppm CO292.03 ± 7.1567.40 ± 4.2096.4 ± 4.53490.3 ± 426.3
Medium calc-clayControl 0 ppm CO2 102.75 ± 6.45 b51.11 ± 5.8282.7 ± 5.4 b3279.5 ± 387.0 b
Medium calc-clay400 ppm CO2129.29 ± 18.0 a52.99 ± 8.6794.2 ± 4.8 a4069.5 ± 621.0 a
Highly calc-clayControl 0 ppm CO2 83.94 ± 5.32 b14.52 ± 2.54 a68.4 ± 9.4 a2024.3 ± 95.9
Highly calc-clay400 ppm CO2102.08 ± 13.9 a10.90 ± 2.44 b45.3 ± 4.2 b1512.3 ± 335.2
Table 10. Quantitation of yield components and grape composition. V. vinifera (L.) cv. Tempranillo plants in pots with two different substrates. Treatments: schist soil and medium calcareous clay soil (medium calc-clay), treated with non-acidified water (control pH 7.5) and 400 ppm CO2-acidified water (pH 6.5). Brix = total soluble solids, TA = titratable acidity. The results correspond to three-year-old plants. a,b: different letters denote a statistically significant difference (p < 0.05) between treatment for the same type of soil. Values with different letters denote a statistically significant difference (p < 0.05). The results show the mean value and standard deviation.
Type of SoilIrrigation TreatmentsBerry Kg/VinepHBrixTA (g/L)Tartaric Acid (g/L)Malic Acid (g/L)
Schist Neutral SoilControl 0 ppm CO2 17.2 ± 0.7 b3.91 ± 0.0079.8 ± 0.2 a4.12 ± 0.073.85 ± 0.13 b2.08 ± 0.08
Schist Neutral Soil400 ppm CO222.7 ± 0.4 a3.95 ± 0.0099.5 ± 0.2 b3.82 ± 0.073.94 ± 0.11 a1.78 ± 0.02
Medium calc-clayControl 0 ppm CO2 17.5 ± 0.9 b3.78 ± 0.00610.5 ± 0.3 b4.80 ± 0.01 a4.45 ± 0.272.21 ± 0.15
Medium calc-clay400 ppm CO224.8 ± 1.1 a3.75 ± 0.0110.8 ± 0.1 a4.35 ± 0.01 b3.85 ± 0.022.24 ± 0.05
Publisher’s Note: MDPI stays neutral with regard to jurisdictional claims in published maps and institutional affiliations.

