
Study on the Vibration Characteristics of Rape Plants Based on High-Speed Photography and Image Recognition

Abstract
:1. Introduction
2. Materials and Methods
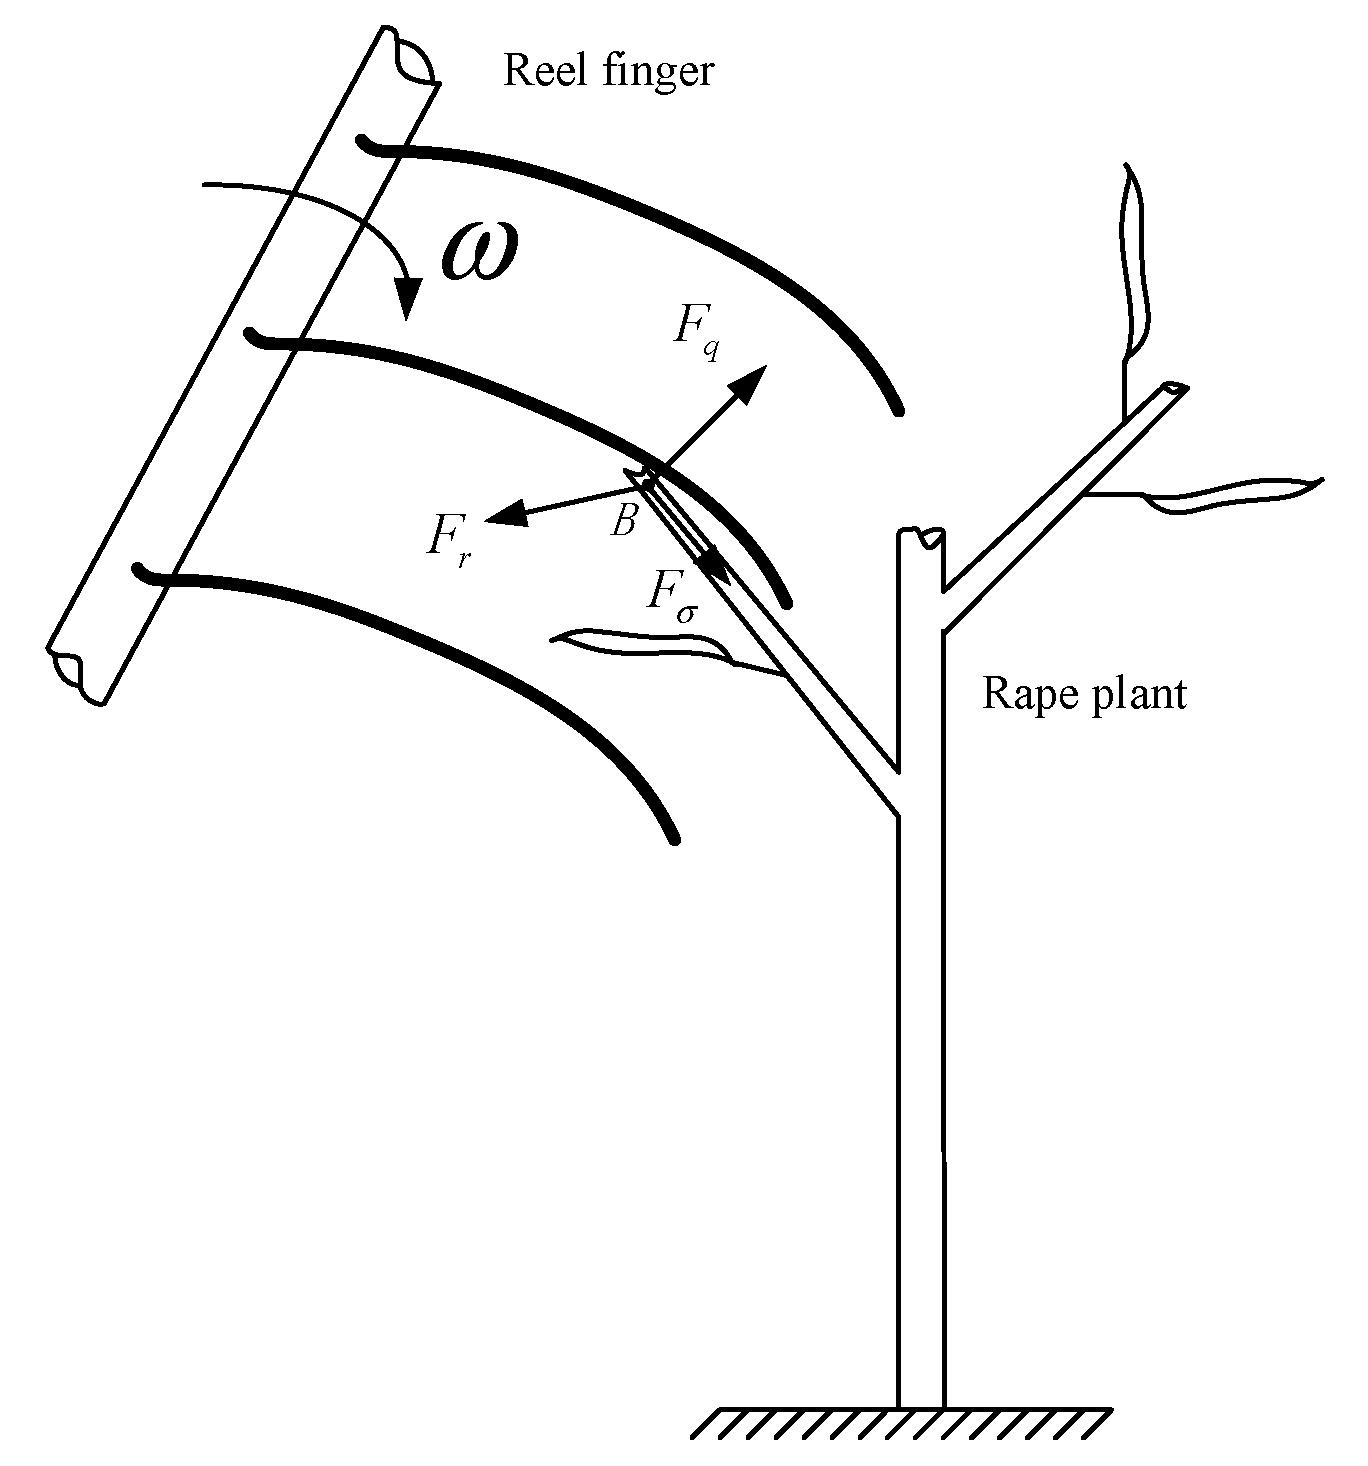
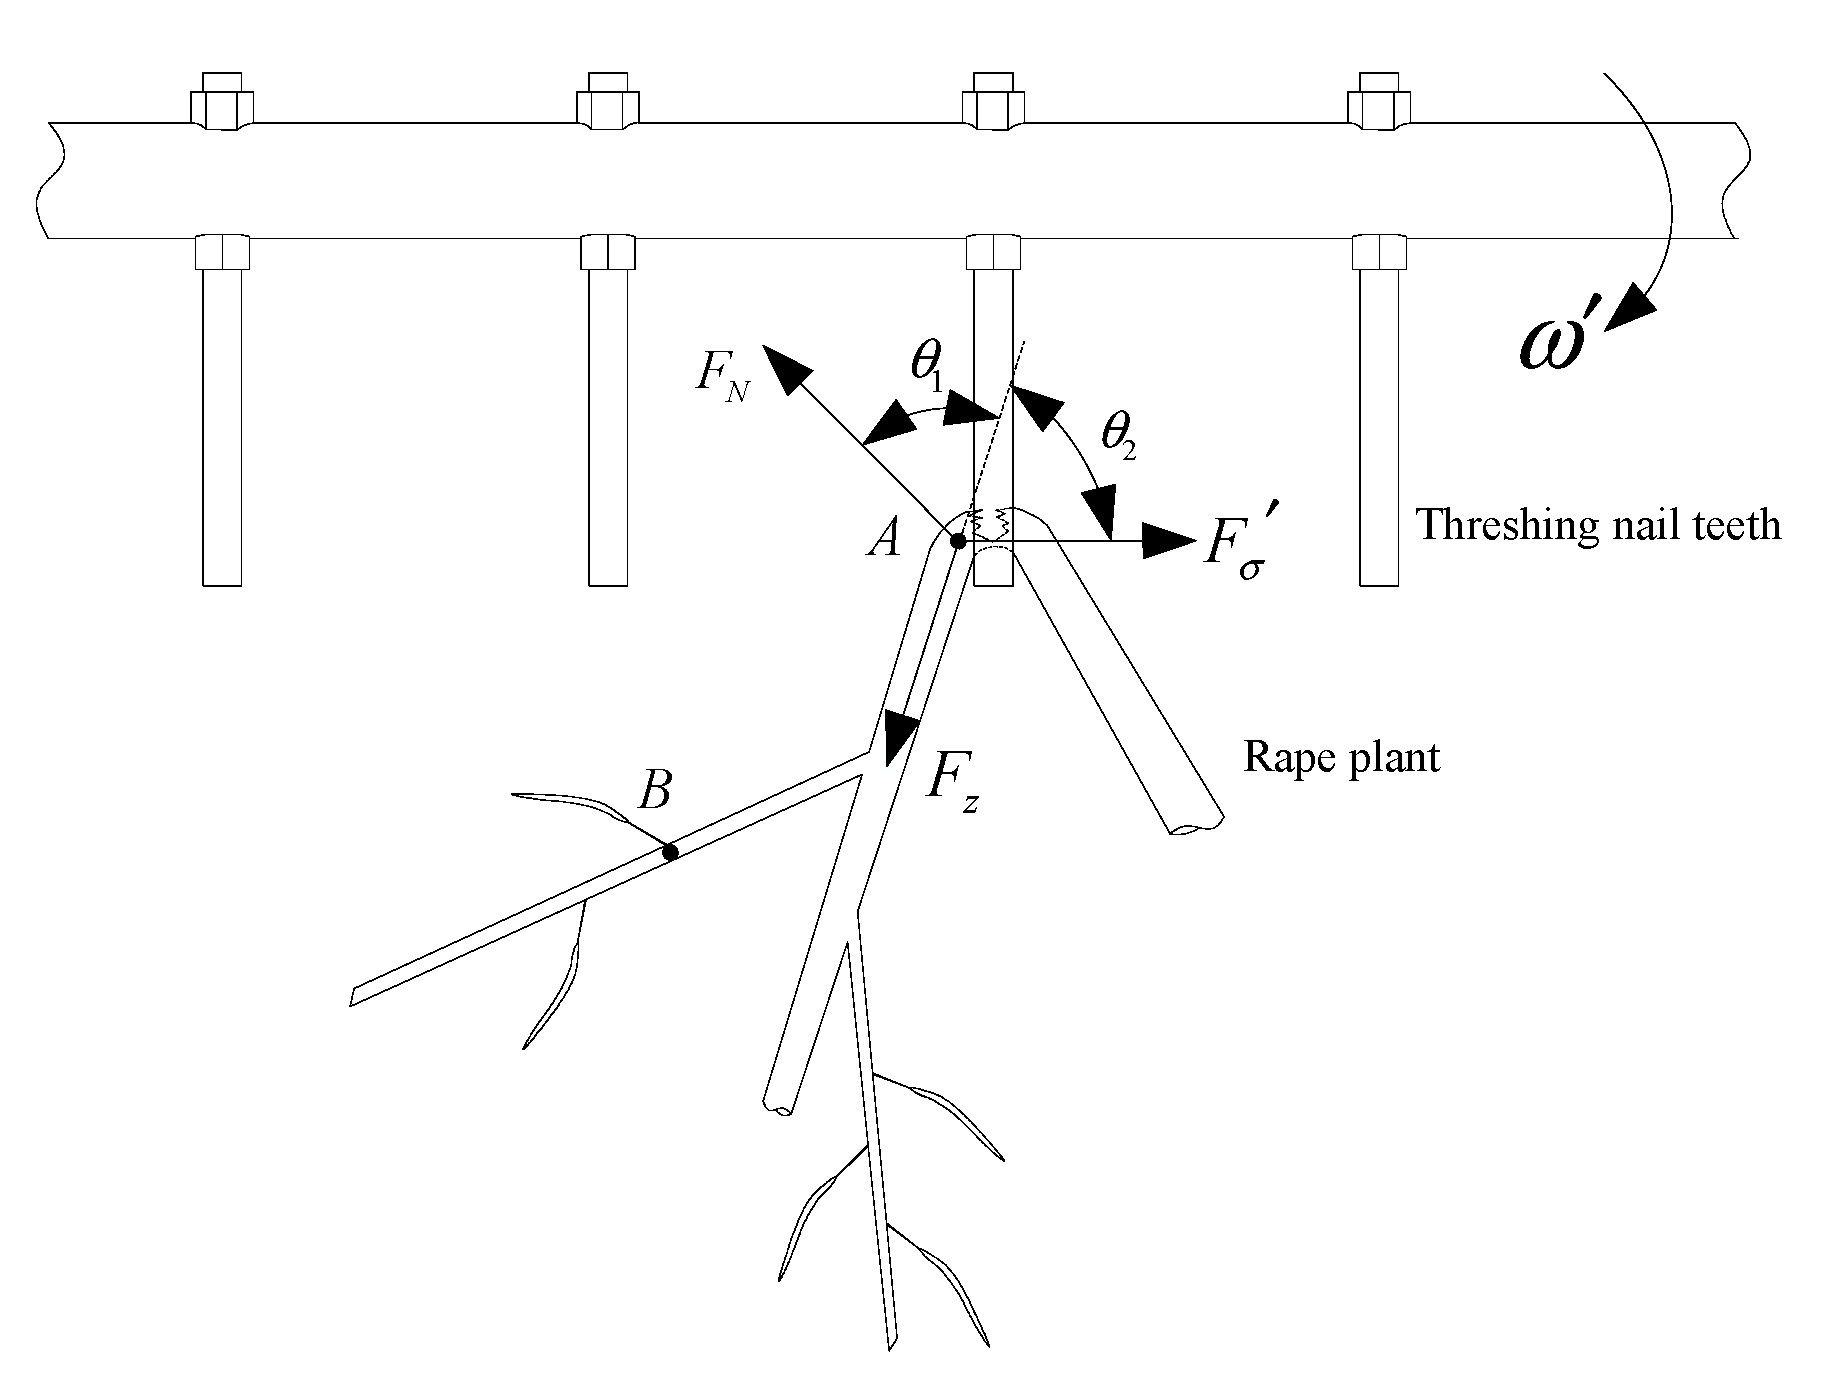
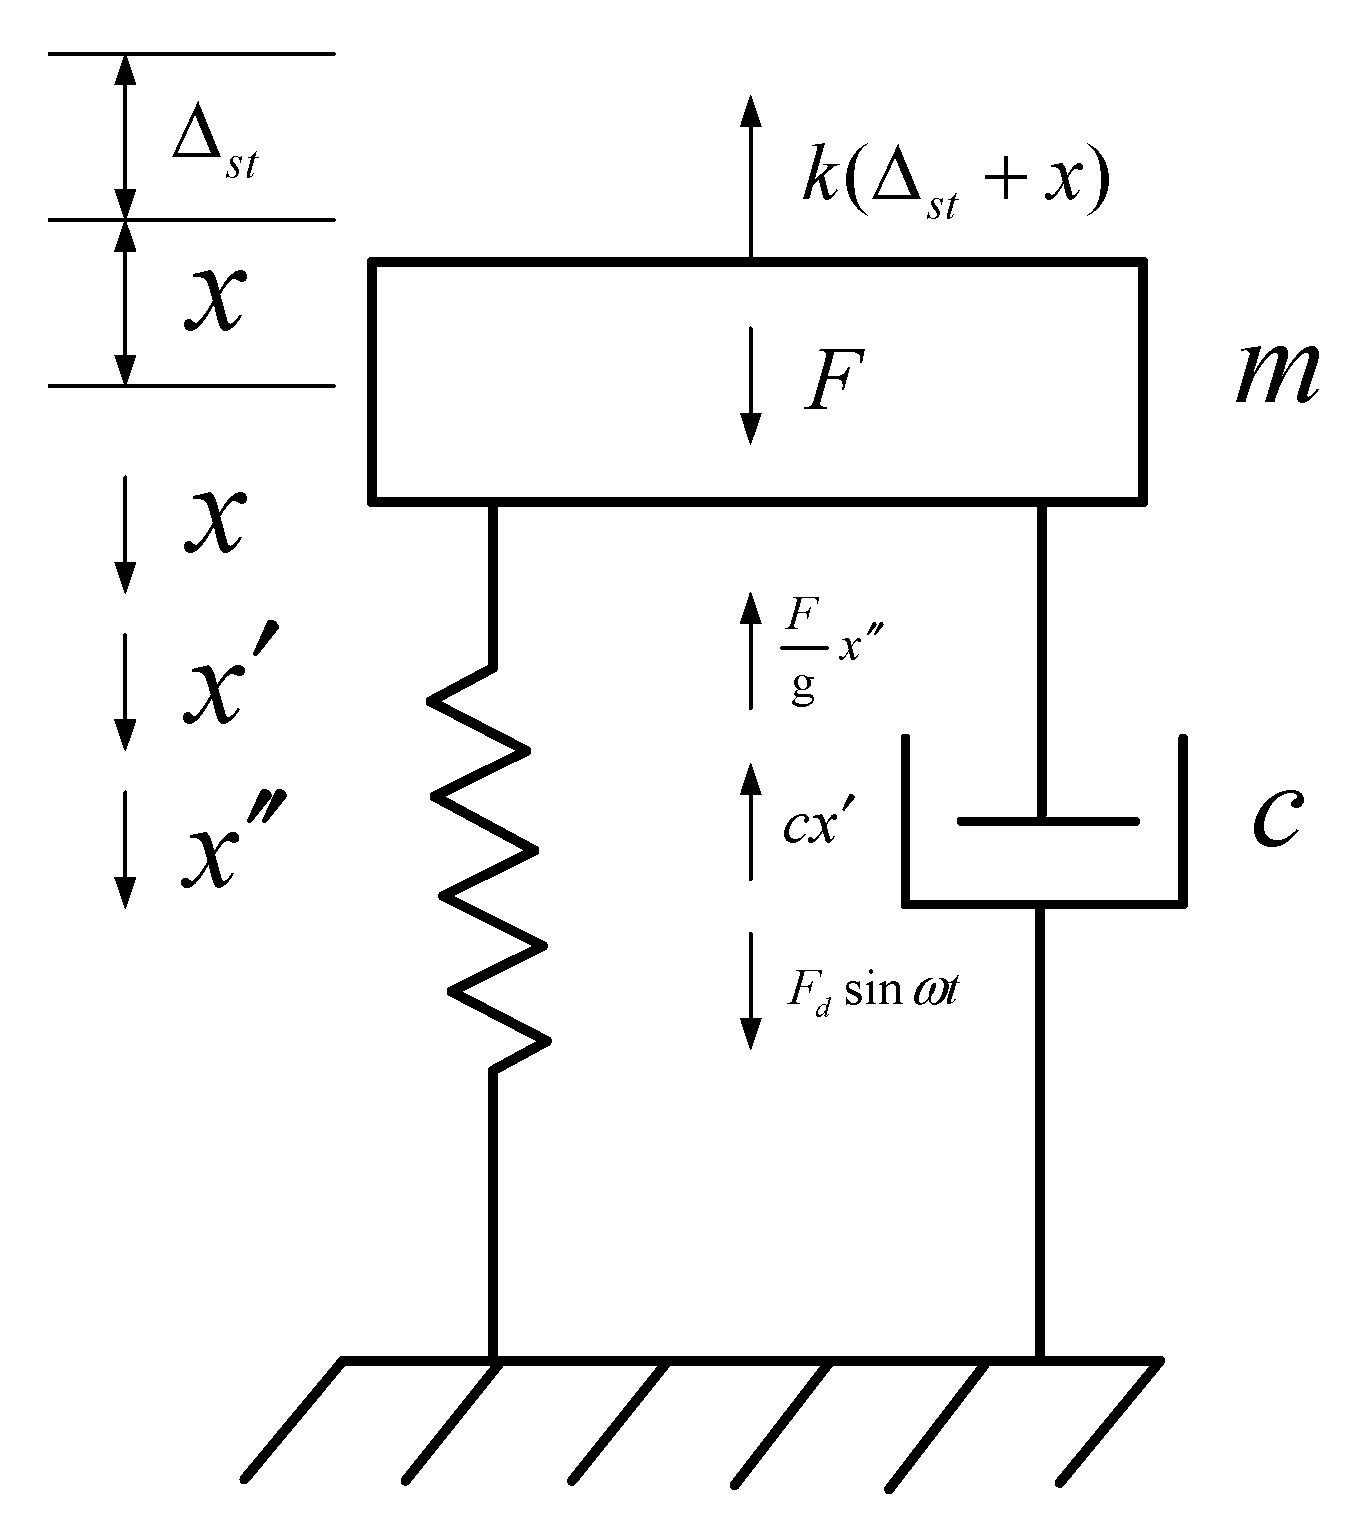
2.1. Stress Analysis of Rape during Combined Harvest
2.2. Test Materials and Method
2.3. Measurement Method of Rape Plant Vibration
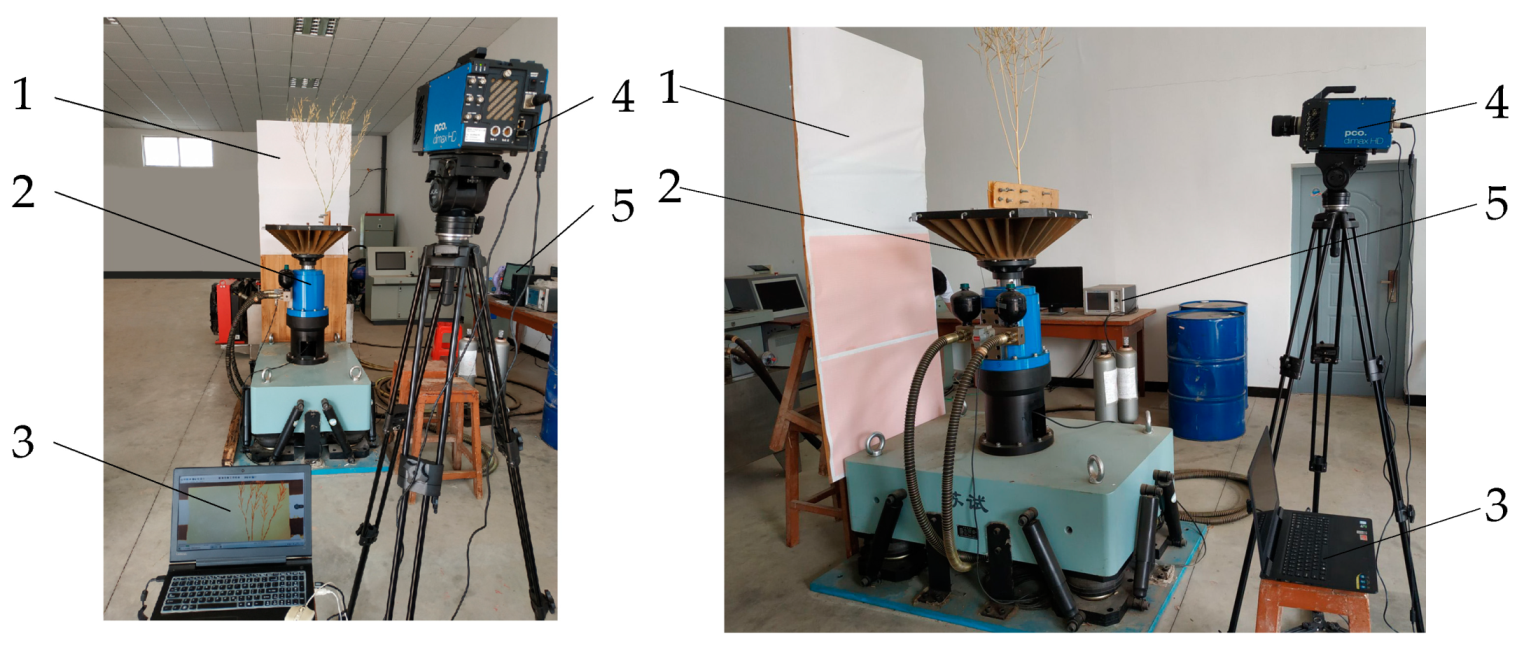
2.3.1. Image Acquisition
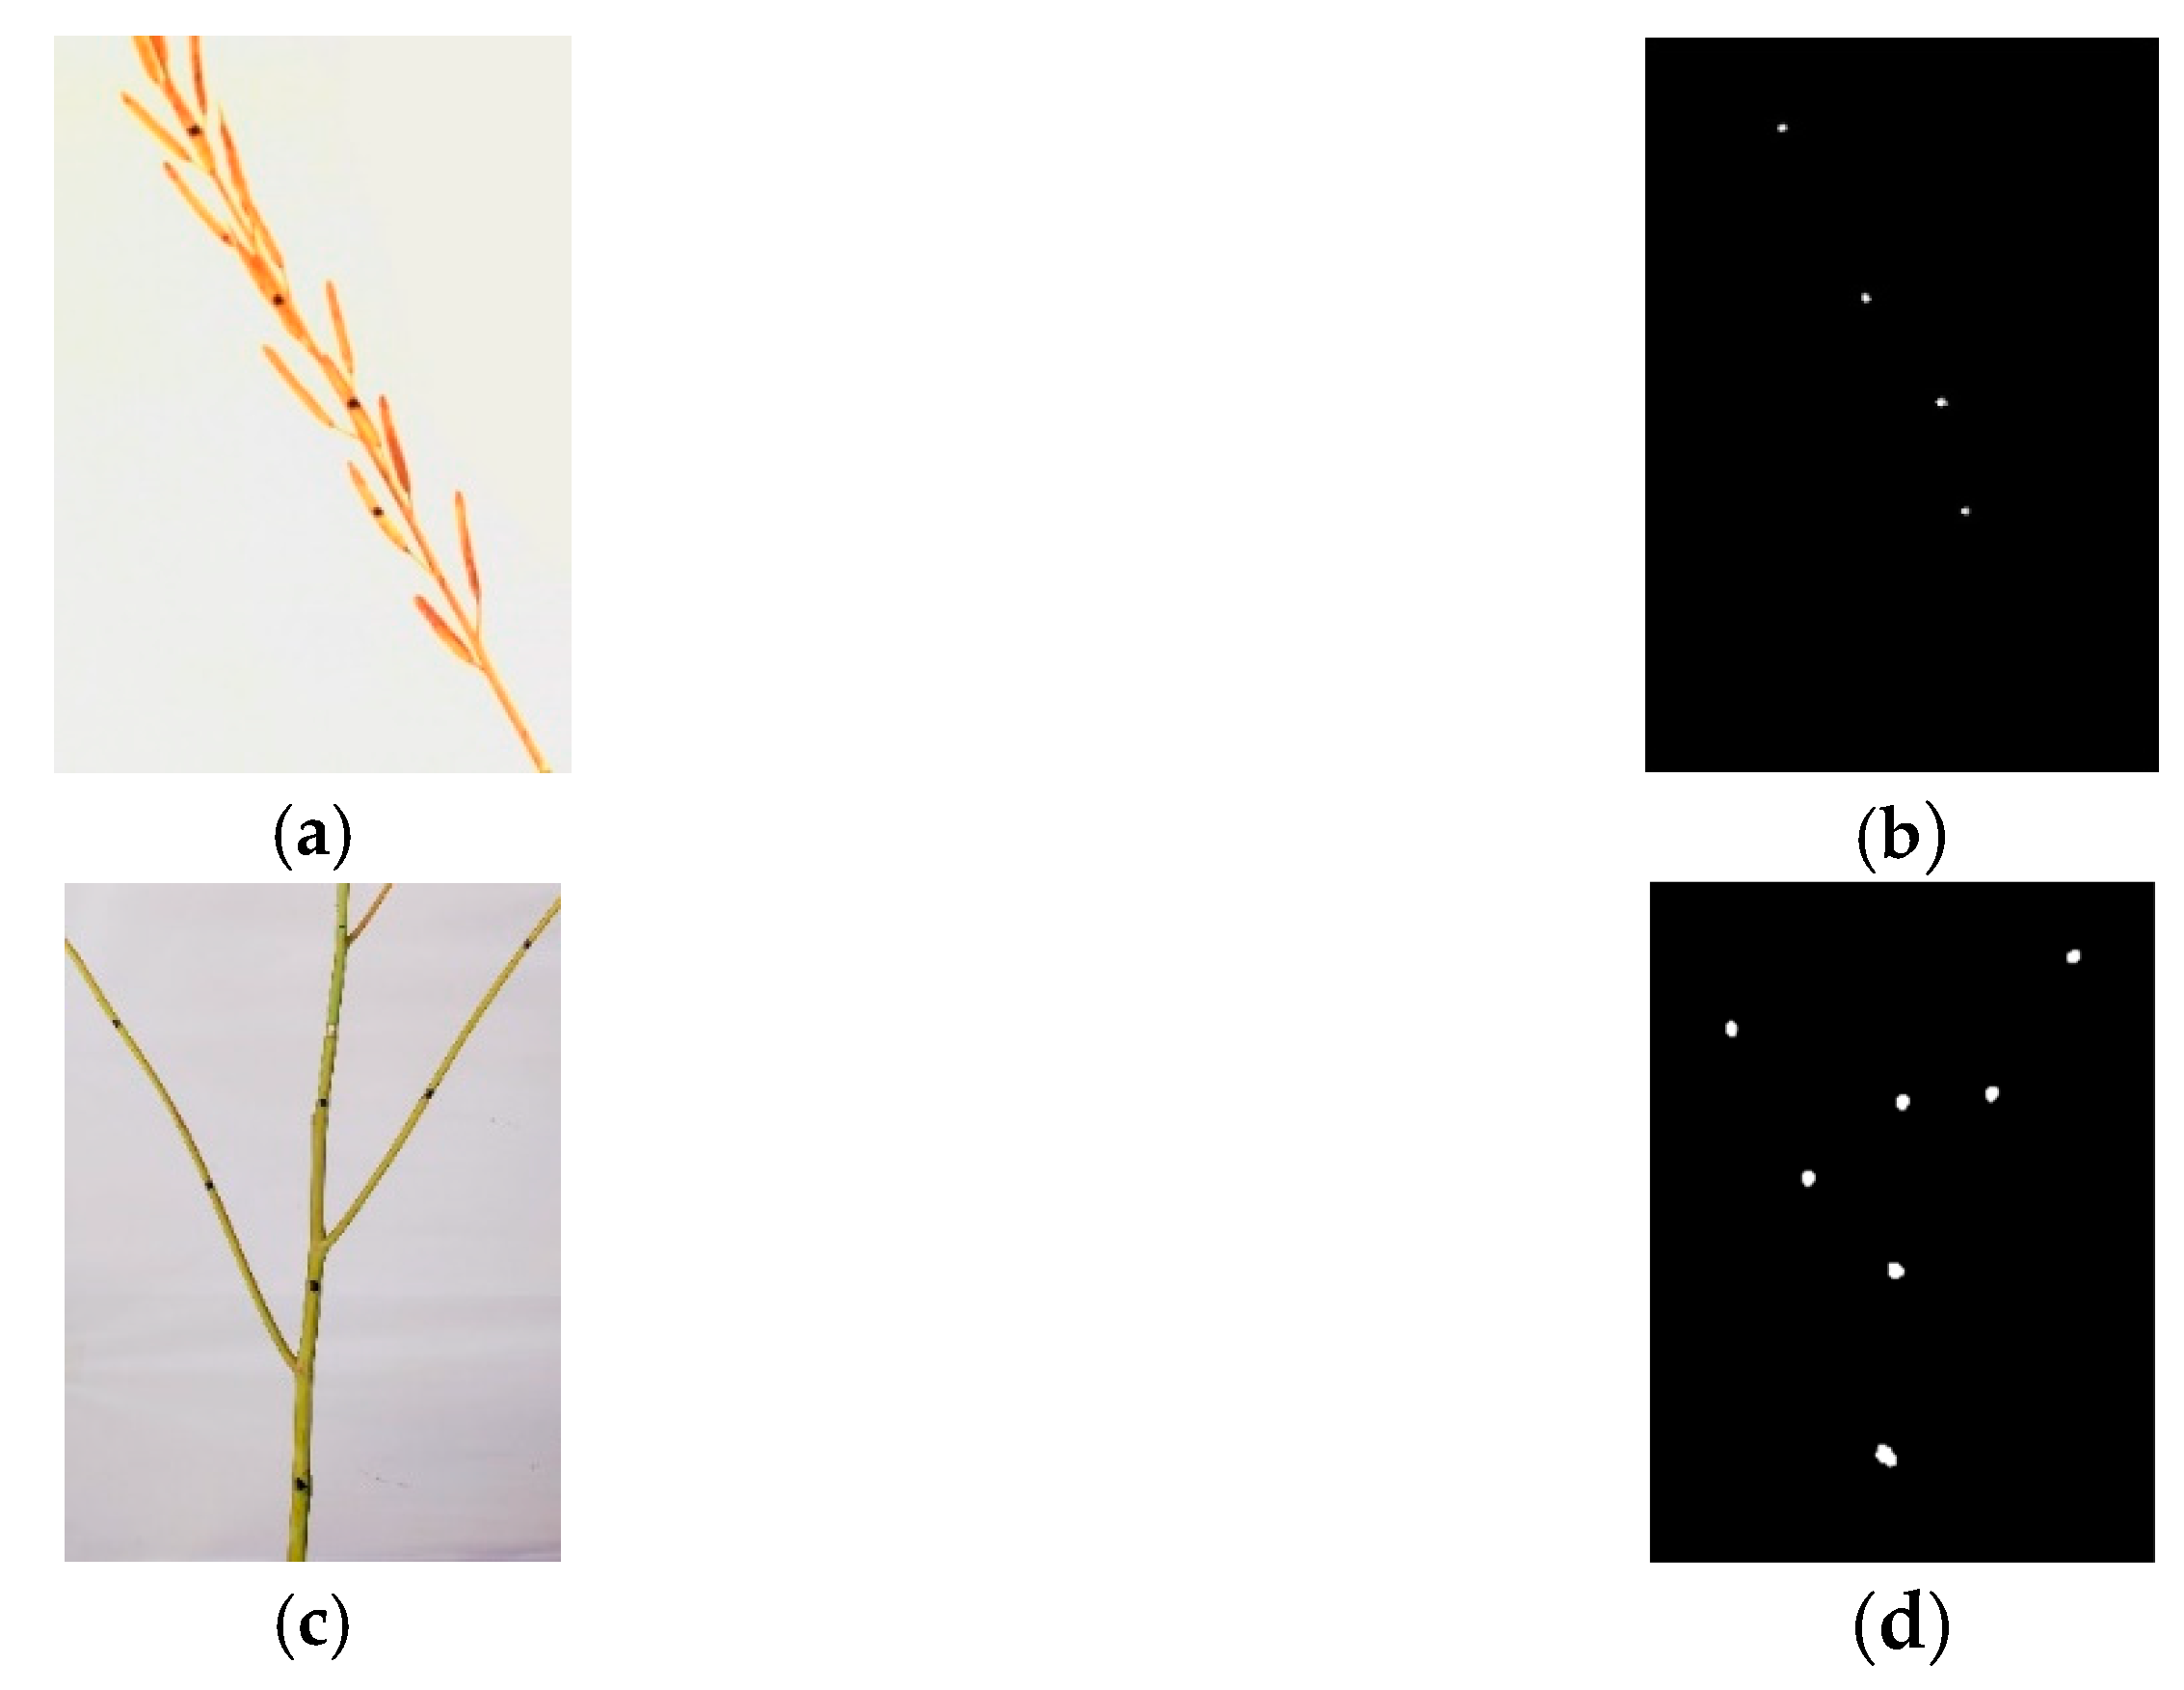
2.3.2. Feature Point Coordinate Recognition
2.3.3. Measurement Accuracy and Feasibility Analysis
3. Results and Discussion
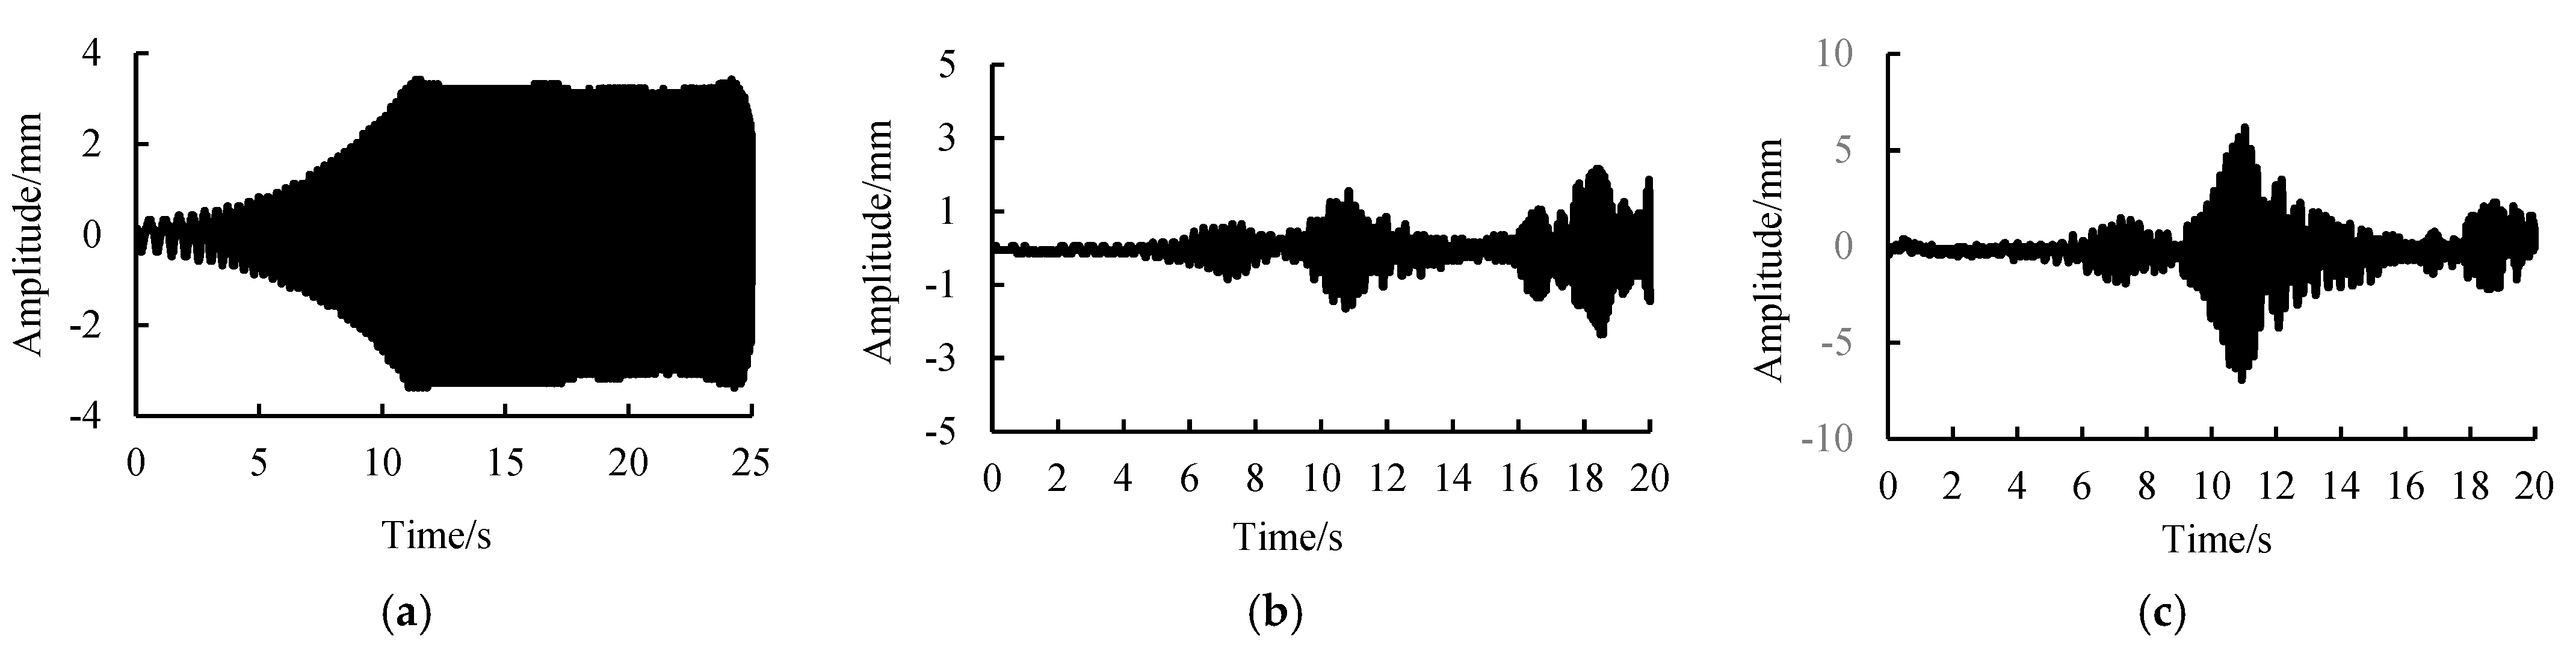
3.1. Sweep Frequency Vibration Test of the Rape Plant
3.2. Sweep Frequency Vibration Test of the Rape Plant
3.3. Sweep Frequency Vibration Test of the Rape Plant
4. Discussion
4.1. Universality Analysis of the Vibration Measurement Method
4.2. Effect of Different Frequencies on Vibration Modes of Rape Plants and Grain Falling
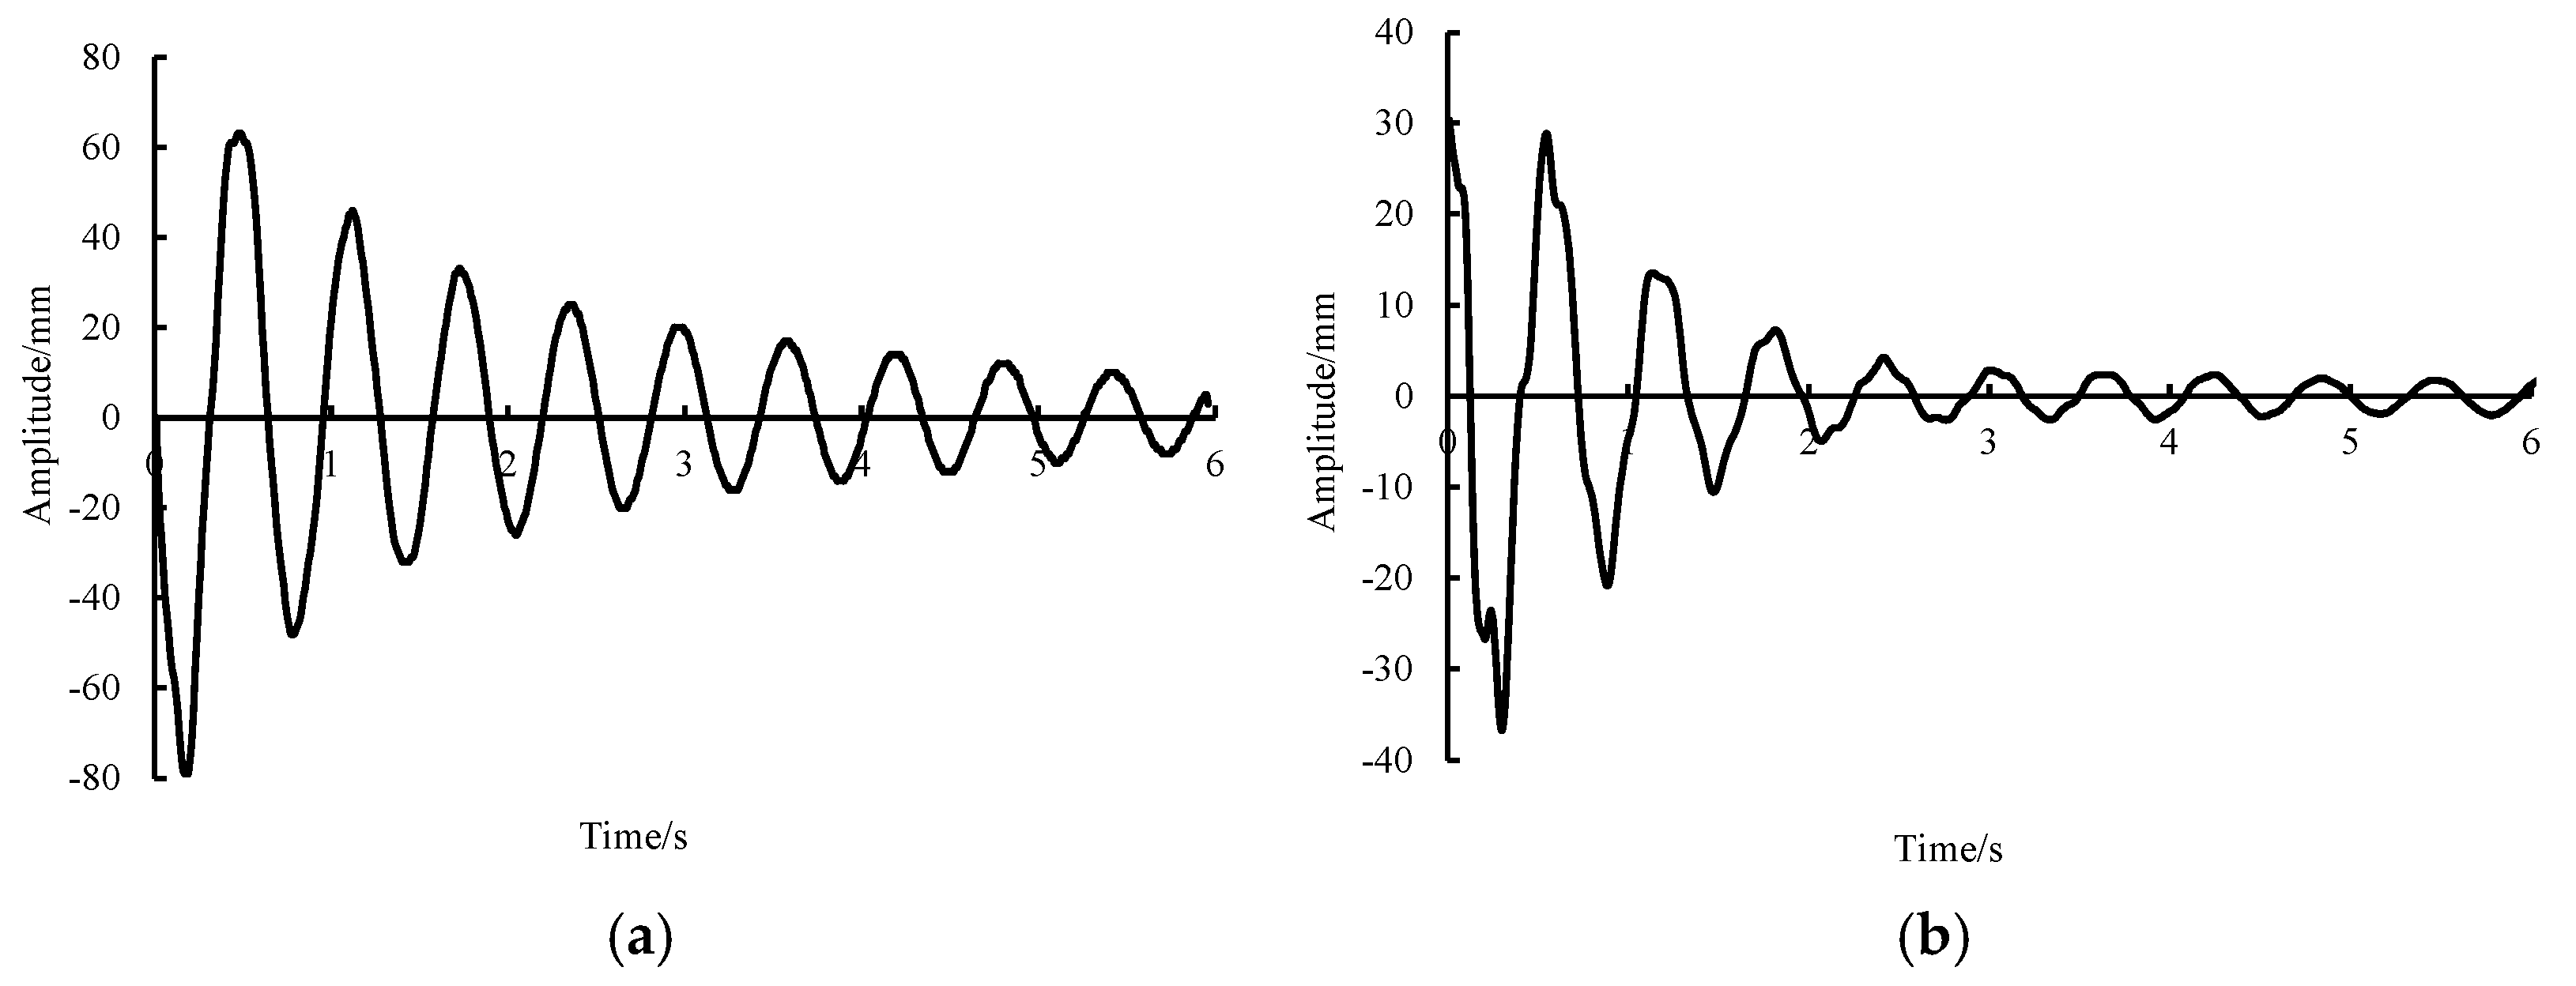
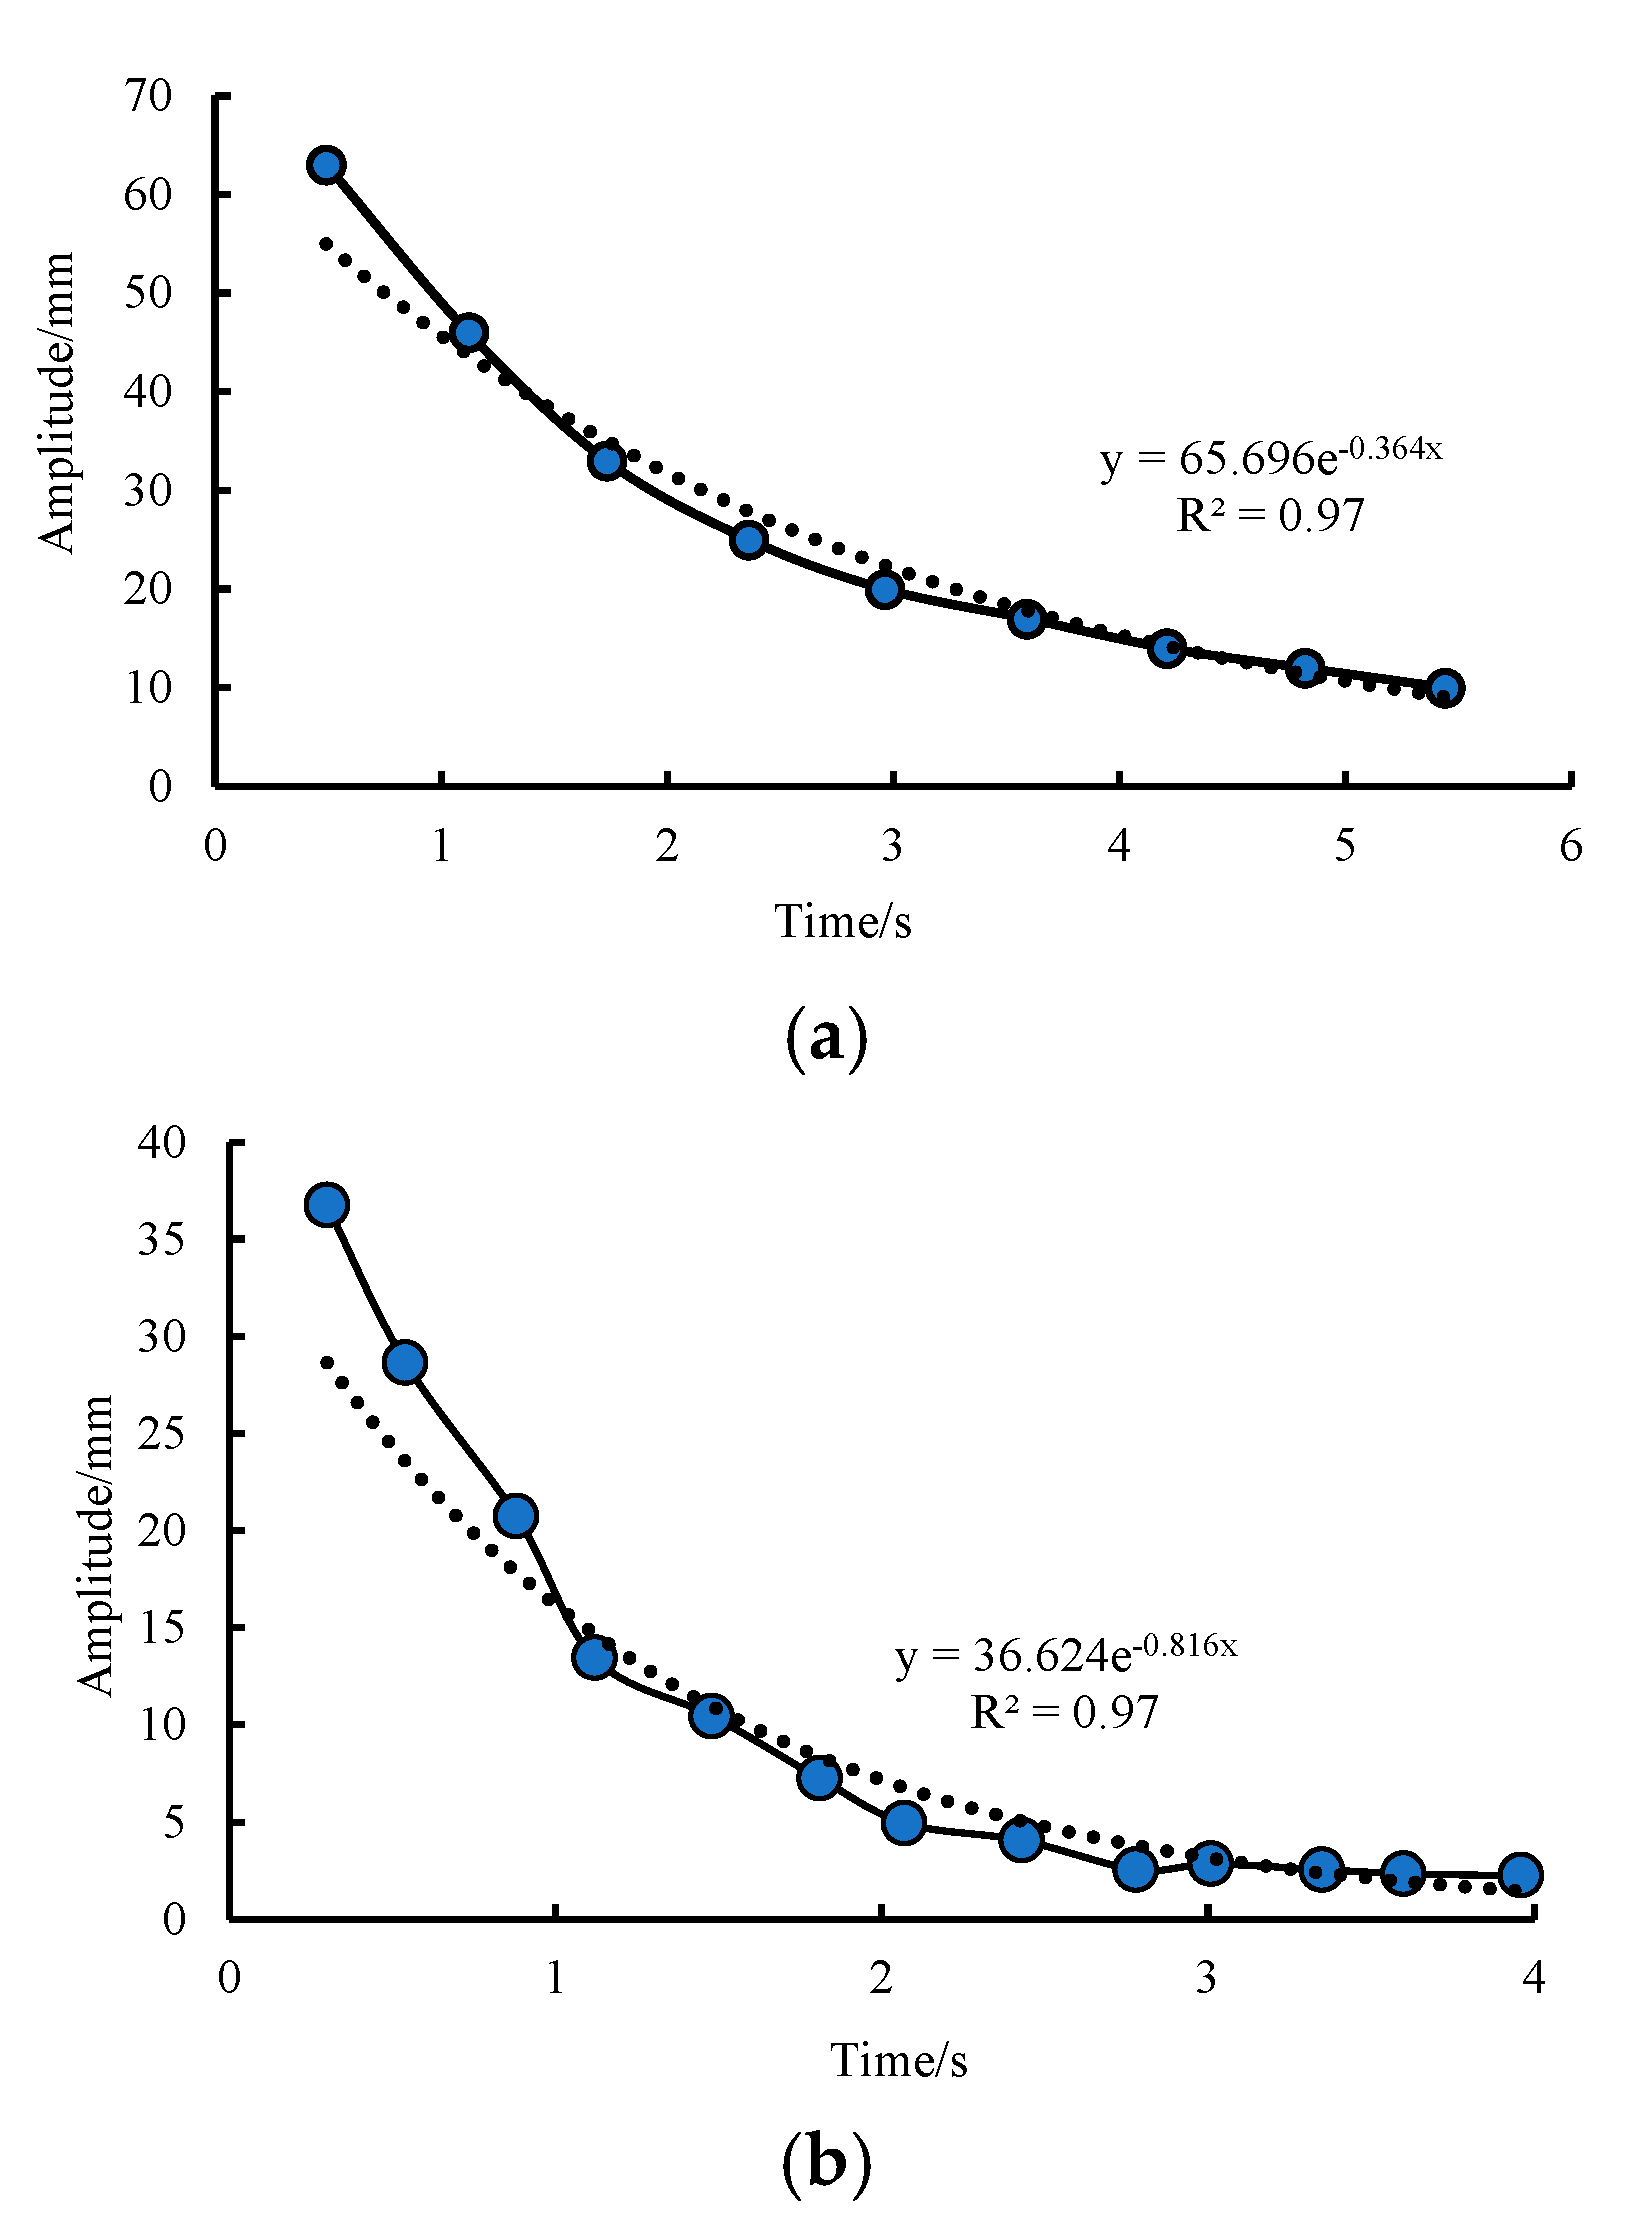
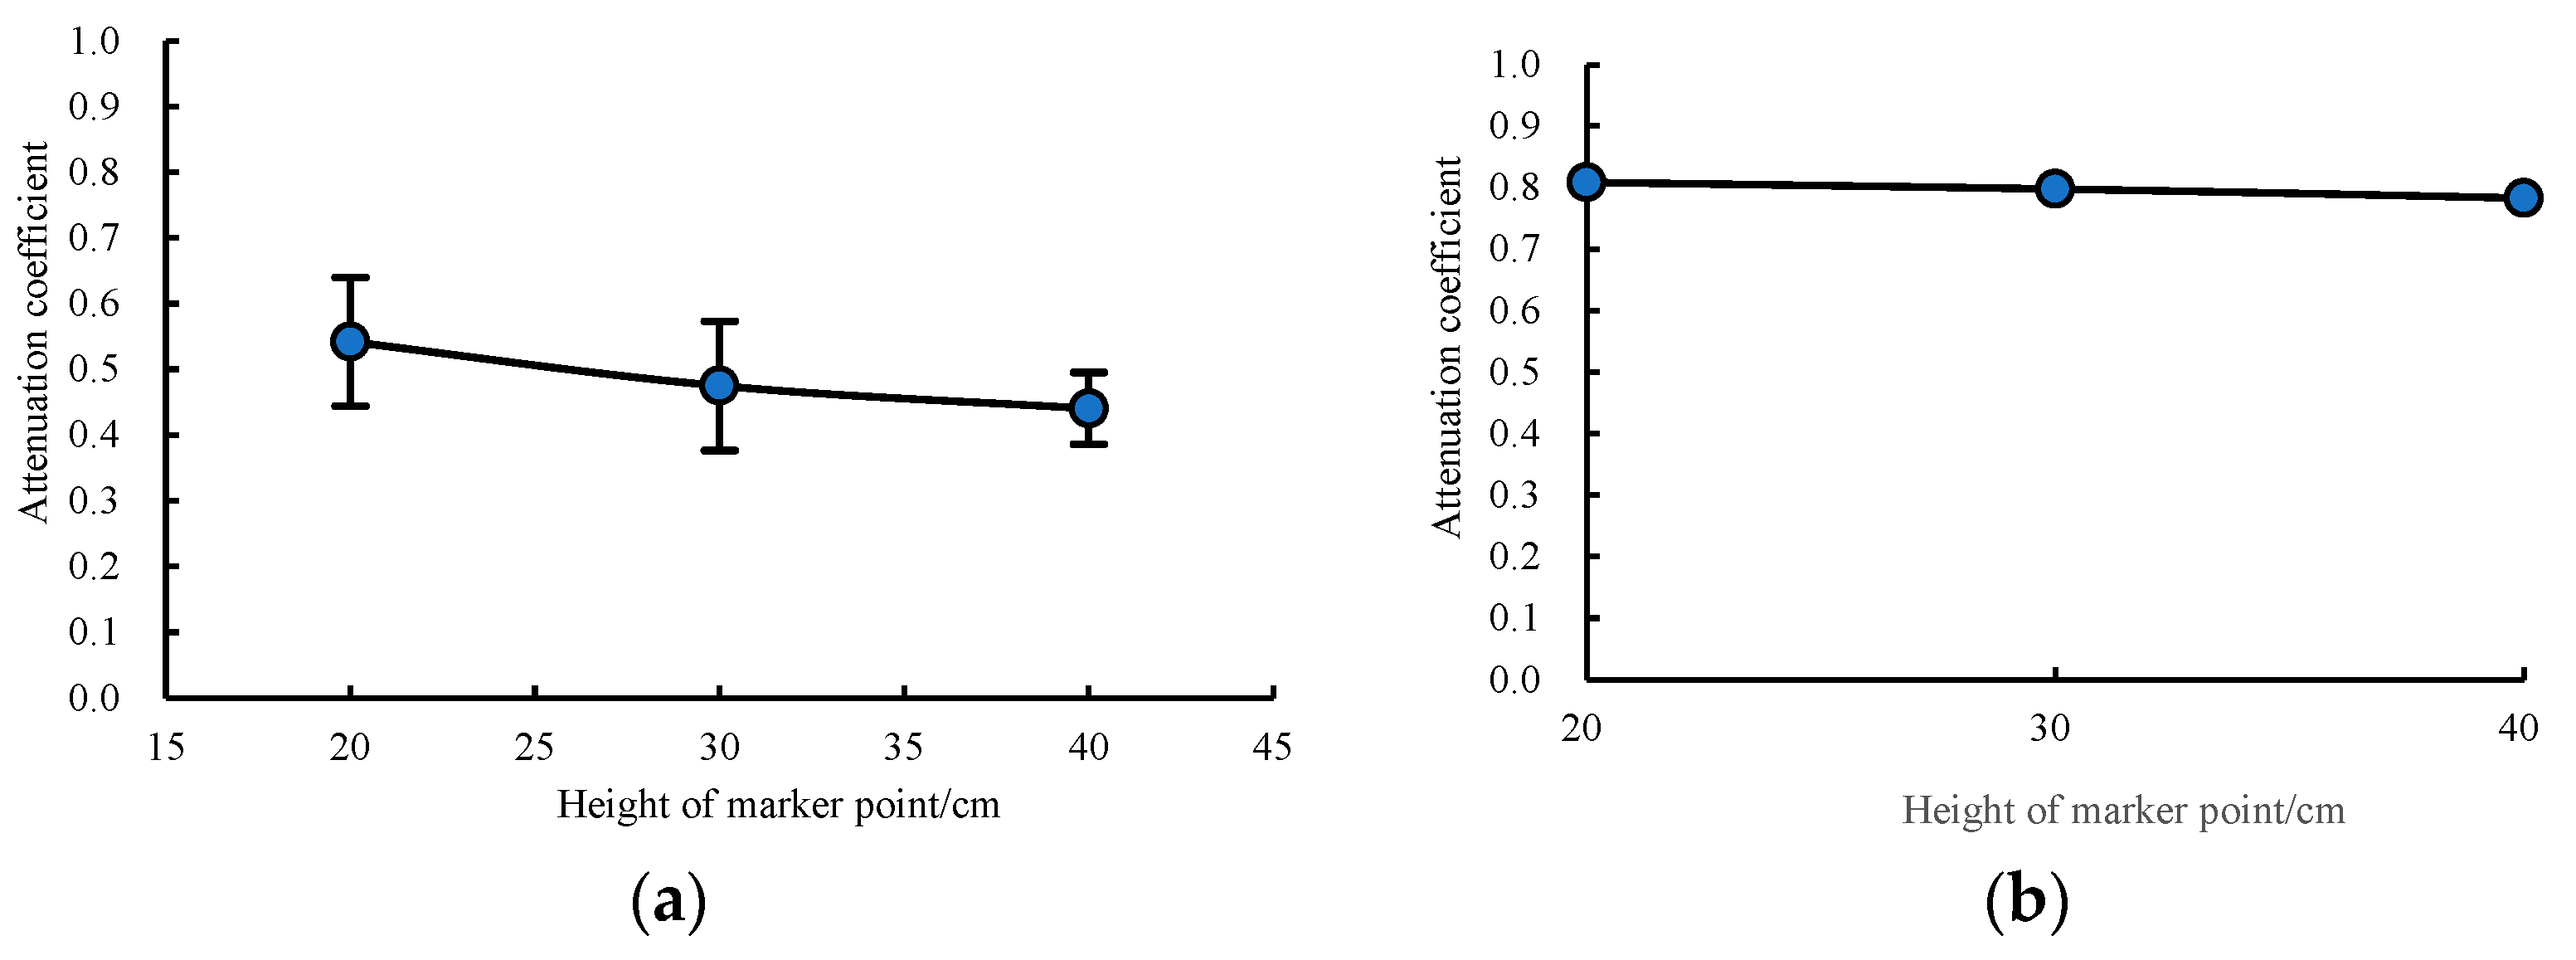
4.3. Effects of Different Parts of the Rape Plant on the Vibration Amplitude Attenuation Coefficient
5. Conclusions
- (1)
- This paper presents a noncontact measurement method of rape plant vibration characteristics based on the combination of high-speed photography and image recognition. Through the analysis of the accuracy and feasibility of the measurement method, it can be seen that the average measurement error of the vibration amplitude of the test method was 0.0068 mm. With an increase in the vibration frequency, the relative error of the method decreased slightly, and the relative measurement error of the amplitude was 0.45% at 20 Hz.
- (2)
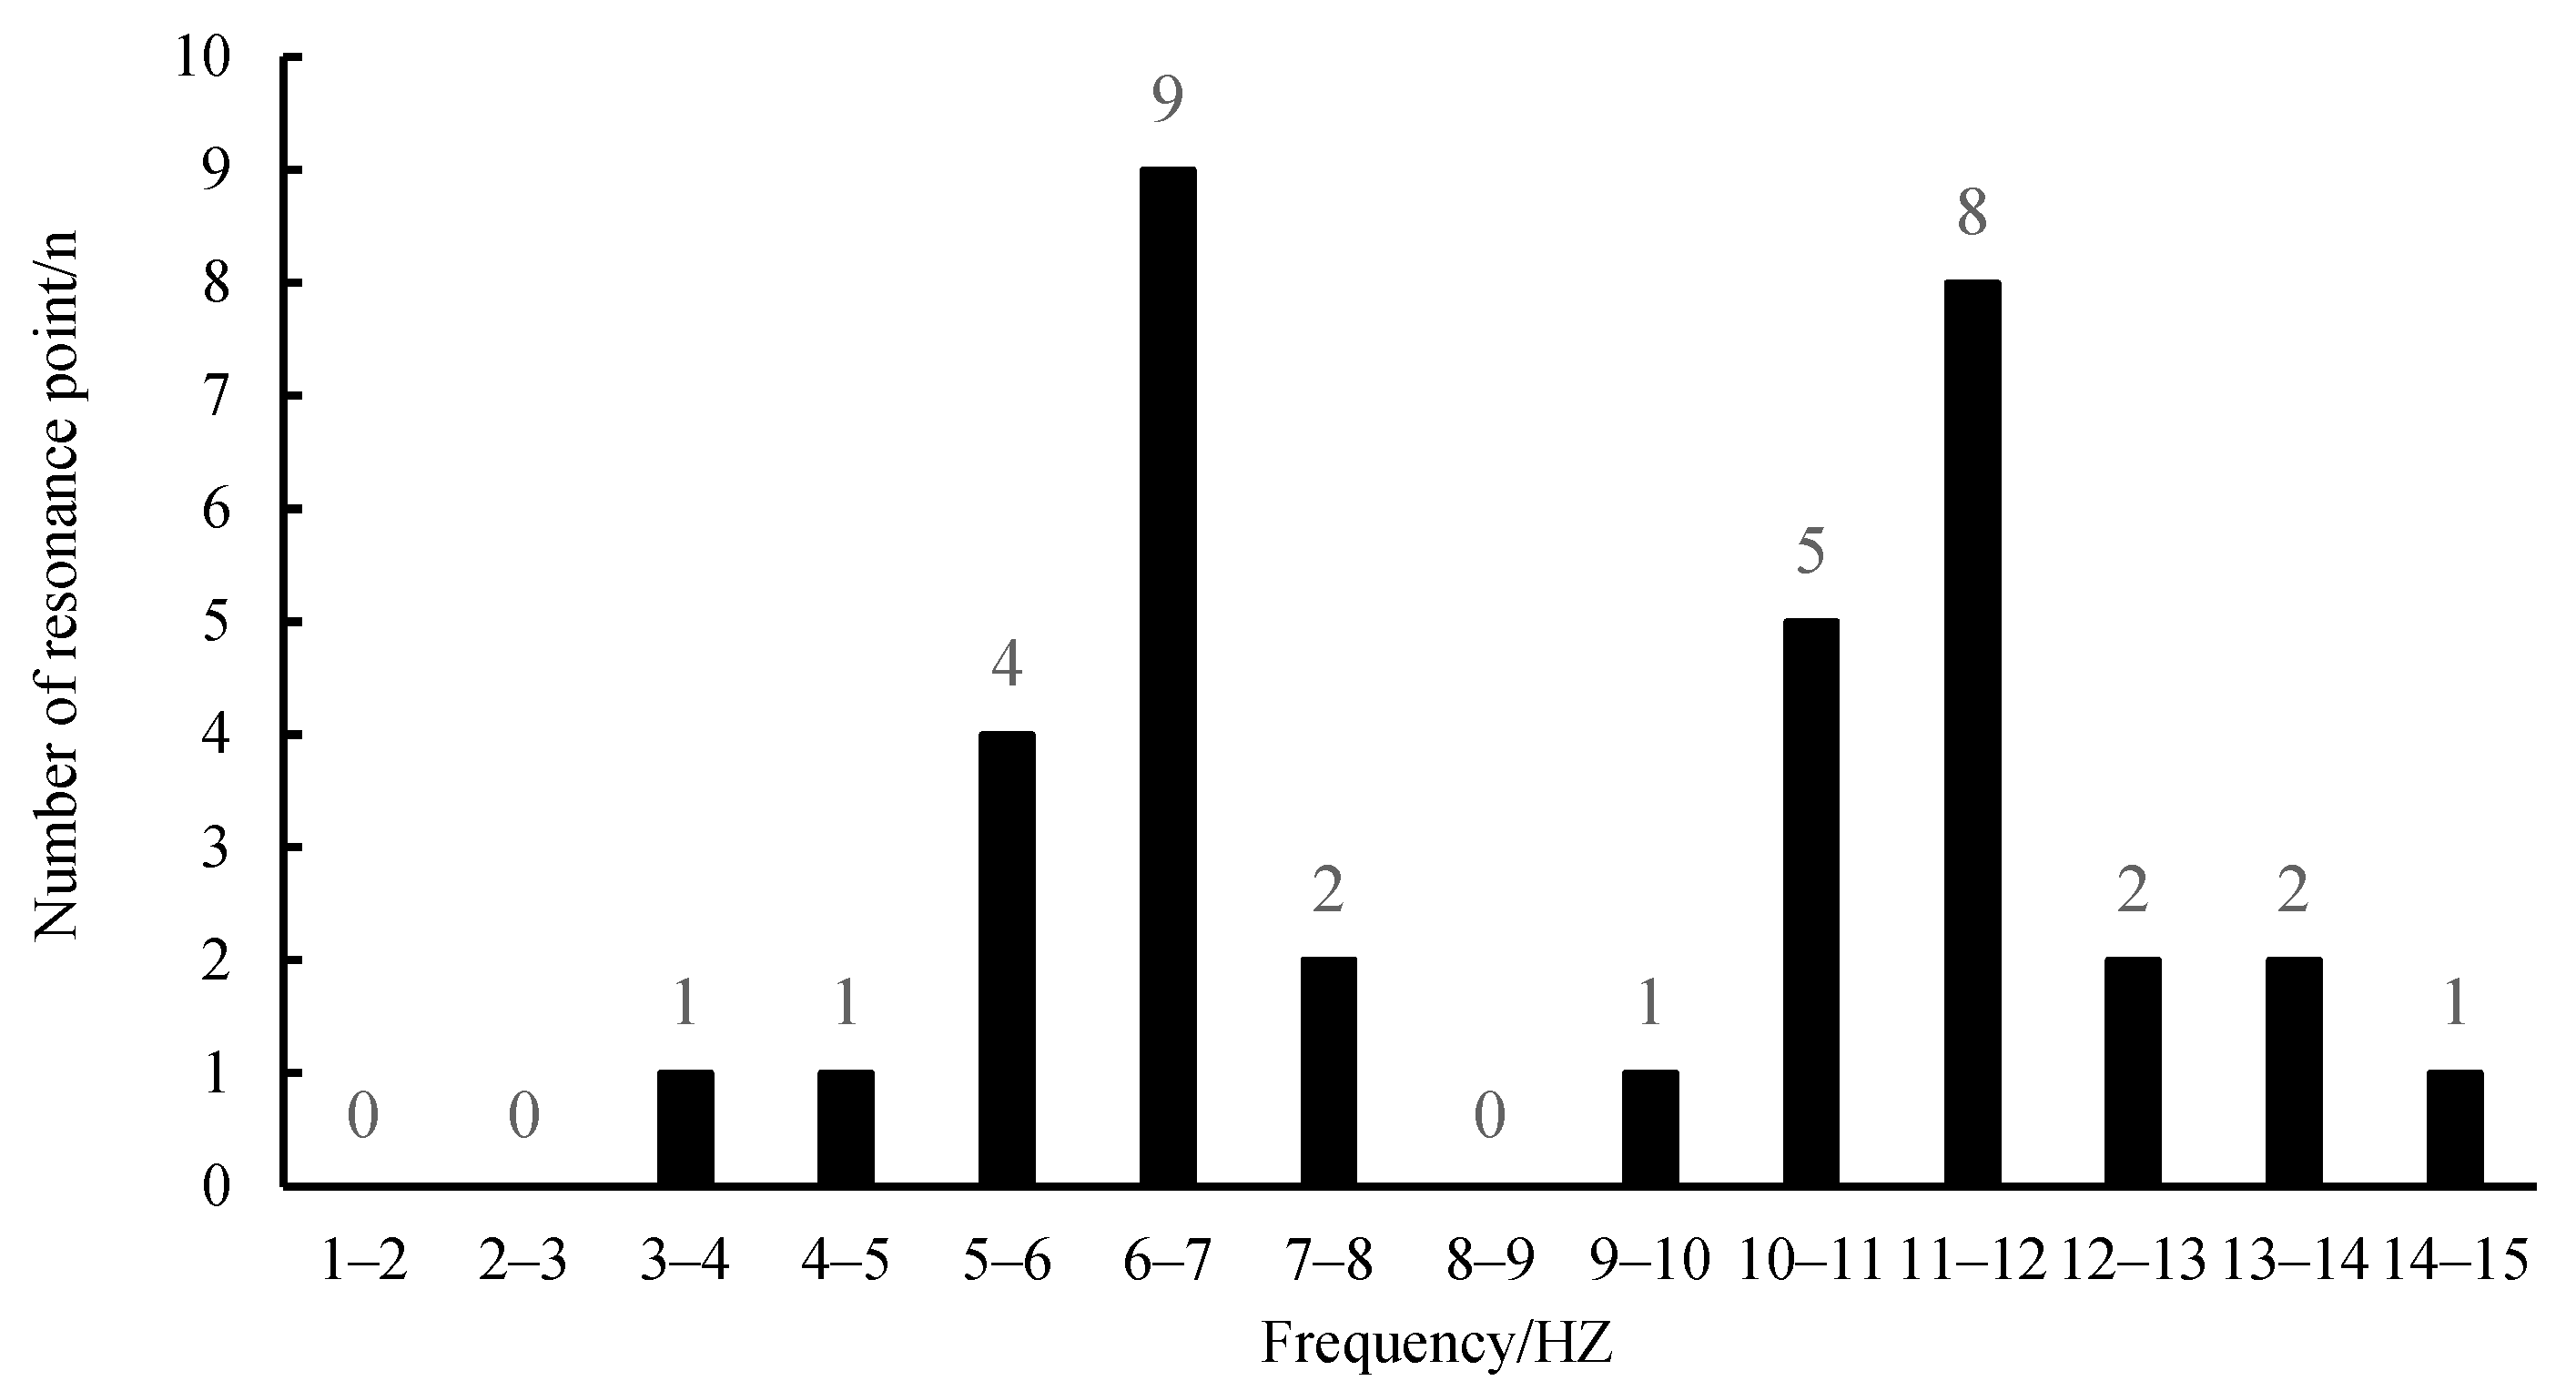
- Through the frequency sweep test, it was found that there were multiple resonance points in the frequency range of 1–15 Hz. The maximum deformation of plant vibration is usually in the first and second order. The resonance of rape plants mainly occurred at 6–7 Hz and 11–12 Hz.
- (3)
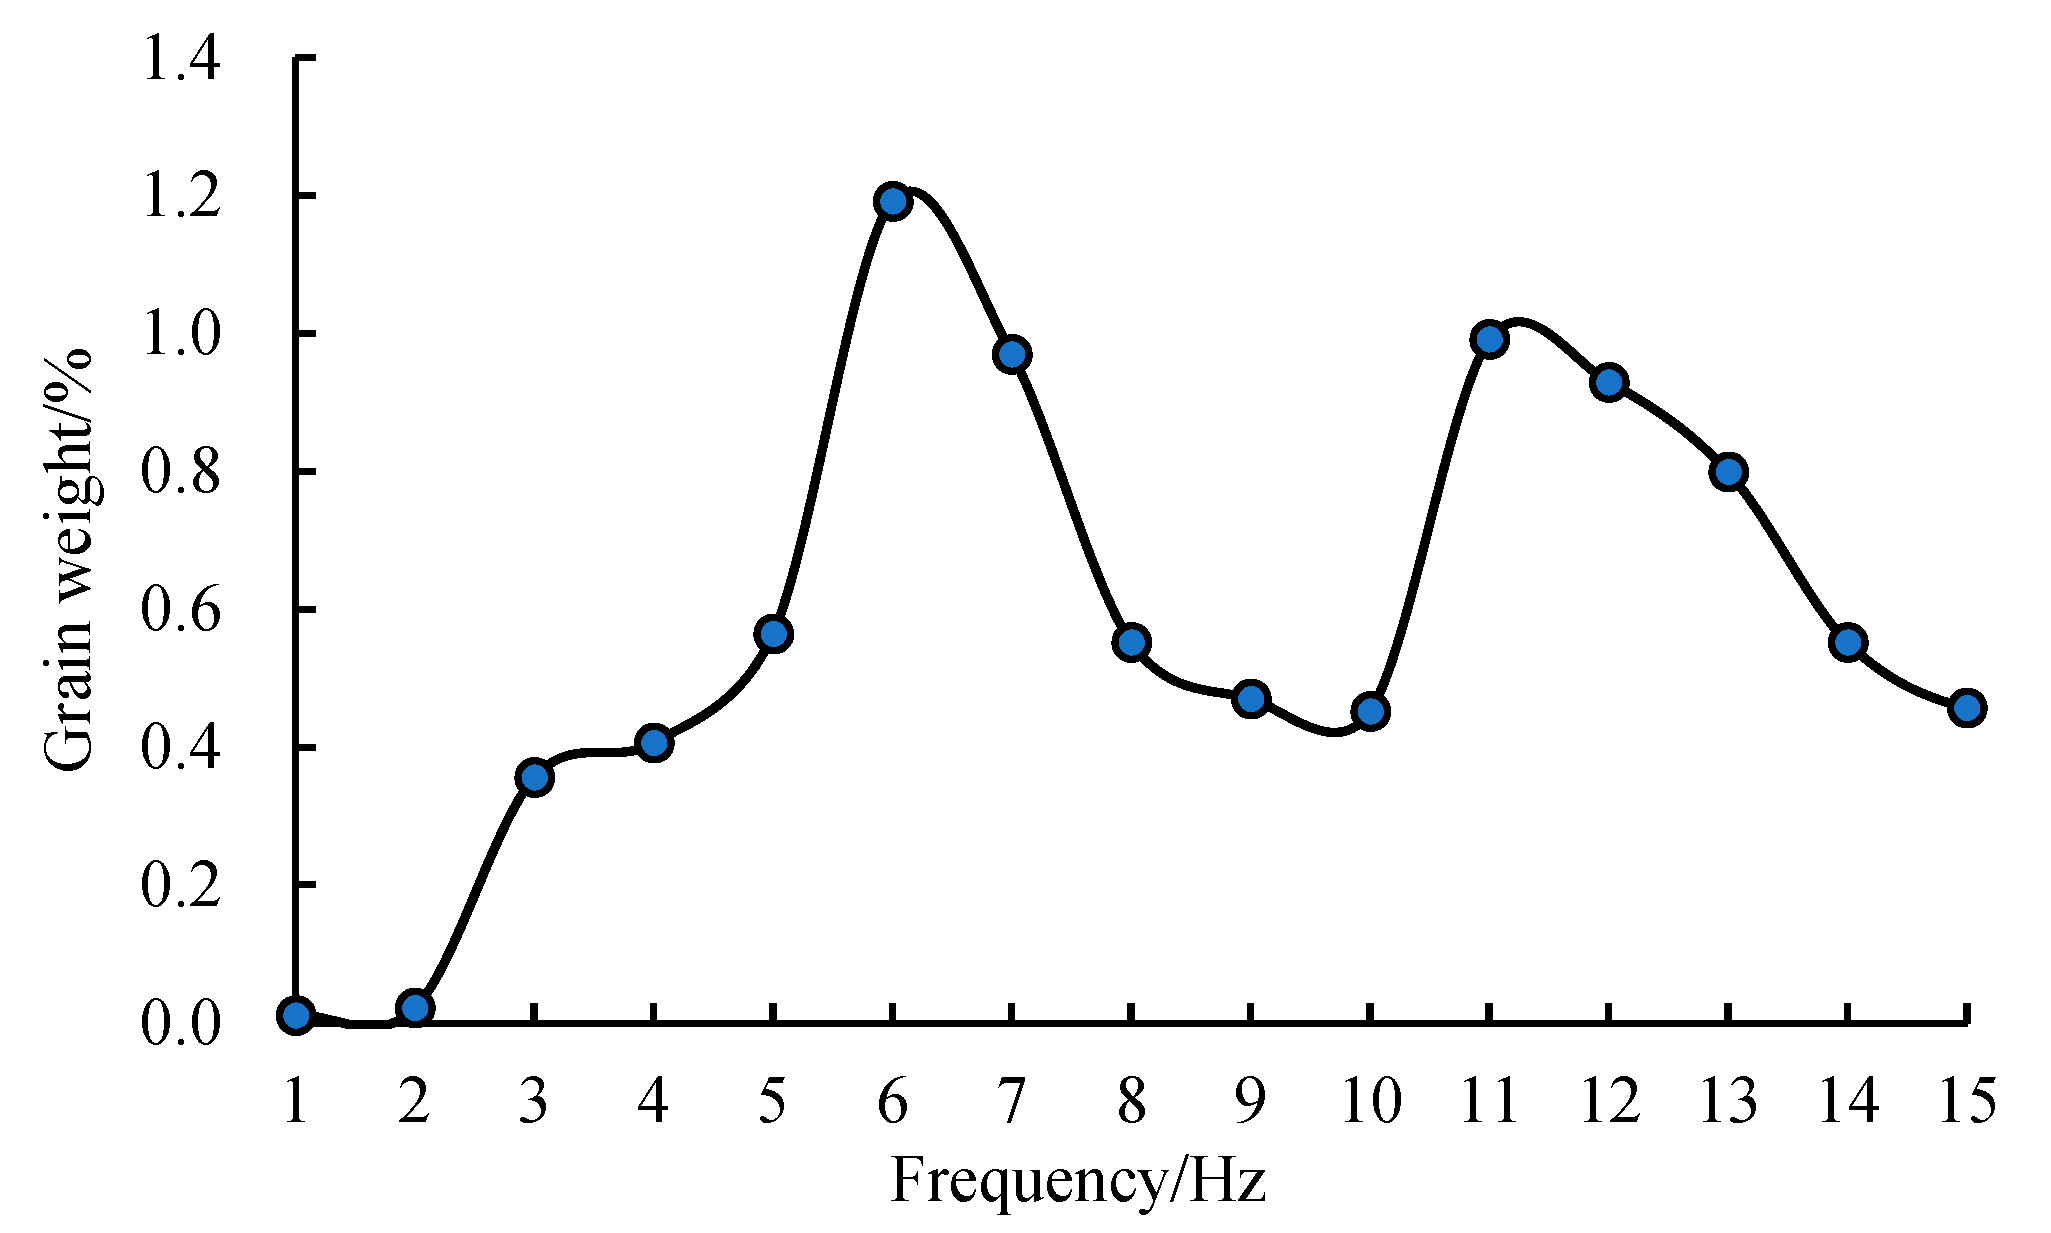
- The standing frequency vibration test of rape plants in the frequency range of 1~15 Hz showed that rape plants had resonance at 6 Hz and 11 Hz, and the vibration and grain falling were 1.192% and 0.992%, respectively, which was greater than those of other frequencies.
- (4)
- The free attenuation vibration test of rape plants showed that the average attenuation coefficients of the marked points on the side branches at 20 cm, 30 cm, and 40 cm away from the main branch and side branch nodes were 0.542, 0.475, and 0.441, respectively. The attenuation coefficient decreased with increasing distance between the marked points and the nodes, and the attenuation coefficients of the marked points on the main branch showed little difference, with an average value of 0.797.
Author Contributions
Funding
Institutional Review Board Statement
Informed Consent Statement
Data Availability Statement
Conflicts of Interest
References
- Hu, Y.; Gu, J.J.; Guo, J. Study on influencing factors and harvest mode of rape mechanized production. J. Agric. Mech. Res. 2020, 42, 179–182. [Google Scholar]
- Cavalieri, A.; Harker, K.N.; Hall, L.M.; Willenborg, C.J.; Haile, T.A.; Shirtliffe, S.J.; Gulden, R.H. Evaluation of the Causes of On-Farm Harvest Losses in Canola in the Northern Great Plains. Crop Sci. 2016, 56, 2005–2015. [Google Scholar] [CrossRef]
- Pahkala, K.; Sankari, H. Seed loss as a result of pod shatter in spring rape and spring turnip rape in Finland. Agr. Food Sci. Finland 2001, 10, 209–216. [Google Scholar] [CrossRef]
- Pari, L.; Assirelli, A.; Suardi, A.; Civitarese, V.; Del Giudice, A.; Costa, C.; Santangelo, E. The harvest of oilseed rape (Brassica napus L.): The effective yield losses at on-farm scale in the Italian area. Biomass Bioenergy 2012, 46, 453–458. [Google Scholar] [CrossRef]
- Qing, Y.R.; Li, Y.M.; Xu, L.Z.; Ma, Z.; Tan, X.L.; Wang, Z. Oilseed rape (Brassica napus L.) pod shatter resistance and its relationship with whole plant and pod characteristics. Ind. Crops Prod. 2021, 166, 113459. [Google Scholar] [CrossRef]
- Li, Y.M.; Zhu, J.Q.; Xu, L.Z.; Zhao, Z. Experiment on strength of rapeseed pod dehiscence based on impending fracturing method. Trans. CSAE 2012, 28, 111–115. [Google Scholar]
- Brace, D.M.; Farrent, J.W.; Morgan, C.L.; Child, R.D. Determining the oilseed rape pod strength needed to reduce seed loss due to pod shatter. Biosyst. Eng. 2002, 81, 179–184. [Google Scholar]
- Qing, Y.R.; Li, Y.M.; Xu, L.Z.; Ma, Z. Screen oilseed rape (Brassica napus) suitable for low-loss mechanized harvesting. Agriculture 2021, 11, 504. [Google Scholar] [CrossRef]
- Ma, L.N.; Wei, J.Y.; Huang, X.M.; Zong, W.Y.; Zhan, G.C. Analysis of harvesting losses of rapeseed caused by vibration of combine harvester header during field operation. Trans. CSAM 2020, 51, 141–145. [Google Scholar]
- Hobson, R.N.; Bruce, D.M. Seed loss when cutting a standing crop of oilseed rape with two types of combine harvester header. Biosyst. Eng. 2002, 81, 281–286. [Google Scholar] [CrossRef]
- Chai, X.Y.; Xu, L.Z.; Yan, C.; Liang, Z.W.; Ma, Z.; Li, Y.M. Design and test of cutting frequency follow-up adjusting device for vertical cutting knife of rapeseed cutting machine. Trans. CASM 2018, 49, 100–106. [Google Scholar]
- Wang, G.; Guan, Z.H.; Mu, S.L.; Tang, Q.; Wu, C.Y. Optimization of operating parameter and structure for seed thresher device for rape combine harvester. Trans. CSAE 2017, 33, 52–57. [Google Scholar]
- Wang, R.; Ripley, V.L.; Rakow, G.R. Pod shatter resistance evaluation in cultivars and breeding lines of Brassica napus, Brassica juncea and Sinapis Alba. Plant Breed. 2007, 126, 588–595. [Google Scholar] [CrossRef]
- Luo, H.F.; Tang, C.Y.; Guan, C.Y.; Wu, M.L.; Xie, F.P.; Zhou, Y. Plant characteristic research on field rape based on mechanized harvesting adaptability. Trans. CSAE 2010, 26, 61–66. [Google Scholar]
- Wu, C.Y.; Ding, W.M.; Shi, L.; Wang, L.Q.; Jin, C.Q. Response surface analysis of pickup losses in two-stage harvesting for rapeseed. Trans. CSAM 2011, 42, 89–93. [Google Scholar]
- Ren, S.G.; Wu, M.L.; Xie, W.; Tang, S.Z. Oilseed rape harvest cutting impact stress wave and its propagation in the stalk. Agro Food Ind. Hi-Tech 2017, 28, 1493–1495. [Google Scholar]
- Li, Y.; Xu, L.Z.; Gao, Z.P.; Lu, E.; Li, Y.M. Effect of vibration on rapeseed header loss and optimization of header farme. Trans. ASABE 2021, 64, 1247–1258. [Google Scholar] [CrossRef]
- Ran, J.H.; Mu, S.L.; Li, H.T.; Guan, Z.H.; Tang, Q.; Wu, C.Y. Design and test of planet gear driver of reciprocating double-acting cutter for rapeseed combine harvester. Trans. CSAE 2020, 36, 17–25. [Google Scholar]
- Ren, S.G.; Jiao, F.; Wu, M.L.; He, S.Z.; Tang, S.Z. Studies of United Harvest Machine Cutting System Structure Parameters on the Vibration Impact. J. Agric. Mech. Res. 2018, 40, 38–43. [Google Scholar]
- Yang, H.M.; San, Y.L.; Chen, Y.F.; Wang, X.N.; Niu, C.H.; Hou, S.L. Influence of different vibration characteristic parameters on vibration response of apricot trees. Trans. CSAE 2019, 35, 10–16. [Google Scholar]
- San, Y.L.; Yang, H.M.; Wang, X.N.; Guo, W.S.; Hou, S.L. Dynamic response analysis of apricot fruit dropping during vibration harvesting. Trans. CSAE 2018, 34, 68–75. [Google Scholar]
- Wang, Y.L.; Chen, Y.; Han, B.; Chen, J. Research on laws of wolfberry dropping based on high-speed camera. Trans. CSAE 2018, 40, 166–170. [Google Scholar]
- Zhao, J.; Tsuchikawa, S.; Ma, T.; Hu, G.R.; Chen, Y.; Wang, Z.W.; Chen, Q.Y.; Gao, Z.N.; Chen, J. Modal analysis and experiment of a lycium barbarum L. Shrub for efficient vibration harvesting of fruit. Agriculture 2021, 11, 519. [Google Scholar] [CrossRef]
- Wang, Q.R.; Mao, H.P.; Li, Q.L. Simulation of vibration response of flexible crop stem based on discrete element method. Trans. CSAM 2020, 51, 138–144. [Google Scholar]
- Fan, L.G.; Wang, C.Y.; Liu, M.X.; Luo, J.Q. Experimental study on the impact of vibration parameters on fruit trees. J. Agric. Mech. Res. 2016, 38, 171–174. [Google Scholar]
- Liu, Z.L.; Wang, C.Y.; Wei, T.P.; Lv, M.L. The research of fruit trees dynamic characteristics with impact vibration. Acta Agric. Univ. Jiangxiensis 2016, 4, 495–499. [Google Scholar]
- Ding, H.X.; Li, M.T.; Xue, Z.M. The test device design and vibration of main low order resonance frequency of picking mulberry. J. Agric. Mech. Res. 2017, 39, 159–164. [Google Scholar]
- Chen, J.X.; Yue, D.P.; Feng, Z.K.; Ding, J.W.; Yao, B.Q.; Ye, T.X. Automatic recognition and measurement technology of tree trunk diameter. Trans. CASM 2016, 47, 349–353. [Google Scholar]
- Ren, S.G.; Wu, M.L.; Xie, F.P.; Guan, C.Y. Study on viscoelastic properties of rapeseed stem and the constitutive relationship. J. Anhui Agric. Sci. 2014, 42, 12749–12751. [Google Scholar]
- Zhang, J.Y. Comparative study of half-power bandwidth method and time-domain attenuation method for damping ratio solution. Agri. Equip. Veh. Eng. 2020, 58, 113–115. [Google Scholar]


| Equipment | Parameter | Parameter value |
|---|---|---|
| PCO.dimax HD | Resolving power | 2 megapixels (1920 × 1440) |
| Shooting speed | 1~2128 frames/s (adjustable) | |
| Shutter speed | 1.5 μs~1 s (adjustable) | |
| Spectral response range | 290~1100 nm | |
| Hydraulic vibration shaker | Frequency range | 0.1~160 Hz |
| Direction of vibration | vertical | |
| Maximum vertical acceleration | 40 m/s2 | |
| Maximum sinusoidal force | 30 KN | |
| Displacement range | ±100 mm |
| Signal | 20 Hz | 60 Hz | ||
|---|---|---|---|---|
| Numerical Value | Theoretical Value | Measured Value | Theoretical Value | Measured Value |
| Period/T (s) | 0.05 | 0.0500 | 0.0167 | 0.0167 |
| Frequency (Hz) | 20 | 20.0000 | 60 | 59.8802 |
| Velocity (m/s) | 0.1592 | 0.1600 | 0.0531 | 0.0559 |
| Acceleration (m/s2) | 20 | 20.0960 | 20 | 21.1122 |
| Amplitude (mm) | 1.2678 | 1.2735 | 0.1409 | 0.1487 |
| Amplitude error (mm) | 0.0057 | 0.0078 | ||
| Amplitude relative error (%) | 0.45 | 5.54 | ||
Publisher’s Note: MDPI stays neutral with regard to jurisdictional claims in published maps and institutional affiliations. |
© 2022 by the authors. Licensee MDPI, Basel, Switzerland. This article is an open access article distributed under the terms and conditions of the Creative Commons Attribution (CC BY) license (https://creativecommons.org/licenses/by/4.0/).
Share and Cite
Zhan, G.; Ma, L.; Zong, W.; Liu, W.; Deng, D.; Lian, G. Study on the Vibration Characteristics of Rape Plants Based on High-Speed Photography and Image Recognition. Agriculture 2022, 12, 727. https://doi.org/10.3390/agriculture12050727
Zhan G, Ma L, Zong W, Liu W, Deng D, Lian G. Study on the Vibration Characteristics of Rape Plants Based on High-Speed Photography and Image Recognition. Agriculture. 2022; 12(5):727. https://doi.org/10.3390/agriculture12050727
Chicago/Turabian StyleZhan, Guangchao, Lina Ma, Wangyuan Zong, Wei Liu, Dinglin Deng, and Guodang Lian. 2022. "Study on the Vibration Characteristics of Rape Plants Based on High-Speed Photography and Image Recognition" Agriculture 12, no. 5: 727. https://doi.org/10.3390/agriculture12050727