Article

Synchronization Optimization of Pipe Diameter and Operation Frequency in a Pressurized Irrigation Network Based on the Genetic Algorithm

Research Centre of Fluid Machinery Engineering and Technology, Jiangsu University, Zhenjiang 212013, China
*
Author to whom correspondence should be addressed.
Agriculture 2022, 12(5), 673; https://doi.org/10.3390/agriculture12050673
Submission received: 29 March 2022 / Revised: 5 May 2022 / Accepted: 6 May 2022 / Published: 9 May 2022
(This article belongs to the Special Issue Advances in Agricultural Engineering Technologies and Application)

Abstract

:
The pressurized irrigation network aims to deliver water to consumption nodes at an appropriate pressure and discharge. The traditional pipe network optimization minimizes the annual operating cost or investment per unit area. The present work establishes the traditional pipe diameter and operating frequency optimization models based on flattish terrain. It proposes a new synchronization optimization method of pipe diameter and operation frequency to find the best match point for pipe diameter and operating frequency in the branched network system. The irrigation costs of the above three models, including the energy and pipe network costs, are compared with the original irrigation network system. Based on the results of optimizing the typical experimental field, the operation frequency optimization model and the pipe diameter optimization model can save about 1.4% and 10.6% in irrigation cost, respectively. Furthermore, the synchronous optimization model can significantly reduce the irrigation cost to about 19.3%, including a 26.6% reduction in the pipe network cost and a 21.9% increase in the energy cost. Compared with pipe diameter optimization, synchronous optimization can further reduce network costs while generating lower energy costs. The results of this research can be used for the design of the network system in flattish terrain to reduce the irrigation cost.

1. Introduction

Pipeline irrigation is an important trend in the development of water-saving irrigation, while pipe network optimization is a multi-discipline issue involving global optimization, hydraulics, and intelligent algorithms [1,2,3,4]. The pressurized irrigation network (PIN), an essential system in the agricultural irrigation project, aims to deliver water to consumption nodes at an appropriate pressure and discharge [3]. The pipe network optimization minimizes the annual operating cost or investment per unit area and maximizes the system’s reliability under pressure and discharge constraints [1]. With the formulation of PIN design as an optimization problem, various studies have been performed on pipe network optimization [2,5,6,7,8].
The rapidly growing world energy use has already raised concerns over supply difficulties, exhaustion of energy resources and heavy environmental impact [9]. Predictions show that energy use by nations with emerging economies will grow at an average annual rate of 3.2% and will exceed by 2020 that for the developed countries at an average growing rate of 1.1%. Energy consumption plays an important role in pipeline irrigation [10,11]. For example, energy consumption is involved in the process of water extraction, transportation, irrigation and drainage [12]. Various measures can be adopted to reduce energy consumption during the operation of pressurized irrigation systems. The irrigation network design should take into account the energy criterion for determining the optimum pipe diameter. Conversely, more efficient management and operation of irrigation systems can be achieved using protocols and tools developed for assessing the performance using management indicators [13].
The optimization of pipe diameter combination significantly influences the investment of the whole system, leading to remarkable economic benefits [14]. Giménez et al. [15] proposed a two-level dynamic programming method to optimize networks represented by multistage graphs. Zhao et al. [16] constructed the mathematical optimization model of the pipe diameter optimization for the overall synchronized optimization of the pipeline layout and pipe diameter and achieved a total cost 27.5% lower than the empirical method. Ma et al. [14] proposed the optimization method of the mechanical pressure micro-irrigation pipe network system and established the mathematical model of the optimization design. Accordingly, the annual cost of the optimal design scheme of the irrigation pipe network has been reduced by 14%. According to various research results, optimizing the diameter of the irrigation pipe network can provide significant economic benefits [17,18,19,20]. Diameter optimization can realize the use of smaller diameter pipes to complete the system construction and to reduce the construction cost of the irrigation system.
The variable speed drive (VSD) offers many advantages in the operation of centrifugal pumps [21]. It can reduce or increase the pump head by adjusting the pump speed [22]. Lamaddalena et al. [23] and AitKadi et al. [24] indicated that about 20% and 25% of the energy for pumping could be saved by variable-speed pumps in two Italian irrigation districts and an irrigation district in Morocco, respectively. Díaz et al. [25] analyzed an irrigation district in southern Spain equipped with variable-speed pumps and simulated four alternative management scenarios for several water demand levels. In summary, by adopting the operation frequency optimization technology, adjusting the speed of the water pump, and matching the appropriate pump operating points for different irrigation groups, the energy consumption of the pumping station can be reduced, and the sustainable development of the irrigation system can be achieved [26,27].
The above research indicates that pipe diameter optimization and operating frequency optimization can significantly reduce network and energy costs, respectively. The optimization target of this paper is the irrigation cost as the sum of the annual network and energy costs. A synchronization optimization model of pipe diameter and the operation frequency is established and solved using the genetic algorithms (GA) [28,29,30,31], providing a design reference for the PIN system.

2. Materials and Methods

2.1. Problem Description and Generalization

The PIN system consists of four parts: the water source, water intake works, irrigation networks, and field irrigators. The irrigation networks are arranged according to the terrain, water source, and water consumption. Due to their low cost and convenient maintenance, branched networks have been widely utilized in agriculture [16]; this paper conducts research on the networks. Figure 1 shows the schematic diagram of the branched networks.
Irrigation costs include the investment cost (this paper only considers the cost of the pipe network, excluding equipment such as pumping stations) and the energy consumption cost [2]. There is a non-strict inverse relationship between these two costs and the pipe diameter. The network cost is positively related to the pipe diameter, and the energy consumption cost is negatively related to the pipe diameter [26].
The pipeline network investment generally accounts for 70% of the total investment in the irrigation system and determines the investment in the entire system. Plastic pipes such as PVC or PE are usually employed for the PIN. With the increase in the pipe diameter, the unit price of pipes usually increases exponentially [16]. Therefore, a reasonable reduction of the pipe diameter can significantly reduce the investment cost of irrigation projects.
Furthermore, the energy consumption cost is mainly generated by the motor that drives the pump, determined by the pump’s operating point. The pump’s operating point will change during the entire irrigation process according to different pipeline resistances of different rotation irrigation sectoring [32,33]. When the pipeline resistance difference between the rotation irrigation sectoring is relatively significant, the operating point deviation of different rotation irrigation sectoring will be more obvious. This often avoids the water pump running at the optimal operating point, thus reducing the pump efficiency and increasing unnecessary irrigation energy consumption. In order to adjust the working point of the pump, the pump revolution speed can change the pump’s performance curve based on VSD technology [26]. This technology can theoretically match the operating point for each rotation irrigation sectoring to realize the low energy consumption operation of all rotation irrigation sectoring.

2.2. Mathematical Models

The PIN design is a highly complex problem. Most of the optimization methods are based on the pipe diameter optimization of the fixed speed pump [21]. Compared with the traditional optimization of branch pipe diameter and operation frequency optimization, this paper establishes a pipe diameter optimization model (PDM), an operation frequency optimization model (OFM), and a synchronization optimization model of pipe diameter and variable frequency (SOM) without changing the rotation irrigation sectoring, irrigation amount, and pipe network layout.
The synchronization optimization of pipe diameter and operation frequency process can be structured in four stages. First, mathematical models of PDM, OFM, and SOM are established. In the second stage, various irrigation constraints are established according to the engineering application requirements. In the third stage, the annual energy and network costs are evaluated. Finally, the total costs of PDM and OFM are compared with those of SOM.
Large-scale farmlands generally employ the rotation irrigation system [16]. The main pipe adopts continuous irrigation. Valves control the branch pipe for rotation irrigation; that is, the main pipe supplies water to the branch pipes according to the sequence of rotation irrigation groups. Furthermore, considering engineering applications, the pump station generally supplies water only to two branch pipes at the same node. In the proposed model, the number of main pipes is 1, the number of main pipe segments is NM, the number of branch pipes is N, and the number of branch pipe segments is NB. The number of hydrants and branch pipe segments is the same. The numbering methods of branch pipes and main pipe segments are shown in Figure 2. The division method of rotation irrigation sectoring and the number of passes through the central pipe segment are shown in Table 1. The branch pipes are numbered in sequence from the pump along the water flow direction.
In engineering applications, the branch pipe diameter will gradually decrease along the flow direction to reduce investment. Furthermore, due to the different irrigation areas of each hydrant, the discharge of each outlet is also different during the irrigation process [34]. Therefore, to obtain a reliable hydraulic model close to reality, the pipeline resistance calculation should be performed for each pipe segment during the hydraulic calculation. For the convenience of mathematical calculation, the branch pipe segments and hydrant should be numbered. Figure 3 shows the branch pipe segments and hydrant numbers. The branch pipe segments are numbered sequentially from the furthest hydrant in the opposite direction of the water flow.

2.2.1. Mathematical Model of Irrigation Cost

The PIN optimization mainly involves pipeline layout, pipe diameter selection, and pump revolution speed [16,21]. This paper optimizes pipe diameter and operating frequency (pump revolution), considering a constant pipeline layout. The pipe diameter optimization aims to determine the branch pipe diameter, considering only one standard diameter for each branch pipe segment. Operating frequency optimization mainly matches the most economical pump speed for the network characteristic curve of each irrigation sectoring.
PDM, OFM, and SOM are established in this paper. SOM can be simplified to PDM without frequency optimization, and OFM can be obtained without pipe diameter optimization. For the convenience of mathematical description, an irrigation system optimization model is established to optimize pipe diameter and operation frequency with the minimum annual cost of the rotary irrigation network as the objective function. The minimum irrigation annual cost (including the annual network and energy costs) of the irrigation system is considered the objective function, which is defined as follows:
min   F = [ r ( 1 + r ) y ( 1 + r ) y 1 + B ] i = 1 N j = 1 N B i C i j L i j + μ i = 1 N / 2 E T i H i ( j = 1 N B 2 i 1 q 2 i 1 , j + j = 1 N B 2 i q 2 i , j ) 367.2 η i η p
here, F is annual irrigation cost, Yuan/year; r is annual interest rate, %; y is depreciation period; B is average annual maintenance rate, %; Cij is the price of branch pipe i segment j, yaun/m; Lij is the length of branch pipe i segment j, yaun/m; μ energy consumption correction coefficient based on experimental; E is the local electricity price, yaun/kW·h; Ti is irrigation period of rotation irrigation sectoring i, h; Hi is pump outlet pressure of rotation irrigation sectoring i, m; NBi is the number of pipe segments of branch pipe i; qi,j is the hydrant discharge of branch pipe i segment j, m3/h; ηi is pump efficiency of the rotation irrigation sectoring i, %; ηp is water utilization coefficient of pipeline system, %.

2.2.2. Constraint Conditions of the Model

  • Irrigation period constraints
The irrigation period is determined according to the local irrigation test data and national standards [35]. The rotation irrigation period should not be greater than the designed irrigation period. Therefore, the following constraints are considered for the rotation irrigation period:
i = 1 N / 2 T i T s
here, Ti is the irrigation period of the rotation irrigation sectoring i, h; Ts is the longest irrigation period allowed by the project, h.
  • Pipe diameter constraints
Along the direction of water discharge, the diameter of the pipe should gradually decrease [16,36]. The pipe diameter constraint established are shown below:
d i , j d i , j + 1
here, di,j is the diameter of branch pipe i segment j, mm.
  • Velocity constraints
When the network has fertilization or application tasks, the velocity in the pipe is 0.6–2.0 m s−1 [36]. The flow depends on the velocity in a pipe and on the pipe diameter. The velocity constraints are given by:
q i , j = j = 1 j 9 π ( 1.4 Rand + 0.6 ) d i , j 2 1 × 10 4
  • Hydrant outlet pressure constraints
Since the most basic design principle of the irrigation network is that all hydrants have a steady discharge, there should be no pressure deficit in the most remote hydrants [37]. Taking the hydrant working pressure at the end of all branch pipes in the rotation irrigation sectoring to meet the pressure conditions as constraints, the following constraints are established:
h y e i hy M
here, hyei is the working pressure of the hydrant at the end of the branch pipe i, m; hyM is the minimum working pressure of hydrant, m.
  • Pump outlet pressure constraints
Each rotation irrigation sectoring in this study contains two branch pipes. Each irrigation sectoring passes through various main pipe segments, resulting in different irrigation sectoring with different main pipe dampers. Similarly, each rotation irrigation sectoring has different branch pipe dampers. In order to meet the hydrant pressure of the branch pipe with greater damping, the pressure calculation should be performed with a branch pipe with high dampers. Thus, a general mathematical model should be established to obtain the network inlet pressure of different irrigation sectoring. The network inlet pressure consists of main dampers, branch dampers, and minimum hydrant working pressure. Thus, the network inlet pressure model of different rotation irrigation sectoring can be established according to the working pressure demand of the hydrant at the end of the branch pipe.
h i = α max ( j = 1 N B 2 i f i = 1 j q 2 i , i m d 2 i , j b l 2 i , j , j = 1 N B 2 i 1 f i = 1 j q 2 i 1 , i m d 2 i 1 , j b l 2 i 1 , j ) + k = 1 2 i 1 4 + 1 f ( i = 1 N B 2 i q 2 n , i + i = 1 N B 2 i 1 q 2 i 1 , i ) m D k b L k + hy M
here, hi is network inlet pressure of rotation irrigation sectoring i, m; α is drag coefficient considering local hydraulic losses; f, m, b are friction coefficient, discharge coefficient, pipe diameter coefficient, respectively; di,j is the diameter of the branch pipe i segment j, mm (OFM is consistent with the parameters of the original pipe network); li,j is the length of the branch pipe i segment j, m; Dk is the diameter of the main pipe segment k, mm; Lk is the length of the main pipe k, m.
Each performance parameter of a pump is not isolated and static but interrelated and mutually restrictive. This connection and restriction have certain regularity. A polynomial curve usually represents the law of change between them [26]. A pump outlet pressure model is established based on the inlet discharge of the pipe network:
H b i = i = 1 4 ( B i , f ( j = 1 N B 2 i q 2 i , j + j = 1 N B 2 i 1 q 2 i 1 , j ) i 1 )
here, Hbi is pump outlet pressure of rotation irrigation sectoring i, m; Bi,f is the polynomial regression coefficient of frequency f in the rotation irrigation sectoring i (The f of PDM remains unchanged and runs in 50 Hz power frequency).
This research model employs the farthest hydrant to calculate the network inlet pressure. Since the pump outlet pressure may be less than the demand of the network inlet pressure, the pump outlet pressure constraint is established as:
h i H b i
  • Pump efficiency constraints
Similar to the pump outlet pressure constraint, a polynomial regression model of pump efficiency is established according to the inlet discharge of the pipe network.
P b i = i = 1 4 ( C i , f ( j = 1 N B 2 i q 2 i , j + j = 1 N B 2 i 1 q 2 i 1 , j ) i 1 )
here, Pbi is pump operating efficiency of rotation irrigation sectoring i, %; Ci,f is the polynomial regression coefficient of frequency f in the rotation irrigation sectoring i.

2.3. Method of the Model Solving

2.3.1. Fitness Function Design of GA

GA is a computational model of the biological evolution process that simulates Darwin’s theory of biological evolution [38,39]. GA can iterate independently, allowing the individuals to perform a natural selection of survival of the fittest, retaining better individuals, and excluding inferior individuals. Since the GA is based on selecting the best individual, this paper employs the character to find the minimum irrigation cost.
The penalty function method is the most common and typical constraint processing method [40]. Numerous constraints must be managed when solving models. Usually, the penalty factor parameter setting is challenging and directly affects the search. The unreasonable function will lead to problems such as falling into the local optimum solution, too long calculation time, and instability.
The proposed model has five constraints, and the fitness function is established as follows:
F f i t = F λ 1 max ( n =   1 N / 2 T i T s , 0 ) λ 2 max ( d i d i + 1 , 0 ) + λ 3 ( min ( h y nmin hy M , 0 ) + min ( H b n h n , 0 ) + min ( p b n , 0 ) + max ( p b n 1 , 0 ) )
here, Ffit is the fitness of the irrigation cost, λ is the penalty factor.
Irrigation period and pipe diameter constraints can accept inferior solutions. Their order of magnitude is similar to irrigation cost to make the effective solution more stable. Thus, the penalty function can range from 102 to 103. In order to meet the hydrant outlet pressure constraints, pump outlet pressure constraints, and pump efficiency constraints, the penalty factor for these constraints should be infinite.

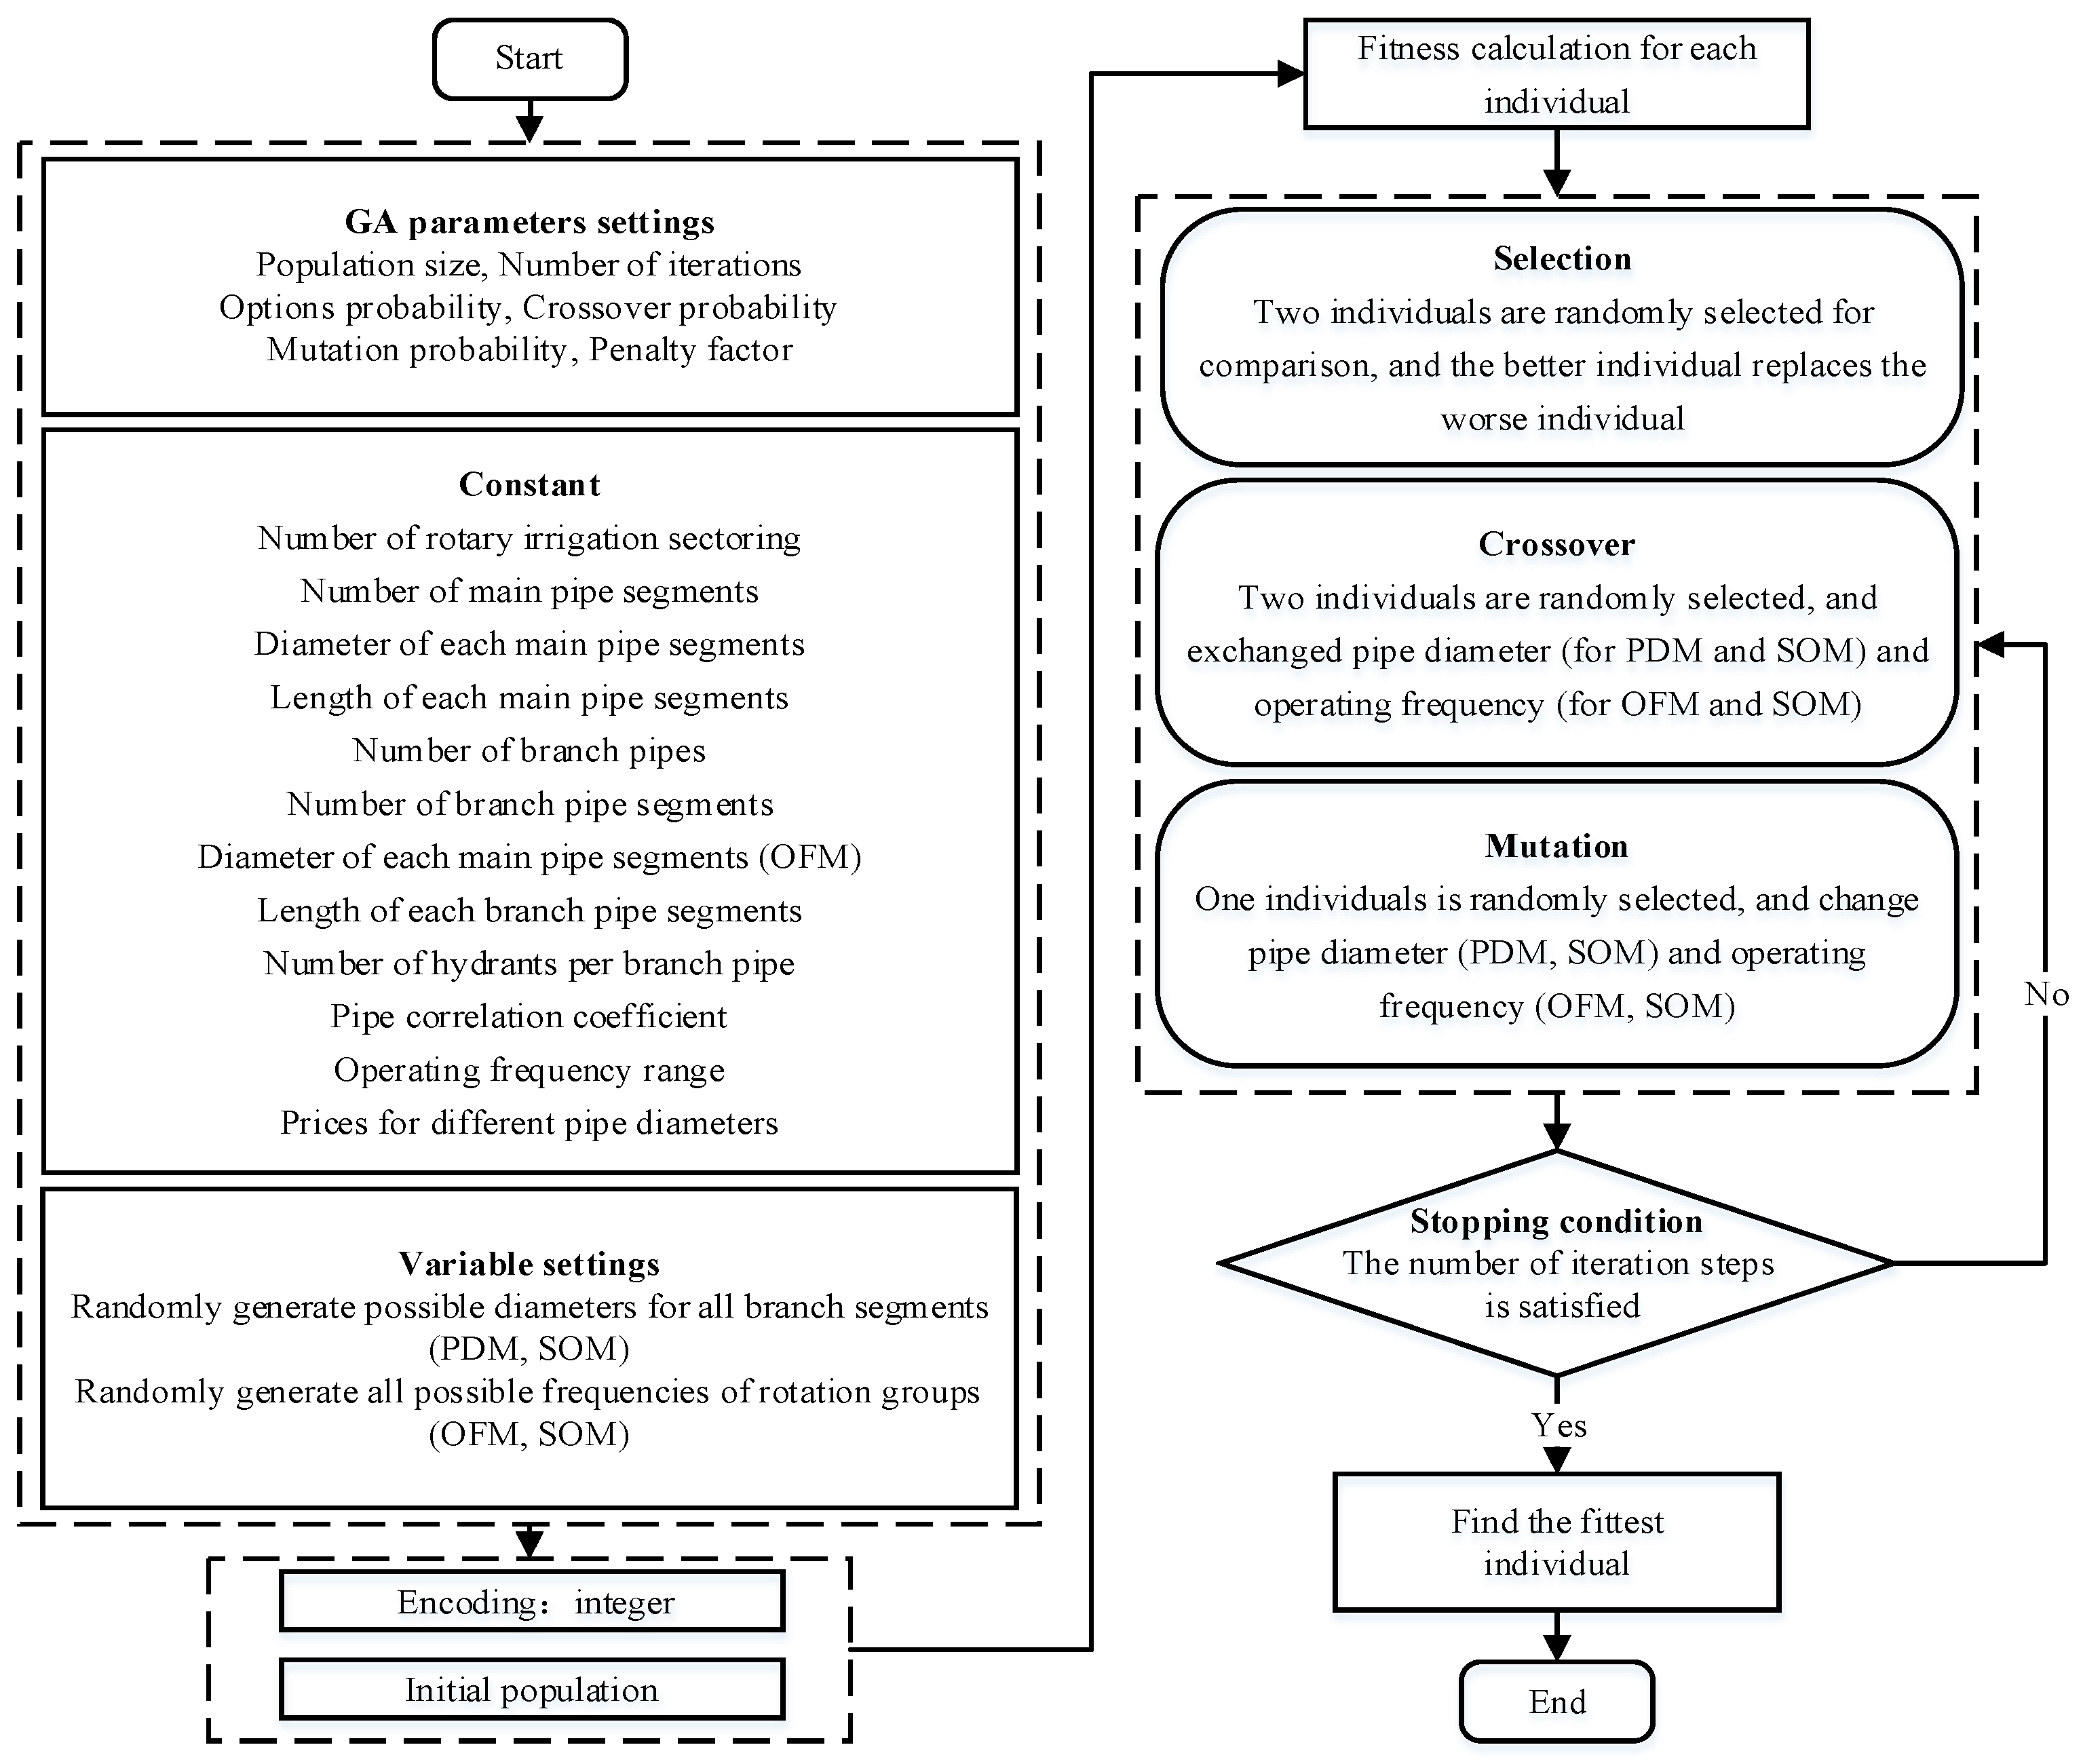
2.3.2. Solution Process of the Model

This study employs the GA to solve PDM, OFM, and SOM. Figure 4 shows the basic calculation flow chart of the GA. Compared with PDM and OFM, the SOM is a multifactorial model. One of the optimization variables (pipe diameter or operating frequency) in the SOM is chosen the same as the original system to convert SOM to PDM or OFM.

3. Results

3.1. Basic Information

In order to assess the performance of the proposed method, it is applied to PIN instances. The considered instances were obtained from the data from a real network in an experimental field (33°04′53.0″ N 119°52′55.8″ W) in Jiangsu Province, China. The irrigation area of the experimental field is about 30 hectares, the terrain is flat, rice and wheat are planted, and the annual irrigation amount is about 950 mm. The pipe network has many main pipe segments with a diameter of 400 mm and ten branch pipes. The pipes used in the experimental field are U-PVC, The friction coefficient, discharge coefficient, and pipe diameter coefficient are 94,800, 1.77, and 4.77, respectively. Each branch pipe is distributed with multiple hydrants, and the interval of each hydrant is 40 m. Figure 5 shows the irrigation area of each hydrant, pipe network layout, length, and diameter of the main pipe.
The irrigation network of the experimental field was designed and constructed more than ten years ago, and the original pipe network was designed by the relatively advanced economic flow method at that time [41,42]. Table 2 shows the diameters of all branch pipe segments.
Through the investigation of pipeline manufacturers near the experimental field, the latest pipe price is utilized in the model for calculation. The commercial diameters and prices listed in Table 3 are utilized for all optimization modes.
In order to determine the operational performance of the pumping station and the pipe network, the working condition confirmation was accomplished. The experimental system construction is shown in Figure 6. There is a 0.2 s high-precision electric energy meter, frequency converter, and motor in the irrigation system. The inlet pipe, pump, pressure gauge, flowmeter, main pipe, valve, and branch pipe are ordered sequentially along the water flow direction. The experimental procedure is: First, the pump’s performance (50 Hz) is evaluated by controlling the valve. Second, the output frequency of the inverter is adjusted, the previous actions are repeated, and the pump performance curve is tested at different frequencies, the polynomial regression coefficients of performance are shown in Table 4.
The μ in the objective function (Equation (1)) should also be determined experimentally to verify its accuracy. The designed experimental process is as follows: First, the equipment in Figure 6 is employed to collect flow, pressure, running period, current, voltage, power factor, and energy consumption. Next, the above values are substituted into formula 1 for calculation, and the value of μ is determined based on the difference between theoretical and actual values of F. This paper performs the field test of the energy consumption of different pump operating points. Compared with the theoretical calculation, it is concluded that the energy consumption correction coefficient is 1.05. This work substitutes this coefficient into OFM and SOM to calculate energy consumption.

3.2. Optimization Results

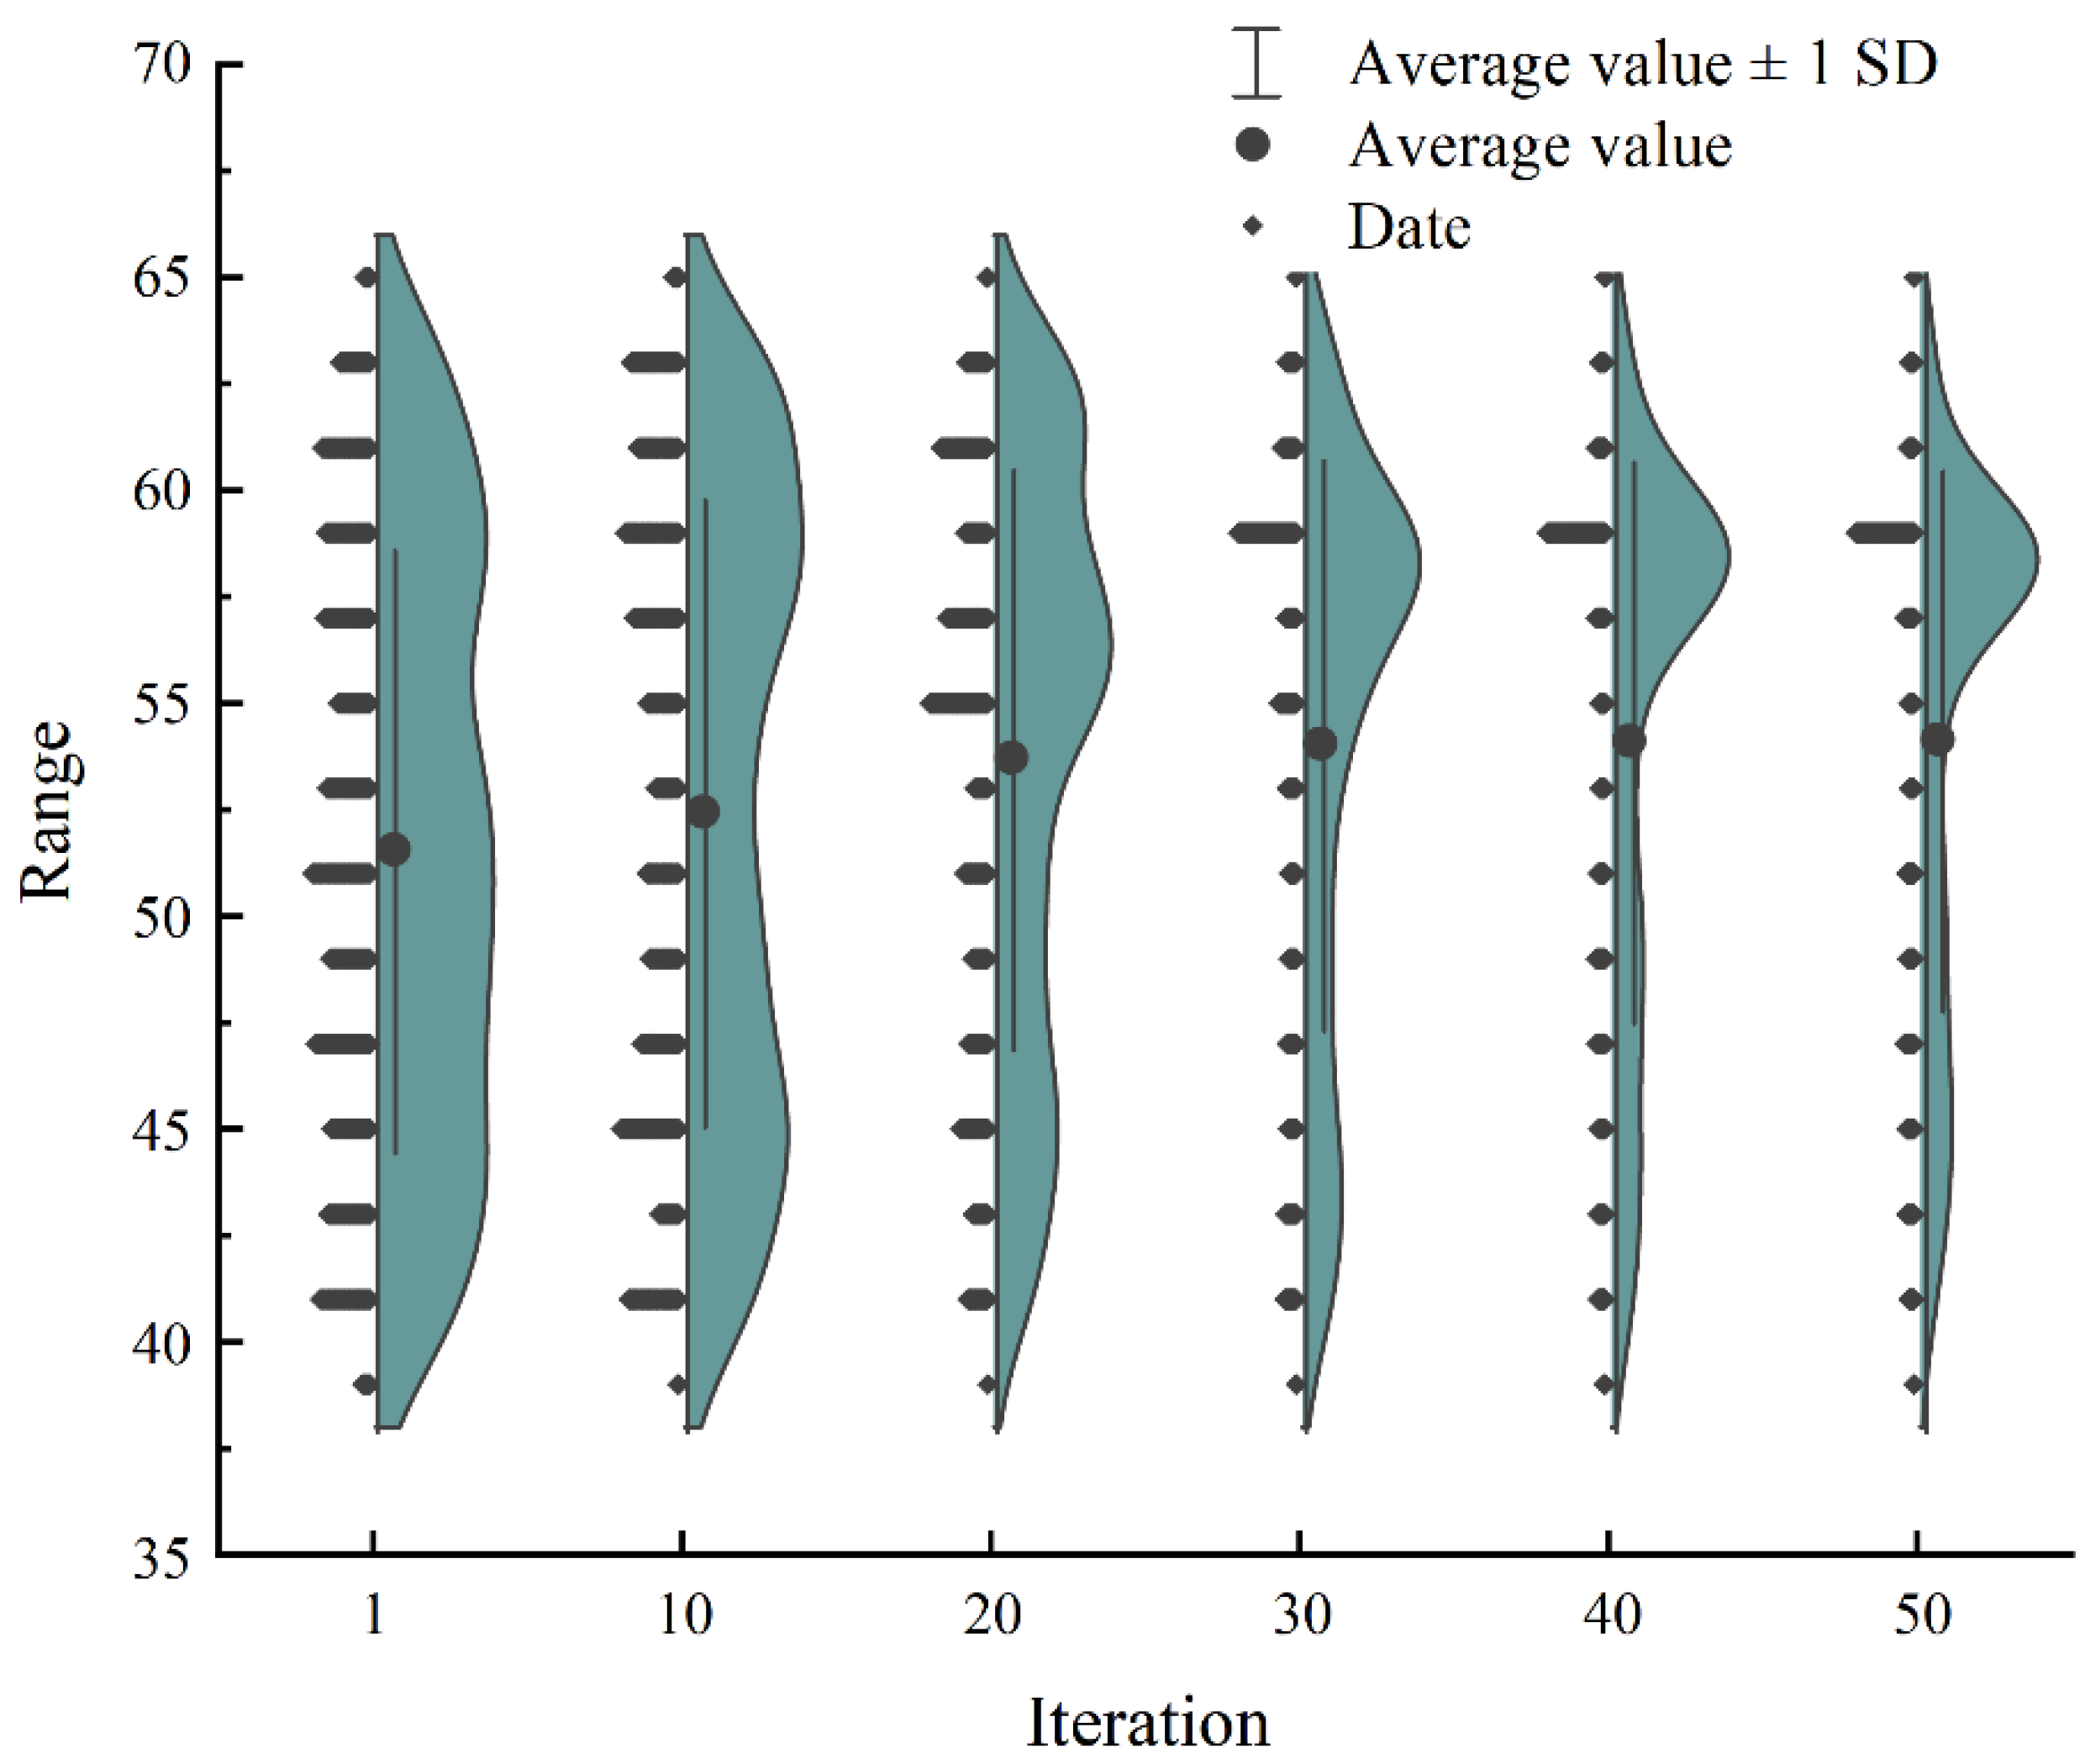
3.2.1. Algorithm Results

The genetic genes of this algorithm are discharge of hydrant, branch pipe diameter, and operating frequency. Figure 7 shows an iteration diagram of the hydrant discharge at the end of branch pipe 1. It can be seen from the iteration map that the initial population distribution of hydrant discharge is wide and covers all reasonable areas. After 20 iterations, the optimal discharge range is reduced, while the optimal discharge of the hydrant value becomes stable after 40 iterations. Similarly, the convergence of branch diameter and operating frequency has a similar effect.
Since the dimensions of the three models in this work are not the same, the feasible solution area is quite different. It is necessary to establish matching population sizes for different models. The orders of magnitude of OFM, PDM, and SOM are 10, 50, and 500, respectively. Therefore, to obtain better convergence, the designed population sizes are 1000, 2000, and 10,000. Figure 8 shows the model’s convergence iteration graph. Among them, the number of iterations is 30, the crossover probability is 0.4, the mutation probability is 0.2, the penalty coefficients are λ1 = 100, λ2 = 100, λ3 = 10,000, the depreciation period is 50, the annual interest rate is 8%, and the average annual maintenance rate is 3%.

3.2.2. Calculation Results

As shown in Figure 1, the branches in the irrigation sectoring have the same number of hydrants. However, asymmetry in the number of branch pipes often occurs in engineering applications. Therefore, when solving programming, the length of the non-existent branch pipe segment should be set to 0, and its corresponding hydrant discharge should also be set to 0.
Table 5 shows the pump operating performance and irrigation period for all irrigation sectoring of different optimization models. PDM runs at power frequency (50 Hz), while OFM and SOM run at variable frequencies.
Although both PDM and SOM optimize the pipe diameter, the SOM also optimizes the operation frequency. There is a clear difference in their pipe diameter optimization results, as shown in Table 6.

4. Discussion

The irrigation cost is the sum of the network and energy costs. Figure 9 shows the irrigation cost, including the network and energy costs of the original scheme and the three model schemes. As shown in Figure 9, the annual irrigation costs from high to low are the original scheme, OFM, PDM, and SOM. SOM can achieve a lower irrigation cost than OFM and PDM.
From the perspective of irrigation cost, the cost of a pipe network is about five times the energy consumption cost. Therefore, the pipe network optimization should reduce the pipe network cost as much as possible to complete the irrigation, rather than requiring the system to operate with lower energy consumption.
In order to compare the three optimization schemes with the original scheme, the savings rates of the irrigation cost, the network cost, and the energy cost are shown in Figure 10. A comparison between OFM and the original scheme indicates that the operation frequency optimization can achieve an energy-saving rate of 9.3%. It is verified that variable frequency drive optimization can reduce irrigation energy consumption [26,27]. However, the irrigation cost is only reduced by 1.4%, reflecting that the energy-saving effect of variable frequency drive is not apparent compared with the expensive pipe diameter cost. Furthermore, the irrigation costs of PDM and SOM are reduced by 10.6% and 19.3, the network costs are reduced by 18.1 and 19.3%, while the energy costs are increased by 31.7% and 21.9%, respectively. Therefore, although irrigation cost reduces while reducing the pipe diameter [7,16], it also has the detrimental effect of increasing energy consumption. Finally, a comparison between PDM and SOM shows that adding frequency conversion optimization can significantly reduce the irrigation cost, further reduction in the network cost and the energy consumption.

5. Conclusions

In this study, the pipe diameter optimization model and operation frequency optimization model are established, and a synchronous optimization model for the selection of the pipe diameter and variable frequency is proposed. The premise of this research is the flattish terrain, for which the models are only applicable. If used in hilly areas, the terrain should be used as an important constraint to modify the model. Taking the irrigation cost of the sum of network costs and energy costs as the research objective and solving it using GA. The algorithm converges after 20 iterations, and the calculation results are stable after 50 iterations. It is proved that the algorithm has strong adaptability and can be used to solve symmetric and asymmetric PINs.
The market research and experimental results show that the annual network cost and annual energy costs respectively account for about 5/6 and 1/6 of the annual total cost. Therefore, the focus of piping optimization should be to reduce the cost of the pipeline network as much as possible, rather than the low-energy operation of the system.
The traditional pipe diameter optimization and operating frequency optimization aim to reduce network cost and operating energy consumption, respectively. The calculation results of these two models show that the cost-saving rates of pipe diameter optimization and frequency conversion optimization are 10.6% and 1.4%, respectively. It shows that both optimization models can reduce the irrigation cost, but the optimization of the pipe diameter can significantly reduce the cost of irrigation more than the optimization of the operating frequency. The reason is that the cost-saving effect of variable frequency drive will be weakened compared with the expensive pipe diameter cost.
Furthermore, compared with only the pipe diameter optimization and only the frequency conversion optimization, the proposed synchronization optimization model can significantly reduce the irrigation cost, while the saving rate increases from 1.4% and 10.6% to 19.3%, respectively. It shows that the synchronization optimization proposed, adding the frequency conversion optimization to the pipe diameter optimization, in this paper, has more advantages in reducing irrigation costs than the traditional optimization.

Author Contributions

Conceptualization, Y.P. and H.L.; methodology, Y.P. and P.T.; validation, Y.P.; formal analysis, Y.P. and C.C.; investigation, Y.P. and C.C.; data curation, Y.P.; writing—original draft preparation, Y.P.; writing—review and editing, P.T. and C.C.; visualization, Y.P.; supervision, P.T.; project administration, Y.P. and H.L. All authors have read and agreed to the published version of the manuscript.

Funding

This research was funded by National Natural Science Foundation of China, grant number 51939005; Key Research and Development Program of Jiangsu Province, grant number BE2021340; Jiangsu Agriculture Science and Technology Innovation Fund, grant number CX(19)2040; Graduate research and innovation plan project for the regular institution of higher learning in Jiangsu province, grant number KYCX21_3355.

Institutional Review Board Statement

Not applicable.

Informed Consent Statement

Not applicable.

Data Availability Statement

Not applicable.

Conflicts of Interest

The authors declare no conflict of interest.

References

  1. Afshar, M.H. Application of a max–min ant system to joint layout and size optimization of pipe networks. Eng. Optim. 2006, 38, 299–317. [Google Scholar] [CrossRef]
  2. Alandí, P.P.; Álvarez, J.F.O.; Martín-Benito, J.M.T. Optimization of irrigation water distribution networks, layout included. Agric. Water Manag. 2007, 88, 110–118. [Google Scholar] [CrossRef]
  3. Caballero, J.A.; Ravagnani, M.A.S.S. Water distribution networks optimization considering unknown flow directions and pipe diameters. Comput. Chem. Eng. 2019, 127, 41–48. [Google Scholar] [CrossRef]
  4. Jiménez-Bello, M.A.; Martínez, F.; Soler, V.B.; Ayala, H.J. Methodology for grouping intakes of pressurised irrigation networks into sectors to minimise energy consumption. Biosyst. Eng. 2010, 105, 429–438. [Google Scholar] [CrossRef]
  5. Zhang, L.; Zhou, W.; Li, D. Research progress in irrigation mode selection of high-efficiency water-saving agriculture. J. Drain. Irrig. Mach. Eng. 2019, 37, 447–453. [Google Scholar] [CrossRef]
  6. Shiono, N.; Suzuki, H.; Saruwatari, Y. A dynamic programming approach for the pipe network layout problem. Eur. J. Oper. Res. 2019, 277, 52–61. [Google Scholar] [CrossRef]
  7. Afshar, M.H. Evaluation of selection algorithms for simultaneous layout and pipe size optimization of water distribution network. Sci. Iran. 2007, 14, 274–286. [Google Scholar] [CrossRef]
  8. Boyne, G.G. The optimum design of fluid distribution networks with particular reference to low pressure gas distribution networks. Int. J. Numer. Methods Eng. 2010, 5, 253–270. [Google Scholar] [CrossRef]
  9. Pérez, L.; Ortiz, J.; Pout, C. A review on buildings energy consumption information. Energy Build. 2008, 40, 394–398. [Google Scholar] [CrossRef]
  10. Li, X.; Zhang, C.; Huo, Z. Optimizing irrigation and drainage by considering agricultural hydrological process in arid farmland with shallow groundwater. J. Hydrol. 2020, 585, 124785. [Google Scholar] [CrossRef]
  11. Tsolas, S.D.; Karim, M.N.; Hasan, M.M.F. Optimization of water-energy nexus: A network representation-based graphical approach. Appl. Energy 2018, 224, 230–250. [Google Scholar] [CrossRef]
  12. Ren, C.; Xie, Z.; Zhang, Y.; Wei, X.; Wang, Y.; Sun, D. An improved interval multi-objective programming model for irrigation water allocation by considering energy consumption under multiple uncertainties. J. Hydrol. 2021, 602, 126699. [Google Scholar] [CrossRef]
  13. Córcoles, J.I.; de Juan, J.A.; Ortega, J.F.; Tarjuelo, J.M.; Moreno, M.A. Management evaluation of water users associations using benchmarking techniques. Agric. Water Manag. 2010, 98, 1–11. [Google Scholar] [CrossRef]
  14. Ma, P.H.; Hu, Y.J.; Liu, H.S.; Li, Y.N. Simultaneous optimization of micro-irrigation subunit layout and pipe diameter and analysis of influencing factors. J. Hydraul. Eng. 2019, 50, 1350–1373. [Google Scholar] [CrossRef]
  15. Giménez, J.L.; Calvet, J.L.; Alonso, A. A two-level dynamic programming method for the optimal design of sewerage networks. IFAC Proc. Vol. 1995, 28, 537–542. [Google Scholar] [CrossRef]
  16. Zhao, R.H.; He, W.Q.; Lou, Z.K.; Nie, W.B.; Ma, X.Y. Synchronization optimization of pipeline layout and pipe diameter selection in a self-pressurized drip irrigation network system based on the genetic algorithm. Water 2019, 11, 489. [Google Scholar] [CrossRef] [Green Version]
  17. Theocharis, M.E.; Tzimopoulos, C.D.; Sakellariou-Makrantonaki, M.A.; Yannopoulos, S.I.; Meletiou, I.K. Comparative calculation of irrigation networks using Labye’s method, the linear programming method and a simplified nonlinear method. Math. Comput. Model. 2010, 51, 286–299. [Google Scholar] [CrossRef]
  18. Arai, Y.; Koizumi, A.; Inakazu, T.; Tamura, S. Optimized operation of water distribution system using multipurpose fuzzy LP model. Water Sci. Technol. Water Supply 2013, 13, 66–73. [Google Scholar] [CrossRef]
  19. Aghdam, K.M.; Mirzaee, I.; Pourmahmood, N.; Aghababa, M.P. Adaptive Mutated Momentum Shuffled Frog Leaping Algorithm for Design of Water Distribution Networks. Arab. J. Sci. Eng. 2014, 39, 7717–7727. [Google Scholar] [CrossRef]
  20. Bahoosh, S.; Bahoosh, R.; Haghighi, A. Development of a Self-Adaptive Ant Colony Optimization for Designing Pipe Networks. Water Resour. Manag. 2019, 33, 4715–4729. [Google Scholar] [CrossRef]
  21. Lamaddalena, N.; Khila, S. Energy saving with variable speed pumps in on-demand irrigation systems. Irrig. Sci. 2012, 30, 157–166. [Google Scholar] [CrossRef]
  22. Tolvanen, J. Saving energy with variable speed drives. World Pumps 2008, 501, 32–33. [Google Scholar] [CrossRef]
  23. Lamaddalena, N.; Piccinni, A.F. Indexed characteristic curves of an irrigation network for the lifting plant design. Riv. Ing. Agrar. 1993, 24, 129–135. (In Italian) [Google Scholar]
  24. AitKadi, M.; Lamaddalena, N.; Bouabe, Z.; El Yacoubi, Z. Study on the possibility of energy saving in an irrigation system equipped with pumping station. Riv. Irrig. Dren. 1998, 45, 25–30. [Google Scholar]
  25. Díaz, J.A.R.; Luque, R.L.; Cobo, M.T.C.; Montesinos, P.; Poyato, E.C. Exploring energy saving scenarios for on-demand pressurised irrigation networks. Biosyst. Eng. 2009, 104, 552–561. [Google Scholar] [CrossRef]
  26. Camoirano, R.; Dellepiane, G. Variable frequency drives for MSF desalination plant and associated pumping stations. Desalination 2005, 182, 53–65. [Google Scholar] [CrossRef]
  27. Mahmoudi, M.; Dehghan, M.; Haghgou, H.; Keyanpour-Rad, M. Techno-economic performance of photovoltaic-powered air-Conditioning heat pumps with variable-speed and fixed-speed compression systems. Sustain. Energy Technol. Assess. 2021, 45, 101–113. [Google Scholar] [CrossRef]
  28. Simpson, A.R.; Goldberg, D.E. Pipeline optimization via genetic algorithms: From theory to practice. In Water Pipeline Systems; Mechanical Engineering Publication: London, UK, 1994; pp. 309–320. [Google Scholar]
  29. Zheng, F.; Simpson, A.R.; Zecchin, A.C. A decomposition and multistage optimization approach applied to the optimization of water distribution systems with multiple supply sources. Water Resour. Res. 2013, 49, 380–399. [Google Scholar] [CrossRef] [Green Version]
  30. Zhan, H.; Yang, J.J.; Ding, Y.C. Improved Genetic Algorithm for Optimization of Multi-Source Pumping Tree-Type Pipe Network. Adv. Mater. Res. 2011, 402, 738–741. [Google Scholar] [CrossRef]
  31. Sui, H.; Niu, W. Branch-Pipe-Routing Approach for Ships Using Improved Genetic Algorithm. Front. Mech. Eng. 2016, 11, 316–323. [Google Scholar] [CrossRef]
  32. Abadia, R.; Rocamora, C.; Ruiz, A.; Puerto, H. Energy efficiency in irrigation distribution networks i: Theory. Biosyst. Eng. 2008, 101, 21–27. [Google Scholar] [CrossRef]
  33. Abadia, R.; Rocamora, C.; Vera, J. Energy efficiency in irrigation distribution networks II: 1pplications. Biosyst. Eng. 2012, 111, 398–411. [Google Scholar] [CrossRef]
  34. Planells, P.P.; Tarjuelo, J.M.; Ortega, J.F.; Casanova, M.I. Design of water distribution networks for on-demand irrigation. Irrig. Sci. 2001, 20, 189–201. [Google Scholar] [CrossRef]
  35. GB/T 20203-2017. Technical Specification for Irrigation Projects with Pipe Conveyance (in China). 2017. AQSIQ, SAC. Available online: http://std.samr.gov.cn/gb/search/gbDetailed?id=5DDA8BA1F40718DEE05397BE0A0A95A7 (accessed on 5 May 2022).
  36. Lapo, C.M.; Pérez-García, R.; Izquierdo, J.; Ayala-Cabrera, D. Hybrid optimization proposal for the design of collective on-rotation operating irrigation networks. Procedia Eng. 2017, 186, 530–536. [Google Scholar] [CrossRef]
  37. Maier, H.R.; Simpson, A.R.; Zecchin, A.C.; Foong, W.K.; Phang, K.Y.; Seah, H.Y.; Tan, C.L. Ant Colony Optimization for Design of Water Distribution Systems. J. Water Resour. Plan. Manag. 2003, 129, 200–209. [Google Scholar] [CrossRef] [Green Version]
  38. Aguilar-Rivera, R.; Valenzuela-Rendón, M.; Rodríguez-Ortiz, J.J. Genetic Algorithms and Darwinian Approaches in Financial Applications: A Survey. Expert Syst. Appl. 2015, 42, 7684–7697. [Google Scholar] [CrossRef]
  39. Slowik, A.; Kwasnicka, H. Evolutionary Algorithms and Their Applications to Engineering Problems. Neural Comput. Appl. 2020, 32, 12363–12379. [Google Scholar] [CrossRef] [Green Version]
  40. Deb, K. An efficient constraint handling method for genetic algorithms. Comput. Methods Appl. Mech. Eng. 2000, 186, 311–338. [Google Scholar] [CrossRef]
  41. Wang, X.K.; Cai, H.J. Multi-group genetic algorithms for optimization of pumping tree pipe network. Trans. Chin. Soc. Agric. Mach. 2004, 6, 20–22. [Google Scholar]
  42. Wang, X.K. Optimization of pumping tree pipe network by using annealing-genetic algorithms based on infeasible degree. Trans. Chin. Soc. Agric. Mach. 2009, 40, 63–67. [Google Scholar]
Figure 1. The schematic diagram of the branched networks and irrigation sectoring.
Agriculture 12 00673 g001
Figure 2. The schematic diagram of branch pipes number and main pipe segments number.
Agriculture 12 00673 g002
Figure 3. Schematic diagram of the branch pipe segments number and hydrant number.
Agriculture 12 00673 g003
Figure 4. The basic calculation flow chart of the GA.
Agriculture 12 00673 g004
Figure 5. Diagram of the experimental field.
Agriculture 12 00673 g005
Figure 6. Schematic diagram of experimental system construction.
Agriculture 12 00673 g006
Figure 7. Population distribution of hydrant discharge during iteration.
Agriculture 12 00673 g007
Figure 8. Iterative graph of cost for different optimization models.
Agriculture 12 00673 g008
Figure 9. Irrigation cost, network cost and energy cost of the original scheme, OFM, PDM, SOM.
Agriculture 12 00673 g009
Figure 10. OFM, PDM, SOM compared with the original scheme, the saving rate of total irrigation cost, pipe network cost and energy cost.
Agriculture 12 00673 g010
Table 1. Rotation irrigation sectoring and the number of main pipe segments between branch pipe and pump.
Rotation irrigation sectoring number12345 N/2
Branch pipe number13579N−1
246810N
The number of main pipe segments
between branch and pump
11223 N 1 4 + 1
Table 2. The diameters of all branch pipe segments in the experimental field. Since there are too many pipe sections in the experimental field, in order to facilitate the mathematical description, this paper describes the pipe sections as two-dimensional data. Sort by branch number and assign values to all pipe segments of each branch.
Branch Pipe
Number
Branch Pipe Segment Number and the Corresponding Pipe Diameter (mm)
1234567
1160200250250315315315
2160200250250315315-
3160200250250315315315
4160200250250315315-
5160200250250315315315
6160200250250315315-
7160200250250315315315
8160200250250315315-
9160200250250315315315
10160200250250---
Table 3. Unit prices of commercial different pipes.
Unplasticized Polyvinyl Chloride (U-PVC) Pipes (with a Pressure Capacity of 0.6 MPa)
Outside diameter (mm)140160200250315400
Inner diameter (mm)132.1152.6190.8236.4302.6380.4
Unit price (Yuan/m)28375690142232
Table 4. The polynomial regression coefficient of the pump at the experimental site, since Bi,f and Ci,f have two variables, is converted into a table of different coordinates for description, irrigation sectoring (i), and operation frequency (f).
Irrigation
Sectoring (i)
Operation Frequency (f)
s504948474241
B121.120.2619.4518.6414.8914.19
2−0.004611−0.004519−0.004427−0.004334−0.003873−0.003781
3−8.467 × 10⁻⁶−8.467 × 10⁻⁶−8.467 × 10⁻⁶−8.467 × 10⁻⁶−8.467 × 10⁻⁶−8.467 × 10⁻⁶
4−1.329 × 10⁻²²−4.025 × 10⁻¹⁷−7.911 × 10⁻¹⁸−1.066 × 10−173.556 × 10−177.502 × 10⁻¹⁷
C1−0.022730.02265−0.022570.022480.022060.02197
20.0022770.0023160.0023560.0023970.0026320.002685
3−1.919 × 10⁻⁶−1.919 × 10⁻⁶−2.068 × 10−62.149 × 10−6−2.64 × 10−62.758 × 10−6
43.97 × 10−104.203 × 10−104.455 × 10−104.729 × 10−106.493 × 10−106.95 × 10⁻¹⁰
Table 5. Operating frequency, pump performance and irrigation period for all irrigation sectoring of different irrigation models.
Optimization
Model
Irrigation SectoringOperating
Frequency
(Hz)
Pump Flow
(m3/h)
Pump Head
(m)
Pump
Efficiency
(%)
Irrigation
Period
(h)
PDM15084411.281.65.1
25055515.976.39.7
35062614.979.48.3
45064614.6808.7
55067314.280.76.1
OFM1425939.6798.4
2416368.379.38.1
3457279.680.47.1
4416128.779.29.3
54464410.275.57.6
SOM15057915.677.58.6
24864213.180.18.2
34358110.478.88.2
44854514.576.410.7
54359312.3796.5
Table 6. The diameters of all branch pipe segments in the different irrigation models.
Optimization
Model
Branch Pipe
Number
Branch Pipe Segment Number
1234567
PDM1200200200200200200200
2250250250250250315-
3315315315315315315315
4160200200200315315-
5200200200200200200250
6200250250250315315-
7200200250250315315315
8160200200200200200-
9315315315315315315315
10160160160200---
SOM1200200200200250250315
2160160200200200200-
3160160160200250250315
4200200250250250250-
5200200200315315315315
6160160200200200250-
71601601601602502502
8160160160160160160-
9160160200250315315315
10200200200200---
Publisher’s Note: MDPI stays neutral with regard to jurisdictional claims in published maps and institutional affiliations.

