Article

Prediction of the Irrigation Area Carrying Capacity in the Tarim River Basin under Climate Change

1
College of Life Science and Technology, Jinan University, Guangzhou 510632, China
2
Safety, Environment and Technology Supervision Research Institute, Petro China Southwest Oil and Gas Field Company, Chengdu 610041, China
3
State Key Laboratory of Desert and Oasis Ecology, Xinjiang Institute of Ecology and Geography, Urumqi 830011, China
4
School of Water Conservancy and Environment, University of Jinan, Jinan 250024, China
*
Author to whom correspondence should be addressed.
Agriculture 2022, 12(5), 657; https://doi.org/10.3390/agriculture12050657
Submission received: 22 March 2022 / Revised: 26 April 2022 / Accepted: 27 April 2022 / Published: 30 April 2022
(This article belongs to the Special Issue Precision Water Management in Dryland Agriculture)

Abstract

:
The Tarim River Basin (TRB) is one of the world’s largest cotton-producing areas, and its agricultural water use accounts for up to 95% of the total water consumption in the basin. Quantifying the future changes in the irrigation area carrying capacity under global warming is therefore essential in TRB. In this study, we analyzed the variation in the irrigation area in TRB over the last few decades, utilized the nonlinear autoregressive with an exogenous input neural network to simulate the future changes in the available water resources, and predicted the future irrigation area carrying capacity based on the water balance equation. The results showed that the present (1970–2020) irrigation area in TRB exhibited an increasing trend from 491 km2 in 1970s to 1382 km2 in 2020, as most of the natural vegetation was transformed into cropland. In the future (2022–2050), the available water resource will show an upward tendency while the irrigation area carrying capacity mainly ranges from 12 × 10 2 21 × 10 2   km 2 and 17 × 10 2 30 × 10 2   km 2 under scenarios SSP (shared socioeconomic pathway) 245 and SSP585, respectively. The simulated results will provide useful information for the allocation of water resources and the regional sustainable development of TRB.

Graphical Abstract

1. Introduction

Arid regions occupy 41% of the global land surface area and are inhabited by roughly more than 1/3 of all human beings in the world [1], and agricultural production in these regions is extremely critical in order to meet the basic needs of people [2]. However, the agricultural production system in these regions is facing increasing challenges due to rapidly growing populations, while water resources are usually scarce and are highly affected by climate change [2,3]. The most notable example of an arid area is the Tarim River Basin (TRB), which is situated on the margins of the Taklimakan Desert and is the most arid region in China, with an annual mean precipitation below 50 mm and annual mean evaporation over 3000 mm [4,5]. TRB is one of the largest cotton-producing areas in the world, with the annual mean cotton production representing more than 1/3 of China’s total production, and its agricultural water use (mainly irrigation) accounting for up to 95% of the total water consumption in the basin [6].
The water supply for irrigation in TRB is mainly from the streamflow [7]. Hydrologically, TRB is a closed catchment and is mainly recharged by precipitation and glacier-melt and snowmelt water with headwaters in the surrounding mountainous regions [8]. Although TRB holds about 26% of China’s total number of glaciers with 41% of the total volume, the region still faces serious water pressure because it falls in the extreme continental arid desert climate zone [9,10]. This makes the region one of the most complex and vulnerable areas to global warming, as warming will increase the rate of evaporation, change the ratio of precipitation versus snowfall, and accelerate the melt of glaciers and snow [8]. However, quantitative analyses to predict the future changes in the irrigation area carrying capacity in TRB under the background of global warming are still limited [11]. Some studies have focused on the historical total irrigation water requirement and water supply in TRB [12,13,14]. Several studies have analyzed the irrigation area carrying capacity in TRB in different runoff frequencies [15,16,17]. They concluded that the planned irrigation area (i.e., 6.47 × 10 2   km 2 in the mainstream of TRB) would be overloaded in low flow years (i.e., 50% and 75% runoff frequency) and affect the ecological water supply [15,16,17]. Recently, some studies have been conducted on the impact of climate change on the runoff for the upper Tarim River [11,18,19]. However, the impact of climate change on the irrigation area carrying capacity in TRB is still unknown.
This study was conducted to quantify the future irrigation area carrying capacity in TRB under global warming. The objectives of this study are as follows: (1) to analyze the variation in a long-term irrigation area in the mainstream of TRB, (2) to project the future total water availability in the mainstream of TRB under various climate scenarios, and (3) to quantify the future irrigation area carrying capacity under various climate scenarios based on water resources’ availability and utilization in TRB. The prediction of future changes in the irrigation area carrying capacity in TRB can provide useful information for the allocation of water resources and regional sustainable development, and can serve as a reference for arid regions such as the Heihe River Basin and the Shiyang River Basin in Northwest China, where the water supply for irrigation is sensitive to climate change.

2. Materials and Methods

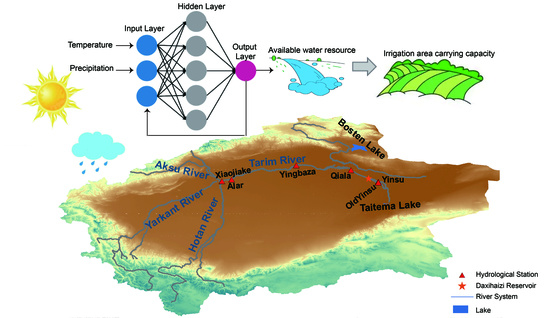
2.1. Study Site and Data Sources

TRB, with an area of 1.02 × 10 6   km 2 , which is located on the edge of the Taklimakan Desert, is one of the world’s largest closed hydrological drainage systems (Figure 1). The climate of the basin is characterized by an extremely arid climate with an annual precipitation below 50 mm, temperatures ranging from −35 °C to 40 °C, and annual potential evaporation above 3000 mm [4]. In hydrological terms, TRB was recharged by the Aksu, Yarkant, and Hotan Rivers through glacier-melt water, snowmelt water, and precipitation from high mountainous regions [20]. Stretching from Xiaojiake, the mainstream of TRB is 1321 km long and can be divided into three sections (Figure 1): Alar to Yingbaza as the upstream section with a length of 495 km, Yingbaza to Qiala as the midstream section with a length of 398 km, and Qiala to Taitema Lake as the downstream section with a length of 428 km. The natural vegetation types in this region mainly include herbs such as Poacynum hendersonii, Glyzyrrhiza inflate, and Karelinia capsica; shrubs such as Tamarix spp., Lycium ruthenicum, and Nitraria sibirica; and arbors such as Populus euphratica [21]. Crops in this region mainly include cotton, bean, and melon; in particular, cotton is the dominant crop in the basin [14]. As the rainfall in this area cannot meet the requirement of crops and vegetation communities, the survival of this vegetation mainly depends on the stream [4].
Land use data with a resolution of 1 km (Available online: http://www.tpedatabase.cn/, accessed on 12 December 2021) [22] over the period of the 1970s and 1980s, as well as 1995, 2000, 2010, and 2020, were obtained. The irrigation quota data of TRB were collected from the TRB Management Bureau [15]. Because of the water inflow to the Alar station, the gauge station of the upper Tarim River is a key factor for determining the total water availability in the mainstream of TRB [11], and most of the total water inflow to the basin was recharged by the upper three tributaries (i.e., Aksu, Yarkant, and Hotan Rivers) through glacier-melt water, snowmelt water, and precipitation from high mountainous regions [23]. The monthly flow discharge data from the Alar hydrological station and the monthly temperature and precipitation data (Available online: http://poles.tpdc.ac.cn/, accessed on 12 December 2021) in the upper three tributaries over the period of 1957 to 2017 were collected to model the water availability in the mainstream of the basin. To predict the changes in the irrigation area carrying capacity of TRB during 2022–2050, the monthly temperature and precipitation data over the upper three tributaries were derived from five climate models (i.e., BCC-CSM2-MR, CanESM5, TaiESM1, INM-CM4-8, and MIROC6) of the coupled model intercomparison project phase 6 (CMIP6) under scenarios SSP (shared socioeconomic pathway) 245 and SSP585 [24]. The climate model outputs were bias-corrected and downscaled to a spatial resolution of 0.25 × 0.25 (Available online: https://www.nccs.nasa.gov/, accessed on 12 December 2021) [25].

2.2. Method

2.2.1. Analysis of Irrigation Area Carrying Capacity

The irrigation area carrying capacity (A) is given by the following:
A = W irrigation / I ,
where A denotes the irrigation area (km2), and Wirrigation and I denote the volume of irrigation water (108 m3) and irrigation quota per unit area (m3 km−2), respectively.
Based on the water balance equation, the volume of irrigation water Wirrigation is given by the following:
W irrigation = W total W life W industry W ecology W loss ,
where Wtotal denotes the volume of total water inflow to the mainstream (108 m3), and Wlife, Windustry, Wecology, and Wloss denote the volume of domestic use (108 m3), industry use (108 m3), ecology (108 m3), and evaporation loss (108 m3) in the mainstream of TRB, respectively. These data were collected from the TRB Management Bureau.

2.2.2. Nonlinear Autoregressive with Exogenous Input (NARX) Neural Network

The hydrological processes in TRB respond in a complex way to the variations in climate and glaciers [8]. Moreover, as the complexity of real-world conditions cannot be fully expressed, these deficiencies inevitably increase the uncertainty of physics-based model inputs, as well as the corresponding outputs [26]. These all increase the difficulty of runoff simulation in the basin. Recently, machine learning methods have been widely used as good alternative approaches compared with conventional models as they can directly solve problems when the relationships between associated explanatory and explained variables are difficult to express [27]. In this work, the NARX neural network model [28] was used to simulate the water inflow at the Alar station (Figure 1). The NARX network is a special type of recurrent neural network that models the process based on lagged input and output variables and prediction errors [29]. The NARX network has gained popularity in the last few years thanks to its accuracy and long-term memory in the prediction of hydrological time series [5,30]. Especially for a small sample size, the NARX network can obviously outperform long short-term memory, which is widely known to perform well on the prediction of time series [31]. The NARX network can be mathematically formulated as follows:
y t = f y t 1 , , y t d y ; x t 1 , , x t d x ,
where f is the nonlinear function obtained by a learning algorithm. The model output y t denotes the monthly water inflow to the Alar station of the upper Tarim River at time step t. Model inputs x t denote the monthly temperature and precipitation data in the upper three tributaries (i.e., the Aksu, Yarkant, and Hotan Rivers) at time step t. d y and d x are the output and input memory orders, respectively [28]. Figure 2 shows the architecture of the NARX model used in this work.
The time-series data were divided into three parts: 70% for training, 20% for validation, and 10% for testing. The NARX network was trained with the Levenberg−Marquardt optimization algorithm. To converge faster and avoid local extremes, the time-series data were normalized to the range of −1 to 1 and then rescaled to the original values after training. The performance of the NARX model is evaluated by the root mean squared error (RMSE) and Nash−Sutcliffe efficiency coefficient (NSE):
RMSE = 1 n i = 1 n p i o i 2     RMSE > 0 ,
NSE = 1 i = 1 n o i p i 2 i = 1 n o i o ¯ 2     < NSE < 1 ,
where oi, pi, and o ¯ denote the observations, predictions, and mean observation, respectively. i refers to the i-th value of the data. n is the number of observations. NSE is widely used to measure the model performance with reference to the observed time series [32]. RMSE is the standard deviation of the prediction errors. The ideal scores for the goodness-of-fit criteria are 1 for NSE and 0 for RMSE.

3. Results

3.1. Changes in Land Use and Irrigation Areas

Figure 3 illustrates the spatial distribution of irrigated land in the upstream, midstream, and downstream of the Tarim River Basin between 1970 and 2020. Figure 3 shows how the irrigation agriculture of the mainstream is concentrated along the river channel, and the area of cropland exhibited an increasing trend from 1970 to 2020, especially in 2020 (Figure 3). The waterfall plots are used to detect the inter-annual variations in the irrigation area in TRB between 1970 and 2020 (Figure 4). The top of the waterfall plot starts with the initial value for 1970, and then each row explains how the positive (red) or negative (blue) variation in each year moves the value from the initial value to the current value (Figure 4). The irrigation area of the Tarim River, in general, exhibited an increasing trend from 1970 to 2020, except for the 1980s and the year 1995. Compared with the lower reaches of TRB, the irrigation area in the upper and middle reaches increased significantly (Figure 4). For example, the irrigation area in the upper and middle reaches increased from 139 km2 in the 1970s to 617 km2 in 2020, and increased from 98 km2 in the 1970s to 426 km2 in 2020, respectively, while the irrigation area in the lower reaches only increased from 254 km2 in the 1970s to 339 km2 in 2020 (Figure 4d).
Figure 5 illustrates the transition of land use and land cover changes from 1970 to 2020 in TRB. In summary, the irrigation area of the Tarim River exhibited an increasing trend, while the natural vegetation area showed a decreasing trend from 1970 to 2020 (Figure 5). Irrespective of the upper, middle, or lower reaches of the basin, most of the natural vegetation area was transformed into crop areas and other areas, while most of the other land was transformed into natural vegetation land. For example, in the upstream, most of the natural vegetation areas in 2010 were transformed into farmland and other areas (the transformed areas were 404 km2 and 653 km2, respectively), while most of the other areas in 2010 were transformed into natural vegetation areas (these transformed areas were 544 km2; Figure 5).

3.2. Model Training and Validation

The NARX neural network was used to model the available water resources in the mainstream by approximating the nonlinear function of the temperature and precipitation data in the upper three tributaries and the water inflow to the Alar station in the upstream of TRB. The NARX neural network model was trained, validated, and tested from 1957 to 2017 (Figure 6). The NARX model performed satisfactorily with RMSE = 0.74 and NSE = 0.72 for the testing dataset, and was able to capture the complex trending changes in the water inflow to the mainstream of the basin (Figure 6).

3.3. Prediction of Irrigation Area under Climate Change

The average temperature and precipitation data in the three upper tributaries of TRB were used to study the changes in temperature and precipitation in the headstreams under future climate scenarios. Compared with the mean annual precipitation and temperature in the headstream in the reference period from 1957 to 2017, the annual precipitation and temperatures from 2022 to 2050 under SSP245 and SSP585 showed increasing trends (Figure 7). Compared with scenario SSP245, irrespective of precipitation or temperature, the increases under SSP585 were greater than those under SSP245. The overall increase in the precipitation under SSP245 ranged from 60 to 140 mm, while the value under SSP585 ranged from 59 to 150 mm (Figure 7a). The temperature under SSP585 over 2022 to 2050 increased greatly with an overall increasing range of 1–3.2 °C, while the temperature under SSP245 increased with the range of 1–2.5 °C (Figure 7b).
The monthly temperature and precipitation data in the three upper tributaries of TRB from 2022 to 2050 under SSP245 and SSP585 were used to predict the water inflow to the mainstream using the trained NARX neural network model (Figure 2 and Figure 8). The annual total water inflow to the mainstream of the basin from 2022 to 2050 under SSP245 and SSP585 was mainly distributed between 50 × 10 8 75 × 10 8   m 3 and 55 × 10 8 90 × 10 8   m 3 , respectively (Figure 8a). Compared with the mean annual total water inflow to the mainstream of the basin in the reference period from 1957 to 2017, the annual total water inflow from 2022 to 2050 under SSP245 and SSP585 showed increasing trends (Figure 8b). Compared with the annual total water inflow under SSP245, the increases under SSP585 were greater than those under SSP245. The overall increase in the annual available water resources under SSP245 ranged from 10 × 10 8 23 × 10 8   m 3 , while the values of SSP585 ranged from 16 × 10 8 36 × 10 8   m 3 (Figure 8b).
Based on the water balance equation, the annual volumes of irrigation water from 2022 to 2050 under SSP245 and SSP585 were calculated by the volume of total water inflow minus the volume of domestic, industry, ecology, and evaporation loss in the mainstream of TRB, respectively. These data were then used to calculate the irrigation area carrying capacity in TRB under different future climate scenarios (Figure 9). The irrigation area carrying capacity in the mainstream of the basin from 2022 to 2050 under SSP245 and SSP585 mainly ranged from 12 × 10 2 21 × 10 2   km 2 and 17 × 10 2 30 × 10 2   km 2 , respectively.

4. Discussion

Located on the edge of the Taklimakan Desert, TRB in Northwest China is one of the world’s most arid areas [33]. Even though water scarcity is serious in TRB, this basin is still an important cotton and grain production region [6]. In the last few decades, cultivated land in TRB has greatly expanded as a result of rapid population growth and climate change [4]. The irrigation area of the mainstream of TRB, in general, exhibited an increasing trend from 491 km2 in the 1970s to 1382 km2 in 2020 (Figure 4). Based on the transition of land use and land cover changes from 1970 to 2020 in TRB (Figure 5), most of the natural vegetation area was transformed into cropland. Notably, the expansion rate of cropland increased slowly in the 1990s and even reversed in the 1980s, while it increased obviously after 2000 (Figure 4). This is because, since the 1960s, with the population increase and large-scale human activities such as reclamation and irrigation in the mainstream of TRB, the consumption of water resources has increased dramatically [4]. The streamflow in the lower reaches completely dried up in 1972 because the Daxihaizi Reservoir intercepted almost all the water for anthropogenic activities [34]. This drying fatally dropped the downstream groundwater table and severely destroyed the ecosystems [4]. Because of the continuously decreased streamflow in the upstream and midstream, large areas of reclaimed cropland turned into deserts in the 1980s [35]. Previous studies also found that changes in the irrigation area in TRB became slow during the 1980s and 1990s [36]. In 2000, the Central Chinese Government started implementing the ecological water diversion project and efficient irrigation system in order to save the degraded ecosystem [37]. The implementation of an efficient irrigation system greatly increased the water utilization coefficient in the cropland, and some studies have shown that the water consumption of a water-saving irrigation system is 30% to 40% less than the consumption of the original flooding irrigation system [38]. Therefore, with the adjustment to the crop cultivation structure and the popularization of water-saving irrigation, the total area of cropland increased obviously after 2000 [36].
Water resources are necessary for agricultural development and play a critical role in socio-economic development and ecosystem health [39]. Understanding the changes in the available water resources is important for efficient water resources’ management and is also helpful for agricultural development. In this work, the NARX neural network was used to model the available water resources in the mainstream of TRB by approximating the nonlinear function of the temperature and precipitation data in the upper three tributaries, as well as the water inflow to the Alar station upstream of the basin. The performance metric NSE of the NARX model was higher than 0.7, illustrating that the model is capable of modeling the water inflow to the mainstream of TRB (Figure 6). Other related studies that have focused on modeling the snowmelt-driven runoff using the NARX neural network and other machine learning models have also proven the applicability of the data-driven approach [40,41,42]. To obtain higher precision for water inflow prediction in TRB, further research could also be extended to include the influence of anthropogenic activities in the upper three tributaries, and this model could be extended to include the streamflow and snow cover of the upper three tributaries among its input variables.
TRB is fed by precipitation and glacier-melt and snowmelt water from high mountainous areas [8,20]. Many studies have focused on the impact of global warming on water resources in TRB over the past several decades [43,44,45]. They concluded that water resources from the headwaters of the basin showed a significant increase over the last few decades, and could be explained by the upward tendency of temperature and precipitation [8,46]. However, they did not quantify the future changes in water resources under climate change. Based on the mean annual water resource between 1957 and 2017, our predictions of the available water resources in the mainstream of the basin from 2022 to 2050 under SSP245 and SSP585 may increase in total by 10 × 10 8 23 × 10 8   m 3 and 16 × 10 8 36 × 10 8   m 3 , respectively (Figure 8). This is very likely, as climate projections show a rise in temperature of 1–2.5 °C and 1–3.2 °C, and an increase in precipitation of 60–140 mm and 59–150 mm under the SSP245 and SSP585 scenarios, respectively, during 2022 to 2050 (Figure 7). Moreover, this result is similar to that of Shi et al. [47], who predicted the runoff of the upper three tributaries (i.e., the runoff of Aksu River, Yarkant River, and Hotan River) under climate change, and concluded that the annual runoff will increase during 2020 to 2050. Xiang et al. [48] estimated that the streamflow on the Yarkant River Basin, which is one of the upper tributaries of TRB, will increase by 10.62–19.2% in the near future, and 36.69–70.4% in the far future under global warming.
Although climate change has obviously increased water inflow into the mainstream through increasing glacier and snow melting over the last several decades, the runoff in the midstream and downstream is continuously decreasing as a result of intensive human activities such as irrigation [43]. Hence, a rational scheme of the agricultural systems in the basin is essential for the sustainable development of the Tarim River. According to the available water resources results in this study, the irrigation area carrying capacity in the mainstream of the basin from 2022 to 2050 under the SSP245 and SSP585 scenarios mainly range from 12 × 10 2 21 × 10 2   km 2 and 17 × 10 2 30 × 10 2   km 2 , respectively (Figure 9). The future irrigation areas under the two scenarios are greater than those in 1970 to 2020. Many studies have analyzed the irrigation area carrying capacity in TRB in different runoff frequencies [15,16,17], but did not consider climate change and did not quantify the future changes in the irrigation area carrying capacity in TRB. In contrast, our study quantified the impact of climate change on the available water resources and the irrigation area carrying capacity in TRB. These results could be useful for water resource management and for the sustainable development of agriculture and ecosystems in this basin, as well as in similar arid regions such as the Heihe River Basin and Shiyang River Basin in Northwest China, in which glacier-melt and snowmelt water dominate the discharge [49,50]. However, because of the lack of local information, this study calculated the irrigation area by multiplying the volume of irrigation water and irrigation quota per unit area; however, detailed information such as crop structures and irrigation quota for each type of crop were not considered. As the irrigation efficiency and changes in crop structure have significant impacts on irrigation water consumption [51], these could be explored in future work. Furthermore, simulating the spatial expansion of irrigation land is essential for appropriate land use management and sustainable development [52]. Future work should also attempt to develop a spatiotemporal framework that injects the spatial changes in land use into the predictions of the future irrigation area carrying capacity, thereby making it more reasonable.

5. Conclusions

TRB is one of the world’s largest cotton-producing areas, and its agricultural water use accounts for up to 95% of the total water consumption in the basin. For the sustainable development of the region, it is necessary to quantify the future irrigation area carrying capacity in TRB under climate change. In this study, the changes in the present and future (2022–2050) irrigation areas in TRB were analyzed and projected. Over the last few decades, the farmland of TRB, in general, exhibited an increasing trend from 491 km2 in 1970 to 1382 km2 in 2020, which can be explained by most of the natural vegetation being transformed into cropland. Based on the NARX neural network model, in the future (2022–2050), the available water resources in the mainstream of the basin may have an overall increase of 10 × 10 8 23 × 10 8   m 3 and 16 × 10 8 36 × 10 8   m 3 under SSP245 and SSP585, respectively. This can be explained by the climate projections showing a rise in temperature and precipitation under global warming. The future irrigation areas under the two scenarios are greater than that from 1970 to 2020. The irrigation area carrying capacity in the mainstream of the basin from 2022 to 2050 under the SSP245 and SSP585 scenarios mainly range from 12 × 10 2 21 × 10 2   km 2 and 17 × 10 2 30 × 10 2   km 2 , respectively. This study analyzed the long-term variations of the farmland and demonstrated the future changes in the irrigation area carrying capacity in TRB under climate change from a quantitative perspective, which have important scientific implications for informed decision making regarding the sustainable development of agriculture and ecosystems in the basin and other arid regions such as the Heihe River Basin and Shiyang River Basin in Northwest China, where glacier-melt and snowmelt water dominate the discharge. The NARX neural network was reliable for modeling the available water resources in the mainstream of TRB, and is useful for simulating the melt-water-driven streamflow in water science research.

Author Contributions

Conceptualization, Q.L.; methodology, J.N. and D.G.; software, Y.L.; validation, J.N., D.G. and B.X.H.; formal analysis, Q.L.; investigation, Y.L.; resources, J.N. and D.G.; data curation, Y.L.; writing—original draft preparation, Q.L.; writing—review and editing, J.N. and D.G.; visualization, Y.L.; supervision, B.X.H.; project administration, B.X.H.; funding acquisition, J.N. and D.G. All authors have read and agreed to the published version of the manuscript.

Funding

This research was funded by the National Natural Science Foundation of China, grant numbers 41972244 and 42171042.

Institutional Review Board Statement

Not applicable.

Informed Consent Statement

Not applicable.

Data Availability Statement

The data presented in this study are available upon request from the corresponding author.

Conflicts of Interest

The authors declare no conflict of interest.

References

  1. Gaur, M.; Squires, V. Geographic Extent and Characteristics of the World’s Arid Zones and Their Peoples. In Climate Variability Impacts on Land Use and Livelihoods in Drylands; Springer: Cham, Switzerland, 2018. [Google Scholar]
  2. Golla, B. Agricultural production system in arid and semi-arid regions. J. Agric. Sci. Food Technol. 2021, 7, 234–244. [Google Scholar]
  3. Mekuria, W. The link between agricultural production and population dynamics in Ethiopia: A review. Adv. Plants Agric. Res. 2018, 8, 348–353. [Google Scholar] [CrossRef]
  4. Tao, H.; Gemmer, M.; Song, Y.; Jiang, T. Ecohydrological responses on water diversion in the lower reaches of the Tarim River, China. Water Resour. Res. 2008, 44, W08422. [Google Scholar] [CrossRef]
  5. Liu, Q.; Dai, H.; Gui, D.W.; Hu, B.; Ye, M.; Wei, G.; Qin, J.; Zhang, J. Evaluation and optimization of the water diversion system of ecohydrological restoration megaproject of Tarim River, China, through wavelet analysis and a neural network. J. Hydrol. 2022, 608, 127586. [Google Scholar] [CrossRef]
  6. Fang, G.; Chen, Y.; Li, Z. Variation in agricultural water demand and its attributions in the arid Tarim River Basin. J. Agric. Sci. 2018, 156, 301–311. [Google Scholar] [CrossRef]
  7. Hao, Z.; Chen, S.; Li, Z.; Yu, Z.; Shao, Q.; Yuan, F.; Shi, F. Quantitative assessment of the impacts of irrigation on surface water fluxes in the Tarim River, China. Hydrol. Res. 2015, 46, 996–1007. [Google Scholar] [CrossRef]
  8. Duethmann, D.; Bolch, T.; Farinotti, D.; Kriegel, D.; Vorogushyn, S.; Merz, B.; Pieczonka, T.; Jiang, T.; Su, B.; Guntner, A. Attribution of streamflow trends in snow and glacier melt-dominated catchments of the Tarim River, Central Asia. Water Resour. Res. 2015, 51, 4727–4750. [Google Scholar] [CrossRef] [Green Version]
  9. Liu, S. The contemporary glaciers in China based on the Second Chinese Glacier Inventory. Acta Geogr. Sin. 2015, 70, 3–16. [Google Scholar]
  10. Guo, W.; Xu, J.; Liu, S.; Shangguan, D.; Wu, L.; Yao, X.; Zhao, J.; Liu, Q.; Jiang, Z.; Li, P.; et al. The Second Glacier Inventory Dataset of China (Version 1.0). Cold Arid Reg. Sci. Data Cent. Lanzhou 2014. [Google Scholar] [CrossRef]
  11. Huang, M.; Wortmann, D.; Duethmann, C.; Menz, F.Z.; Shi, C.Y.; Krysanova, V. Adaptation strategies of agriculture and water management to climate change in the Upper Tarim River basin, NW China. Agric. Water Manag. 2018, 203, 207–224. [Google Scholar] [CrossRef]
  12. Wang, F.; Chen, Y.; Li, Z.; Fang, G.; Li, Y.; Xia, Z. Assessment of the Irrigation Water Requirement and Water Supply Risk in the Tarim River Basin, Northwest China. Sustainability 2019, 11, 4941. [Google Scholar] [CrossRef] [Green Version]
  13. Li, Y.; Wang, H.; Chen, Y.; Deng, M.; Li, Q.; Wufu, A.; Wang, D.; Ma, L. Estimation of regional irrigation water requirements and water balance in Xinjiang, China during 1995–2017. PeerJ 2020, 8, e8243. [Google Scholar] [CrossRef] [PubMed] [Green Version]
  14. Yu, Y.; Disse, M.; Yu, R.; Yu, G.; Sun, L.; Huttner, P.; Rumbaur, C. Large-scale hydrological modeling and decision-making for agricultural water consumption and allocation in the main stem Tarim River, China. Water 2015, 7, 2821. [Google Scholar] [CrossRef] [Green Version]
  15. Wei, G.; Gui, D.; Zhao, X. Irrigation area carrying capacity in Tarim River Basin in different years. Arid Land Geogr. 2018, 41, 230–237. [Google Scholar]
  16. Guo, H.; Xu, H.; Zhao, X. Discussion on the maximum irrigation area and overload situation in Tarim River Basin. J. Sun Yat-Sen Univ. (Nat. Sci. Ed.) 2017, 56, 140–150. [Google Scholar]
  17. Zhang, P.; Chen, C.; Xu, H. The bearable largest irrigation area in the basins of nine source streams and ma- instream of the Tarim River. Arid Zone Res. 2017, 34, 223–231. [Google Scholar]
  18. Duethmann, D.; Menz, C.; Jiang, T.; Vorogushyn, S. Projections for headwater catchments of the Tarim River reveal glacier retreat and decreasing surface water availability but uncertainties are large. Environ. Res. Lett. 2016, 11, 054024. [Google Scholar] [CrossRef] [Green Version]
  19. Liu, Z.F.; Xu, Z.X.; Fu, G.B.; Yao, Z.J. Assessing the hydrological impacts of climate change in the headwater catchment of the Tarim River basin, China. Hydrol. Res. 2013, 44, 834–849. [Google Scholar] [CrossRef]
  20. Yang, P.; Xia, J.; Zhang, Y.Y.; Zhan, C.S.; Sun, S.X. How is the risk of hydrological drought in the Tarim River Basin, Northwest China? Sci. Total Environ. 2019, 693, 133555. [Google Scholar] [CrossRef]
  21. Hao, X.M.; Li, W.D.; Huang, X.; Zhu, C.G.; Ma, J.X. Assessment of the groundwater threshold of desert riparian forest vegetation along the middle and lower reaches of the Tarim River, China. Hydrol. Processes 2010, 24, 178–186. [Google Scholar] [CrossRef]
  22. Liu, J. Remote sensing monitoring dataset of land use status in six provinces in western China for many years (1970s, 1980s, 1995, 2000, 2005, 2010, 2015). Natl. Tibet. Plateau Data Cent. 2019. [CrossRef]
  23. Gou, S.; Zhang, X.; Wang, Y.; Gong, W.; Wang, Y.; Deng, M.; Mao, W.; Wang, S. Analysis on runoff volumes, water quality and water consumption of the Tarim River in recent 50 years. Arid Zone Res. 2010, 27, 861–870. [Google Scholar]
  24. O’Neill, B.C.; Tebaldi, C.; van Vuuren, D.P.; Eyring, V.; Friedlingstein, P.; Hurtt, G.; Knutti, R.; Kriegler, E.; Lamarque, J.F.; Lowe, J.; et al. The Scenario Model Intercomparison Project (ScenarioMIP) for CMIP6. Geosci. Model Dev. 2016, 9, 3461–3482. [Google Scholar] [CrossRef] [Green Version]
  25. Thrasher, B.; Wang, W.; Michaelis, A.; Nemani, R. NEX-GDDP-CMIP6. NASA Center for Climate Simulation. 2021. Available online: https://www.nccs.nasa.gov/services/data-collections/land-based-products/nex-gddp-cmip6 (accessed on 12 December 2021).
  26. Szidarovszky, F.; Coppola, E.; Long, J.; Hall, A.; Poulton, M. A hybrid artifcial neural network-numerical model for groundwater problems. Groundwater 2007, 45, 590–600. [Google Scholar] [CrossRef] [PubMed]
  27. LeCun, Y.; Bengio, Y.; Hinton, G. Deep Learning. Nature 2015, 521, 436–444. [Google Scholar] [CrossRef] [PubMed]
  28. Lin, T.; Horne, B.G.; Tino, P.; Giles, C.L. Learning long-term dependencies in NARX recurrent neural networks. IEEE Trans. Neural Netw. Learn. Syst. 1996, 7, 1424–1438. [Google Scholar]
  29. Guzman, S.M.; Paz, J.O.; Tagert, M.L.M. The Use of NARX Neural Networks to Forecast Daily Groundwater Levels. Water Resour Manag. 2017, 31, 1591–1603. [Google Scholar] [CrossRef]
  30. Chang, F.J.; Tsai, Y.H.; Chen, P.A.; Coynel, A.; Vachaud, G. Modeling water quality in an urban river using hydrological factors-data driven approaches. J. Environ. Manag. 2015, 151, 87–96. [Google Scholar] [CrossRef]
  31. Wunsch, A.; Liesch, T.; Broda, S. Groundwater level forecasting with artificial neural networks: A comparison of long short-term memory (LSTM), convolutional neural networks (CNNs), and non-linear autoregressive networks with exogenous input (NARX). Hydrol. Earth Syst. Sci. 2021, 25, 1671–1687. [Google Scholar] [CrossRef]
  32. Nash, J.E.; Sutcliffe, J.V. River Flow Forecasting through Conceptual Model. Part 1—A Discussion of Principles. J. Hydrol. 1970, 10, 282–290. [Google Scholar] [CrossRef]
  33. Yu, Y.; Yu, R.D.; Chen, X.; Yu, G.A.; Gan, M.; Disse, M. Agricultural water allocation strategies along the oasis of Tarim River in Northwest China. Agric. Water Manag. 2017, 187, 24–36. [Google Scholar] [CrossRef]
  34. Song, Y.D.; Fan, Z.L.; Lei, Z.D. Research on Water Resources and Ecology of Tarim River, China; Xinjiang People’s Press: Urumqi, China, 1999; pp. 398–418. (In Chinese) [Google Scholar]
  35. Qi, F.; Wei, L.; Jianhua, S. Environmental effects of water resource development and use in the Tarim River basin of northwestern China. Environ. Geol. 2005, 48, 202–210. [Google Scholar] [CrossRef]
  36. Zhao, R.; Chen, Y.; Shi, P. Land use and land cover change and driving mechanism in the arid inland river basin: A case study of Tarim River, Xinjiang, China. Environ. Earth Sci. 2013, 68, 591–604. [Google Scholar] [CrossRef]
  37. Ling, H.; Zhang, P.; Xu, H.; Zhang, G. Determining the ecological water allocation in a hyper-arid catchment with increasing competition for water resources. Glob. Planet. Chang. 2016, 145, 143–152. [Google Scholar] [CrossRef]
  38. Chen, C.; Pang, Y.M.; Pan, X.B. Variation characteristics of water requirement of cotton in China during 1961–2012. J. Nat. Resour. 2015, 30, 2108–2119. [Google Scholar]
  39. Zhao, J.; Wang, Z. Future trends of water resources and influences on agriculture in China. PLoS ONE 2020, 15, e0231671. [Google Scholar] [CrossRef]
  40. Thapa, S.; Zhao, Z.; Li, B.; Lu, L.; Fu, D.; Shi, X.; Tang, B.; Qi, H. Snowmelt-Driven Streamflow Prediction Using Machine Learning Techniques (LSTM, NARX, GPR, and SVR). Water 2020, 12, 1734. [Google Scholar] [CrossRef]
  41. Uysal, G.; Şensoy, A.; Şorman, A.A. Improving daily streamflowforecasts in mountainous upper euphrates basin by multi-layer per-ceptron model with satellite snow products. J. Hydrol. 2016, 543, 630–650. [Google Scholar] [CrossRef]
  42. Rasouli, K.; Hsieh, W.; Cannon, A. Daily streamflow forecasting by machine learning methods with weather and climate inputs. J. Hydrol. 2012, 414–415, 284–293. [Google Scholar] [CrossRef]
  43. Tao, H.; Gemmer, M.; Bai, Y.; Su, B.; Mao, W. Trends of streamflow in the Tarim river basin during the past 50 years: Human impact or climate change? J. Hydrol. 2011, 400, 1–9. [Google Scholar] [CrossRef]
  44. Chen, Y.N.; Takeuchi, K.; Xu, C.; Chen, Y.P.; Xu, Z.X. Regional climate change and its effects on river runoff in the Tarim Basin, China. Hydrol. Processes 2006, 20, 2207–2216. [Google Scholar] [CrossRef]
  45. Xu, Z.; Chen, Y.; Li, J. Impact of climate change on water resources in the Tarim River Basin. Water Resour. Manag. 2004, 18, 439–458. [Google Scholar] [CrossRef]
  46. Xu, C.C.; Chen, Y.; Li, W.H.; Chen, Y. Climate change and hydrologic process response in the Tarim River Basin over the past 50 years. Chin. Sci. Bull. 2006, 51, 25–36. [Google Scholar] [CrossRef]
  47. Shi, Y. Study on future runoff changes in Tarim River basin based on GCM model. Glob. Seabuckthorn Res. Dev. 2020, 5, 338. [Google Scholar]
  48. Xiang, Y.; Wang, Y.; Chen, Y.; Zhang, Q. Impact of Climate Change on the Hydrological Regime of the Yarkant River Basin, China: An Assessment Using Three SSP Scenarios of CMIP6 GCMs. Remote Sens. 2022, 14, 115. [Google Scholar] [CrossRef]
  49. Cheng, G.D.; Li, X.; Zhao, W.Z.; Xu, Z.M.; Feng, Q.; Xiao, S.C.; Xiao, H.L. Integrated study of the water–ecosystem–economy in the Heihe River Basin. Natl. Sci. Rev. 2014, 1, 413–428. [Google Scholar] [CrossRef] [Green Version]
  50. Chunyu, X.Z.; Huang, F.; Xia, Z.Q.; Zhang, D.R.; Chen, X.; Xie, Y.Y. Assessing the Ecological Effects of Water Transport to a Lake in Arid Regions: A Case Study of Qingtu Lake in Shiyang River Basin, Northwest China. Int. J. Environ. Res. Public Health 2019, 16, 145. [Google Scholar] [CrossRef] [Green Version]
  51. Huang, S.; Krysanova, V.; Zhai, J. Impact of Intensive Irrigation Activities on River Discharge Under Agricultural Scenarios in the Semi-Arid Aksu River Basin, Northwest China. Water Resour Manag. 2015, 29, 945–959. [Google Scholar] [CrossRef]
  52. Motlagh, Z.K.; Lotfi, A.; Pourmanafi, S.; Ahmadizadeh, S.; Soffianian, A. Spatial modeling of land-use change in a rapidly urbanizing landscape in central Iran: Integration of remote sensing, CA-Markov, and landscape metrics. Environ. Monit. Assess. 2020, 192, 695. [Google Scholar] [CrossRef]
Figure 1. The study area of the Tarim River Basin, including digital elevation model (DEM), hydrological stations, and locations of the upper three tributaries (i.e., Aksu, Yarkant, and Hotan Rivers) and the mainstream.
Agriculture 12 00657 g001
Figure 2. Scheme of the training and application processes of the neural network model. d y and d x are the output and input memory orders, respectively. W and b are the weight and bias, respectively.
Agriculture 12 00657 g002
Figure 3. Spatial distribution of the irrigated land, natural vegetation, and other areas in the upstream, midstream, and downstream of the Tarim River Basin between (af) 1970 and 2020.
Agriculture 12 00657 g003
Figure 4. Area of irrigated land in the (a) mainstream, (b) upstream, (c) midstream, and (d) downstream of the Tarim River Basin between 1970 and 2020. Red indicates the positive variation and blue indicates the negative variation in the irrigation area. The y-axis represents the decades and the x-axis is the irrigation area.
Agriculture 12 00657 g004
Figure 5. Transition matrix of land use and land cover changes from 1970 to 2020 in the (a) upstream, (b) midstream, and (c) downstream of the Tarim River Basin. This diagram shows how the area is transformed before becoming farmland, natural vegetation, or other areas; supplies are on the left, and demands are on the right, where the width of each flow pictured is based on its quantity.
Agriculture 12 00657 g005
Figure 6. The comparison of the observed and simulated runoff at Alar station in the upper Tarim River Basin for the training, validation, and testing periods of the NARX network. The black indicates the observation, the orange indicates the training result, the green indicates the validation result, and the blue indicates the test result.
Agriculture 12 00657 g006
Figure 7. Changes in annual (a) precipitation and (b) temperature under future climate scenarios SSP245 and SSP585 in the headstream of the Tarim River Basin compared with the values in the reference period from 1957 to 2017.
Agriculture 12 00657 g007
Figure 8. (a) Annual available water resources and their probability density functions (PDFs) in the Alar station of the upper Tarim River from 2022 to 2050 simulated by the NARX model under future climate scenarios SSP245 and SSP585. (b) Changes in annual available water resources in the Alar station of the upper Tarim River Basin compared with the values in the reference period from 1957 to 2017 under future climate scenarios SSP245 and SSP585.
Agriculture 12 00657 g008
Figure 9. Annual available irrigation areas in the mainstream of the Tarim River from 2022 to 2050 under future climate scenarios SSP245 and SSP585.
Agriculture 12 00657 g009
Publisher’s Note: MDPI stays neutral with regard to jurisdictional claims in published maps and institutional affiliations.

