Article

Scientific Irrigation Scheduling for Sustainable Production in Olive Groves

1
Department of Agricultural Engineering, Barani Agricultural Research Institute, Chakwal 48800, Pakistan
2
Department of Agricultural Engineering, Faculty of Agricultural Sciences & Technology, Bahauddin Zakariya University, Multan 60800, Pakistan
3
Department of Engineering for Crop Production, Leibniz Institute for Agricultural Engineering and Bioeconomy, 14469 Potsdam, Germany
4
Department of Biochemistry, College of Science, King Saud University, Riyadh 11451, Saudi Arabia
5
Department of Agriculture Technology, Faculty of Agriculture, Universiti Putra Malaysia, Serdang 43400, Malaysia
*
Authors to whom correspondence should be addressed.
Agriculture 2022, 12(4), 564; https://doi.org/10.3390/agriculture12040564
Submission received: 13 February 2022 / Revised: 11 April 2022 / Accepted: 12 April 2022 / Published: 15 April 2022
(This article belongs to the Special Issue Water-Saving Irrigation Technology and Strategies for Crop Production)

Abstract

:
The present study aimed at investigating scientific irrigation scheduling (SIS) for the sustainable production of olive groves. The SIS allows farmers to schedule water rotation in their fields to abate crop water stress and maximize yields, which could be achieved through the precise monitoring of soil moisture. For this purpose, the study used three kinds of soil moisture sensors, including tensiometer sensors, irrometer sensors, and gypsum blocks for precise measurement of the soil moisture. These soil moisture sensors were calibrated by performing experiments in the field and laboratory at Barani Agricultural Research Institute, Chakwal in 2018 and 2019. The calibration curves were obtained by performing gravimetric analysis at 0.3 and 0.6 m depths, thereby equations were developed using regression analysis. The coefficient of determination (R2) at 0.3 and 0.6 m depth for tensiometer, irrometer, and gypsum blocks was found to be equal to 0.98, 0.98; 0.75, 0.89; and 0.82, and 0.95, respectively. After that, a drip irrigation system was installed with the calibrated soil moisture sensors at 0.3 and 0.6 m depth to schedule irrigation for production of olive groves as compared to conventional farmer practice, thereby soil moisture profiles of these sensors were obtained to investigate the SIS. The results showed that the irrometer sensor performed as expected and contributed to the irrigation water savings between 17% and 25% in 2018 and 2019, respectively, by reducing the number of irrigations as compared toother soil moisture sensors and farmer practices. Additionally, olive yield efficiencies of 8% and 9%were observed by the tensiometer in 2018 and 2019, respectively. The outcome of the study suggests that an effective method in providing sustainable production of olive groves and enhancing yield efficiency.

1. Introduction

Water scarcity is one of the most challenging problems throughout the globe due to increase in population and climate change. Water management and improved water use efficiency are valuable solutions for preserving water resources, particularly in irrigated agriculture because it consumes an excessive amount of water [1,2]. Improving irrigation efficiency may save a significant amount of water that could be used to irrigate a larger area [3,4,5]. The irrigation efficiency could improve by adopting scientific irrigation scheduling(SIS),i.e., the process of investigating the optimum quantity and timing of water application to attain the required crop yield and quality, decrease possible adverse effects on the environment such as nutrient leaching below the plant root zone, and maximize water conservation [6] SIS is very crucial for sustainable agricultural practices when water for irrigation faces uncertainties and less water availability in particular regions [7,8,9,10]. However, SIS depends on weather conditions, soil type, crop type, management practices, the moisture content status of the soil, and the water supply system [11,12].
Olive is a drought tolerant crop that is often planted in Mediterranean climates with annual rainfall of >350 mm. Despite its reputation as a dry-farming crop, olive needs an additional amount of water besides the rainfall water [13,14] Olive contributes to meet the demand for olive oil in Pakistan, but olive oil worth $6.63 million per year is still imported [15]. A major portion of Pakistan’s land is suitable for olive production and details of the potential areas are available in reference [16]. However, the reference is not an academic website and thus the suitability of areas for olive production may vary. Olive production could be enhanced in areas having less water availability by adopting the appropriate irrigation scheduling to minimize water consumption in terms of irrigation requirements [17,18]. Conventional irrigation practices are unaffordable and not accessible to remote areas where the crop production is limited solely by a lack of irrigation water availability [19]. Furthermore, the evapotranspiration method has some drawbacks of not accounting for any conceivable differences among expected and actual consumption values due to specific region conditions and interannual fluctuations in crop growth patterns [20,21].
In this regard, SIS uses soil moisture sensors for appropriate measurement of soil moisture status [22,23]. The soil moisture sensors provide precise knowledge of the soil moisture status, which helps the irrigator in deciding when to irrigate and how much to irrigate, and it ultimately averts the risk of water stress or overwatering [10,24]. A study in the literature reported that this type of irrigation practice can save about 33% of water without affecting crop yield [25]. These sensors must be calibrated for effective use in the measurement of soil moisture status [26,27,28,29]. However, one of the main hindrances to the use of soil moisture sensors is their calibration and installation in the field. A well-calibrated soil moisture sensor can measure the soil moisture, which can help in deciding how much and when to irrigate the specific crop. The knowledge of soil moisture is important to fulfill the crop water requirements; however, conventional practices being adopted by farmers could not provide such information in their field, and therefore they obtain less crop production because of lower water supply or very high water supply [30].
The soil moisture sensor probes can be interfaced with standard Internet of Things (IoT) sensing and control systems such as the one shown in Figure 1 that has been developed by Adaptive AgroTech, providing internet access to the collected data, as well as for controlling the irrigation pumps in real-time. The IoT is an emerging paradigm that allows wireless communication among electronic or smart devices and sensors via the Internet [31,32]. These smart devices in IoT systems improve data collection, automation, and remote control capability as well as flexibility [33]. The WiFi soil moisture datalogger shown in Figure 1b makes possible the monitoring of the soil moisture measurement, while at the same time the data are transferred to a secure cloud server for IoT monitoring. It should be noted that implementation of IoT nodes in large-scale farms requires several infrastructures, including multiple wireless local area networks, which is limited or not affordable to the majority of farmers for SIS in developing countries such as Pakistan. In the present study, the SIS for olive production was calculated using three types of soil moisture sensors, including a tensiometer, an irrometer, and gypsum blocks, considering farmers’ affordability in Pakistan. The purpose of SIS is to minimize water use and enhance the yield efficiency of olive as compared to conventional farmer practices.

2. Materials and Methods

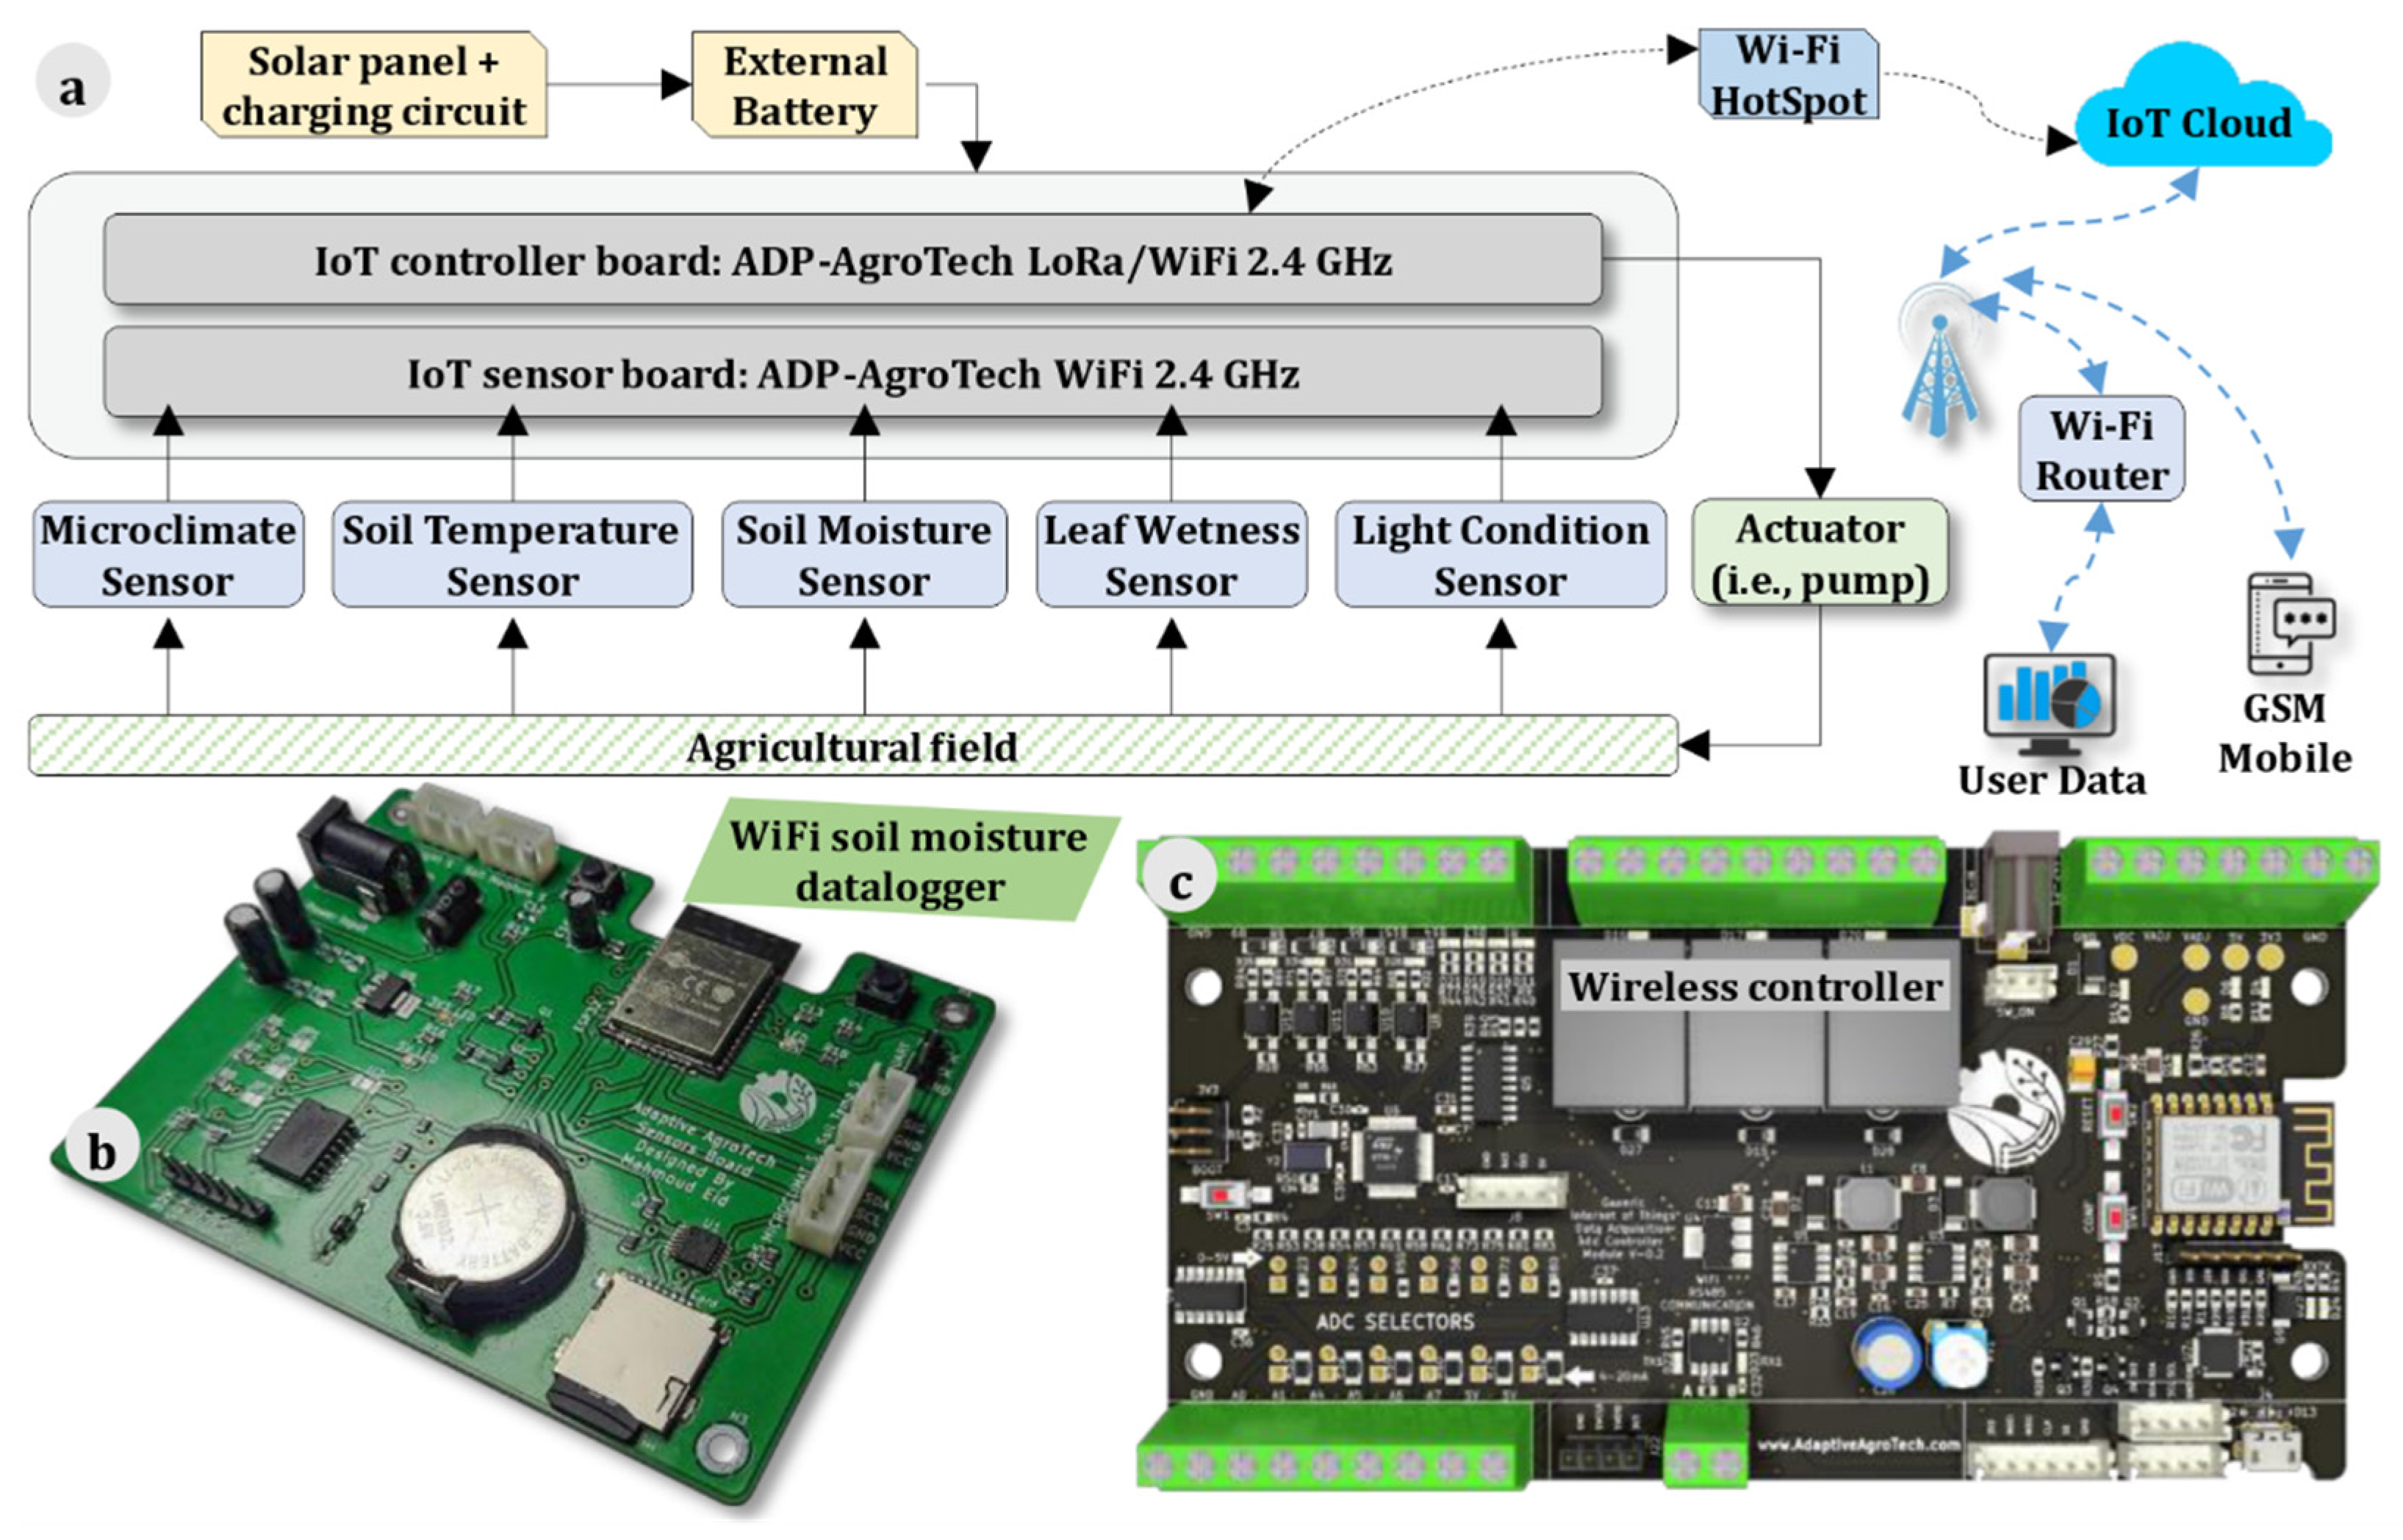
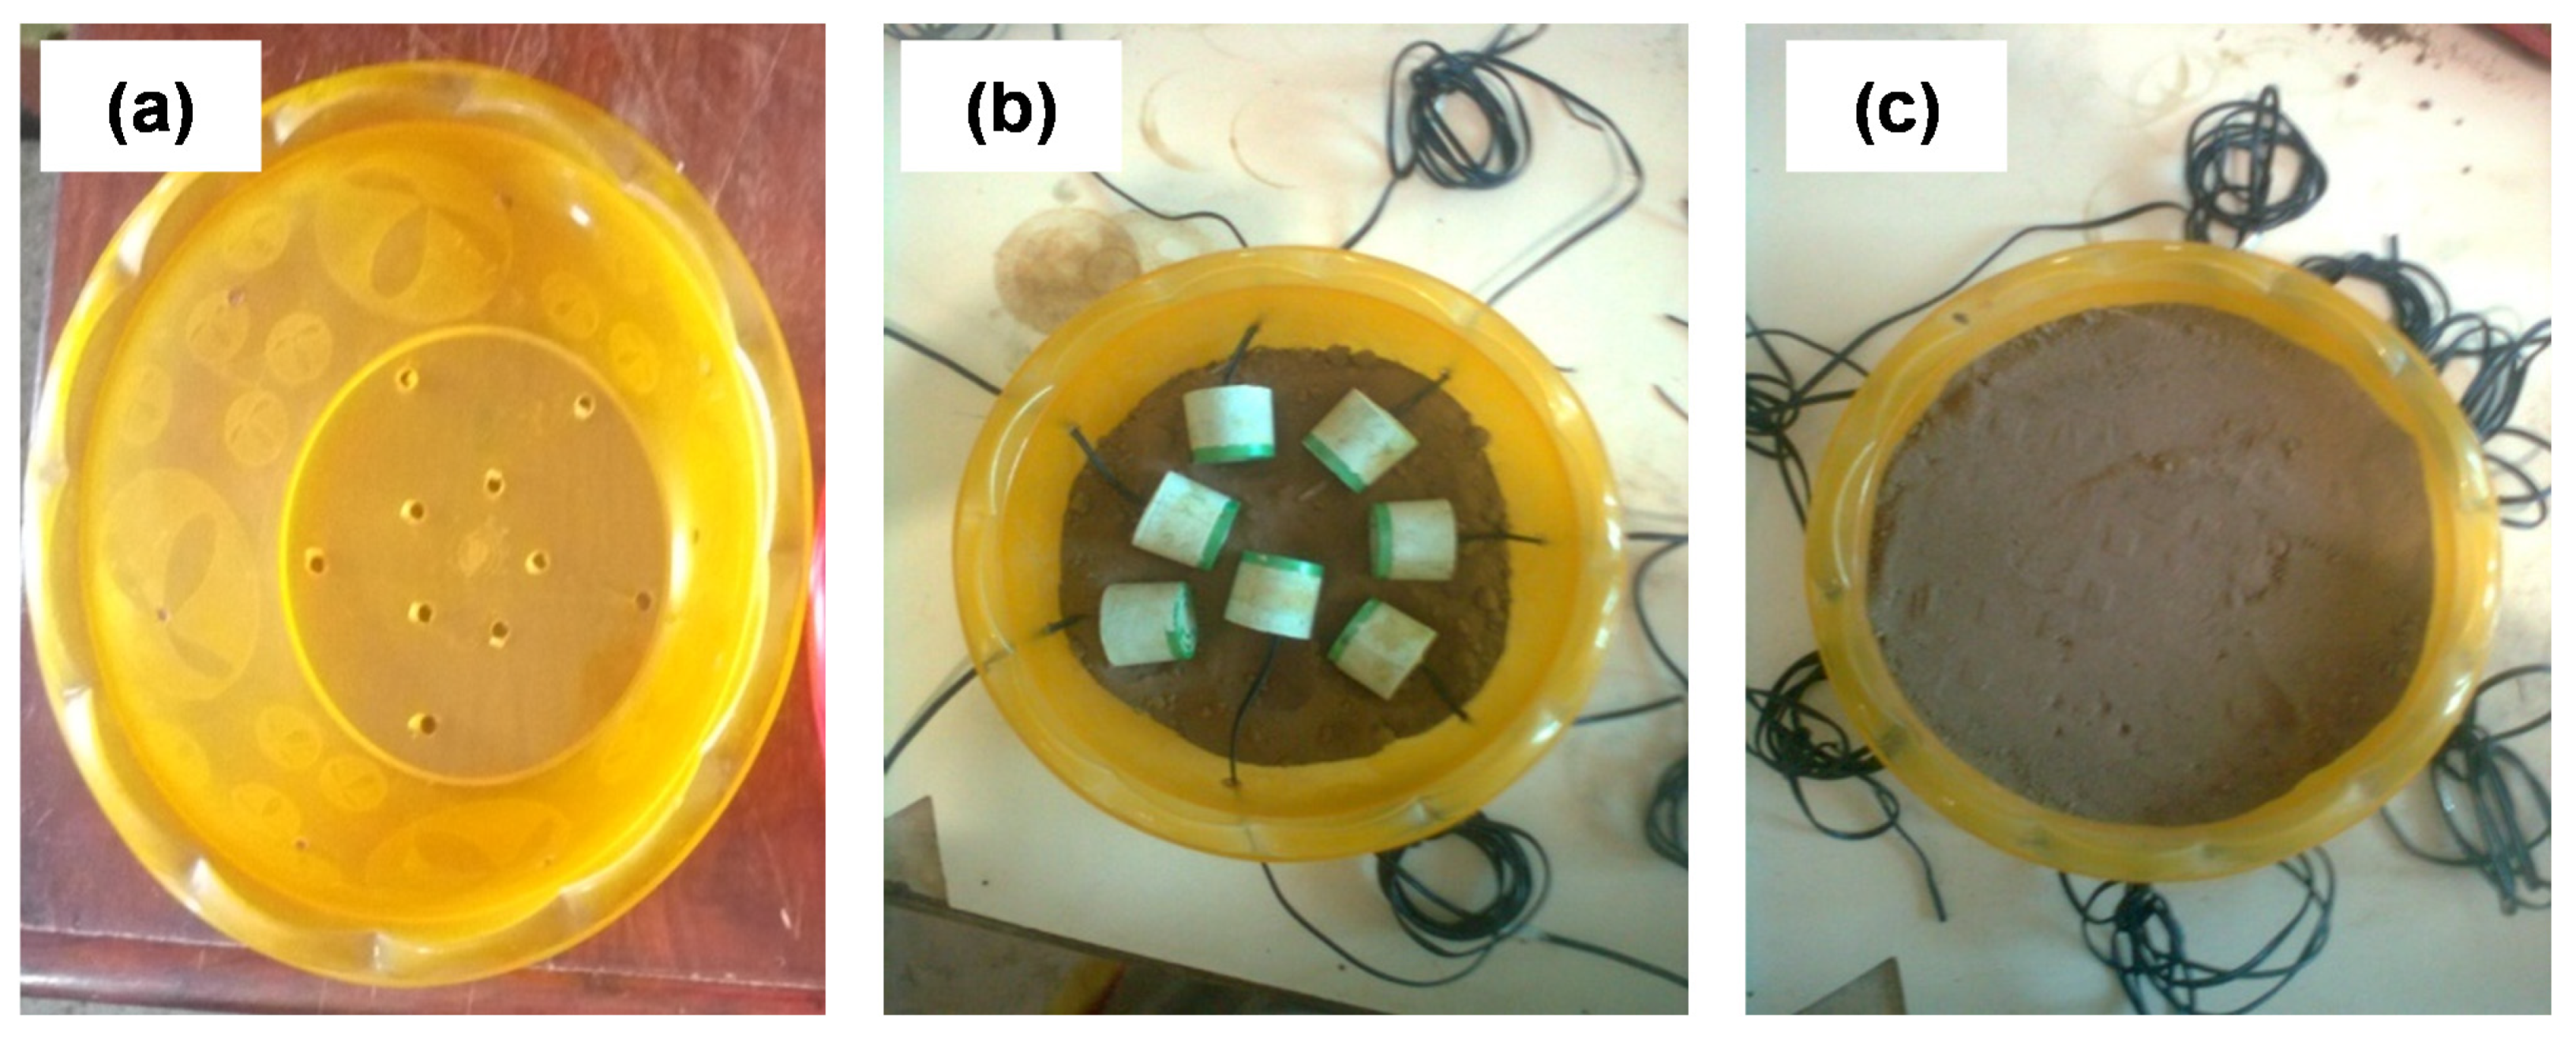
2.1. Soil Moisture Measurement Tools

The soil moisture measurement is a crucial parameter for SIS. In this study, a tensiometer (Zhejiang Top Cloud-Agri Technology Co., Ltd., Hangzhou, China),an irrometer (Irrometer Co., Inc., Riverside, CA, USA),and gypsum blocks (Shandong Wanzhuang Building Materials Co., Ltd., Qingdao China)were installed to measure soil moisture. Calibration curves were provided by the manufacturers of the sensors, but these curves were according to their specific conditions. Therefore, it is necessary to recalibrate these sensors and draw calibration curves according to the studied soil type [34]. The soil moisture sensors were calibrated by performing experiments in the field and laboratory at Barani Agricultural Research Institute, Chakwal in 2018 and 2019. The calibration curves were obtained by performing gravimetric analysis at 0.3 and 0.6 m depths, thereby equations were developed using regression analysis.
A tensiometer contains a porous cup, primarily made of ceramics with very fine pores, that is attached to a negative pressure gauge by a water-filled plastic tube. At measurement depth, the porous cup is positioned in close contact with bulk soil. Water travels downwards from the tensiometer by following a potential energy gradient to the soil via the saturated porous cup owing to the vacuum pressure of the gauge. The water flows into the soil and continues until the suction inside the tensiometer equals the metric potential of the soil. When the soil is wet, the flow might go in the opposite direction, with soil water entering the tensiometer until a new equilibrium is reached. Figure 2 shows the working scheme of the tensiometer sensor. The measurement range of the tensiometer sensor used in this study was varied between0 to 80 cbars. The tensiometer sensors were soaked in water for 24 h for their saturation to protect the ceramic cups from drying while taking them to the installation site. Two deep holes of 0.3 and 0.6 m were drilled using a soil sampler. A creamy soil water slurry was prepared and poured into the dug holes. The ceramic cups made good contact with soil once they were placed into the soil hole. The soil was filled around the tensiometer to avoid water drainage. Prior to the measured soil moisture readings, it is necessary to first calibrate the sensor gravimetrically. We used a user-friendly color marking system on the tensiometer sensor, in which the blue area indicates the soil is wet and there is no need for irrigation, the green area indicates the moisture in the soil is appropriate and can fulfill crop water requirements, and the yellow area indicates the soil is dry and there is a need for irrigation to the crop. In this regard, calibration curves were drawn between tensiometer readings and measured gravimetric readings at 0.3 and 0.6 m depths.
An irrometer sensor is made up of a porous ceramic external shell encased in a synthetic membrane covered by stainless steel casing and an internal matrix structure with two electrodes. The irrometer sensor works on the principle of electrical resistance sensors and displays moisture changes with variation of soil resistance. As water conditions in the surrounding soil vary, the water conditions under the irrometer sensor fluctuate as well. Electrical resistance differences between two implanted electrodes in the sensor reflect these changes within the sensor. The measurement range of the irrometer sensors used in this study were up to 200 cbars, thereby allowing them to work in drier soils. Prior to installation, the irrometer sensors were soaked in water for 24 hours because it removes air from the sensors. The sensors were attached to a half-inch PVC pipe that was split into two lengths and installed at two depths of 0.3 and 0.6 m. The sensors were inserted into PVC pipes, and the soil water slurry process was repeated for better contact. The hole was backfilled with soils, the top of the PVC pipe was closed with cork, and the cable was run out the top of the pipe. The field calibration was performed by taking samples gravimetrically close to the buried sensors and relating moisture contents of the sample to the measured value of soil tension shown on the handheld meter screen.
A gypsum block is made of a gypsum cylindrical block, into which two electrodes are implanted. As the soil wets and dries, the porous gypsum allows water to enter and exit the block. The gypsum blocks measure water content in terms of soil resistance. Each gypsum block was calibrated in the lab before installation in the field. For calibration, the authors took a plastic bowl of 8-inch diameter with 7 holes around the walls and 9–10 holes at the bottom of the bowl for drainage purposes, as shown in Figure 3a. The gypsum blocks were soaked in water for 24 hours to saturate them. The authors then measured the weight of the empty bowl and each gypsum block separately. The authors half-filled the bowl with a known weight of dry soil, and then placed the gypsum blocks in the bowl, as shown in Figure 3b. After that, the authors poured the known weight of dry soil into the bowl to cover the gypsum blocks, as shown in Figure 3c. The authors measured the dry weight of the soil and noted the reading of gypsum blocks with the help of a resistivity meter. After that, the authors added water slowly into the soil bowl from the top to make it wet but not saturated and turned on a fan. The authors weighed the dried soil bowl, subtracted the weight of gypsum blocks from it to calculate moisture contents in percentage (as the weight of dry soil was noted before). The same procedure was repeated for three days and data of moisture contents (%) and resistance (kΩ) were collected. The soil moisture sensors could provide promising results for efficient and sustainable production.

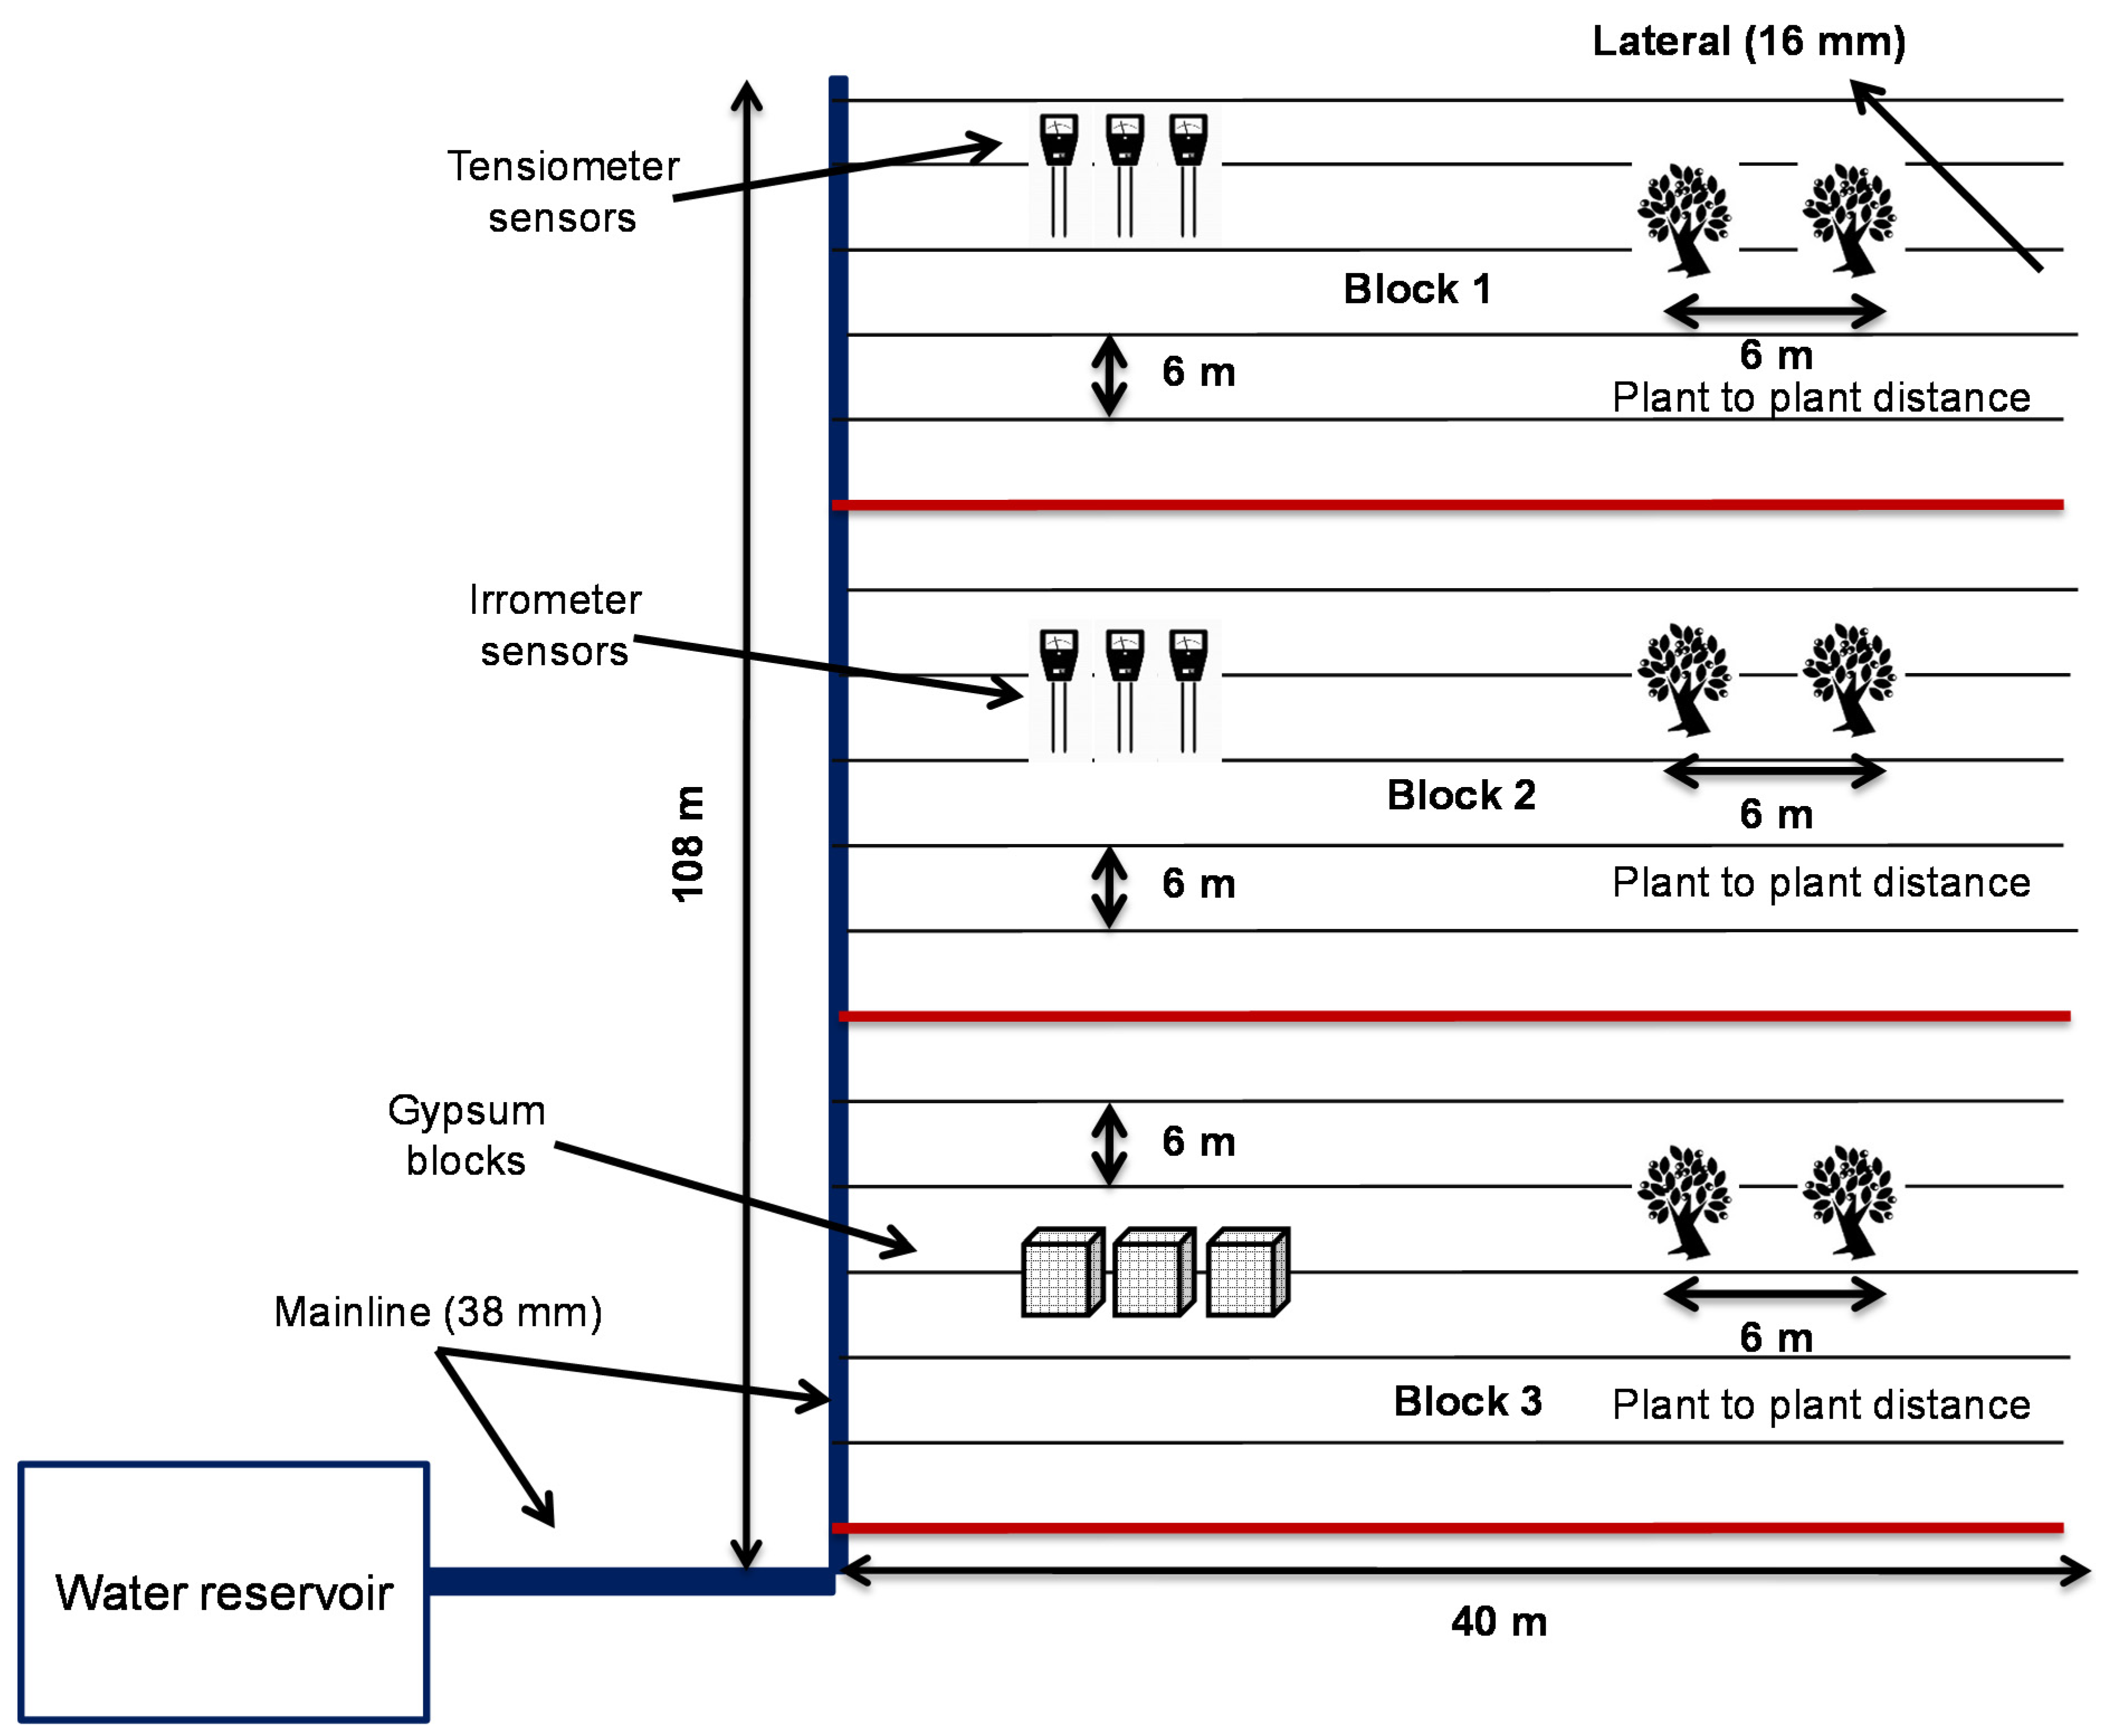
2.2. Site Description and Experimental Layout

Experiments regarding the SIS were performed on the olive variety BARI Zaitoon 1using the aforementioned soil moisture sensors at Barani Agricultural Research Institute (BARI), Chakwal District, at 72° longitude, 32° latitude and 575 m altitude in 2018 and 2019. Chakwal has an arid to semi-arid climate with annual rainfall ranging from 500 to 1000 mm [36]. The soil of the experimental site varied after each kilometer of distance. Prior to starting the experiments, soil analysis of the site was performed to observe and quantify the texture and saturation percentage (SP) of the proposed experimental soil. Two soil samples were taken from the experimental site after rainfall of about 7 to 14 mm to calculate the SP. These samples were air-dried for two days in natural conditions. After that, we took 250 g of dried soil samples in a beaker and added the appropriate amount of water until a paste formed that slide over a spatula. Table 1 shows the soil texture and SP of the experimental site. The soil texture of the soil was found to be sandy loam according to the classification of soil based on the SP, as shown in Table 2.
Furthermore, the field capacity of experimental site was calculated using a field method given in the literature [37]. Two 3m×3m plots were prepared in the field with depths of 0.3 and 0.6 m. We saturated this plot by applying water at about 0.3 and 0.6 m depths and covered it with a polythene sheet for accurate measurements and to avoid evaporation. Soil samples were collected after every 5 hours through soil sampler, until the moisture contents of the soil approached a constant value (i.e., moisture content at the field capacity of sandy loam soil) at each measuring depth. Table 3 shows the field capacity data of the experimental site. Additionally, Table 4 shows some physical and chemical properties of the experimental site.
A drip irrigation system was installed on the field with an area of 4320 m2. The system was divided into three blocks with six lateral lines of each block, as shown in Figure 4. The diameters of the main line and lateral line were 38 and 16 mm, respectively. Two emitters per plant were installed with a discharge capacity of 0.006 m3/hour each. The experiments were performed on 173 olive plants with a plant-to-plant distance of 6 m. The irrigation in block 1 was scheduled with tensiometer sensors, block 2 was scheduled with gypsum blocks, and block 3 was scheduled with irrometer sensors. The irrigation requirements of olive plants were calculated using CROPWAT by considering weather data of 17 years (2003 to 2019) that were collected from the weather observatory of the Soil and Water Conservation Research Institute (SAWCRI), Chakwal. Each olive tree was harvested individually using a manual method from the end of September till November. The olive yield (kg/tree) was recorded at the experimental field and at the farmer’s field. The yield efficiency was calculated using the following relationship:
Y i e l d e f f i c i e n c y = y i e l d b y s e n s o r y i e l d b y f a r m e r p r a c t i c e y i e l d b y s e n s o r 100

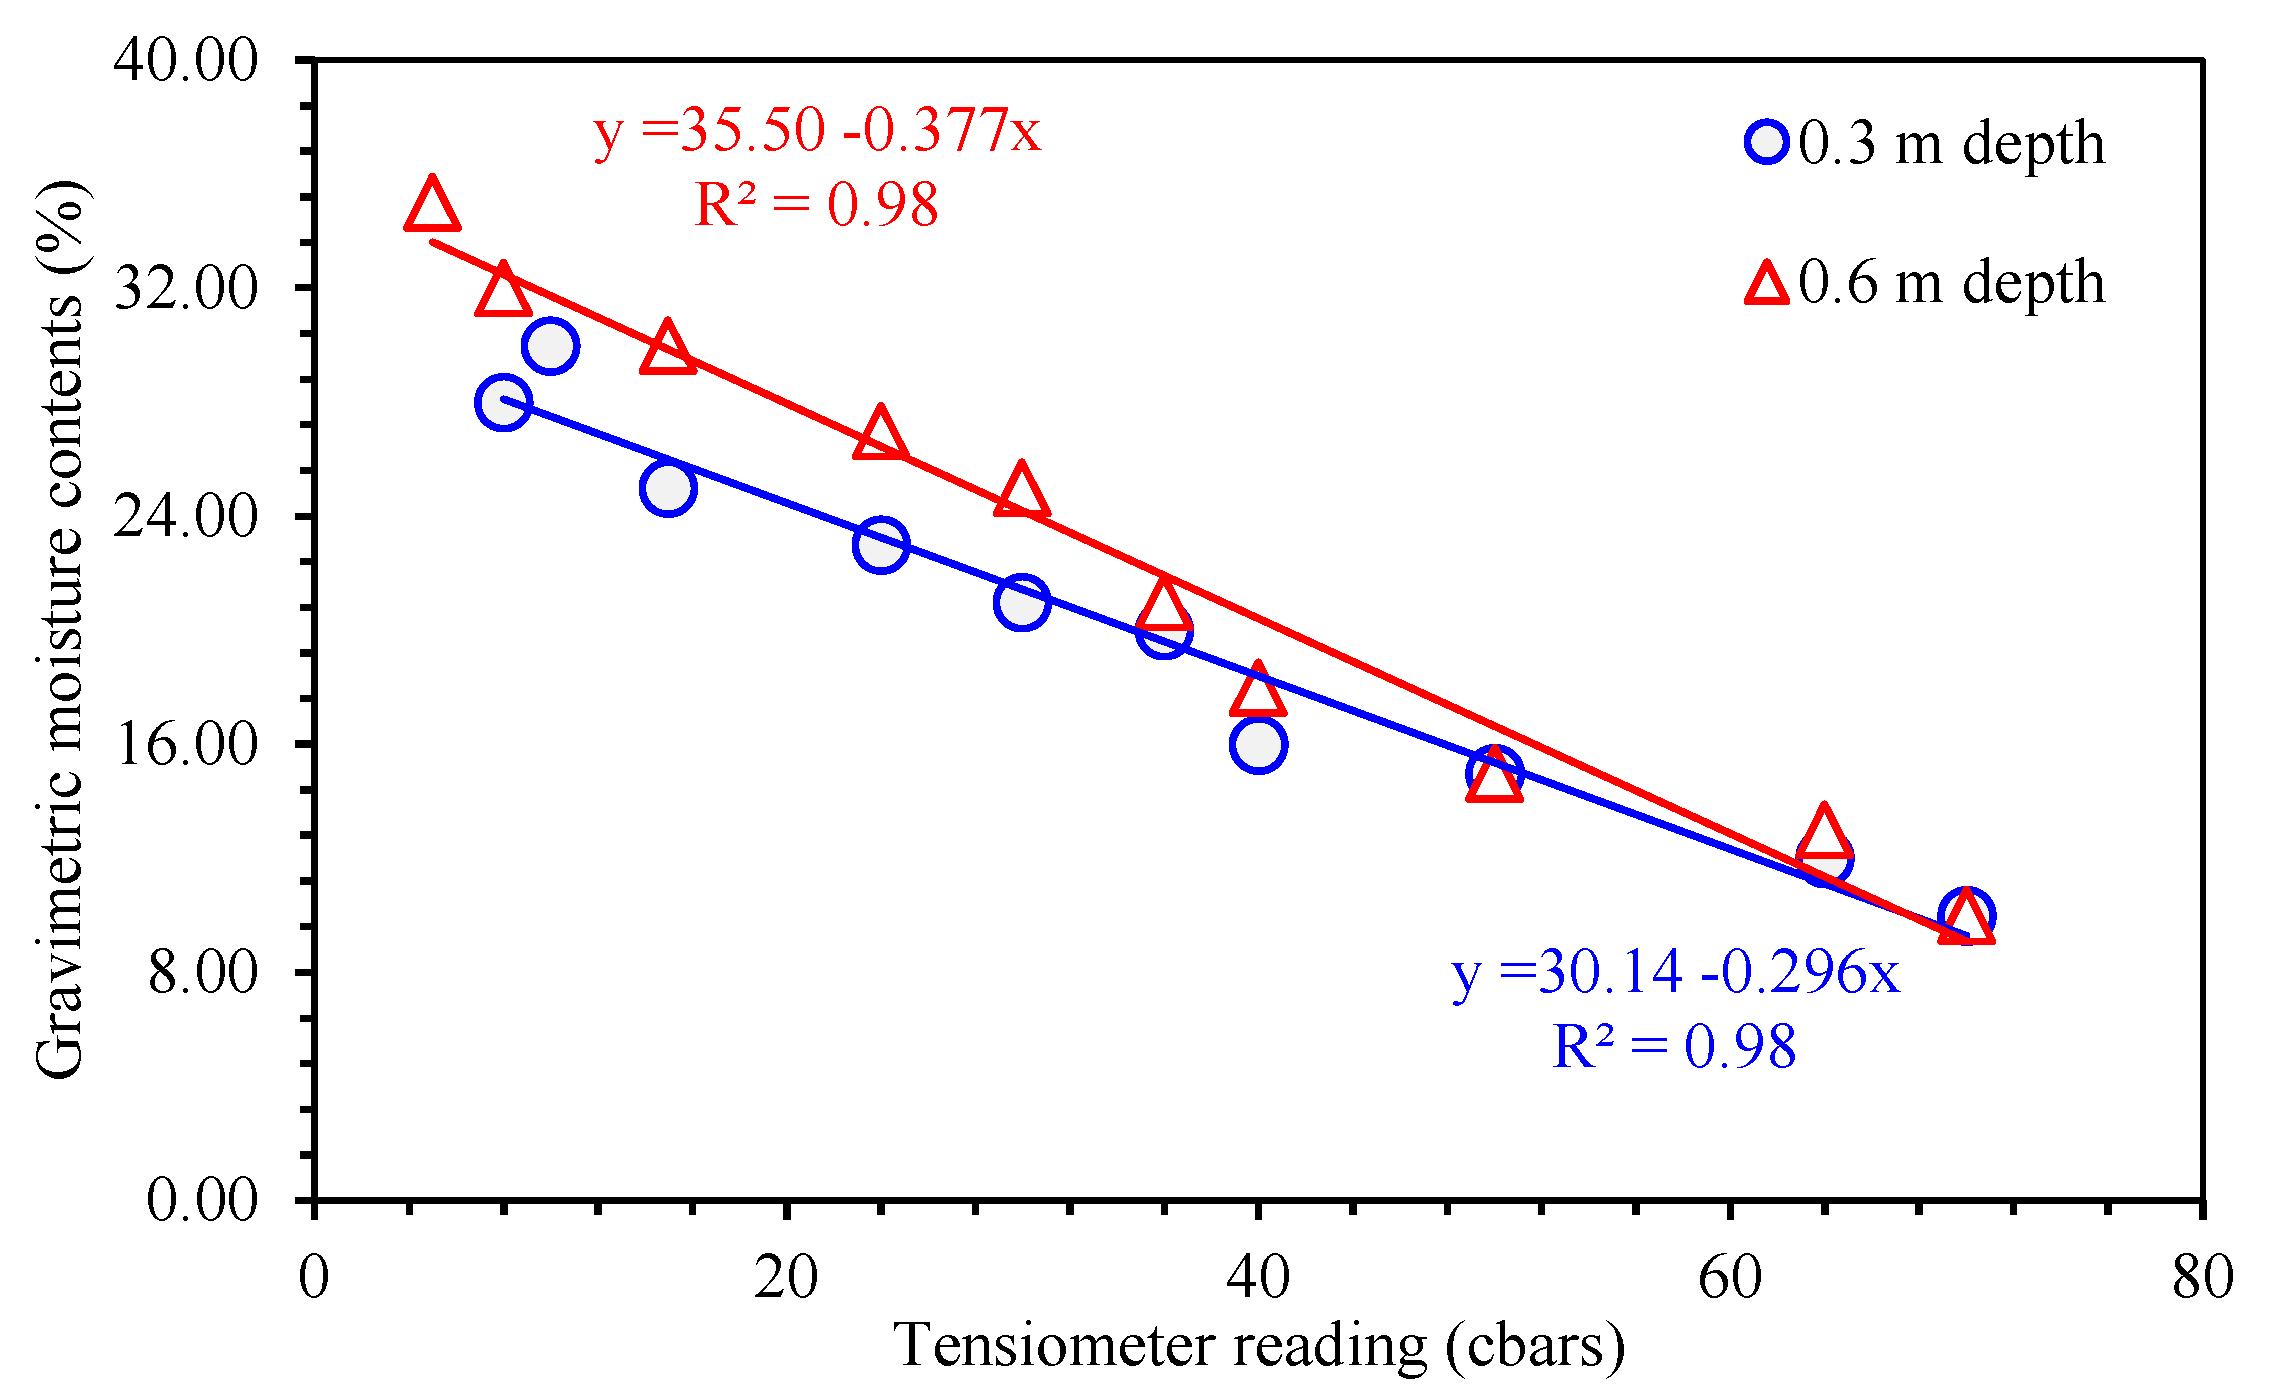
3. Results and Discussion

Soil moisture sensors were installed in three sub-plots of the experimental site at depths of 0.3 and 0.6 m from topsoil surface. To investigate the relationship between dependent, i.e., gravimetric moisture content and independent variable, i.e., readings of soil moisture sensors, a regression was used. Figure 5 shows calibration curves of tensiometer sensor (cbars) with gravimetric moisture content (%) at 0.3 and 0.6 m depths. The coefficient of determination (R2) was 0.98 for both 0.3 and 0.6 m depths. Similarly, Figure 6 shows the calibration curves of irrometer sensor (cbars) with the gravimetric moisture content (%) at 0.3 and 0.6 m depths. The coefficient of determination (R2) was observed as 0.75 and 0.89 for 0.3 and 0.6 m depths, respectively. Figure 7 shows calibration curves for the gypsum block (KΩ) with gravimetric moisture content (%) at 0.3 and 0.6 m depths. The coefficient of determination (R2) was observed as 0.82 and 0.95 for 0.3 and 0.6 m depths, respectively. Higher values of R2 were observed in deeper depths of 0.6 m by the soil moisture sensors. These calibration equations were utilized to scheduled irrigation for the olive plants in the experimental field.
The annual effective rainfall in 2018 and 2019 was observed to be 462 and 286 mm, respectively, as shown in Figure 8. Most of the rainfall was received during the monsoon period (July to August) in both years. The field capacity and permanent wilting point of the sandy loam soil were 13% and 4%, respectively, which means the accessible or available moisture content was around 9%. More than 70% of the olive roots are in the first 0.6 m of soil [38], and therefore the effective root zone is between 0.6 and 0.7 m. By using CROPWAT software, the total water demand by olive plants was computed and found to be 650 mm/year, which was in the range of a reported study [39]. The maximum allowable deficit (MAD) value for the olive plant was 60%, which means if moisture content reached 62 mm, then supplemental irrigation should be applied via drip irrigation. The MAD value in Figure 8 is represented with a red line for the olive plants. The maximum allowable depletion should be 50% before the irrigation event must be triggered, while there may be loss of yield. In general, soil should be kept closer to the field capacity to create less stress on the crop and for better performance.
Soil moisture distribution profiles were observed for soil moisture sensors (tensiometer, irrometer, and gypsum blocks) for the SIS. Figure 9 shows the soil moisture distribution profiles used to schedule irrigation in 2018 and 2019 at 0.3 m depth by using different soil moisture sensors. As seen in Figure 9a, the soil moisture distribution profiles ranged from 63 to 134 mm, 63 to 124 mm, and 63 to 128 mm for the tensiometer, irrometer, and gypsum block, respectively, in 2018 at 0.3 m depth. As seen in Figure 9b, the soil moisture distribution profiles ranged from 66 to 120 mm, 63 to 113 mm, and 69 to 131 mm for the tensiometer, irrometer, and gypsum block, respectively, in 2019 at 0.3 m depth. Similarly, Figure 10 shows the soil moisture distribution profiles used to schedule irrigation in 2018 and 2019 at 0.6 m depth by using different soil moisture sensors. As seen in Figure 10a, the soil moisture distribution profiles ranged from 63 to 147 mm, 63 to 120 mm, and 62 to 121 mm for the tensiometer, irrometer, and gypsum block, respectively, in 2018 at 0.6 m depth. However, as seen in Figure 10b the soil moisture distribution profiles ranged from 70 to 122 mm, 63 to 120 mm, and 69 to 131 mm for the tensiometer, irrometer, and gypsum block, respectively, in 2019 at 0.6 m depth. An excess amount of annual effective rainfall of 462 mm was received in 2018 as compared to 2019, which had286 mm (Figure 8). Therefore, a smaller number of irrigation events was recorded because of excessive amount of rainfall. By contrast, the irrigation was applied in the winter seasons (October to January) because of lower annual effective rainfall. In both years, the irrigation was commenced when the soil moisture values reach MAD values in both years. Peaks in the profiles of soil moisture contents show a quick response of the soil moisture measurement tools because of rainfall events.
According to the results, the irrometer sensor scheduled irrigation with a smaller number of irrigation events. Table 5 shows the amount of supplemental irrigation, number of irrigations, and water-saving potential using the different soil moisture sensors as compared to conventional farmer practice. The irrometer sensors were found to be more accurate, as they saved about 9% of irrigation water by skipping one irrigation event as compared to the tensiometer sensors and gypsum blocks without disturbing olive productivity. In farmer practice there were no soil moisture sensors for the irrigation scheduling and the farmer triggered irrigation based only on feeling the soil. However, olives irrigated through soil moisture sensors were given3 and 4 irrigations less with 17 and 22% of water savings through supplemental irrigations in 2018 and 2019, respectively, in the case of tensiometer sensors and gypsum blocks, while the irrometer sensors saved about 25% of water in 2019.
By applying the optimum amount of irrigation water at the right time and maintaining the optimum soil moisture level in the field one can increase olive yield. Figure 11 shows a comparison of olive yield (kg/ha) and yield efficiency (%) using different soil moisture sensors as compared to conventional farmer practice in 2018 and 2019. An increase in yield efficiency of 6% to 9% was observed using soil moisture sensors as compared to conventional farmer practice. However, less yield was observed in 2019 because of the alternate bearing nature of the olive variety. The results of an increase in yield by the soil moisture sensors showed close agreement with results of a similar study reported in the literature [40]. The irrigation frequency was decided from two perspectives: when there was less moisture in 0.3 m depth and high moisture in 0.6 m depth, the irrigation cycle was slow so that it could irrigate only the upper 0.3 m of the soil while the moisture at 0.6m depth was irrigated less; by contrast, a longer cycle of irrigation was needed to irrigate the deep layer of the soil. The soil moisture sensors discussed in this study are efficient, reliable, low-cost and farmer friendly.

4. Conclusions

The study investigated scientific irrigation scheduling (SIS) for sustainable production of olive groves. Conventional irrigation practice that is being used in Pakistan for olive production utilizes an excessive amount of water because farmers trigger irrigation in their fields based only on feeling the soil. A larger supply of water in the field reduces the yield efficiency of the olive while it increases production costs. In SIS, soil moisture sensors measure soil moisture status efficiently to minimize water consumption without a significant effect on yield efficiency as compared to conventional farmer practices. However, calibration of these sensors is mandatory in order to obtain efficient results regarding soil moisture in the field. Therefore, the study utilized three types of soil moisture sensors, including tensiometers, irrometer sensors, and gypsum blocks. These soil moisture sensors were calibrated by performing experiments in the field and laboratory at Barani Agricultural Research Institute, Chakwal in 2018 and 2019. The calibration curves were obtained by performing gravimetric analysis at 0.3 and 0.6 m depths in 2018 and 2019, thereby equations were developed using regression analysis. The coefficients of determination (R2) at 0.3 and 0.6 m depths for the tensiometer, irrometer, and gypsum blocks were observed as0.98 and 0.98, 0.75 and0.89, and 0.82 and0.95, respectively. After that, a drip irrigation system was installed in the field with these calibrated soil moisture sensors at 0.3 and 0.6 m depths to schedule irrigation. The soil moisture distribution profiles were investigated using regression equations of the soil moisture sensors and water saving potential and yield efficiency were determined. The results show that tensiometers and gypsum blocks were able to obtain a water saving potential and yield efficiency of 17% to 22%, and 6% to 8%, 7% to 8% in 2018, and 2019, respectively. However, the irrometer sensors performed best and showed a water saving potential and yield efficiency of 17% to 25% by minimizing three to four irrigations, and 8% to 9% in 2018 and 2019, respectively, as compared to the farmer practice. Therefore, we conclude that SIS could aid the sustainable production of olive groves with minimum consumption of water while increasing the yield efficiency.

Author Contributions

Conceptualization, M.A. (Marjan Azizand); methodology, M.A. (Marjan Azizand), M.K., N.A. and R.R.S.; software, M.A. (Marjan Azizand), N.A. and M.A. (Muhammad Aleem); validation, M.A. (Marjan Azizand), M.K. and S.K.B.; formal analysis, M.A. (Marjan Azizand), M.K. and M.A. (Muhammad Aleem); investigation, M.A. (Marjan Azizand), M.K., M.S. and R.R.S.; resources, M.S.; data curation, M.A. (Marjan Azizand), R.R.S. and M.A. (Muhammad Aleem); writing—original draft preparation, M.A. (Marjan Azizand); writing—review and editing, N.A., M.S., R.R.S., S.M.I. and S.K.B.; visualization, M.K., N.A., M.S., S.M.I. and S.K.B.; supervision, M.A. (Marjan Azizand); project administration, S.M.I.; funding acquisition, M.S., R.R.S. and S.M.I. All authors have read and agreed to the published version of the manuscript.

Funding

This work was supported by Researchers Supporting Project number (RSP-2021/100), King Saud University, Riyadh, Saudi Arabia.

Institutional Review Board Statement

Not applicable.

Informed Consent Statement

Not applicable.

Data Availability Statement

Data are contained within the article.

Acknowledgments

This work was supported by Researchers Supporting Project number (RSP-2021/100), King Saud University, Riyadh, Saudi Arabia. The authors acknowledge the financial support by the Open Access Publication Fund of the Leibniz Association, Germany. The authors are indebted to Muhammad Ashraf, Chairman, PCRWR for providing technical guidance.

Conflicts of Interest

The authors declare no conflict of interest.

References

  1. Soulis, K.X.; Elmaloglou, S.; Dercas, N. Investigating the Effects of Soil Moisture Sensors Positioning and Accuracy on Soil Moisture Based Drip Irrigation Scheduling Systems. Agric. Water Manag. 2015, 148, 258–268. [Google Scholar] [CrossRef]
  2. An, S.K.; Lee, H.B.; Kim, J.; Kim, K.S. Soil Moisture Sensor-Based Automated Irrigation of Cymbidium under Various Substrate Conditions. Sci. Hortic. 2021, 286, 110133. [Google Scholar] [CrossRef]
  3. Pramanik, M.; Khanna, M.; Singh, M.; Singh, D.K.; Sudhishri, S.; Bhatia, A.; Ranjan, R. Automation of Soil Moisture Sensor-Based Basin Irrigation System. Smart Agric. Technol. 2022, 2, 100032. [Google Scholar] [CrossRef]
  4. Levidow, L.; Zaccaria, D.; Maia, R.; Vivas, E.; Todorovic, M.; Scardigno, A. Improving Water-Efficient Irrigation: Prospects and Difficulties of Innovative Practices. Agric. Water Manag. 2014, 146, 84–94. [Google Scholar] [CrossRef] [Green Version]
  5. Koech, R.; Langat, P. Improving Irrigation Water Use Efficiency: A Review of Advances, Challenges and Opportunities in the Australian Context. Water 2018, 10, 1771. [Google Scholar] [CrossRef] [Green Version]
  6. Taghvaeian, S.; Andales, A.A.; Allen, L.N.; Kisekka, I.; O’Shaughnessy, S.A.; Porter, D.O.; Sui, R.; Irmak, S.; Fulton, A.; Aguilar, J. Irrigation Scheduling for Agriculture in the United States: The Progress Made and the Path Forward. Trans. ASABE 2020, 63, 1603–1618. [Google Scholar] [CrossRef]
  7. Mohamadzade, F.; Gheysari, M.; Kiani, M. Root Adaptation of Urban Trees to a More Precise Irrigation System: Mature Olive as a Case Study. Urban For. Urban Green. 2021, 60, 127053. [Google Scholar] [CrossRef]
  8. Sarma, A. Precision Irrigation-a Tool for Sustainable Management of Irrigation Water. In Proceedings of the Civil Engineering for Sustainable Development-Opportunities and Challenges, Guwahati, India, 19–21 December 2016; pp. 19–21. [Google Scholar]
  9. Mohamed, E.S.; Ali, A.; El-Shirbeny, M.; Abutaleb, K.; Shaddad, S.M. Mapping Soil Moisture and Their Correlation with Crop Pattern Using Remotely Sensed Data in Arid Region. Egypt. J. Remote Sens. Sp. Sci. 2020, 23, 347–353. [Google Scholar] [CrossRef]
  10. Aguilar, J.; Rogers, D.; Kisekka, I. Irrigation Scheduling Based on Soil Moisture Sensors and Evapotranspiration. Kans. Agric. Exp. Stn. Res. Rep. 2015, 1, 1–6. [Google Scholar] [CrossRef] [Green Version]
  11. Younker, B.J. Irrigation Scheduling: Crucial During a Drought. 2012 Press Release; Natural Resources Conservation Service. Available online: https://www.nrcs.usda.gov/wps/portal/nrcs/detail/ks/newsroom/?cid=nrcs142p2_033543 (accessed on 2 February 2022).
  12. Walker, J.P.; Willgoose, G.R.; Kalma, J.D. In Situ Measurement of Soil Moisture: A Comparison of Techniques. J. Hydrol. 2004, 293, 85–99. [Google Scholar] [CrossRef]
  13. Tubeileh, A.; Bruggeman, A.; Turkelboom, F. Effect of Water Harvesting on Growth of Young Olive Trees in Degraded Syrian Dryland. Environ. Dev. Sustain. 2009, 11, 1073–1090. [Google Scholar] [CrossRef]
  14. Carr, M.K.V. The water relations and irrigation requirements of olive (Olea europaea L.): A review. Exp. Agric. 2013, 49, 597–639. [Google Scholar] [CrossRef]
  15. Gardezi, A. Olive Cultivation Is the Best Solution for Pakistan’s Economy, Here’s Why. Available online: https://propakistani.pk/2020/10/24/olive-cultivation-is-the-best-solution-for-pakistans-economy-heres-why/ (accessed on 9 September 2021).
  16. Agriculture Information Bank Olive (Zytoon) Cultivation in Pakistan. Available online: https://agrinfobank.com.pk/olive-zytoon-cultivation-in-pakistan/ (accessed on 9 September 2021).
  17. Davis, S.L.; Dukes, M.D. Irrigation Scheduling Performance by Evapotranspiration-Based Controllers. Agric. Water Manag. 2010, 98, 19–28. [Google Scholar] [CrossRef]
  18. McCready, M.S.; Dukes, M.D. Landscape Irrigation Scheduling Efficiency and Adequacy by Various Control Technologies. Agric. Water Manag. 2011, 98, 697–704. [Google Scholar] [CrossRef]
  19. Aziz, M.; Rizvi, S.A.; Sultan, M.; Bazmi, M.S.A.; Shamshiri, R.R.; Ibrahim, S.M.; Imran, M.A. Simulating Cotton Growth and Productivity Using AquaCrop Model under Deficit Irrigation in a Semi-Arid Climate. Agriculture 2022, 12, 242. [Google Scholar] [CrossRef]
  20. Farg, E.; Arafat, S.M.; Abd El-Wahed, M.S.; El-Gindy, A.M. Estimation of Evapotranspiration ETc and Crop Coefficient Kc of Wheat, in South Nile Delta of Egypt Using Integrated FAO-56 Approach and Remote Sensing Data. Egypt. J. Remote Sens. Sp. Sci. 2012, 15, 83–89. [Google Scholar] [CrossRef] [Green Version]
  21. Ghiat, I.; Mackey, H.R.; Al-Ansari, T. A Review of Evapotranspiration Measurement Models, Techniques and Methods for Open and Closed Agricultural Field Applications. Water 2021, 13, 2523. [Google Scholar] [CrossRef]
  22. Chávez, J.L.; Evett, S.R. Using Soil Water Sensors to Improve Irrigation Management. In Proceedings of the 2012 Central Plains Irrigation Conference, Colby, KS, USA, 21–22 February 2012. [Google Scholar]
  23. Shamshiri, R.R. Fundamental Research on Unmanned Aerial Vehicles to Support Precision Agriculture in Oil Palm Plantations. In Agricultural Robots: Fundamentals and Applications; Hameed, I.A., Ed.; IntechOpen: Rijeka, Croatia, 2019; pp. 91–116. ISBN 978-1-78984-934-9. [Google Scholar]
  24. Payero, J.O.; Mirzakhani-Nafchi, A.; Khalilian, A.; Qiao, X.; Davis, R. Development of a Low-Cost Internet-of-Things (IoT) System for Monitoring Soil Water Potential Using Watermark 200SS Sensors. Adv. Internet Things 2017, 7, 71–86. [Google Scholar] [CrossRef] [Green Version]
  25. Irmak, S.; Burgert, M.J.; Yang, H.S.; Cassman, K.G.; Walters, D.T.; Rathje, W.R.; Payero, J.O.; Grassini, P.; Kuzila, M.S.; Brunkhorst, K.J.; et al. Large-Scale On-Farm Implementation of Soil Moisture-Based Irrigation Management Strategies for Increasing Maize Water Productivity. Trans. ASABE 2012, 55, 881–894. [Google Scholar] [CrossRef]
  26. Evett, S.R.; Colaizzi, P.D.; Schwartz, R.C.; O’Shaughnessy, S.A. Soil Water Sensing–Focus on Variable Rate Irrigation. In Proceedings of the 26th Annual Central Plains Irrigation Conference, Burlington, Colorado, 25–26 February 2014. [Google Scholar]
  27. Radi; Murtiningrum; Ngadisih; Muzdrikah, F.S.; Nuha, M.S.; Rizqi, F.A. Calibration of Capacitive Soil Moisture Sensor (SKU:SEN0193). In Proceedings of the 2018 4th International Conference on Science and Technology (ICST), Yogyakarta, Indonesia, 7–8 August 2018; pp. 1–6. [Google Scholar]
  28. González-Teruel, J.D.; Torres-Sánchez, R.; Blaya-Ros, P.J.; Toledo-Moreo, A.B.; Jiménez-Buendía, M.; Soto-Valles, F. Design and Calibration of a Low-Cost SDI-12 Soil Moisture Sensor. Sensors 2019, 19, 491. [Google Scholar] [CrossRef] [Green Version]
  29. Shamshiri, R.R.; Bojic, I.; van Henten, E.; Balasundram, S.K.; Dworak, V.; Sultan, M.; Weltzien, C. Model-Based Evaluation of Greenhouse Microclimate Using IoT-Sensor Data Fusion for Energy Efficient Crop Production. J. Clean. Prod. 2020, 263, 121303. [Google Scholar] [CrossRef]
  30. Holzman, M.; Rivas, R.; Carmona, F.; Niclòs, R. A Method for Soil Moisture Probes Calibration and Validation of Satellite Estimates. MethodsX 2017, 4, 243–249. [Google Scholar] [CrossRef] [PubMed]
  31. Kumar, S.; Tiwari, P.; Zymbler, M. Internet of Things Is a Revolutionary Approach for Future Technology Enhancement: A Review. J. Big Data 2019, 6, 111. [Google Scholar] [CrossRef] [Green Version]
  32. Li, S.; Xu, L.D.; Zhao, S. The Internet of Things: A Survey. Inf. Syst. Front. 2015, 17, 243–259. [Google Scholar] [CrossRef]
  33. Majumdar, A.K. Chapter 8—Free-Space Optical Communications: Role and Integration with the Internet of Things. In Optical Wireless Communications for Broadband Global Internet Connectivity: Fundamentals and Potential Applications; Majumdar, A.K., Ed.; Elsevier: Amsterdam, The Netherlands, 2019; pp. 245–258. ISBN 978-0-12-813365-1. [Google Scholar]
  34. Seyfried, M.S.; Murdock, M.D. Measurement of Soil Water Content with a 50-MHz Soil Dielectric Sensor. Soil Sci. Soc. Am. J. 2004, 68, 394–403. [Google Scholar] [CrossRef]
  35. Or, D.; Tuller, M.; Wraith, J.M. Water Potential. In Encyclopedia of Soils in the Environment; Elsevier: Oxford, UK, 2005; pp. 270–277. ISBN 978-0-12-348530-4. [Google Scholar]
  36. Aziz, M.; Tariq, M. Assessing the Potential of Rain-Water Harvesting (in Situ) for Sustainable Olive (Oleaeuropaea L.) Cultivation in Water-Scarce Rain-Fed Areas. Irrig. Drain. Syst. Eng. 2018, 7, 212. [Google Scholar]
  37. Fazackerley, S.; Lawrence, R. Automatic in Situ Determination of Field Capacity Using Soil Moisture Sensors. Irrig. Drain. 2012, 61, 416–424. [Google Scholar] [CrossRef]
  38. Masmoudi, M.M.; Masmoudi-Charfi, C.; Mahjoub, I.; Mechlia, N. Ben Water Requirements of Individual Olive Trees in Relation to Canopy and Root Development. Options Méditerranéennes Série B. Etudes Rech. 2007, 1, 73–80. [Google Scholar]
  39. Orgaz, F.; Pastor, M. Fertirrigacion Del Olivo. Programacion de Riesgos. Fertirrigacion. Cultiv. Hortic. Frut. Ornam. Cadahia Lopez C. 2005, 496–533. [Google Scholar]
  40. Capra, A.; Scicolone, B. Irrigation Scheduling Optimisation in Olive Groves. J. Exp. Agric. Int. 2018, 28, 1–19. [Google Scholar] [CrossRef]
Figure 1. An IoT monitoring and control system for scientific irrigation scheduling developed by Adaptive AgroTech, showing (a) the main components of the system, (b) WiFi soil moisture datalogger, and (c) wireless controller (Source: www.AdaptiveAgroTech.com (accessed on 15 January 2022)).
Agriculture 12 00564 g001
Figure 2. Working scheme of tensiometer sensor, reprinted with permission from Ref. [35], 2022 Elsevier.
Agriculture 12 00564 g002
Figure 3. Pictorial representation of (a) bowl with holes to insert gypsum blocks, (b) placement of gypsum blocks for calibration, and (c) buried blocks in soil.
Agriculture 12 00564 g003
Figure 4. Experimental layout used in this study.
Agriculture 12 00564 g004
Figure 5. Calibration curves of tensiometer sensors with gravimetric moisture content at 0.3 and 0.6 m depths.
Agriculture 12 00564 g005
Figure 6. Calibration curves of irrometer sensors with gravimetric moisture contents at 0.3 and 0.6 m depths.
Agriculture 12 00564 g006
Figure 7. Calibration curves of gypsum blocks with gravimetric moisture contents at 0.3 and 0.6 m depths.
Agriculture 12 00564 g007
Figure 8. Annual effective rainfall distribution pattern in 2018 and 2019 with maximum allowable deficit (MAD).
Agriculture 12 00564 g008
Figure 9. Timeline graphs of soil moisture distribution profiles to schedule irrigation in (a) 2018 at 0.3 m depth and (b) 2019 at 0.3 m depth by different soil moisture sensors.
Agriculture 12 00564 g009
Figure 10. Timeline graphs of soil moisture distribution profiles used to schedule irrigation in (a) 2018 at 0.6 m depth and (b) 2019 at 0.6 m depth by different soil moisture sensors.
Agriculture 12 00564 g010
Figure 11. Comparison of olive yield and yield efficiency using different soil moisture sensors as compared to conventional farmer practice.
Agriculture 12 00564 g011
Table 1. Saturation percentage (SP) and soil texture of the experimental site.
LocationDepthDry wt. of SoilWater AddedSaturation Percentage (SP)Soil Texture
(cm)(kg)(ml)(%)
Spot 1150.2507028Sandy loam
300.2507530Sandy loam
Spot 2150.2507429.6Sandy loam
300.2507630.4Sandy loam
Table 2. Classification of soil based on saturation percentage (SP).
Saturation Percentage (%)Soil Texture
<20sandy soil
20–30sandy loam
30–45loam soil
>45–65clay soil
>65heavy clay
Table 3. Field capacity data of the experimental site.
DateTimeDepthWet wt. of the SoilDry wt. of the SoilMoisture Contents
(cm)(g)(g)mm/m
26 September 20182:00 PM3034429937.25
6037632479.44
27 September 201810:00 AM3042236340.23
6031727771.48
27 September 20182:00 PM3034630533.27
6041236169.93
28 September 201810:00 AM3040335533.46
6031928166.94
28 September 20182:00 PM3045139832.96
6036732465.69
Table 4. Some physical and chemical properties of the experimental site.
DepthPhysical PropertiesChemical PropertiespH
Clay (%)Silt (%)Sand (%)N (%)P (ppm)K (ppm)O.M (%)EC (ds/m)
0–0.15 m1030600.851380.60.37.68
0.15–0.3 m23.41320.330.257.79
Table 5. Amounts of supplemental irrigation, number of irrigations, and water saving potential achieved using different soil moisture sensors.
Soil Moisture Sensors and Conventional PracticeYearTotal Number of IrrigationsSupplemental Irrigation with Drip Irrigation (mm)Water Saving (%)
Gypsum blocks2018420917
2019540422
Tensiometers2018420917
2019540422
Irrometer sensor2018420917
2019439125
Farmer practice20187251
20198520
Publisher’s Note: MDPI stays neutral with regard to jurisdictional claims in published maps and institutional affiliations.

