Article

Agricultural Drought Monitoring System in Poland—Farmers’ Assessments vs. Monitoring Results (2021)

1
Department of Bioeconomy and Systems Analysis, Institute of Soil Science and Plant Cultivation-State Research Institute (IUNG-PIB), 24-100 Puławy, Poland
2
Department of Soil Science Erosion and Land Conservation, Institute of Soil Science and Plant Cultivation-State Research Institute (IUNG-PIB), 24-100 Puławy, Poland
3
Department of Agrometeorology and Applied Informatics, Institute of Soil Science and Plant Cultivation-State Research Institute (IUNG-PIB), 24-100 Puławy, Poland
*
Author to whom correspondence should be addressed.
Agriculture 2022, 12(4), 536; https://doi.org/10.3390/agriculture12040536
Submission received: 17 March 2022 / Revised: 2 April 2022 / Accepted: 7 April 2022 / Published: 9 April 2022
(This article belongs to the Special Issue Remote-Sensing-Based Technologies for Crop Monitoring)

Abstract

:
The aim of this study is to compare the farmers’ viewpoint on agricultural drought with the results generated by the national Agricultural Drought Monitoring System (ADMS) in 2021. The authors attempted also to indicate effective methods of validating these results, which could serve as an objective tool of appeal made available to farmers as a part of an administrative procedure or directly included in the drought monitoring system, which, apart from soil and meteorological conditions, would take into account the actual condition of crops in the field. An analysis comparing farmers’ assessments with the ADMS results was presented for all (27,580 parcels) claims for compensation for losses in winter wheat crops submitted in the country. A detailed assessment of the impact of drought on yields was carried out for two pilot regions in the area most affected by agricultural drought in Poland (West Pomeranian Voivodeship, NUTS-2 PL42 region). The paper demonstrates a subjective assessment of incurred losses, performed by the farmers themselves. The difference between the “potential drought”—resulting from the meteorological and soil conditions—and the actual losses, which are also influenced by agro-technical factors, was indicated. The grounds for further development of the Agricultural Drought Monitoring System were the need to establish a method of estimating the impact of drought on crops, which will be based on unambiguous criteria and using high-resolution (temporal and spatial) remote sensing data.

1. Introduction

1.1. Agricultural Drought Monitoring in Poland

Drought is a regional phenomenon, which entails water availability below average values under certain environmental conditions. Due to meteorological, climatic, and hydrological conditions, as well as economic effects, four stages of drought development can be distinguished: first, there is a meteorological drought, then an agricultural, hydrological and hydrogeological drought. Each of them is a threat to the economy and to human activity. In Poland, the definitions of drought and its classifications are discussed in detail on websites hosted by the Institute of Meteorology and Water Management—National Research Institute [1] and the Ministry of Climate and Environment [2].
Agricultural drought is a consequence of prolonged meteorological drought, i.e., a state in which the lack of rainfall has a direct impact on soil conditions and the state of cultivated crops. Agricultural drought occurs when soil moisture is insufficient to meet the water needs of plants and to conduct normal agricultural activity; hence, it may also be called a soil drought. However, it should be noted that not every period without rainfall and characterized by reduction in soil moisture is the agricultural drought phenomenon. The condition for stating the occurrence of agricultural drought is observing changes in plant physiology, the symptom of which is water stress, manifested by a reduction in the size of biomass and plant yield. The period of the water deficit in soil and its severity depends directly on the retention properties of the soil— therefore, they are variable in time and space, according to the spatial distribution of soil types. Agricultural drought leads directly to losses in agricultural production.
Agricultural drought in Poland is monitored by the Institute of Soil Science and Plant Cultivation—State Research Institute (IUNG-PIB), as commissioned by the Ministry of Agriculture and Rural Development (MARD). The substantive assumptions are described in detail in the literature [3,4,5]. Description of the functionality of the Agricultural Drought Monitoring System (ADMS) and the results (obtained since 2009) are published on the following website: www.susza.iung.pulawy.pl/en/ (accessed on 1 February 2022). An urgent need to develop a drought monitoring system for agriculture arose after the occurrence of extreme water shortages for plants in 2006, resulting in a reduction in the average national yields of certain crops by more than 30% (drought was recorded in 77.3% of municipalities and 72.7% of arable land in the country). The original goal of the system being developed was to identify areas with the problem of water deficit in the soil, where yield losses at municipality level are greater than 15%, and since 2009 this threshold has been increased to 20%. The losses mean a reduction in yield in a given year by at least 20% in relation to the yield obtained in the average long-term weather conditions. Until 2019, committees for direct verification (through in situ inspection) of yield losses estimated by the system were appointed for these areas. As a result of their work, protocols of losses were drawn up, based on which farmers could apply for financial support. However, this solution turned out to be highly controversial—on the one hand, the local administration was not directly interested in appointing such committees (which had to be paid for their work), and on the other hand, the committees were often insufficiently qualified to conduct a reliable assessment of the condition of crops and losses. There was also no objective methodology developed for performing in situ assessments, which led to significant differences in results obtained in the neighboring regions and in the spatial extent of drought confirmed by the committee compared to the drought range maps generated in the Agricultural Drought Monitoring System (ADMS). Farmers could also exert influence and pressure on the monitoring institutions (to quickly report the occurrence of drought), the local administration (to take immediate actions for establishing a verifying committee) and on the committee’s work itself (with the aim to overestimate the extent of loss under assessment). Therefore, there was an urgent need to change the policy of drought monitoring and the method of its technical implementation.

1.2. Digitization of Administration to Support the Farmers Affected by Drought

In 2020, MARD made the decision to terminate the works conducted by the field inspection committees. The regulation of the Council of Ministers of 3 June 2020, amending the prior regulation on the scope and implementation methods of certain tasks performed by the Agency of Restructuring and Modernization of Agriculture (ARMA) [6], introduced a publicly accessible application software, in which the agricultural producer (logged in with a trusted e-signature) can submit an online application for estimation of crop losses incurred in relation to agricultural drought [6,7,8].
The Government Drought Application (.gov) consists of three levels of verification [8]:
  • Only crops that have been declared in applications for direct payments can be indicated—the verifying institution is the ARMA, which in Poland is the institution responsible for direct payments under the Common Agricultural Policy of the EU;
  • Verification of the loss assessment: losses reported by farmers are compared with the losses estimated in ADMS—the verifying institution is IUNG-PIB;
  • Verification of farm losses is conducted by the Institute of Agricultural and Food Economics—National Research Institute (IERiGŻ-PIB), which reports losses resulting from drought, exceeding 30% of the total farm income, which is a condition for receiving state aid [9].
In order to automate the process of applications submission and verification, an IT system has been created that connects the above-mentioned institutions, thanks to which the evaluation process is automatic (without human interference) and the flow of information between the institution’s servers is conducted via APIs. Thus, the Government Drought Application (.gov) constitutes a common tool of the aforementioned institutions, which has been implemented directly in the central infrastructure of the country (.gov). The application has only one public interface that allows the farmer to submit a request for financial support in relation to losses incurred on the farm resulting from agricultural drought. Data flow in the Government Drought Application is presented in Figure 1.

1.3. Trends in the Changes in ADMS Methodology

Changes in the process of data collection (mainly meteorological data), processing and modelling took place thanks to the rapid development of geomatic techniques that could be observed in recent years. In this regard, three main directions of monitoring development can be distinguished:
  • Satellite monitoring. Remote sensing methods were tested in ADMS since the beginning of its operational status [10,11]. However, the full potential of satellite remote sensing emerged in 2014, when the European Space Agency (ESA) launched the first satellite of the Sentinel-1 series, which initiated the public release of high-resolution radar data. One year later, the Sentinel-2 satellite was launched, equipped with a high-resolution multispectral camera. The Sentinel missions are part of the Copernicus program, initiated and financed by the European Union—thanks to this, remote sensing data was provided free of charge, allowing the monitoring of crops on the scale of agricultural parcels. For the monitoring of agricultural drought, this means a wide range of validation possibilities of models and algorithms performed directly on the scale of a field. Thanks to the data of the Agricultural Parcel Identification System (APIS), research and development works concern all the plots in the country.
  • Remote sensing of precipitation: since October 2019, the Institute of Meteorology and Water Management—National Research Institute (IMWM-PIB) has made available the precipitation maps generated on the basis of observations conducted by ground-based radar stations that are part of the POLRAD network. It is a Polish network of terrestrial meteorological radar remote sensing devices monitoring the structure and movement of meteorological objects in the troposphere within several hundred kilometers (including precipitation on the earth’s surface). Data are acquired in hourly intervals, and precipitation maps are generated with a spatial resolution of 1 km.
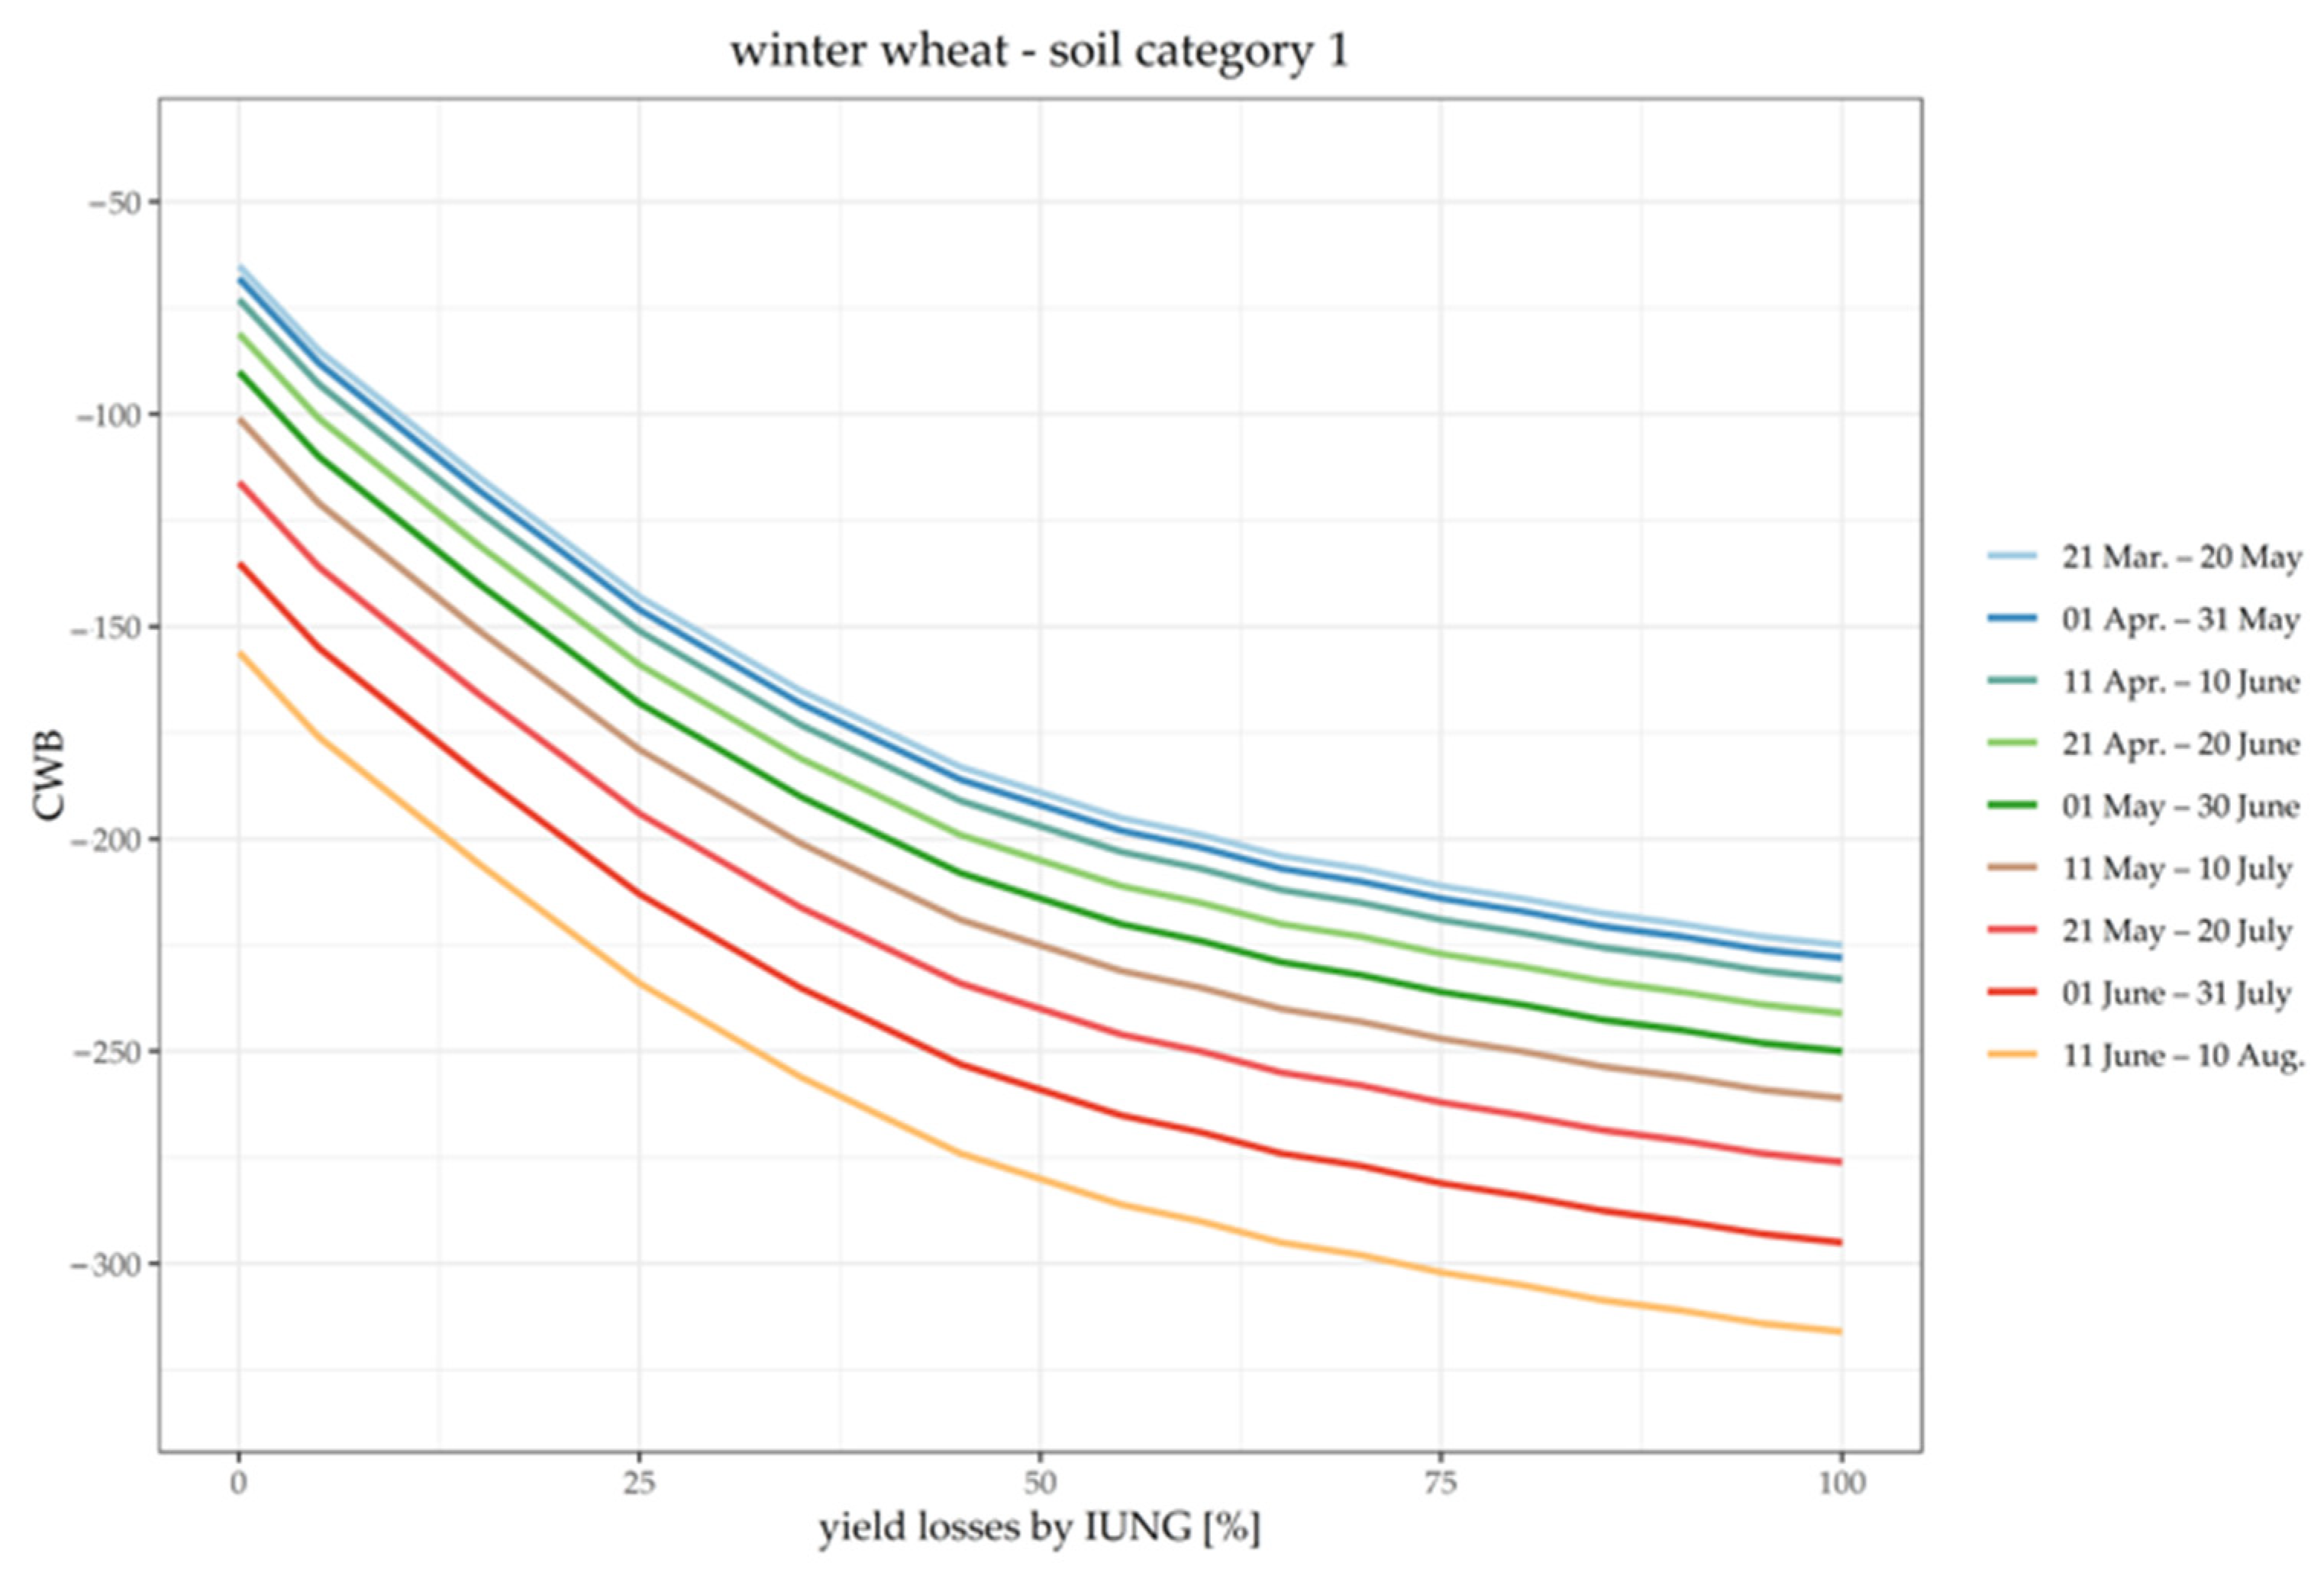
  • Assessment of crop losses—the functionality of the Government Drought Application (.gov) requires the assessment of the full spectrum of losses (0–100%); therefore, ADMS has been supplemented with a loss estimation module that uses regression relationships between the values of the Climatic Water Balance (CWB) and the yield loss incurred due to water scarcity. Modelling is carried out independently in each reporting period from May to September (regressions depend on the period—and the state of plant development). Yield loss models resulting from agricultural drought were developed for the main crops, which are mapped for all the cultivated crop species declared by farmers in direct payment applications.

1.4. Controversy Caused by the Implemented Changes

The development of ADMS based on the abovementioned technologies allowed for full monitoring of both the extent of agricultural drought and the estimated crop losses. The Government Drought Application (.gov) enabled full automation of the application process and the introduction of support mechanisms. However, implementation of these technologies is not well received among farmers, for whom the assessment of losses carried out by field-verifying committees was much more favorable. Their dissatisfaction is further affected by the lack of appeal options against the decision generated automatically in the Government Drought Application (.gov).

1.5. Characteristics and Regionalization of the 2021 Drought

Based on the data from the period of 2009–2021, IUNG-PIB stated that the largest (in terms of the extent and values of the CWB index) agricultural droughts were recorded in the following years: 2010, 2011, 2013, 2015 and 2017–2021. In each of those years, drought in Poland occurred in at least 10 crop species.
Considering the last 13 years, it can be stated that in 2021, no risk of drought was recorded for most regions in Poland. However, deviations from the norm were observed for other agrometeorological conditions. Spring was extremely cold, which caused vegetation to be delayed for 2 to 3 weeks. The resulting large amounts of water in the soil that remained from the periods of autumn and winter (from the snow cover) were a favorable factor for the growth of arable crops. Especially in the eastern regions of Poland, the snow cover in 2021 was thick and lasted for a relatively long time. In early spring, soil water reserves remained at high levels, since evapotranspiration was low due to low air temperature and low level of sunshine. Then, in the following decades of May, soil moisture began to slowly decrease, especially in the eastern and northwestern parts of the country. Due to the warming, the condition and vigor of the plants improved significantly. Agricultural drought was observed only in June and July—mainly in the West Pomeranian, Pomeranian and Kuyavian-Pomeranian voivodeships. The drought effect was intensified by the simultaneous occurrence of very high temperatures. Thermal stress, significantly affecting the yield of cereals, affected crops mainly in the West Pomeranian and Pomeranian voivodeships. Since August, very heavy rainfall has swept across Poland, as a result of which no drought was stated in the subsequent reporting periods.
This paper presents the newest version of the extended ADMS system, which was operationally used to assess the agricultural drought in 2021. The results of the system’s work were discussed based on the example of the region, where the greatest impact of drought on yields was found. The working hypothesis was that ADMS is an effective tool for objective assessment of the potential (weather-induced) crop losses. For this purpose, the position of farmers was compared against the results generated by the ADMS and the source of these discrepancies was discussed. The authors also attempted to indicate effective methods of validating the results, which could be an objective tool of appeal made available to farmers within an administrative procedure or directly included in the drought monitoring system, which, apart from soil and meteorological conditions, would also consider the actual condition of crops in the field. The presented study shows how the constructed model for determining yield losses at field scale implemented in ADMS and the obtained results can be verified using remote sensing techniques. The created algorithm will be introduced in ADMS as a new module.
An innovative approach in this work is to present the implementation of the concept of combining crop monitoring based on meteorological and habitat (soil) data with direct assessment of plant condition using remote sensing methods. The authors indicate that such an approach can provide objective arguments for social discussion as well as for the selection of agro-technical practices limiting the effects of water scarcity on crops.

2. Materials and Methods

2.1. Data of the Agricultural Drought Monitoring System

To identify areas with deficit of water for arable crops and yield losses, an IT system for drought monitoring uses a number of databases and computer applications integrating meteorological data, and soil and agricultural maps showing the spatial diversity of water retention in various agricultural categories of soil. The analysis of the risk of agricultural drought is performed in the following steps:
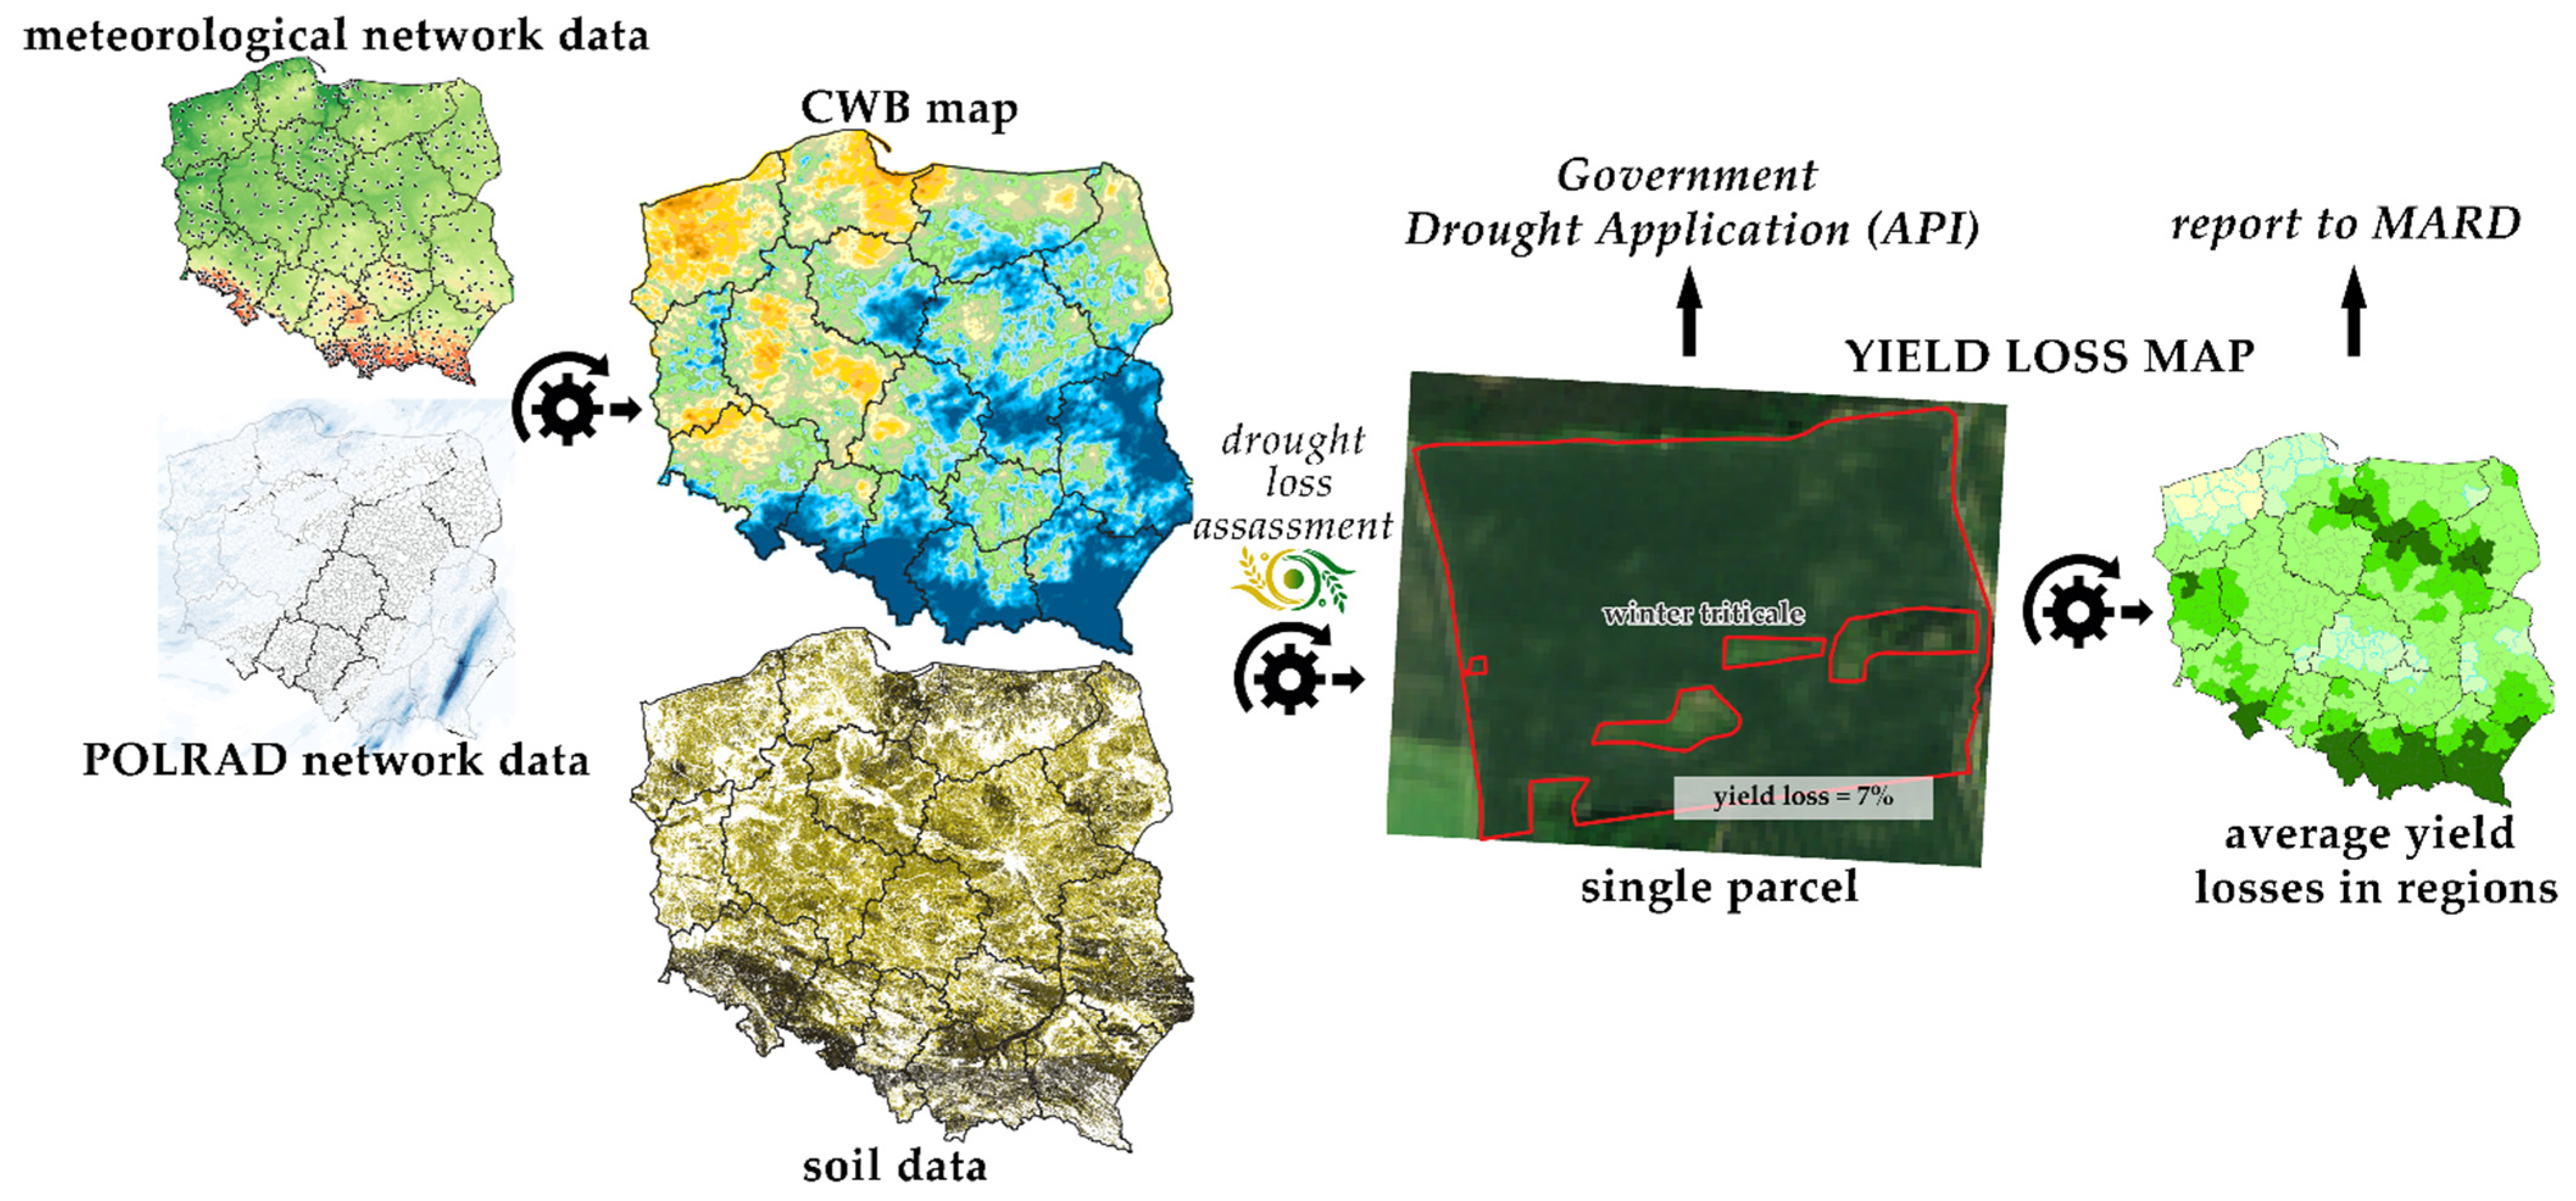
  • Telemetric collection of data from a network of meteorological stations and verification of data quality.
  • Acquisition and aggregation of radar data from the POLRAD network as well as verification and correction of radar data errors.
  • Interpolation of precipitation and evapotranspiration maps, which are the basis for developing the CWB map.
  • Spatial and statistical analyses, necessary for developing yield loss maps. Modelling of drought range is based on the CWB map, map of soil susceptibility to drought categories and tables of CWB threshold values. The application checks each pixel of the soil category map and the spatially corresponding pixel of the CWB map, then, using the CWB thresholds for the soil category in the analyzed period, performs the assessment of the agricultural drought risk for the analyzed crop (until 2019 it was only assessed whether the probability of loss could be greater than 20%). The process is repeated for each crop separately. That is how the agricultural drought risk maps are created (see: the third tab on the ADMS website [12]).
  • Based on the maps produced and the current administrative boundaries of municipalities, the share of soils affected by drought is calculated for a given crop and for each soil category.
  • For administrative units, the maximum losses caused by drought in monitored crops are estimated.
  • During the period when applications related to drought losses are submitted by farmers via the Government Drought Application (.gov)—an API interface operates on the ADMS side, providing ‘on demand’ the estimated yield loss for the field indicated by the farmer.
The above process is presented on the flowchart in Figure 2. It should be noted that ADMS generates detailed results on various spatial scales: on the field scale—for the needs of the Government Drought Application, and information generalized for administrative units—for the needs of the Ministry of Agriculture and rural Development (Figure 3). The full description of the monitoring system and the database have been publicly available since 2008 at www.susza.iung.pl/en/ (accessed on 10 January 2022).

2.2. Method of Yield Loss Assessment in ADMS

Since 2020, ADMS has a module for estimating losses for individual fields, which, as described in the previous chapter, interactively works with the Government Drought Application (.gov) via the API interface. The module uses the generated CWB maps (with a spatial resolution of 250 m) and the developed statistical and empirical models of yield losses depending on water shortages [13,14]. An example of these regression functions is shown in Figure 4. A detailed description of the functioning of ADMS can also be found in the literature [15].
Regression functions (as shown in Figure 4) were developed for all of the 16 monitored crops (see: https://susza.iung.pulawy.pl/en/progi/, accessed on 7 March 2022 [16]), separately for each of the 4 soil categories (see: https://susza.iung.pulawy.pl/en/kategorie/, accessed on 7 March 2022 [17]) and each of the 14 sixty-day reporting periods (see: https://susza.iung.pulawy.pl/en/raporty/, accessed on 7 March 2022 [18]).
In order to enable determination of yield losses for all crops from the ARMA list, a ‘Glossary’ was developed, specifying water requirements for 925 groups and species of plants included in the systems of this agency [19]. This information is used to determine the drought occurrence for plant species enlisted in the ‘Glossary’ in relation to the crops monitored by the system so far [18].
The process of direct estimation of losses in a specified crop on a chosen agricultural plot is carried out according to the following scenario:
  • In each reporting period, the potential yield loss for each crop in a given soil category is determined on the basis of regression functions (CWB <-> loss); finally, the maximum value of the loss from all periods is taken;
  • Based on the queries sent to the system, specifying the plot geometry, the value of the yield loss on the agricultural plot is calculated from the maximum loss layer (previous step) as the weighted average loss determined by the plot range (differentiation of the loss depending on soil categories);
  • The obtained result is made available to the Government Drought Application (.gov) using the API [19].

2.3. Data from the Government Drought Application

For the purposes of the analyses presented in this paper, the following information from the Government Drought Application (.gov) was used:
  • Coordinates of the corners of agricultural plots’ boundaries;
  • Attributes of agricultural plots: cultivated crop; loss declared by the farmer;
The data were sent to the IUNG-PIB server via the API interface to be used in the verification process of the 2021’ applications. Queries are sent to the IUNG-PIB server via the http protocol in the JSON format as part of the data flow visualized in Figure 1.
In the presented study, we used all the farmers’ applications regarding losses in winter wheat crops submitted through the online tool, reported from the selected research region. In total, 5725 (61,064 ha) cases were analyzed.

2.4. Research Area Selection Criteria

Both the data from ADMS and those in the Government Drought Application (.gov) cover the entire country. However, in this study, the analyses were limited to a selected region of the country, due to the following criteria:
  • Selecting a region with the greatest variation in drought—in the analyzed year (2021), an overall low risk of drought was observed throughout the country; therefore, there were few farmers’ declarations submitted from ‘wet’ regions, which accounted for over 70% of the area of Poland;
  • Limiting the impact of agroclimatic diversity—including zoning of key vegetation seasons and the regional specificity of soil structure and types of land use.
For the above reasons, the West Pomeranian voivodeship (NUTS-2 code PL42 [20]) was selected as the research area, since only in this region of Poland an intense agricultural drought occurred, which had a significant impact on the yield of cereals. In addition, in this voivodeship, a differentiation in the intensity of drought was observed, which made it possible to compare drought effects in the most vulnerable areas with those where a lesser disturbance in the course of vegetation was observed in the period of water shortage (Figure 3).
Another reason for selecting this voivodeship was the social one: the West Pomeranian Chamber of Agriculture, which is the administrative body representing farmers at this level, as the only one in the country openly disagreed with the results of ADMS and appealed to the Ministry of Agriculture and Rural Development, demanding financial support for farmers for the reportedly incurred losses.

2.5. Preparation of the Database for Comparative and Remote Sensing Analyses

  • Sentinel-2 satellite images were downloaded from the resources of the European Space Agency from the Copernicus Open Access HUB portal. Post-processed Level 2A images (orthoimage Bottom-Of-Atmosphere (BOA) corrected reflectance product) were imported. For the analyzed area, all available data for the period 2020/10/01–2021/07/01 were selected. The images were then converted to the NDVI (Normalized Difference Vegetation Index [21]) vegetation index maps.
  • Coordinates of the corners of agricultural plots’ boundaries (data of the Government Drought Application in JSON format) were converted to SHP format files.
  • SHP polygons (agricultural plots) were fragmented based on the soil diversity (into 4 categories of soil susceptibility to drought). The source of information on soil variability was a soil map of 1:25,000 scale, which is a standard component of the ADMS database [22].
  • Finally, 9235 polygons were obtained (a set of fragments of agricultural plots) with the following attributes:
    No. of the agricultural plot;
    Category of soil resistance to drought;
    Loss declared by the farmer;
    Potential loss estimated by ADMS;
    Max NDVI index value observed.
  • From the database, the following were removed:
    Polygons located within the cloud and shadow mask (ESA generated layer);
    Polygons with NDVI values significantly different from other polygons in the same soil category in the region—this allowed us to clear the database of plots with very poor farming technique or those remaining clouded or shaded throughout the whole observation period—and hence not covered by the ESA mask. This method also eliminated false declarations from farmers (no cultivation or type of crop different from declared);
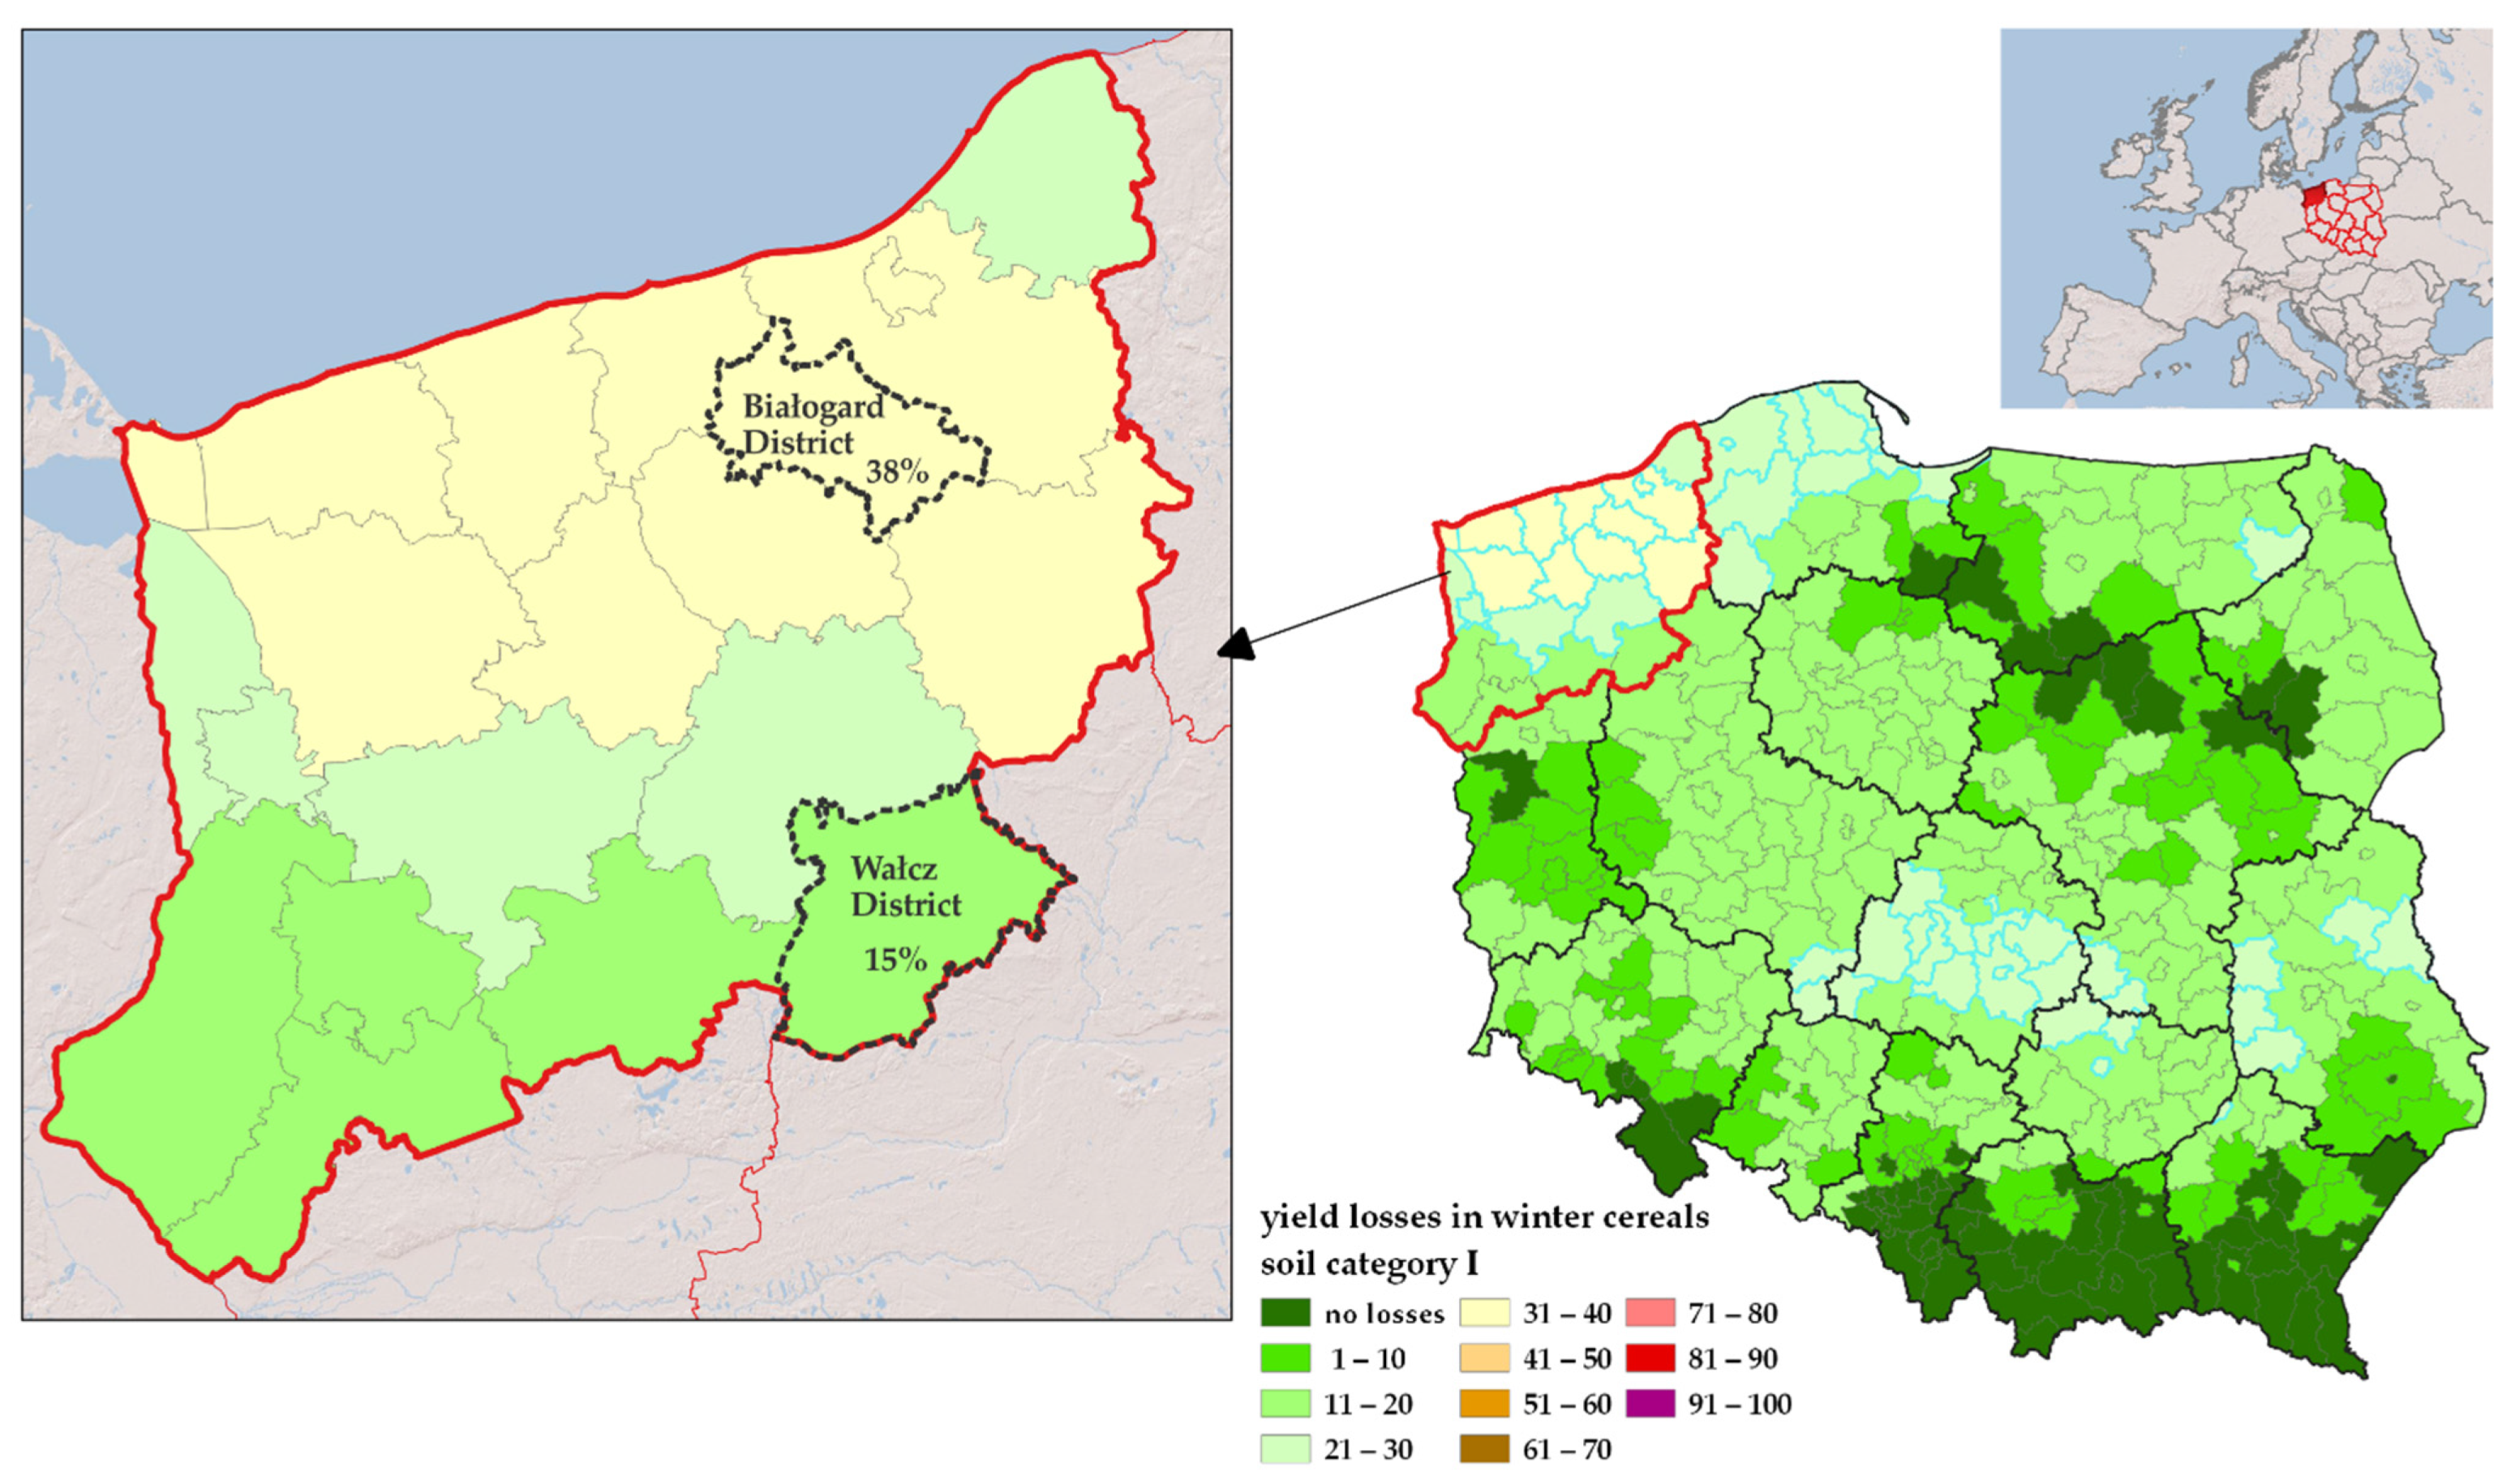
  • Two subsets of data were selected from the database: for the Białogard district (intense drought) and the Wałcz district (moderate drought).

2.6. Comparative Methods for Assessing Yield Losses Related to the Occurrence of Agricultural Drought (Farmers vs. ADMS)

The analysis was performed in the following steps:
The descriptive statistics of the analyzed datasets were calculated. The sets represent the entire population under observations (both for the selected voivodeship and districts), so it was assumed that the obtained statistical distributions describe the features of the entire studied population and do not require the Gaussian (or other) distribution conditions to be met. Therefore, the description of distributions uses other measures better suited to the study of asymmetric (skewed) distributions and disproportionate outliers, i.e., the median as a measure of the average value of the dataset and the median absolute deviation (MAD) as a measure of dispersion [23].
MAD = b   M i ( | x i M j ( x j ) | )
where: xi—n original observations; Mi—median of the series; b—constant.
The possibility of drawing the regression function between farmers’ declarations and ADMS observations was analyzed, with particular emphasis on the discrepancy for the following loss ranges:
  • 0–20%—threshold of 20% is assumed as the min. indicator of the risk of drought disaster;
  • 20–30%—threshold of 30% of losses results from the UE regulations on the possibility of state aid for the victims of natural disasters;
  • >30%.

2.7. Agricultural Drought Assessment Using Remote Sensing Methods

The use of Sentinel-2 satellite data allows for the following:
  • Direct observations of an object with a time interval of 5 days—except for the periods with cloud cover. The shadow of the clouds may also be an obstacle for observations;
  • Observations at a spatial resolution of 10 m, which is sufficient for field research;
  • Obtaining data in 13 spectral ranges, including the key ones for the assessment of the state of vegetation: the range of red and infrared radiation—which enables the generation of vegetation index maps. For the analysis, one of the most popular indicators was selected, namely, NDVI, which—due to its properties—is particularly sensitive to plant moisture (vigor) [24,25,26]. This property of NDVI index results from taking into account both the bands with the highest absorption of light by healthy vegetation (red range) and the highest reflection for the infrared range. When plants are exposed to water stress, then this relation decreases sharply, which is estimated by the following formula:
NDVI = B 8 B 4 B 8 + B 4  
where: B4—reflected radiation recorded in channel 4 of Sentinel-2 (RED); B8—reflected radiation recorded in channel 8 of Sentinel-2 (NIR); Thanks to the above functionality, remote sensing enables an individual assessment of the condition of agricultural plot for all the analyzed cases. In the specialist literature, there are also many examples of the use of remote sensing for yield assessment [24,27,28,29,30]. Based on the above, a regression analysis was performed between the values of the NDVI index and the reported losses (declared by farmers and by ADMS).

3. Results

3.1. Farmers’ Declarations vs. ADMS Results

Figure 5A shows a graph which directly compares the losses declared by farmers with the results of ADMS. It illustrates the scale of discrepancies in the farmers’ assessment of losses caused by drought, but the following should be noted:
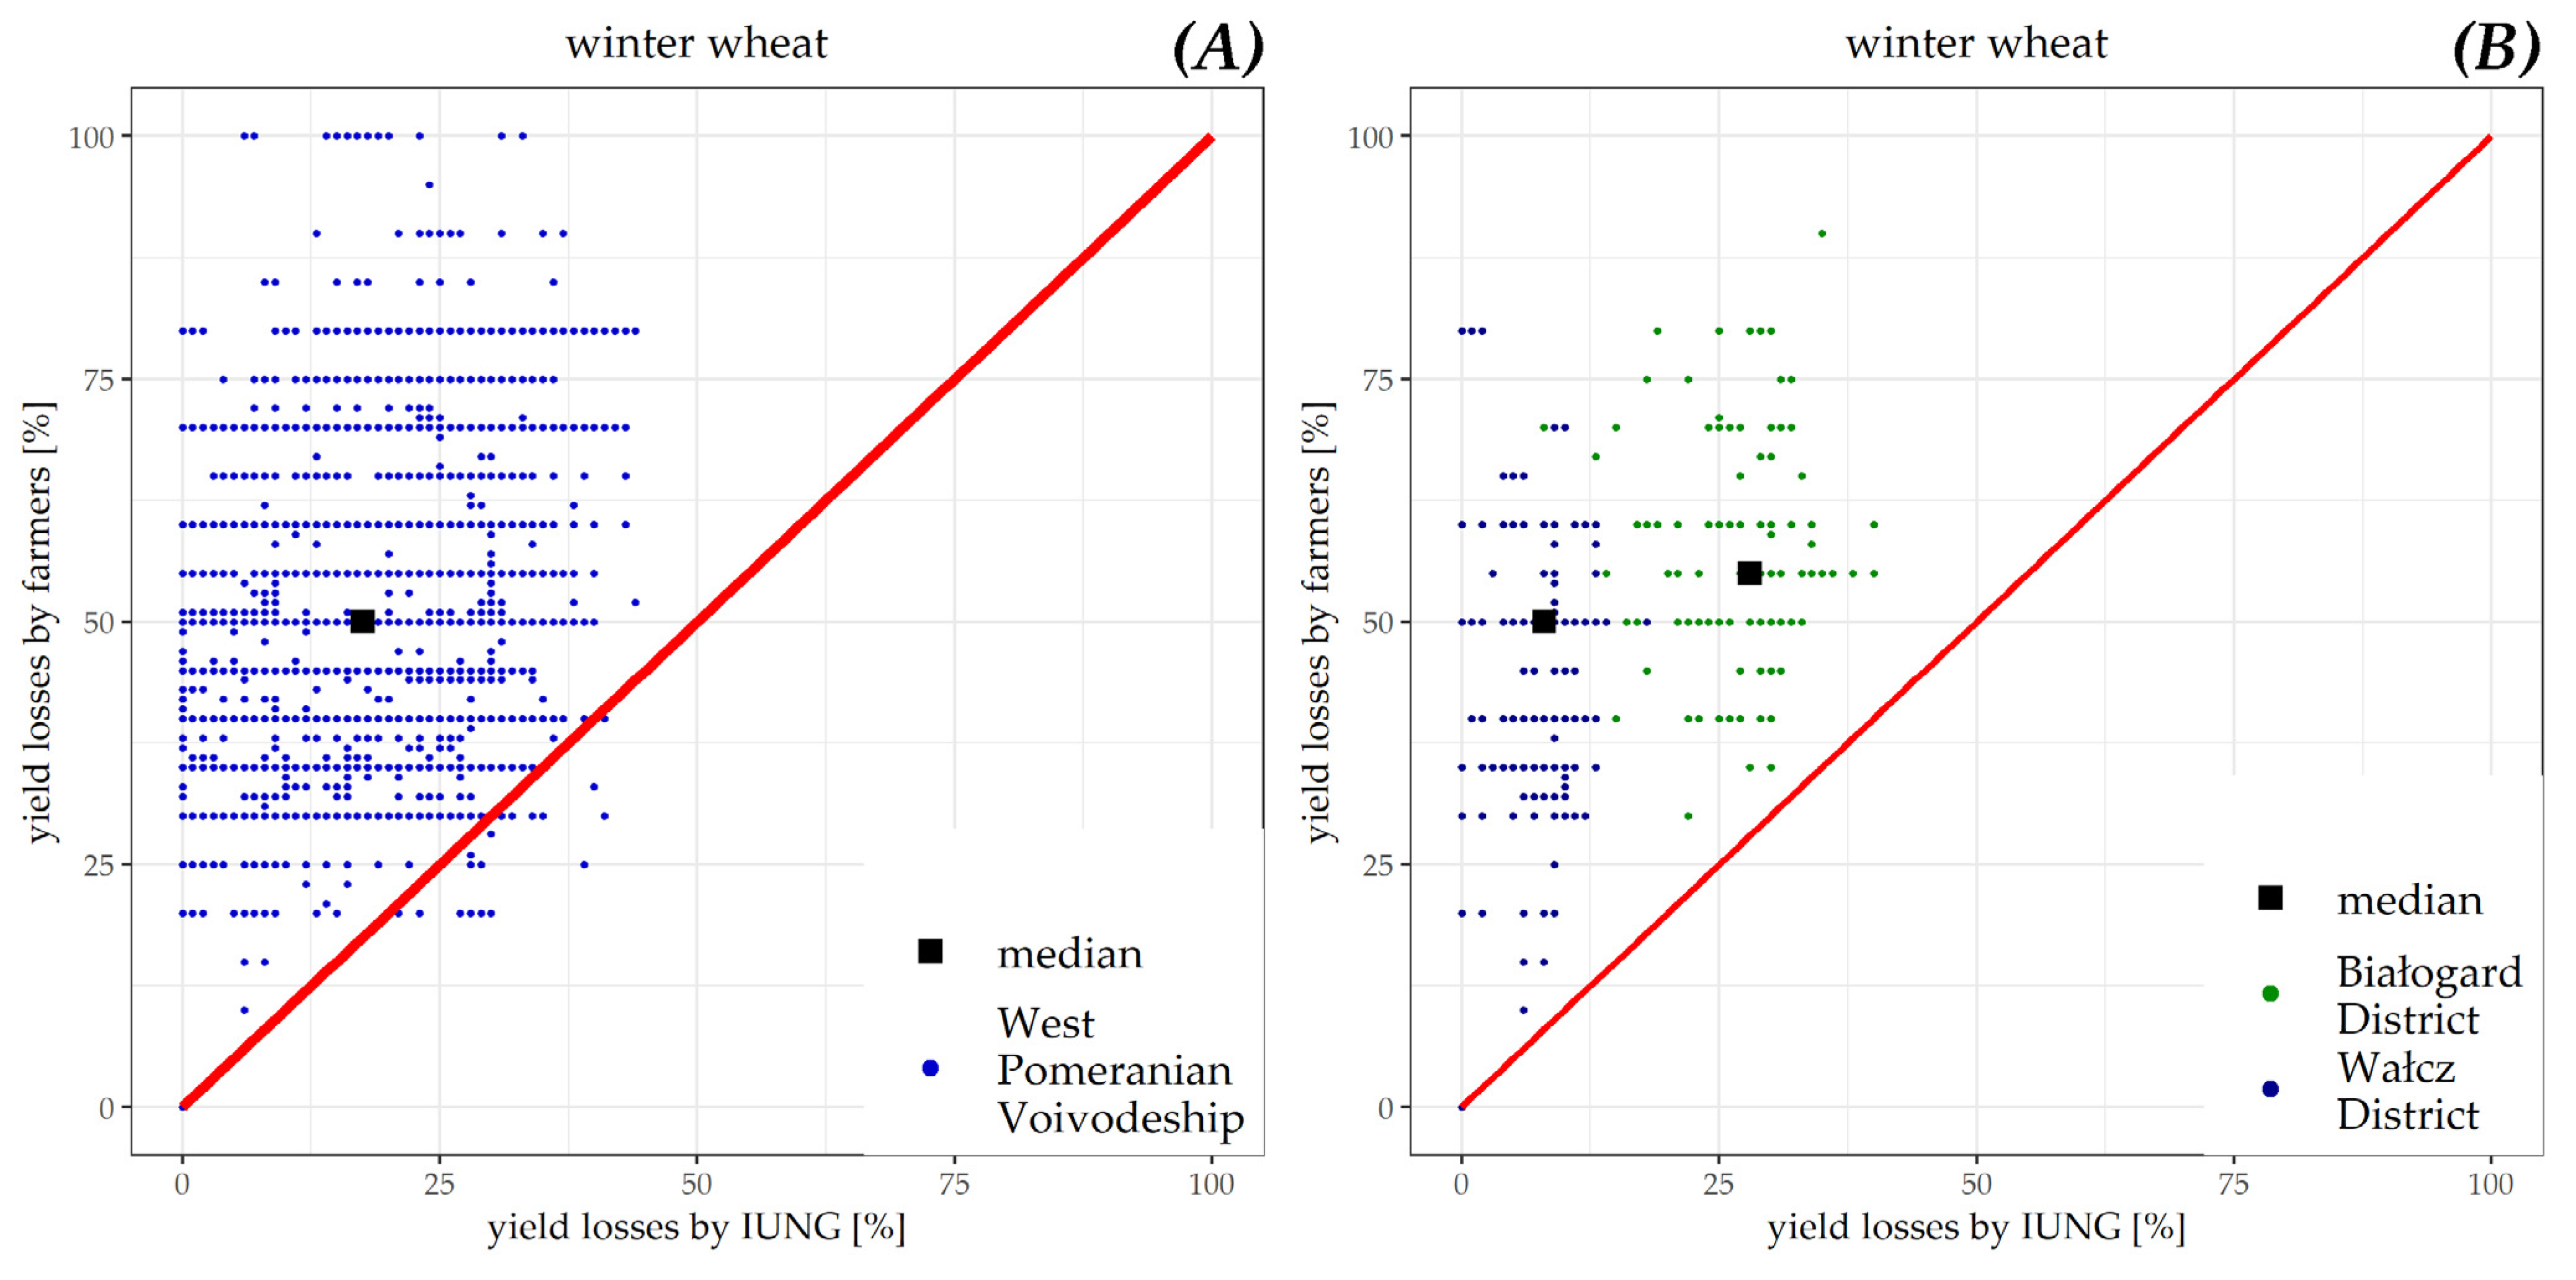
  • In 99% of all cases, the losses declared by farmers are higher than those estimated by ADMS;
  • In 63% of all cases, the losses declared by farmers are higher than 40%, which is higher than the maximum losses indicated by ADMS;
  • The scatter of results and their concentration in the upper left corner of the chart indicates that it is not possible to search for statistically significant regression relationships between farmers’ assessment and results of ADMS;
  • In over 32% of farmers’ declarations, the reported drought losses are higher than 50% of yield, which would suggest a catastrophic drought in the voivodeship—such has not been observed in the area.
Figure 5B presents a detailed comparison of farmers’ declarations with the ADMS results for the Białogard district (the largest drought in the voivodship) and for the Wałcz district, where the drought was quite moderate. The analysis shows the following:
  • In the district with the highest intensity of drought (Białogard), the average loss incurred according to the farmers was 55% (28% according to ADMS);
  • In the district with the lowest intensity of drought (Wałcz), the average loss incurred according to the farmers was 50% (8% according to ADMS).

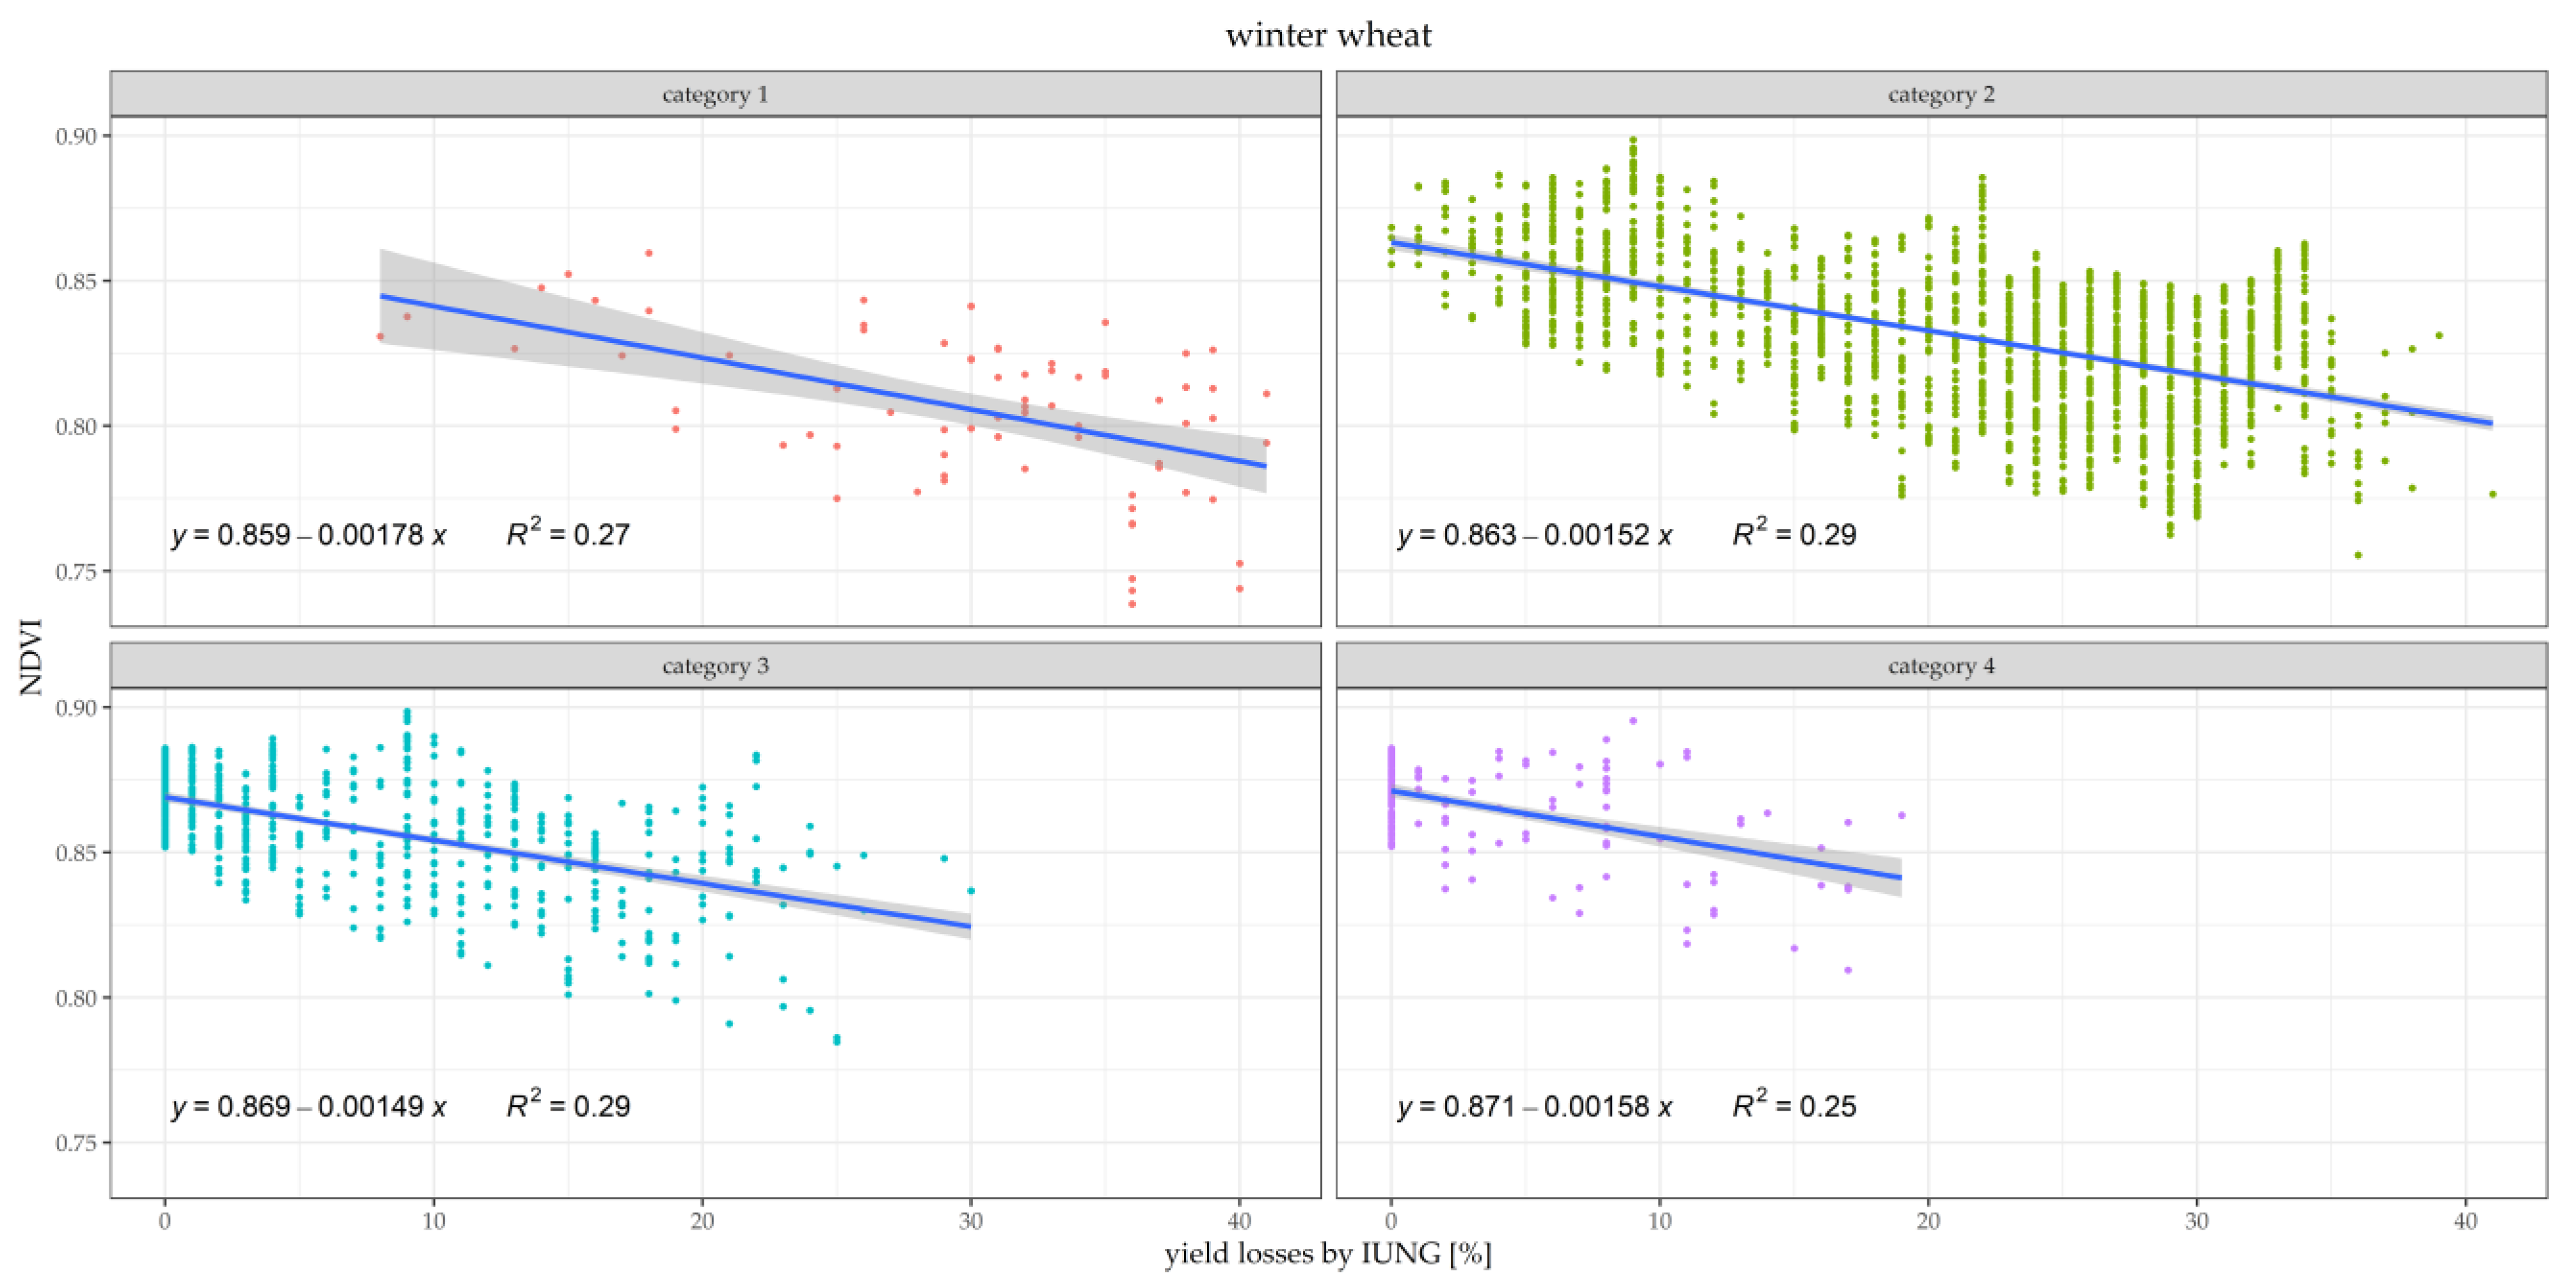
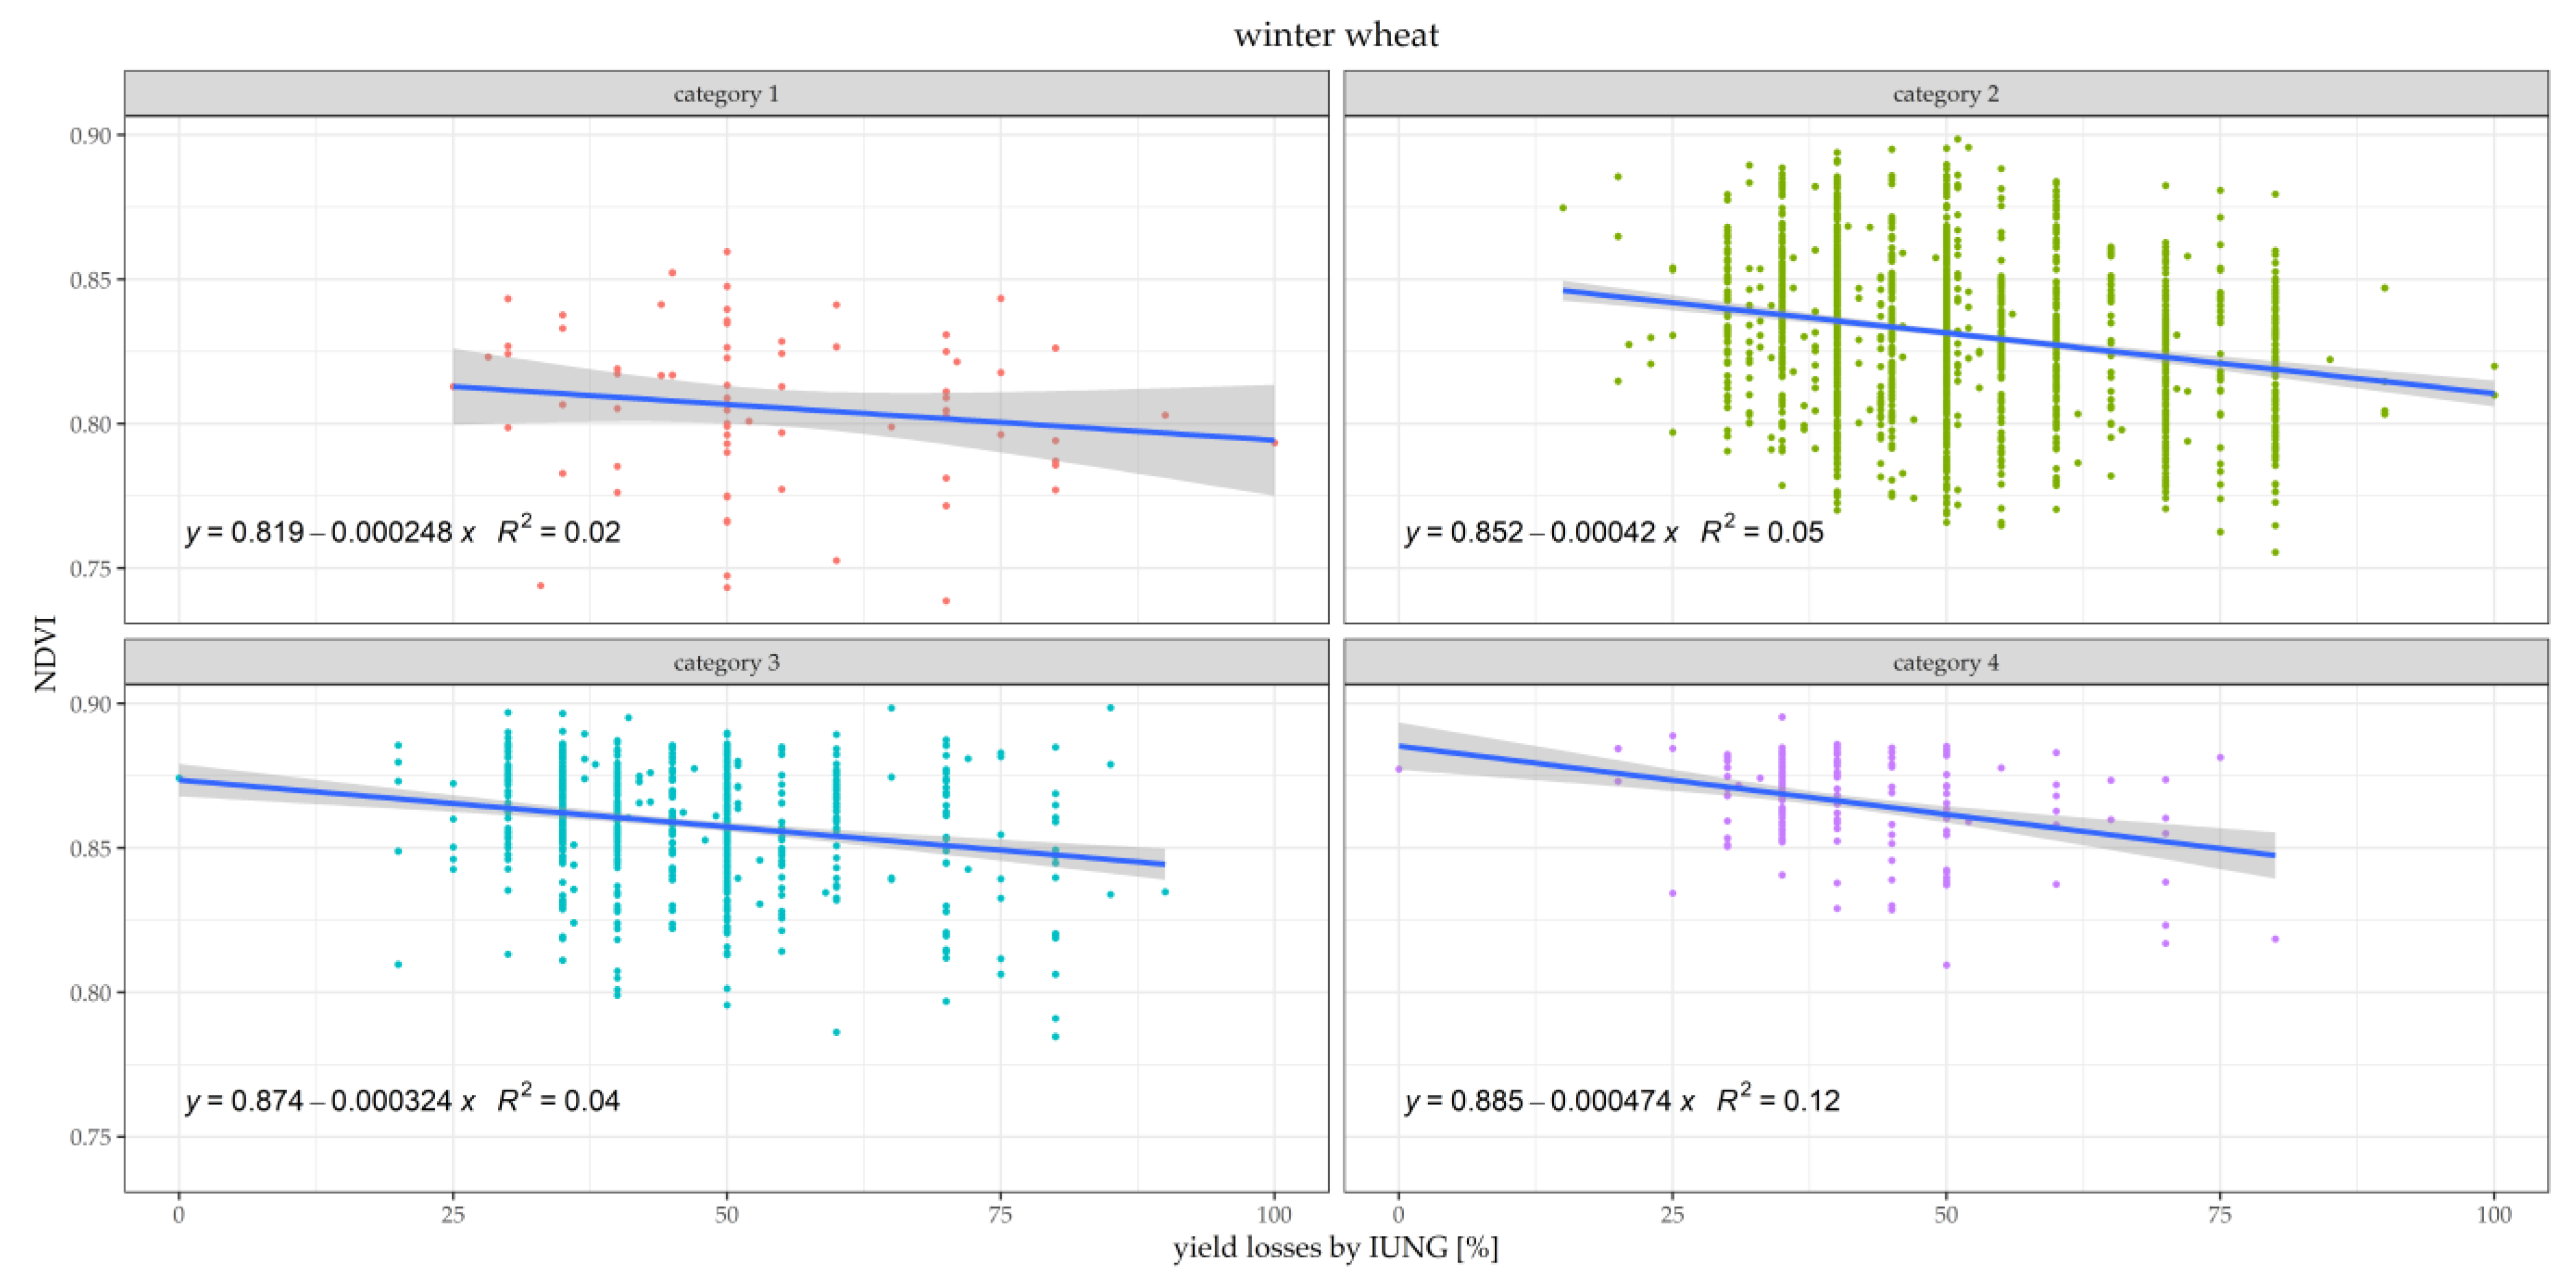
3.2. Verification of Agricultural Drought Occurrence Using Remote Sensing Methods

When interpreting the comparison of the results obtained using remote sensing methods with the results of ADMS and the farmers’ assessments, the following should be noted:
  • ADMS is a system used for assessing a potential drought that may occur due to the prevailing meteorological conditions. The system does not take into account other meteorological factors (hail, excessive rainfall, thermal stress increasing losses incurred in drought conditions) or agro-technical factors.
  • Farmers assess their losses immediately before harvest, and the losses may be caused by a number of factors, which are not easy to be determined at that point. The incorrect assessment is not necessarily caused by ill will, but rather the fact that an average farmer does not have the qualifications, equipment or an appropriate method established to objectively estimate the loss that is solely the result of drought.
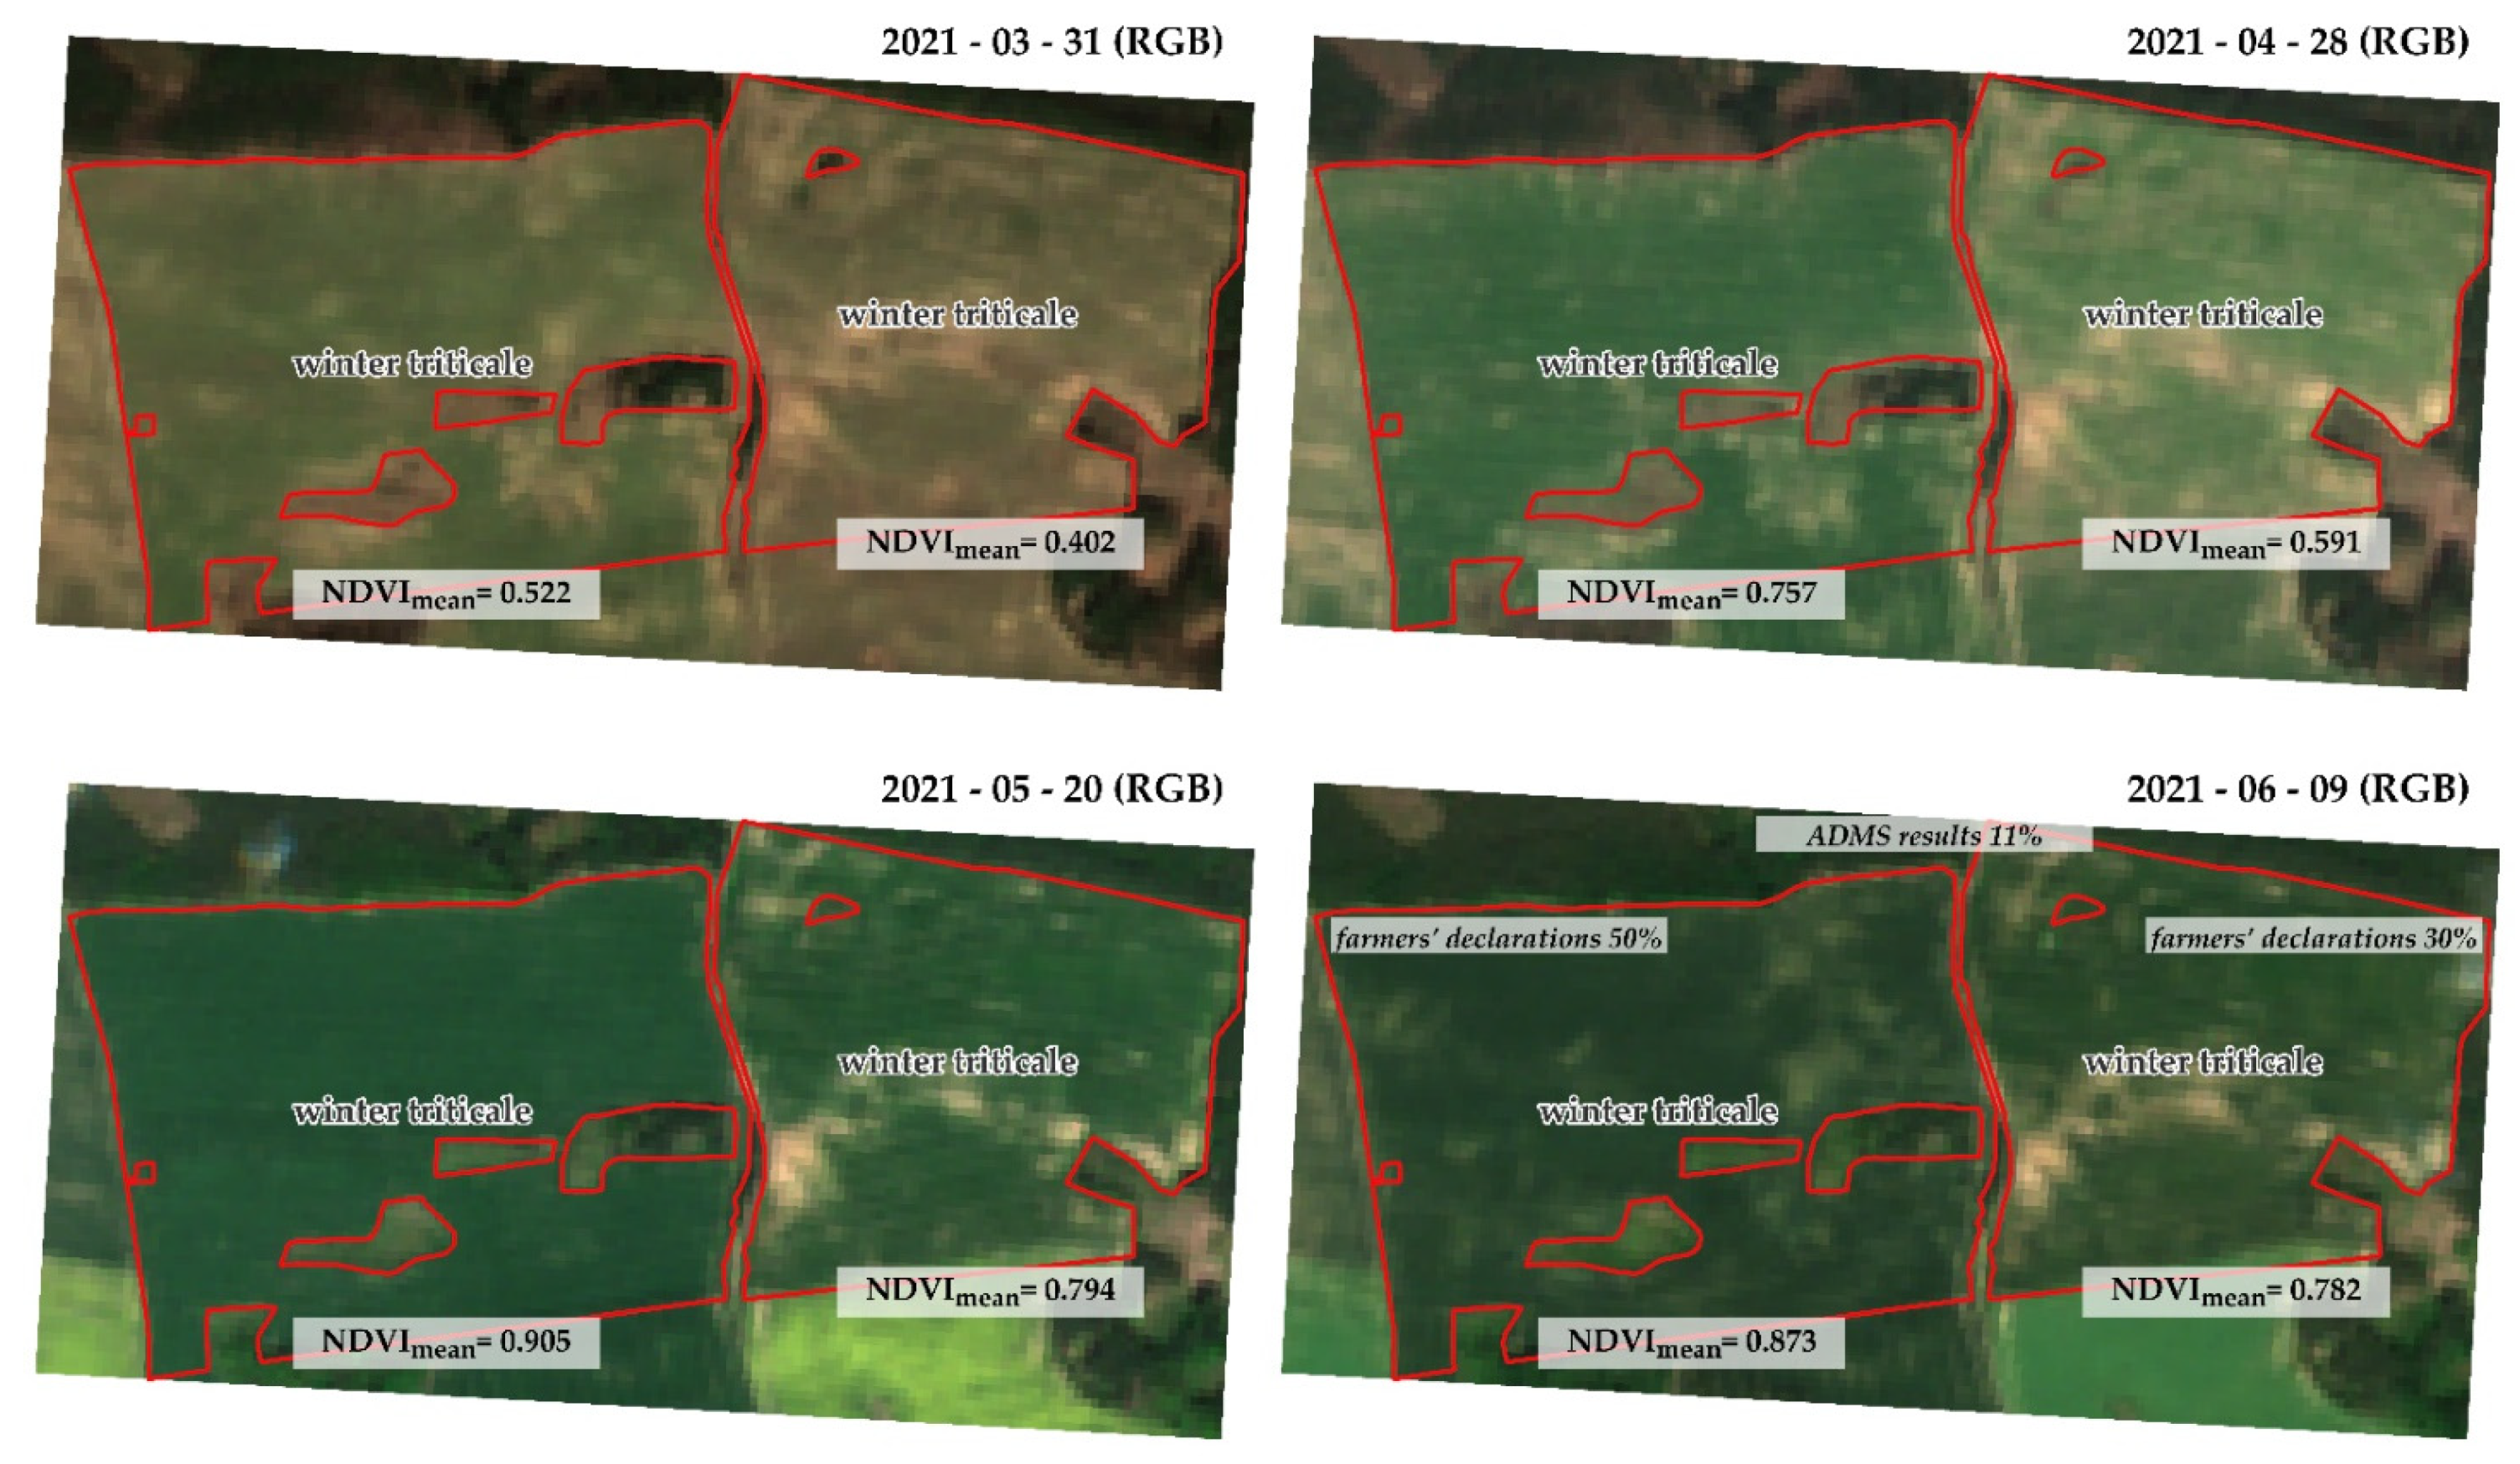
  • Remote sensing assesses the actual condition of plants, which is greatly influenced by farming technique. Therefore, the differences between the losses estimated by ADMS and the actual losses can differ significantly. These differences are often evident even in adjacent crops (due to different farming technique used) and within the same field (e.g., due to soil mosaic effect).
Considering the above, the results presented for further discussion constitute two comparisons presenting the relationships between the recorded vegetation indices and the yield losses estimated on the basis of ADMS (Figure 6) and farmers’ declarations. In each case, regressions were presented separately for different soil categories.
The comparison of the relationship between the losses observed in the monitoring system and the remote sensing of crops (NDVImax after 10 June 2021) shows the presence of weak regression relationships for all soil categories, with the strongest relationships observed on the weakest soils (category 1, R2 = 0.31). There is also a visible trend of decreasing regression along with the improvement of soil conditions, but in this case, it should be noted that the range of estimated losses (in ADMS) is also decreasing, and the number of samples is also reduced, since light soils are the most common in the studied regions.
When examining the relationship between farmers’ declarations and the state of vegetation (Figure 7), there are no cause-and-effect relationships observed. The course of the regression function is similar to the asymptote, and the values of the determination coefficient and the image of data spread on the chart suggest that the relationships between vegetation index and the yield are random.

4. Discussion

4.1. Farmers’ Position on the Yield Loss Assessment

The results presented in the paper clearly show the lack of an objective assessment of losses resulting from agricultural drought, declared by farmers in their applications for direct financial aid related to drought occurrence. The lack of objectivity in these assessments is indicated by the presented results of the comparison of farmers’ declarations with the losses estimated by the monitoring system, but also based on the statistical data published later on by Statistics Poland [30]. At the time of preparing this study, the exact data on agricultural production in 2021 were not available yet, but the preliminary assessment performed by Statistics Poland indicates a reduction in yields only by approx. 3% compared to 2020, which, considering recent years, has achieved record-breaking crop production results [31]. However, in view of the above, the question arises why farmers overestimate their losses so much and why the declarations differ so much even between adjacent crops. There can be many reasons, but the main reason for overestimating losses seems to be the criteria that must be met in order to be entitled to state aid—the criterion is simply to prove that the loss in farm income amounted to at least 30%. In the analyzed region, the drought occurred in June, which mainly caused losses in cereal crops. Lower losses were observed for other crop species, e.g., maize and sugar beet [12]. It means that on farms with diversified crop production and farms with livestock production, the criteria for drought aid can be met only if large losses are demonstrated in the production of cereals. Farmers owning this type of farms, aware of the limitations, had to take the risk of declaring overestimated losses, in some cases reaching the absurd level of 100%, in order to actively seek the financial support. This type of abuse is also favored by the application mechanism, since the loss is only declarative, and the farmer does not have to submit any documentation proving the validity of such an assessment. Farmers usually do not keep complete accounting records of their agricultural activity, making it impossible to investigate the losses by comparing farm incomes in several consecutive years.

4.2. Implementation of Remote Sensing in Crop Monitoring

Satellite remote sensing is seen as one of the possible methods of drought loss validation, which allows for direct observation of all arable fields [32,33]. Its high effectiveness in crop monitoring, especially in case of high-resolution satellite remote sensing, is demonstrated by the results of many scientific and implementation works. Possibilities of estimating the wheat yield on the basis of vegetation indices developed thanks to the Sentinel-2 satellite images are presented, among others, in the works of [27,29,34,35]. The authors show that in the studied experimental fields, a statistically significant regression can be demonstrated between the index (most often NDVI) and the yield or another evaluation parameter related to the condition and state of vegetation (e.g., SPAD, LAI, number of ears in the stocking, etc.). In the studied cases, the coefficients of determination most often obtained high values exceeding 0.6. However, there were also presented agricultural plots with lower values, e.g., reference [28].
However, estimating yield losses as compared to yields alone is a more complicated process, because the concept of a ‘loss’ can be defined in a number of ways [36]. In the case of drought, losses will depend, as it was presented in this study, not only on soil conditions, but also to a large extent on the farming technique, which should be adapted to the yield assumed [37,38]. Hence, a situation may occur where in the neighboring fields, with the same crop species, a high yield was assumed in one farm (e.g., 10 t/ha), and, as a result of drought, only 7 t/ha was harvested, whilst in a neighboring farm, focused on a different (e.g., organic) production system, the yield of 5 t/ha was assumed and the harvest resulted in 4.5 t/ha only. In the first case, despite a much larger harvest, the yield loss amounts to 30%, and in the second case, it amounts only to 10%. This example shows the possibility of non-linear relationships between the severity of drought, the expenses incurred on farming and the yield. Many of such examples were observed during the field inspection in the West Pomeranian voivodeship in 2021, which was carried out by the institution running ADMS, at the request of farmers. Figure 8, which shows the image (Sentinel-2) of the course of vegetation at four dates for two adjacent fields with winter triticale cultivation may be a good example. Differences in the condition of these crops are visible both in the RGB image as well as when comparing the average NDVI values and are related to different farming system. The better condition of the cultivated crop (on the left), which also tolerated the drought in June better, can be explained exactly by farming technique limiting the impact of drought. In this field, fertilization with manure and favorable rotation with rapeseed was used. However, this example provides also the most surprising farmers’ declarations. In both cases, farmers indicated the same value of the expected yield (6 t/ha), which is already surprising since, as mentioned above, the differences in farming technique used were significant. However, in an independent survey, the farmer cultivating a field using a worse technique declared a lower loss (30%) than the farmer applying better selected treatments (declaring a loss of 50%). This example illustrates the subjectivity in the assessments performed by farmers—their declarations were observed to be contradictory both in terms of the relationship between drought loss and agro-technics and in terms of the possible amount of this loss in relation to the condition of plants (high NDVI values) demonstrated in the satellite image.
The above factors influencing the differentiation of plant condition locally, and thus the results of the assessment carried out with remote sensing methods, are the main reason for showing a weak correlation between the potential loss (modelled in ADMS) and the NDVI index (Figure 6). However, it should also be noted that when examining the relationship between the actual condition of crops and the farmers’ declarations, no correlation was found (R2 0.04–0.1). This result confirms the previously discussed premises inciting farmers to overestimate the effects of drought. The results of the analysis based on the satellite images also show the possibility of partial verification of farmers’ declarations: in this case, remote sensing enables the identification of agricultural parcels where the cultivated crop was in good condition, which allows us to exclude the possibility of such high losses as declared. In the case of remote sensing methods, it should also be emphasized that all agricultural plots (the entire population in the analyzed data collection), and not only selected samples, can be monitored.

5. Conclusions

Based on the results of this work, the following conclusions can be drawn:
  • Farmers’ declarations regarding assessment of drought effects on their fields are disproportionately high compared to the monitoring results (ADMS). The values of these losses do not significantly correlate with the monitoring carried out on the basis of meteorological observations or with the direct observations of the fields by remote methods.
  • Assessment of yield losses conducted by farmers is also burdened with a large dispersion of values, both in areas with high and low losses.
Such large differences in the assessment of losses, both among the farmers themselves and in relation to the conducted monitoring, suggest a low credibility of this type of declaration and the lack of objectivity in the assessment performed.
In connection with the above, the key postulates for the further development of the Agricultural Drought Monitoring System can be formulated, which are as follows:
  • Development of methods for estimating the impact of drought on crops based on unambiguous criteria—it should be based on the latest technologies and ability to obtain high (spatial and temporal) resolution data for estimating potential losses resulting from direct water shortage in the soil. Currently, the fastest developing technologies are: terrestrial remote sensing (networks of meteorological radar stations), meteorological satellites and the possibility of mapping soil variability using remote sensing methods [39,40,41,42]. In the above assumption, attention should be paid to the indication of the ‘potential’ loss, i.e., the loss whose values will be observed in fields with the appropriately selected farming technique—tailored both to the nature of the field location (soil, topography), as well as to the assumed production intensity and cultivation method. Using the definition of potential loss, the support system (Government Drought Application) can indicate, in the most objective way, regions in which farmers are entitled to financial aid related to the drought disaster. This approach also eliminates the unfavorable diversification, which may take place if the loss assessment is based on direct remote sensing of crops. In such a case, the paradox described above may occur, when the support is granted to producers who assume high yields with too low expenditure on means of production or who ignore the recommendations on implementing practices limiting the effects of drought, and, in extreme cases, neglect farming technique, leading to soil impoverishment.
  • Development of satellite remote sensing methods—direct observation of crops using remote sensing methods, in key growing seasons, provides information on the impact of various factors on the condition of plants. In the case of drought monitoring, it provides two types of information for the assessment of crop losses in the studied region. First of all, it can be used to assess the development of vegetation throughout the growing season and, thanks to this, make it possible to incorporate other factors that cause yield losses in crops (freezing, drench, hail, etc.), which allows us to avoid situations where the final loss of the crop yield is indicated by farmers as drought-related only. Secondly, thanks to remote sensing, it is possible to locally assess the diversity of farming techniques by comparing the fields with cultivation of the same plant species in similar soil conditions. Recognition of the scale of real differentiation in the condition of crops in the studied region may also bring tangible benefits to the monitoring system itself, since the best kept fields can be indicated as reference fields for the following:
    Monitoring system—when analyzing regression relationships between the drought index (meteorological and soil) and the vegetation index;
    Farmers—in terms of guidelines for selecting the best farming practices (limiting the effects of drought);
    Administrative support policy—both when estimating the amount of compensation and for promoting the implementation of good practices in regions prone to frequent agricultural drought.
The presented results have a direct impact on the planning and implementation of the support policy for farmers, developed by the Ministry of Agriculture. Additionally, the implementation of satellite remote sensing is a form of further development of ADMS, expected by the government administration.

Author Contributions

Conceptualization, A.J., P.K., A.D. and R.P.; methodology, A.J. and R.P.; software, A.J.; validation, A.J. and R.P.; formal Analysis, A.J. and R.P.; investigation, A.J.; Resources, A.J. and R.P.; data Curation, A.J.; writing—original draft preparation, A.J., P.K., A.D. and R.P.; writing—review and editing, A.J. and R.P.; visualization, A.J.; supervision, R.P. All authors have read and agreed to the published version of the manuscript.

Funding

The research was funded by the Ministry of Agriculture and Rural Development, project “Drought monitoring system in Poland” (contract no. KS.wk.42.1.2021).

Institutional Review Board Statement

Not applicable.

Informed Consent Statement

Informed consent was obtained from all subjects involved in the study.

Data Availability Statement

Not applicable.

Acknowledgments

The authors would like to thank Małgorzata Wydra for the linguistic revision of the article.

Conflicts of Interest

The authors declare no conflict of interest.

References

  1. Posuch Project. Available online: http://posucha.imgw.pl/ (accessed on 7 March 2022).
  2. Drought–Portal Gov.pl. Available online: https://www.gov.pl/web/susza/susza (accessed on 7 March 2022).
  3. Jadczyszyn, J.; Łopatka, A.; Wróblewska, E.; Stuczyński, T.; Mizak, K.; Pudełko, R.; Kozyra, J.; Doroszewski, A.; Koza, P.; Górski, T. Fundamentals of the agricultural drought monitoring system [in Polish—Podstawy systemu monitoringu suszy rolniczej]. Woda-Środowisko-Obszary Wiej. 2012, 12, 77–91. [Google Scholar]
  4. Doroszewski, A.; Jadczyszyn, J.; Kozyra, J.; Pudelko, R.; Stuczynski, T.; Mizak, K.; Lopatka, A.; Koza, P. Agricultural drought monitoring system in Poland [in Polish—System monitoringu suszy rolniczej w Polsce]. Wieś Jutra 2011, 7–8, 37–42. [Google Scholar]
  5. Doroszewski, A.; Kozyra, J.; Pudelko, R.; Stuczynski, T.; Jadczyszyn, J.; Koza, P.; Lopatka, A. Monitoring of agricultural drought in Poland [in Polish—Monitoring suszy rolniczej w Polsce]. Wiadomości Melior. I Łąkarskie 2008, 51, 35–38. [Google Scholar]
  6. Regulation of the Council of Ministers on 3 June 2020 the Regulation on the Detailed Scope and Method of Implementation of Certain Tasks of the Agency for Restructuring and Modernisation of Agriculture. Available online: https://isap.sejm.gov.pl/isap.nsf/DocDetails.xsp?id=WDU20200001009 (accessed on 7 March 2022). (In Polish)
  7. Regulation of the Council of Ministers on 27.01.2015 on the Detailed Scope and Method of Implementation of Certain Tasks of the Agency for Restructuring and Modernisation of Agriculture. Available online: https://isap.sejm.gov.pl/isap.nsf/DocDetails.xsp?id=WDU20150000187 (accessed on 7 March 2022). (In Polish)
  8. Government Drought Application—Ministry of Agriculture and Rural Development—Portal Gov.pl. Available online: https://www.gov.pl/web/rolnictwo/aplikacja-suszowa (accessed on 7 March 2022).
  9. Estimating Crop Losses Due to Drought in 2021—Drought—Portal Gov.pl. Available online: https://www.gov.pl/web/susza/szacowanie-strat-w-uprawach-rolnych-spowodowanych-wystapieniem-suszy-w-2021-r (accessed on 7 March 2022).
  10. Pudelko, R.; Kozyra, J.; Mizak, K.; Nieróbca, A.; Doroszewski, A.; Świtaj, Ł.; Jóźwicki, T. Low altitude remote sensing of agricultural drought. Agrometeorol. Res. 2010, 6, 56. [Google Scholar]
  11. Szewczak, K.; Łoś, H.; Pudełko, R.; Doroszewski, A.; Gluba, Ł.; Łukowski, M.; Rafalska-Przysucha, A.; Słomiński, J.; Usowicz, B. Agricultural Drought Monitoring by MODIS Potential Evapotranspiration Remote Sensing Data Application. Remote Sens. 2020, 12, 3411. [Google Scholar] [CrossRef]
  12. ADMS—Potential Zones of Drought. Available online: https://susza.iung.pulawy.pl/en/mapy/ (accessed on 7 March 2022).
  13. Górski, T.; Demidowicz, G.; Deputat, T.; Górska, K.; Krakowiak, A.; Marcinkowska, I.; Spoz-Pać, W. Empirical model of winter wheat yield as a function of meteorological factors [in Polish—Empiryczny model plonowania pszenicy ozimej w funkcji czynników meteorologicznych]. Zesz. Nauk. AR Wroc. 1997, 313, 99–109. [Google Scholar]
  14. Demidowicz, G.; Doroszewski, A.; Gorski, T. A method for evaluating of crop yield losses due to the precipitation shortage [in Polish - Metodyka szacunku strat w produkcji roślinnej powodowanych deficytem opadów]. Rocz. Akad. Rol. w Pozn. Melior. I Inżynieria Środowiska 1997, 17, 233–243. [Google Scholar]
  15. Mizak, K.; Pudelko, R.; Kozyra, J.; Nierobca, A.; Doroszewski, A.; Switaj, L.; Lopatka, A. Results of monitoring agricultural drought in winter wheat crops in Poland in the yeras 2008-2010 [in Polish—Wyniki monitoringu suszy rolniczej w uprawach pszenicy ozimej w Polsce w latach 2008–2010]. Woda-Środowisko-Obsz. Wiej. 2011, 11, 95–107. [Google Scholar]
  16. ADMS—Crop and Soils Specific Climatic Water Balance Levels Indicated Crop Drought Conditions. Available online: https://susza.iung.pulawy.pl/en/progi/ (accessed on 7 March 2022).
  17. ADMS—Soil Categories. Available online: https://susza.iung.pulawy.pl/en/kategorie/ (accessed on 7 March 2022).
  18. ADMS—Reporting Periods of Drought Risk Analysis. Available online: https://susza.iung.pulawy.pl/en/raporty/ (accessed on 7 March 2022).
  19. Doroszewski, A.; Pudełko, R.; Jędrejek, A.; Koza, P.; Purchała, L. Preparation of simplified methods for determining crop production areas affected by natural disasters or unfavourable weather conditions. In Analiza Popytu I Podaży; Soliwoda, M., Ed.; IERiGŻ PIB Warszawa: Warszawa, Poland, 2021; pp. 511–587. ISBN 0000000274098. (In Polish) [Google Scholar]
  20. NUTS—Nomenclature of Territorial Units for Statistics—Eurostat. Available online: https://ec.europa.eu/eurostat/web/nuts/background (accessed on 7 March 2022).
  21. Tucker, C.J. Red and Photographic Infrared Linear Combinations for Monitoring Vegetation. Remote Sens. Environ. 1979, 8, 127–150. [Google Scholar] [CrossRef] [Green Version]
  22. ADMS—Map of Soil Categories. Available online: https://susza.iung.pulawy.pl/en/mapa-kategorii/ (accessed on 7 March 2022).
  23. Leys, C.; Ley, C.; Klein, O.; Bernard, P.; Licata, L. Detecting outliers: Do not use standard deviation around the mean, use absolute deviation around the median. J. Exp. Soc. Psychol. 2013, 49, 764–766. [Google Scholar] [CrossRef] [Green Version]
  24. Vannoppen, A.; Gobin, A.; Kotova, L.; Top, S.; De Cruz, L.; Viksna, A.; Aniskevich, S.; Bobylev, L.; Buntemeyer, L.; Caluwaerts, S.; et al. Wheat Yield Estimation from NDVI and Regional Climate Models in Latvia. Remote Sens. 2020, 12, 2206. [Google Scholar] [CrossRef]
  25. Wang, Q.; Li, J.; Jin, T.; Chang, X.; Zhu, Y.; Li, Y.; Sun, J.; Li, D. Comparative Analysis of Landsat-8, Sentinel-2, and GF-1 Data for Retrieving Soil Moisture over Wheat Farmlands. Remote Sens. 2020, 12, 2708. [Google Scholar] [CrossRef]
  26. Mashonganyika, F.; Mugiyo, H.; Svotwa, E.; Kutywayo, D. Mapping of Winter Wheat Using Sentinel-2 NDVI Data. A Case of Mashonaland Central Province in Zimbabwe. Front. Clim. 2021, 3, 137. [Google Scholar] [CrossRef]
  27. Panek, E.; Gozdowski, D. Analysis of relationship between cereal yield and NDVI for selected regions of Central Europe based on MODIS satellite data. Remote Sens. Appl. Soc. Environ. 2020, 17, 100286. [Google Scholar] [CrossRef]
  28. Panek, E.; Gozdowski, D.; Stępień, M.; Samborski, S.; Ruciński, D.; Buszke, B. Within-field relationships between satellite-derived vegetation indices, grain yield and spike number of winter wheat and triticale. Agronomy 2020, 10, 1842. [Google Scholar] [CrossRef]
  29. Jelínek, Z.; Kumhálová, J.; Chyba, J.; Wohlmuthová, M.; Madaras, M.; Kumhála, F. Landsat and Sentinel-2 images as a tool for the effective estimation of winterand spring cultivar growth and yield prediction in the Czech Republic. Int. Agrophys. 2020, 34, 391–406. [Google Scholar] [CrossRef]
  30. Statistics Poland. Available online: https://stat.gov.pl/en/ (accessed on 10 March 2022).
  31. Statistics Poland—Resulting Estimate of the Main Agricultural and Horticultural Crops in 2021. Available online: https://stat.gov.pl/obszary-tematyczne/rolnictwo-lesnictwo/uprawy-rolne-i-ogrodnicze/wynikowy-szacunek-glownych-ziemioplodow-rolnych-i-ogrodniczych-w-2021-roku,5,20.html (accessed on 10 March 2022).
  32. Varghese, D.; Radulović, M.; Stojković, S.; Crnojević, V. Reviewing the Potential of Sentinel-2 in Assessing the Drought. Remote Sens. 2021, 13, 3355. [Google Scholar] [CrossRef]
  33. Jindo, K.; Kozan, O.; Iseki, K.; Maestrini, B.; van Evert, F.K.; Wubengeda, Y.; Arai, E.; Shimabukuro, Y.E.; Sawada, Y.; Kempenaar, C. Potential utilization of satellite remote sensing for field-based agricultural studies. Chem. Biol. Technol. Agric. 2021, 8, 58. [Google Scholar] [CrossRef]
  34. Henriques, H.J.R.; Schwambach, D.A.; Fernandes, V.J.M.; Cortez, J.W. Vegetation indices and their correlation with second-crop corn grain yield in mato grosso do sul, Brazil. Rev. Bras. Milho E Sorgo 2021, 20, 13. [Google Scholar] [CrossRef]
  35. Segarra, J.; Araus, J.L.; Kefauver, S.C. Farming and Earth Observation: Sentinel-2 data to estimate within-field wheat grain yield. Int. J. Appl. Earth Obs. Geoinf. 2022, 107, 102697. [Google Scholar] [CrossRef]
  36. Jevtić, R.; Župunski, V.; Lalošević, M.; Župunski, L. Predicting potential winter wheat yield losses caused by multiple disease systems and climatic conditions. Crop Prot. 2017, 99, 17–25. [Google Scholar] [CrossRef]
  37. Wójcik-Gront, E.; Iwańska, M.; Wnuk, A.; Oleksiak, T. The Analysis of Wheat Yield Variability Based on Experimental Data from 2008–2018 to Understand the Yield Gap. Agriculture 2021, 12, 32. [Google Scholar] [CrossRef]
  38. Pepo, P. Role of genotypes and agrotechnical elements in cereal crop models. Cereal Res. Commun. 2011, 39, 160–167. [Google Scholar] [CrossRef]
  39. Roznik, M.; Boyd, M.; Porth, L. Improving crop yield estimation by applying higher resolution satellite NDVI imagery and high-resolution cropland masks. Remote Sens. Appl. Soc. Environ. 2022, 25, 100693. [Google Scholar] [CrossRef]
  40. Vannoppen, A.; Gobin, A. Estimating Farm Wheat Yields from NDVI and Meteorological Data. Agronomy 2021, 11, 946. [Google Scholar] [CrossRef]
  41. Segarra, J.; González-Torralba, J.; Aranjuelo, Í.; Araus, J.L.; Kefauver, S.C. Estimating Wheat Grain Yield Using Sentinel-2 Imagery and Exploring Topographic Features and Rainfall Effects on Wheat Performance in Navarre, Spain. Remote Sens. 2020, 12, 2278. [Google Scholar] [CrossRef]
  42. Vergara-Diaz, O.; Kefauver, S.C.; Elazab, A.; Nieto-Taladriz, M.T.; Araus, J.L. Grain yield losses in yellow-rusted durum wheat estimated using digital and conventional parameters under field conditions. Crop J. 2015, 3, 200–210. [Google Scholar] [CrossRef] [Green Version]
Figure 1. Scheme of information flow in the Government Drought Application. Source: own elaboration (IUNG-PIB).
Agriculture 12 00536 g001
Figure 2. Flowchart of the development process for generating yield loss maps in the Agricultural Drought Monitoring System (ADMS). Source: own study (IUNG-PIB).
Agriculture 12 00536 g002
Figure 3. ADMS Map of estimated yield losses of winter cereals caused by drought—average losses on soils of the 1st category of susceptibility to drought for districts in 2021. The red arrow points to the Białogard district; the blue arrow points to the Wałecki district. Source: own study (IUNG-PIB).
Agriculture 12 00536 g003
Figure 4. Yield reduction in winter cereals grown in soils of the 1st category of soil drought vulnerability depending on the CWB values. Source: own study (IUNG-PIB).
Agriculture 12 00536 g004
Figure 5. (A) Comparison of farmers’ declarations with the ADMS results for losses incurred in fields with winter wheat cultivation—in the West Pomeranian Voivodeship. (B) Comparison of farmers’ declarations with the ADMS results for losses incurred in fields with winter wheat cultivation in the following districts: Białogard (the most severe drought in the West Pomeranian Voivodeship) and Wałcz (the least severe drought). Source: own study (IUNG-PIB).
Agriculture 12 00536 g005
Figure 6. Regression between NDVI values and ADMS results. Source: own study (IUNG-PIB).
Agriculture 12 00536 g006
Figure 7. Regression between NDVI values and Farmers’ declarations. Source: own study (IUNG-PIB).
Agriculture 12 00536 g007
Figure 8. Comparison of adjacent fields with triticale cultivation using different farming techniques: field on the left—fertilization with manure, rapeseed-cereal rotation; field on the right—mineral fertilization, cereal-cereal rotation. In both cases, the farmer assumed a yield of 6 t/ha. Source: own study (IUNG-PIB).
Agriculture 12 00536 g008
Publisher’s Note: MDPI stays neutral with regard to jurisdictional claims in published maps and institutional affiliations.

