Figure 1.
Effects of N regime in the main crop on the yield of the main crop (A–C), ratoon crop (D–F), and both seasons (G–I). Error bars are ±SE. Note: LN, low N rate (the total amount of N applied was 100 kg ha−1); MN, medium N rate (the total amount of N applied was 250 kg ha−1); HN, high N rate (the total amount of N applied was 400 kg ha−1). PN30, PN40, PN50, and PN60 correspond to N application ratios of basal tillering fertilizer to panicle fertilizer of 7:3, 6:4, 5:5, and 4:6, respectively. The different lowercase letters at the same N application rate indicate significant differences at the 5% probability level according to LSD tests.
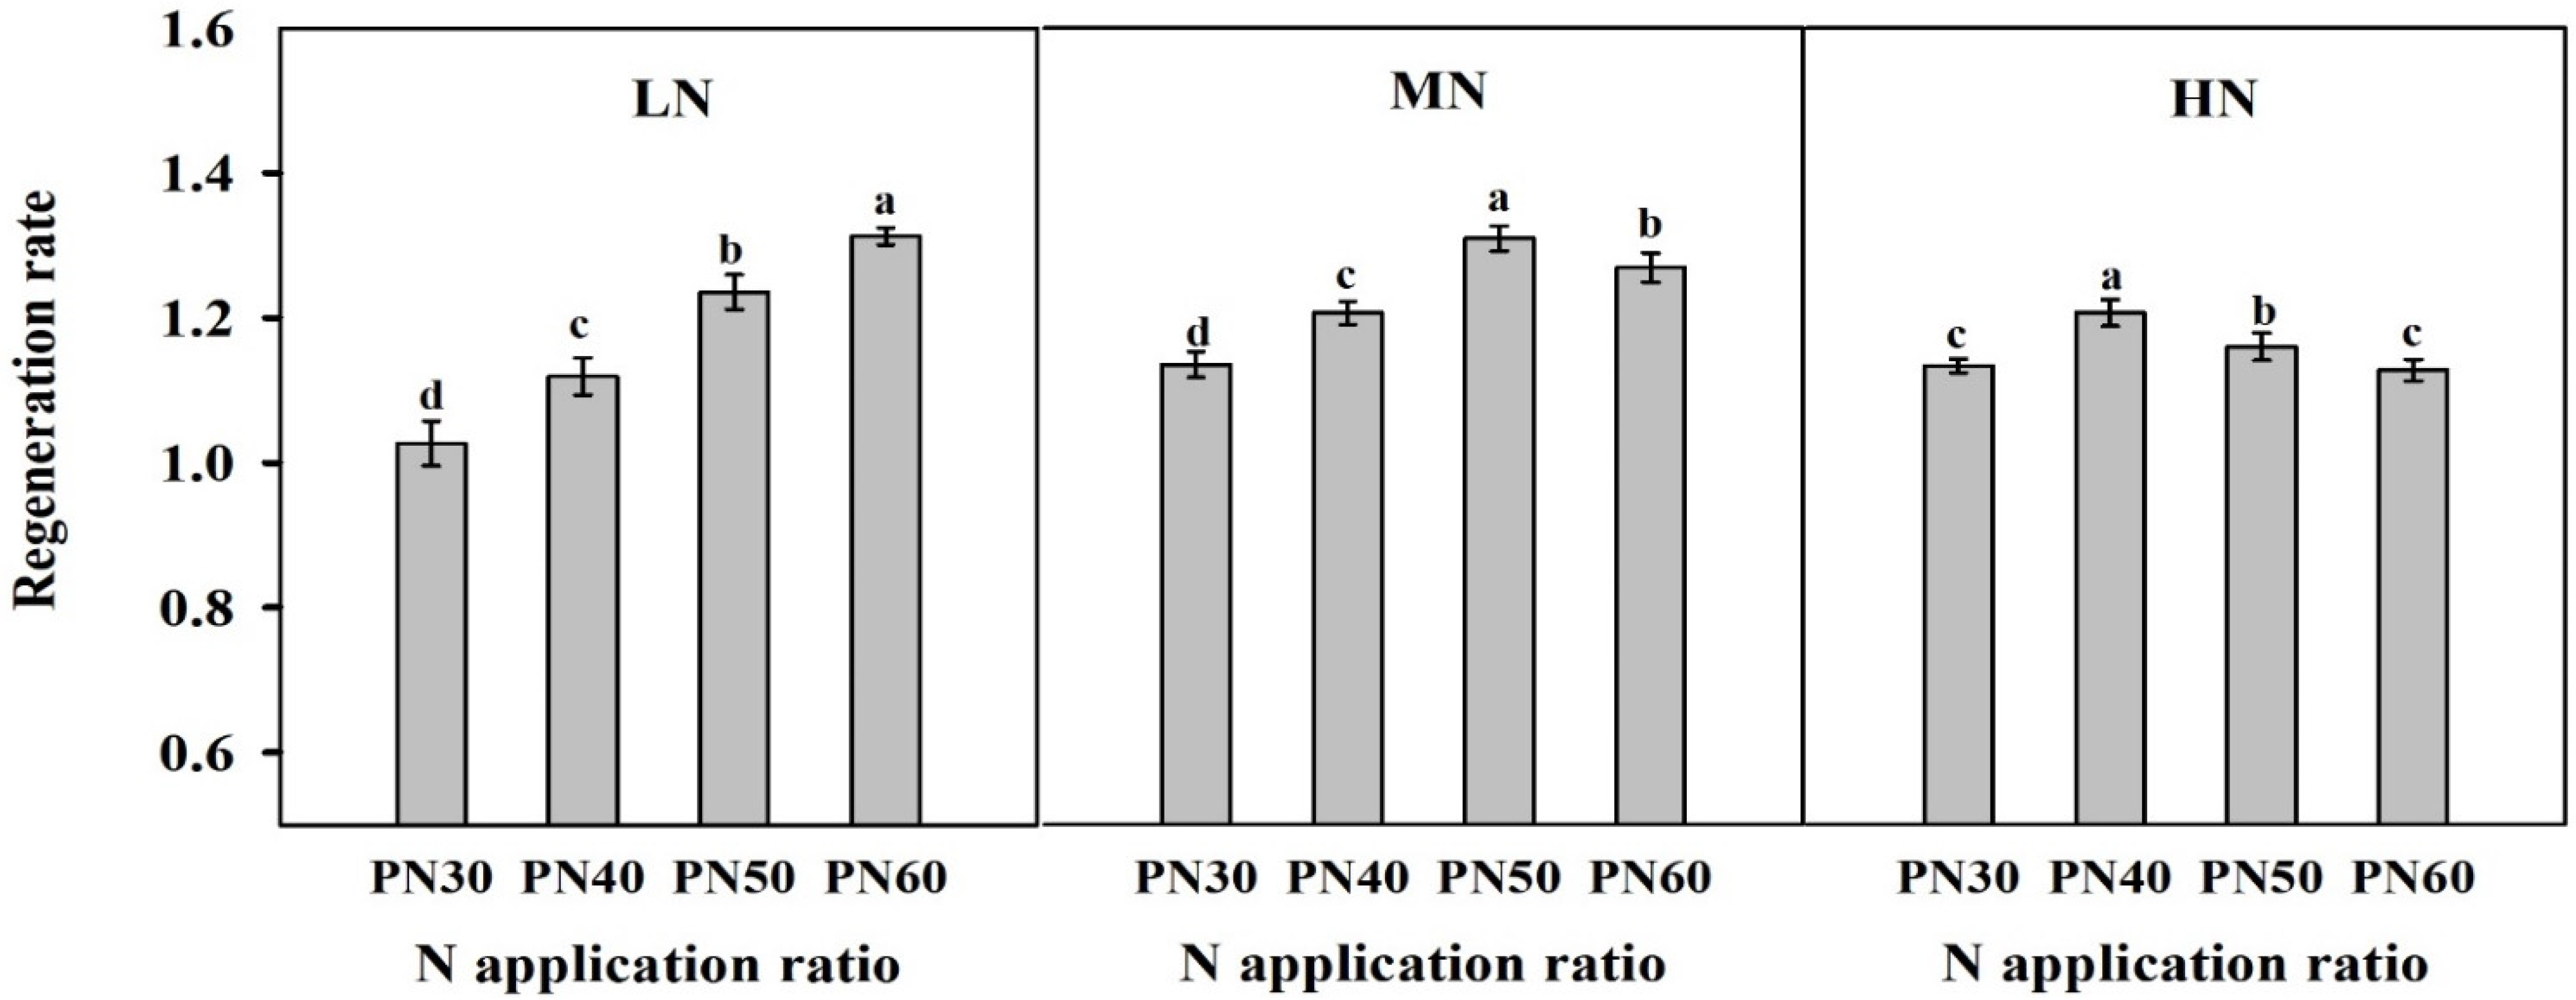
Figure 2.
Effects of N rate and the ratio of the main crop on the regeneration rate. Error bars are ± SE. Note: LN, low N rate (the total amount of N applied was 100 kg ha−1); MN, medium N rate (the total amount of N applied was 250 kg ha−1); HN, high N rate (the total amount of N applied was 400 kg ha−1). PN30, PN40, PN50, and PN60 correspond to N application ratios of basal tillering fertilizer to panicle fertilizer of 7:3, 6:4, 5:5, and 4:6, respectively. The different lowercase letters at the same growth stage indicate significant differences at the 5% probability level according to the LSD test.
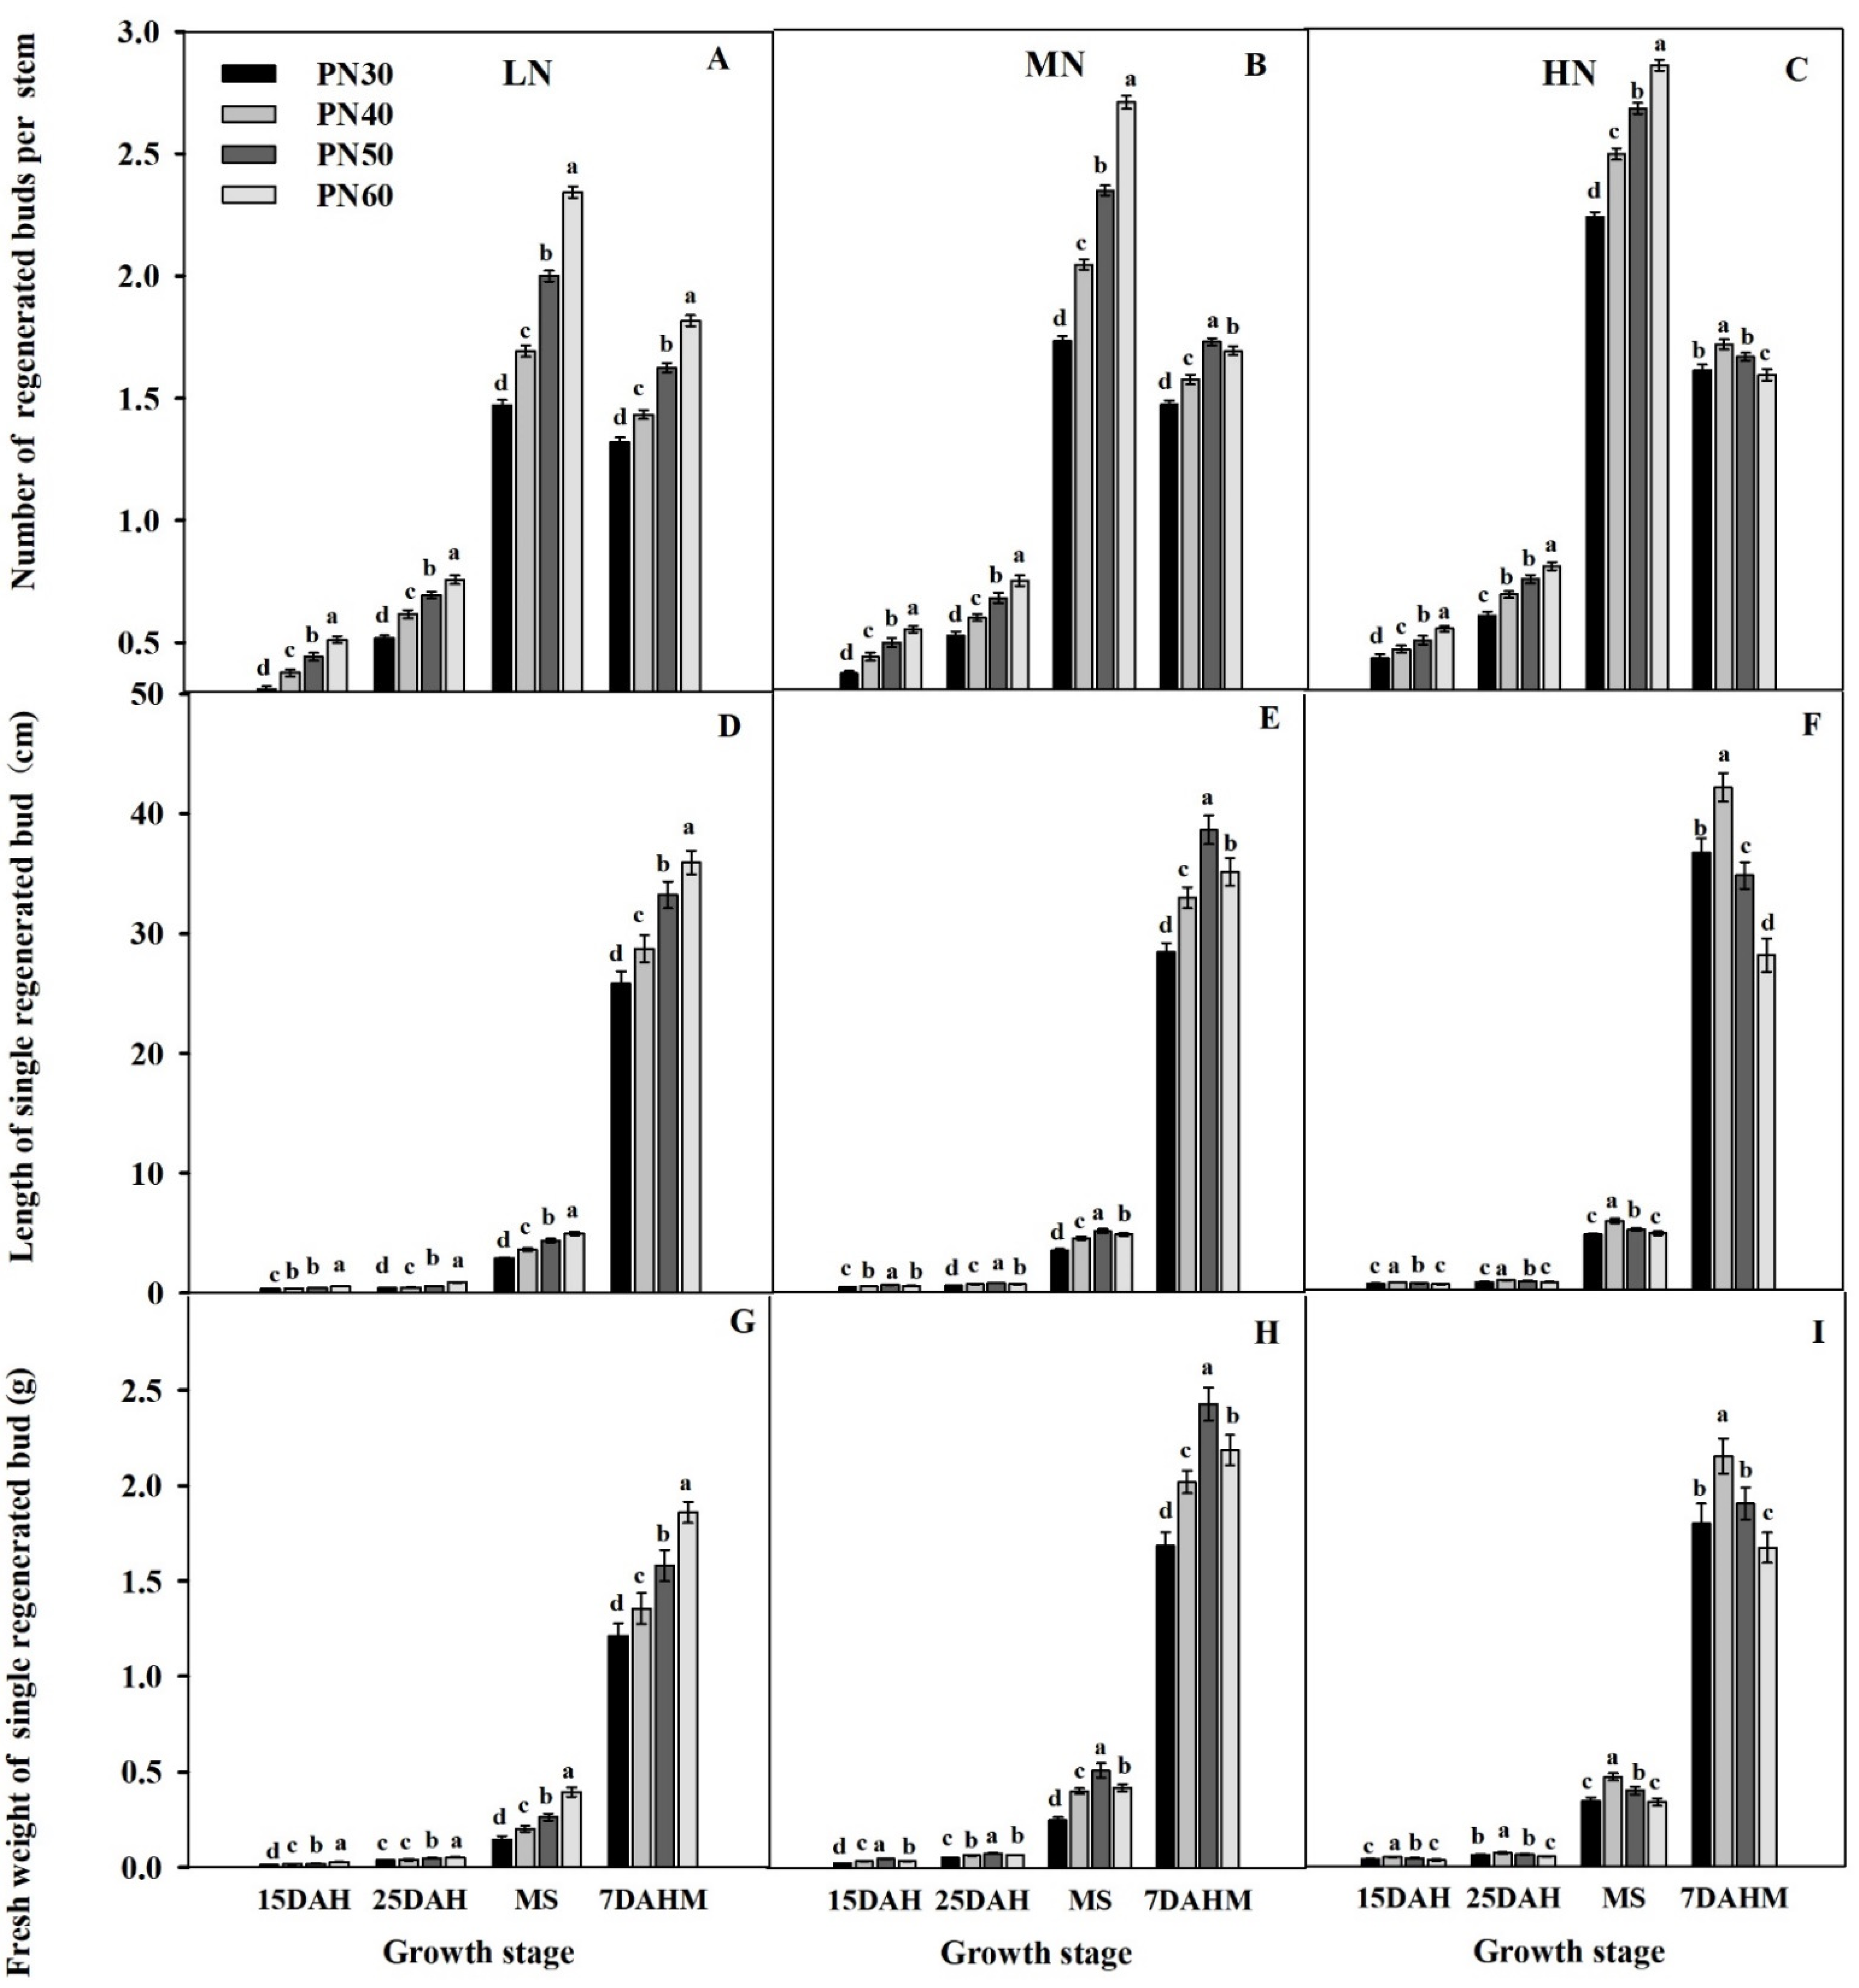
Figure 3.
Effects of N rate and the ratio of the main crop on the number (A–C), length (D–F), and fresh weight (G–I) of regenerated buds. Error bars are ± SE. Note: LN, low N rate (the total amount of N applied was 100 kg ha−1); MN, medium N rate (the total amount of N applied was 250 kg ha−1); HN, high N rate (the total amount of N applied was 400 kg ha−1). PN30, PN40, PN50, and PN60 correspond to N application ratios of basal tillering fertilizer to panicle fertilizer of 7:3, 6:4, 5:5, and 4:6, respectively. DAH, days after heading of the main crop. MS, maturity stage of the main crop. DAHM, days after harvest of the main crop. The different lowercase letters at the same growth stage indicate significant differences at the 5% probability level according to the LSD test.
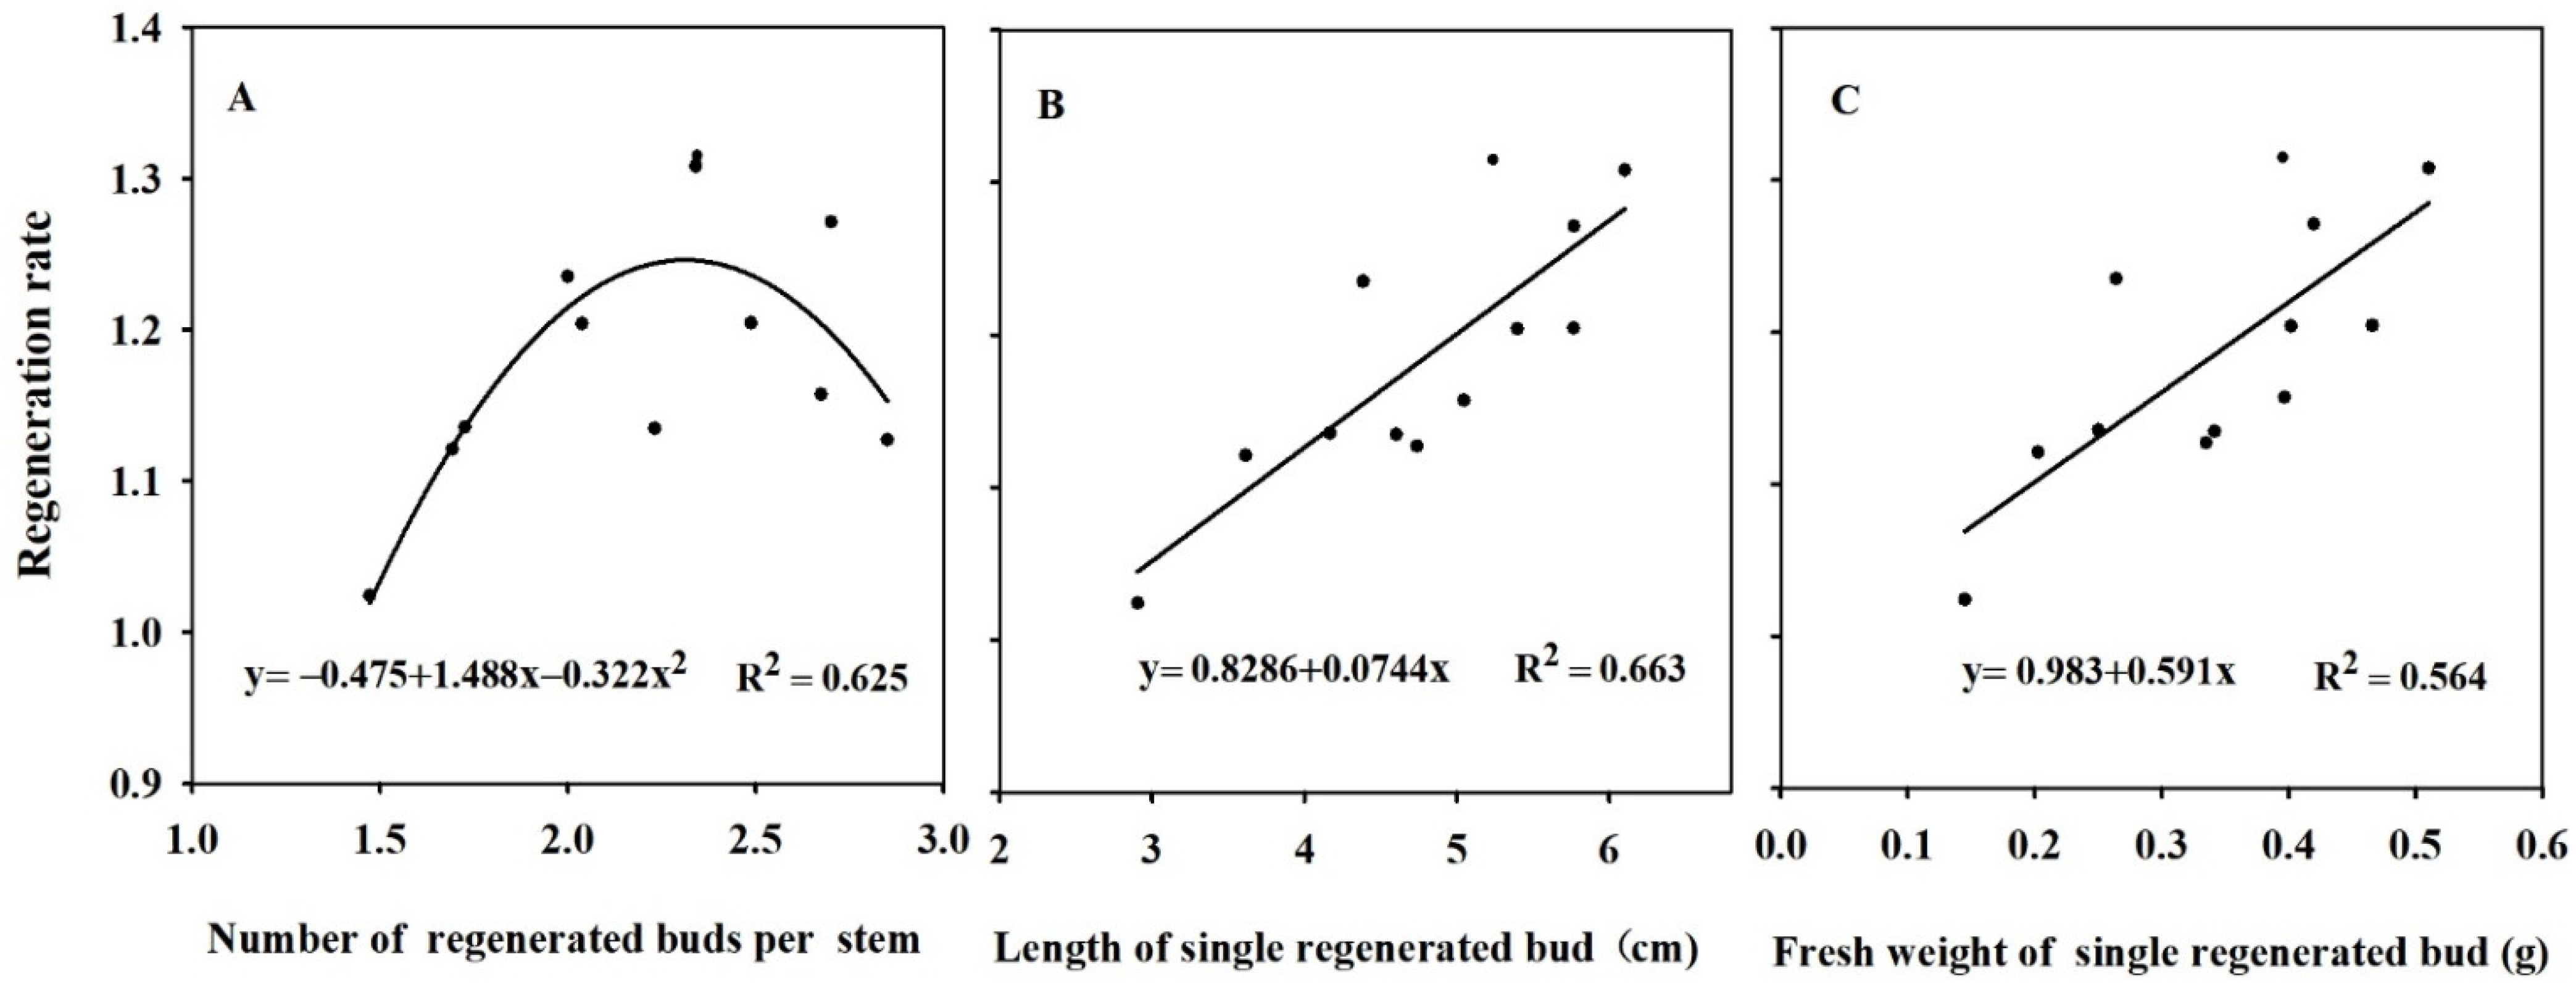
Figure 4.
Relationships between the number (A), length (B), and fresh weight (C) of regenerated buds at maturity of the main crop and the regeneration rate.
Figure 4.
Relationships between the number (A), length (B), and fresh weight (C) of regenerated buds at maturity of the main crop and the regeneration rate.
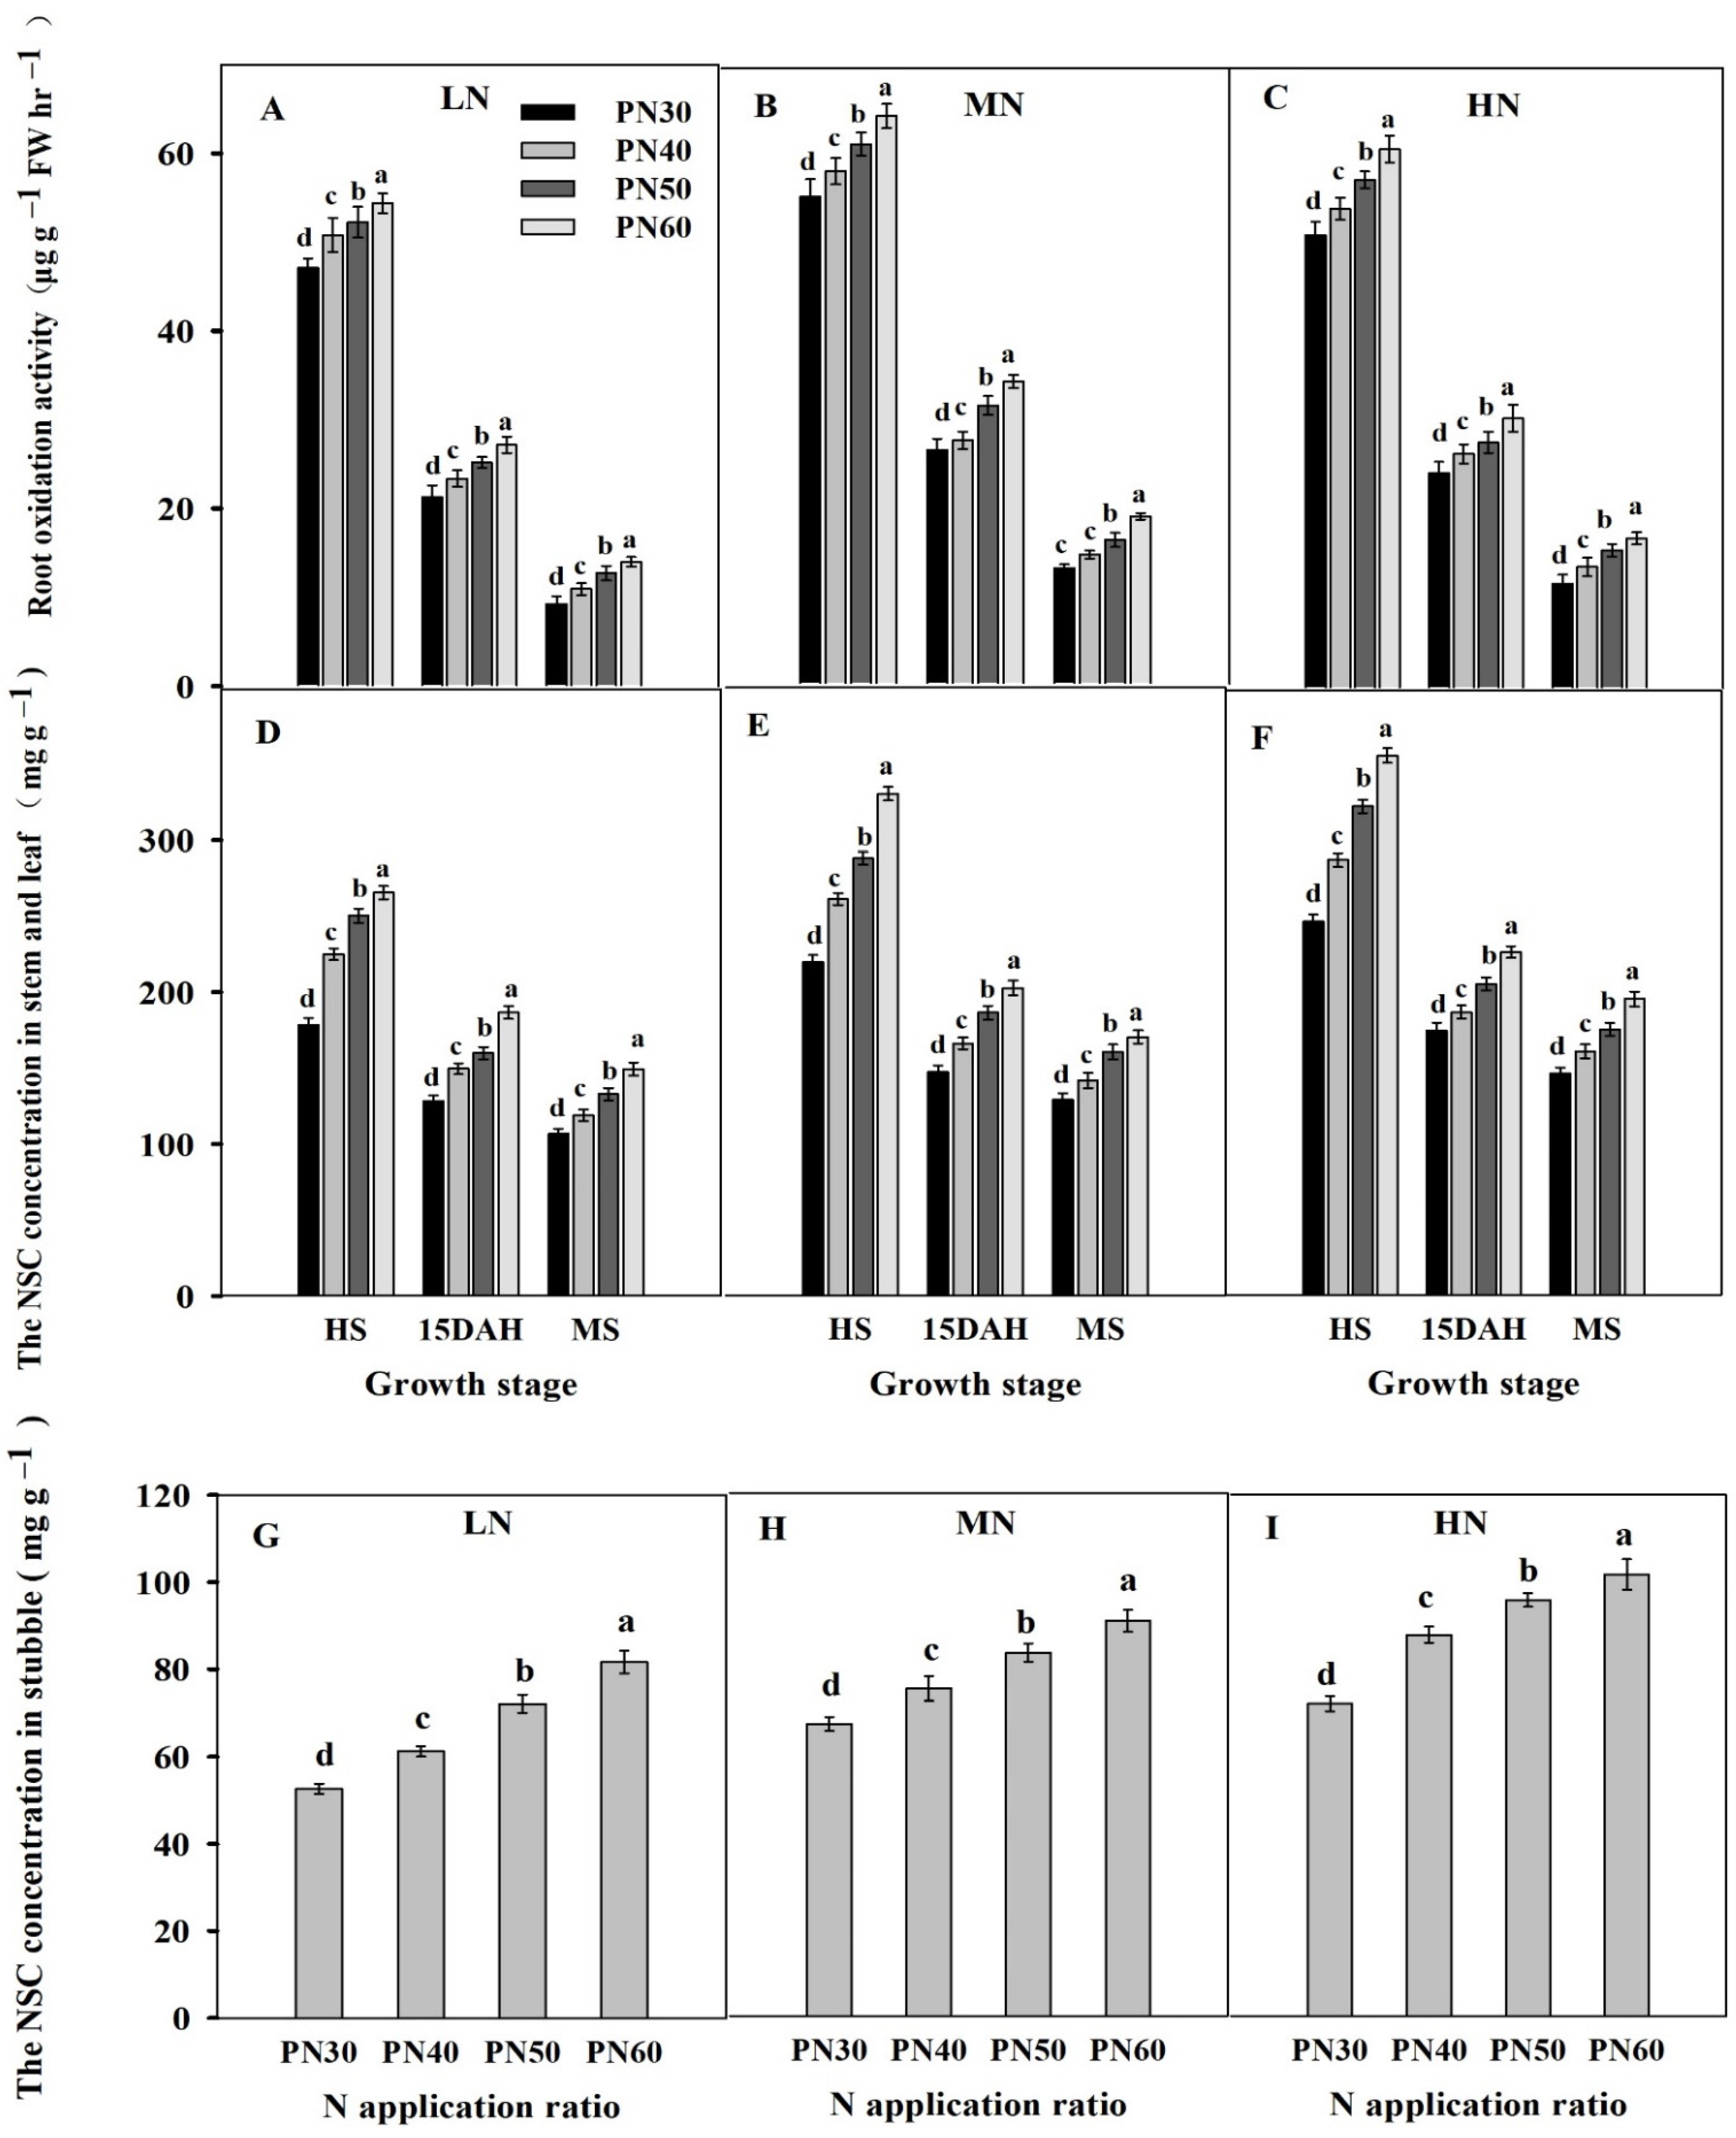
Figure 5.
Effects of N rate and the ratio of the main crop on root oxidation activity (A–C), NSC concentration in the stem and leaf (D–F) after heading of the main crop and in the stubble (G–I). Error bars are ± SE. Note: LN, low N rate (the total amount of N applied was 100 kg ha−1); MN, medium N rate (the total amount of N applied was 250 kg ha−1); HN, high N rate (the total amount of N applied was 400 kg ha−1). PN30, PN40, PN50, and PN60 correspond to N application ratios of basal tillering fertilizer to panicle fertilizer of 7:3, 6:4, 5:5, and 4:6, respectively. HS, full heading stage of the main crop. DAH, days after heading of the main crop. MS, maturity stage of the main crop. The different lowercase letters at the same growth stage indicate significant differences at the 5% probability level according to the LSD test.
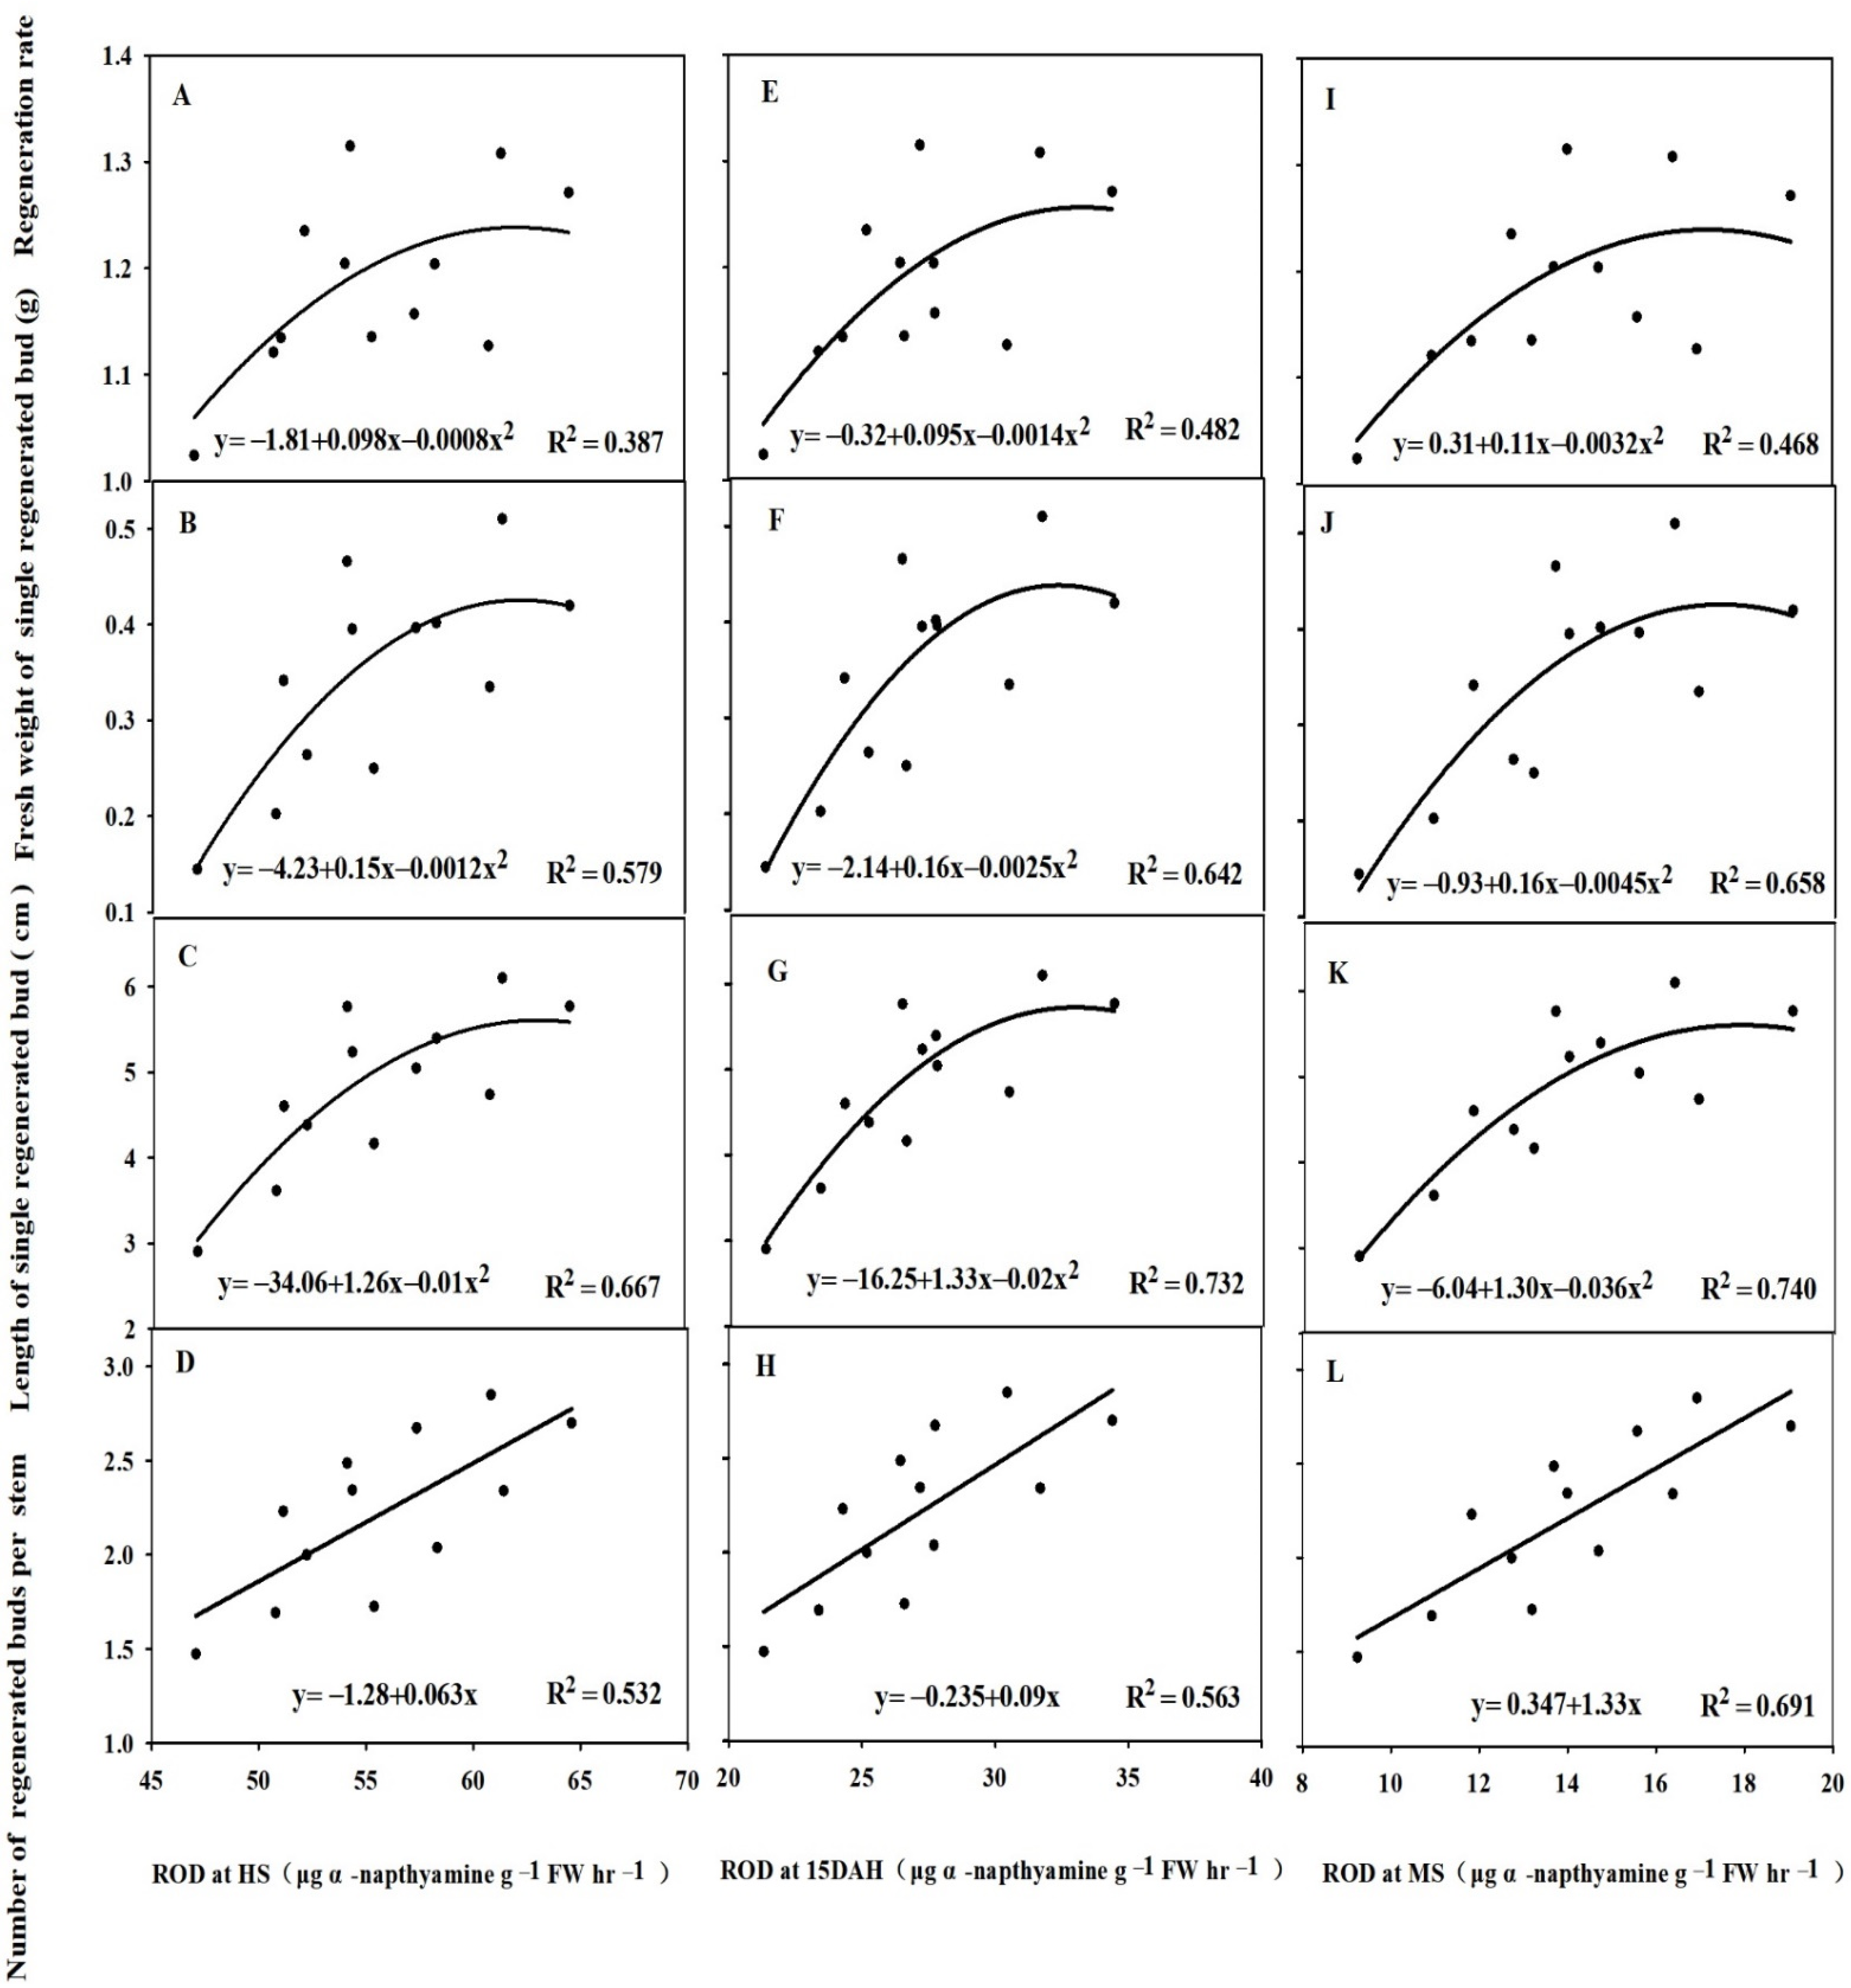
Figure 6.
Relationships between root oxidation activity in the main crop and number (D,H,L), length (C,G,K), and fresh weight of regenerated buds (B,F,J) at maturity of main crop and regeneration rate (A,E,I). Note: HS, full heading stage of the main crop. DAH, days after heading of the main crop, MS, maturity stage of the main crop. ROA, root oxidation activity.
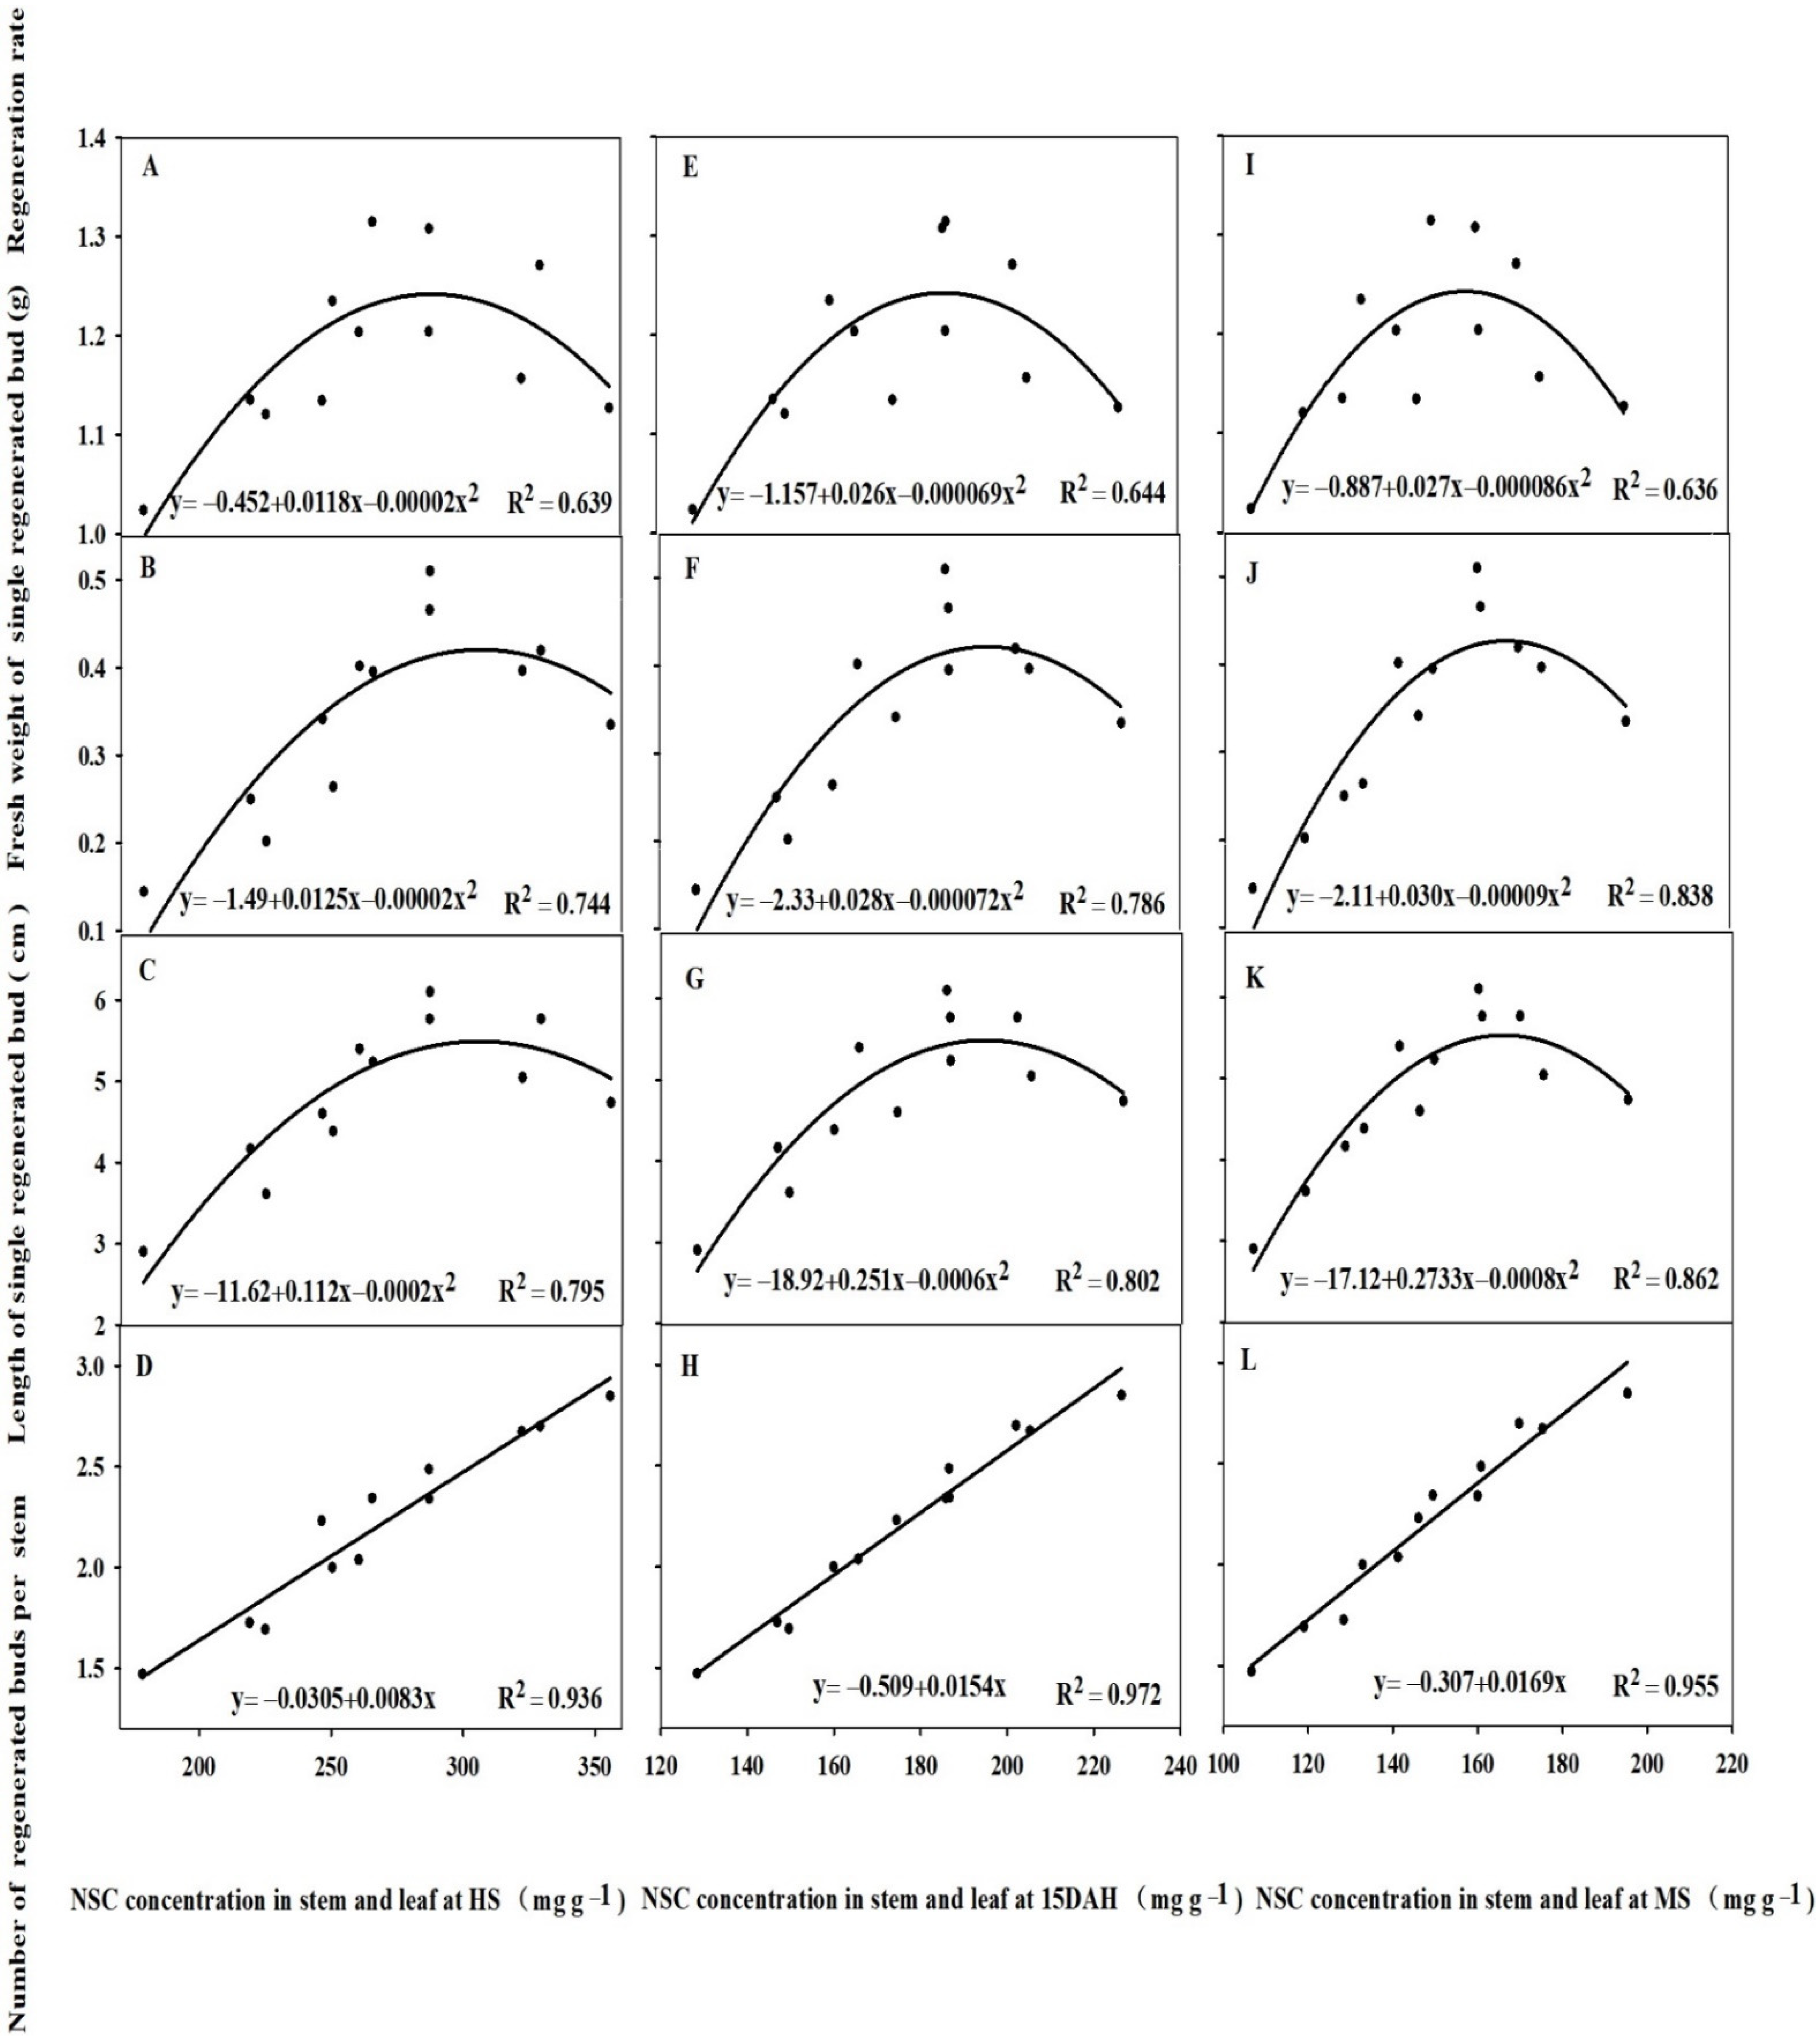
Figure 7.
Relationships between NSC concentration of stem and leaf in the main crop and number (D,H,L), length (C,G,K), and fresh weight of regenerated buds (B,F,J) at maturity of main crop and regeneration rate (A,E,I). Note: HS, full heading stage of the main crop. DAH, days after heading of the main crop, MS, maturity stage of the main crop. ROA, root oxidation activity.
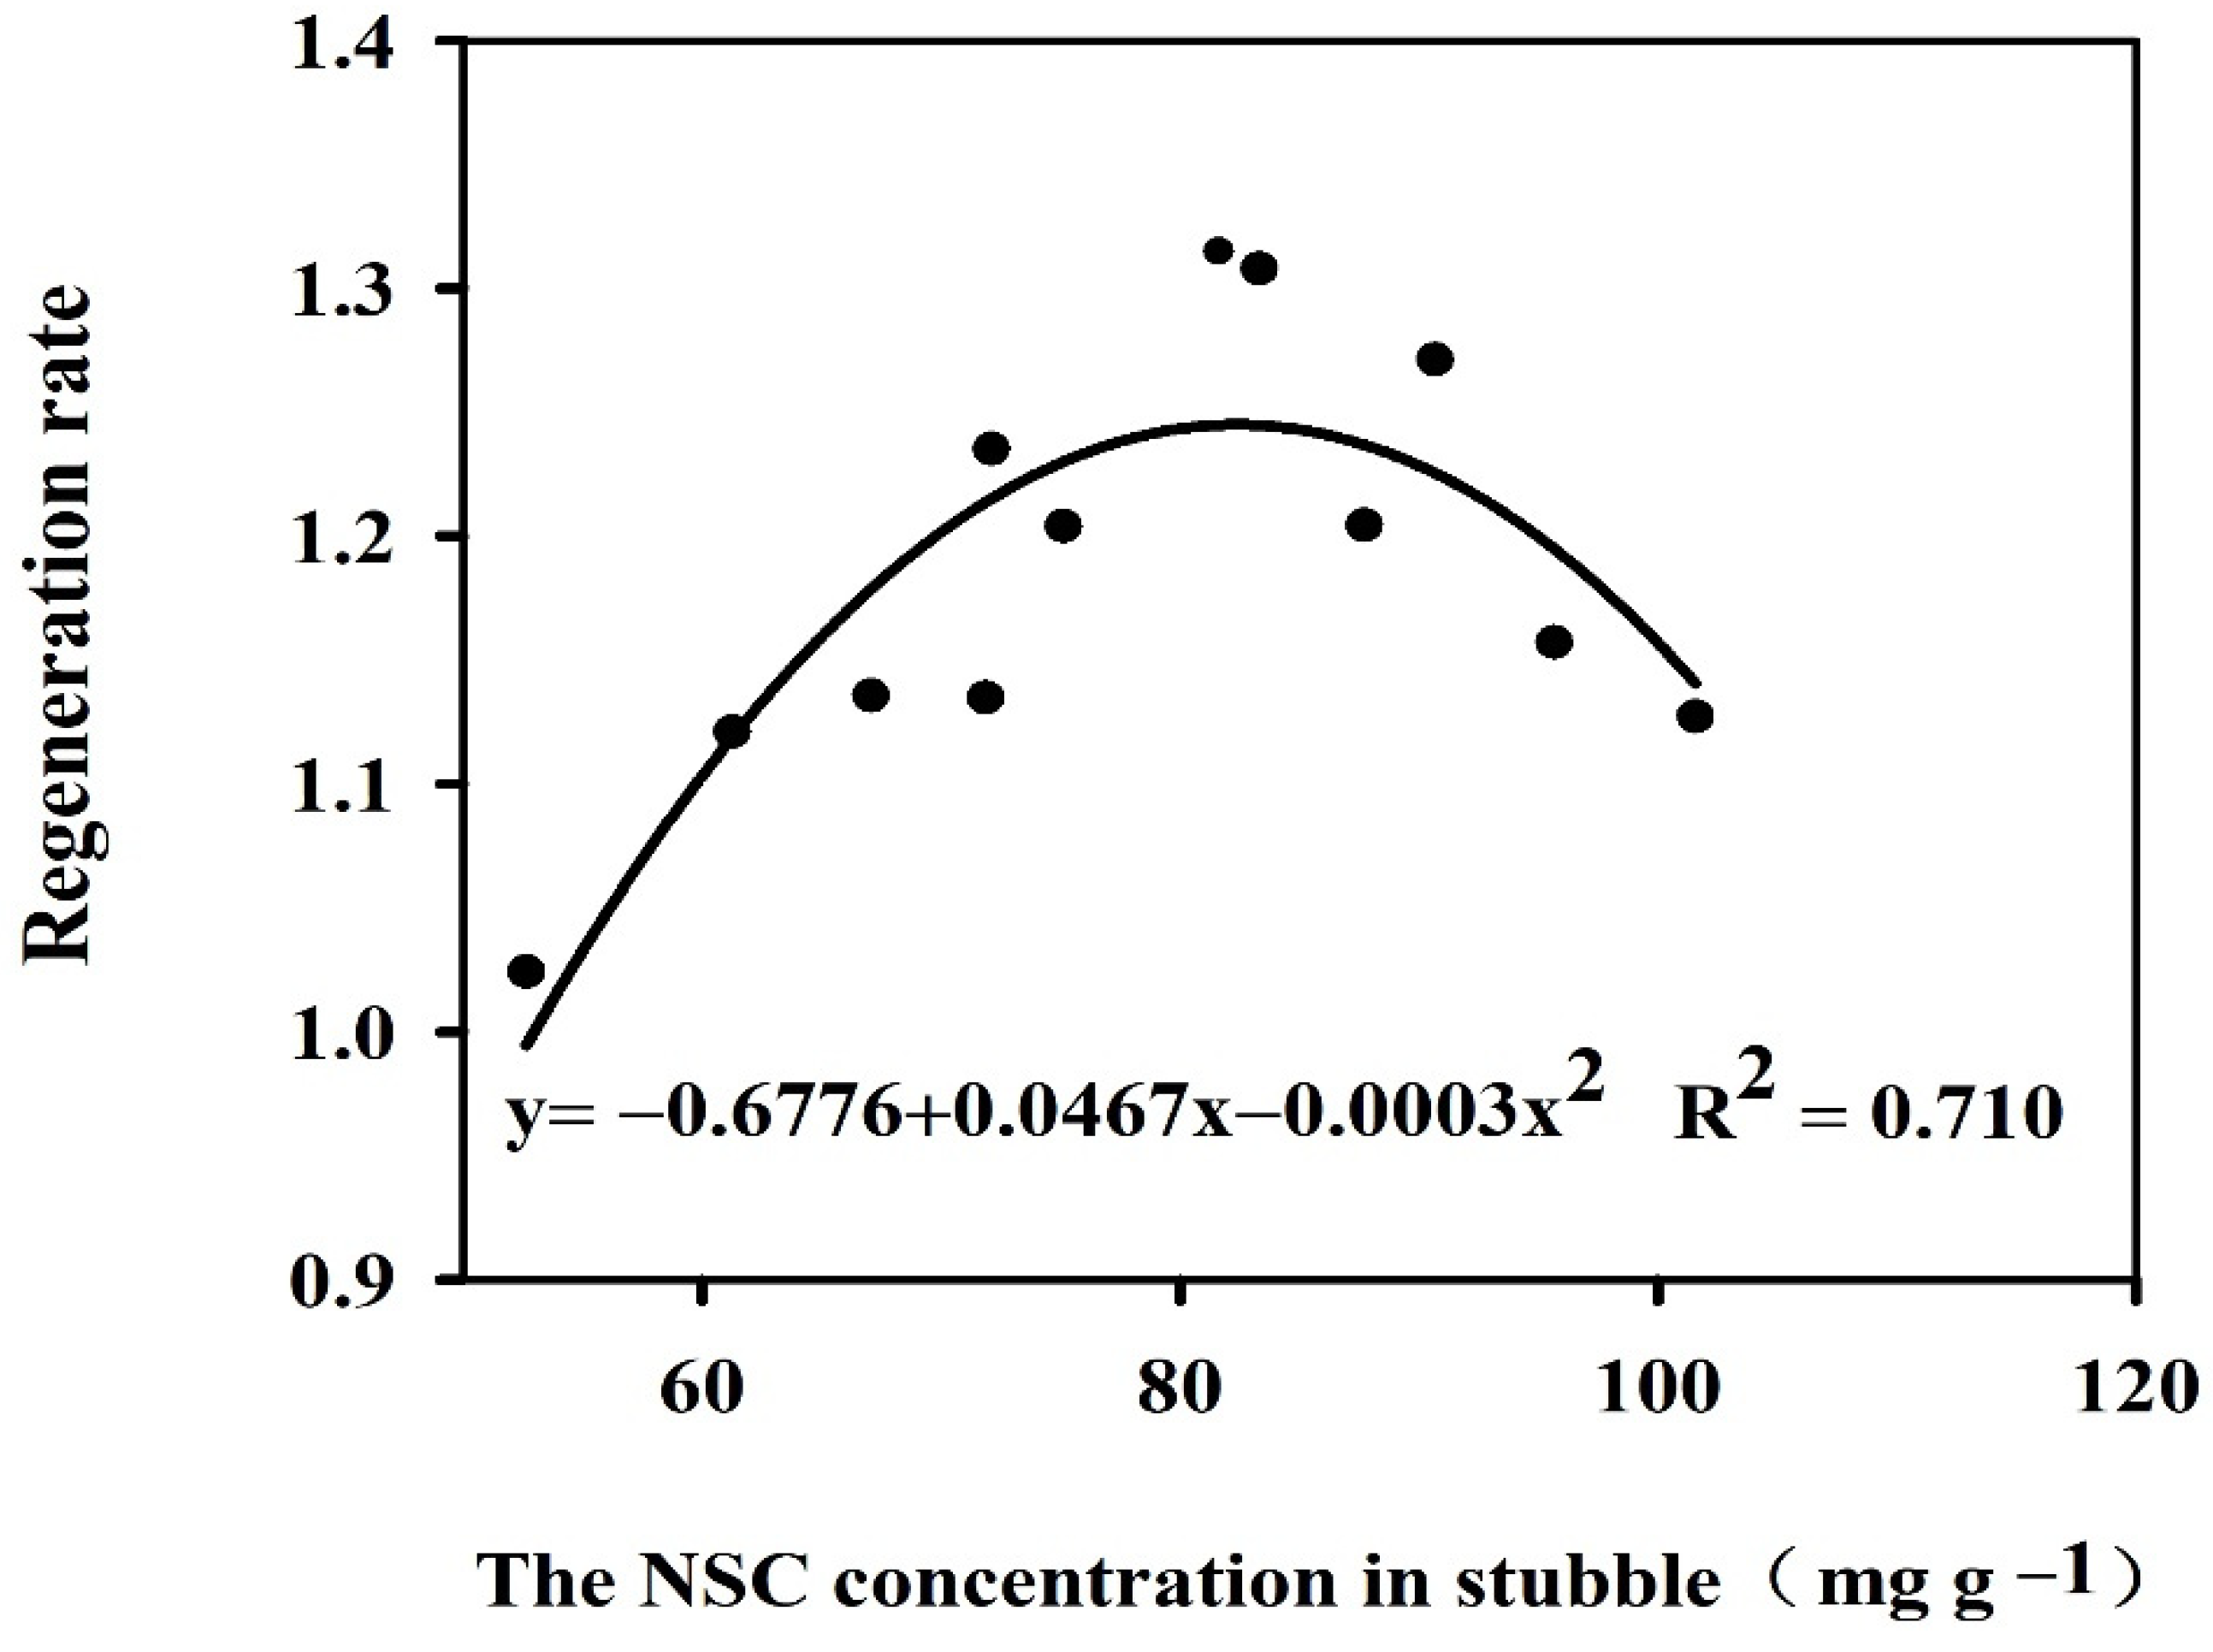
Figure 8.
Relationships between stubble NSC concentration and regeneration rate.
Figure 8.
Relationships between stubble NSC concentration and regeneration rate.
Table 1.
Nitrogen application rates (kg N ha−1) in the main and ratoon crops.
Table 1.
Nitrogen application rates (kg N ha−1) in the main and ratoon crops.
| N Rates in Main Crop | Treatment Code | N Rates in Ratoon Crop |
|---|
| Total N Rate | Basal and Tillering Fertilizer | Panicle Fertilizer | Total N Rate | Bud Fertilizer | Seedling Fertilizer |
|---|
| 100 (LN) | 70 (70) | 30 (30) | PN30 | 200 | 50 | 150 |
| | 60 (60) | 40 (40) | PN40 | 200 | 50 | 150 |
| | 50 (50) | 50 (50) | PN50 | 200 | 50 | 150 |
| | 40 (40) | 60 (60) | PN60 | 200 | 50 | 150 |
| 250 (MN) | 175 (70) | 75 (30) | PN30 | 200 | 50 | 150 |
| | 150 (60) | 100 (40) | PN40 | 200 | 50 | 150 |
| | 125 (50) | 125 (50) | PN50 | 200 | 50 | 150 |
| | 100 (40) | 150 (60) | PN60 | 200 | 50 | 150 |
| 400 (HN) | 280 (70) | 120 (30) | PN30 | 200 | 50 | 150 |
| | 240 (60) | 160 (40) | PN40 | 200 | 50 | 150 |
| | 200 (50) | 200 (50) | PN50 | 200 | 50 | 150 |
| | 160 (40) | 240 (60) | PN60 | 200 | 50 | 150 |
Table 2.
Analysis-of-variance of F-values of the grain yield and yield components of the main and ratoon crops between/among years, N regimes.
Table 2.
Analysis-of-variance of F-values of the grain yield and yield components of the main and ratoon crops between/among years, N regimes.
| Source of Variation | df | Panicle Number | Spikelet per Panicle | Filled Grain Rate | 1000-Grain Weight | Grain Yield |
|---|
| Main crop | Y | 1 | NS | NS | NS | NS | NS |
| N | 2 | 159.72 ** | 150.20 ** | 131.57 ** | NS | 114.80 ** |
| R | 3 | 24.62 ** | 24.63 ** | NS | NS | 53.75 ** |
| Y × N | 2 | NS | NS | NS | NS | NS |
| Y × R | 3 | NS | NS | NS | NS | NS |
| N × R | 6 | NS | NS | NS | NS | NS |
| Y × N × R | 6 | NS | NS | NS | NS | NS |
| Ratoon crop | Y | 1 | NS | NS | NS | NS | NS |
| N | 2 | 359.22 ** | 229.83 ** | NS | NS | 175.72 ** |
| R | 3 | 42.36 ** | NS | NS | NS | 7.10 ** |
| Y × N | 2 | NS | NS | NS | NS | NS |
| Y × R | 3 | NS | NS | NS | NS | NS |
| N × R | 6 | 50.04 ** | NS | NS | NS | 7.10 ** |
| Y × N × R | 6 | NS | NS | NS | NS | NS |
Table 3.
Analysis-of-variance of F-values of key indices such as the growth and development of the main crop after full heading, growth of regenerative bud, and regenerative ability between/among years, N regime.
Table 3.
Analysis-of-variance of F-values of key indices such as the growth and development of the main crop after full heading, growth of regenerative bud, and regenerative ability between/among years, N regime.
| Source of Variation | df | Indices of Regenerated Bud at MS | ROA at 15DAH | NSC Concentration in Stem and Leaf at 15DAH | NSC Concentration in Stubble | Regeneration Rate |
|---|
| Length | Fresh Weight | Number |
|---|
| Y | 1 | NS | NS | NS | NS | NS | NS | NS |
| N | 2 | 118.4 ** | 40.23 ** | 239.27 ** | 9.93 * | 52.73 ** | 50.12 ** | 13.68 ** |
| R | 3 | 59.29 ** | 29.88 ** | 298.07 ** | 15.61 ** | 53.95 ** | 64.45 ** | 70.91 ** |
| Y × N | 2 | NS | NS | NS | NS | NS | NS | NS |
| Y × R | 3 | NS | NS | NS | NS | NS | NS | NS |
| N × R | 6 | 20.21 ** | 14.33 | 6.44 ** | NS | NS | NS | 29.25 ** |
| Y × N × R | 6 | NS | NS | NS | NS | NS | NS | NS |
Table 4.
Effects of N regime in the main crop on the yield components of the ratoon crop.
Table 4.
Effects of N regime in the main crop on the yield components of the ratoon crop.
| Treatment | Panicles (104 ha−1) | Spikelet per Panicle | Filled Grain Rate (%) | 1000-Grain Weight (g) |
|---|
| LN | PN30 | 296.8 g | 58.2 b | 88.1 a | 29.0 a |
| PN40 | 311.2 f | 57.9 b | 88.3 a | 29.2 a |
| PN50 | 328.6 e | 58.1 b | 87.7 a | 29.2 a |
| PN60 | 338.9 d | 57.9 b | 87.8 a | 29.1 a |
| Mean | 318.8 B | 58.0 B | 88.0 A | 29.1 A |
| MN | PN30 | 354.4 c | 64.1 a | 88.1 a | 29.2 a |
| PN40 | 371.9 b | 64.1 a | 88.2 a | 29.2 a |
| PN50 | 389.3 a | 64.2 a | 88.2 a | 29.2 a |
| PN60 | 368.3 b | 64.3 a | 88.1 a | 29.3 a |
| Mean | 371.0 A | 64.1 A | 88.1 A | 29.2 A |
| HN | PN30 | 371.0 b | 65.7 a | 87.8 a | 28.8 a |
| PN40 | 386.2 a | 66.0 a | 87.8 a | 28.6 a |
| PN50 | 365.9 b | 65.6 a | 87.7 a | 28.7 a |
| PN60 | 350.1 c | 66.0 a | 87.9 a | 28.9 a |
| Mean | 368.3 A | 65.8 A | 87.8 A | 28.7 A |
Table 5.
Effects of N regime in the main crop on the yield components of the ratoon crop.
Table 5.
Effects of N regime in the main crop on the yield components of the ratoon crop.
| Parameters | N Rate | Panicle Number | Yield |
|---|
| Number of mother stem | LN | −0.9986 ** | −0.9927 ** |
| MN | −0.4694 | −0.5729 |
| HN | 0.6810 | 0.5474 |
| Regeneration rate | LN | 0.9998 ** | 0.9947 ** |
| MN | 0.8707 | 0.9220 * |
| HN | 0.7989 | 0.8374 |
Table 6.
Effects of N regime in the main crop on the nitrogen use efficiency in the main and ratoon crop.
Table 6.
Effects of N regime in the main crop on the nitrogen use efficiency in the main and ratoon crop.
| Treatment | ANUE in Main Crop | ANUE in Ratoon Crop | ANUE in Both Seasons |
|---|
| LN | PN30 | 29.7 a | 6.3 f | 14.1 b |
| PN40 | 27.9 b | 7.4 e | 14.2 b |
| PN50 | 26.6 c | 8.6 d | 14.6 b |
| PN60 | 24.5 d | 9.3 d | 14.4 b |
| Mean | 27.2 A | 7.9 B | 14.3 B |
| MN | PN30 | 15.5 f | 13.4 c | 14.6 b |
| PN40 | 16.6 e | 14.9 b | 15.8 a |
| PN50 | 15.3 f | 16.4 a | 15.8 a |
| PN60 | 14.6 g | 14.7 | 14.7 b |
| Mean | 15.5 B | 14.8 A | 15.2 A |
| HN | PN30 | 8.3 i | 15.0 b | 10.5 d |
| PN40 | 8.6 i | 16.2 a | 11.1 c |
| PN50 | 8.8 i | 14.5 b | 10.7 d |
| PN60 | 9.3 h | 13.6 c | 10.7 d |
| Mean | 8.7 C | 14.8 A | 10.8 C |


