
Advanced Characterization of Monofloral Honeys from Romania


Abstract
:1. Introduction
2. Materials and Methods
2.1. Honey Samples
2.2. Melissopalynological Analysis
2.3. Physicochemical Analysis
2.3.1. Electrical Conductivity, Moisture Content, pH, Free Acidity and Hydroxymethylfurfural (HMF) Content
2.3.2. Color
2.3.3. Determination of Sugar Composition
2.4. FT-IR Analysis
2.5. Rheological Properties
2.6. Differential Scanning Calorimetry
2.7. Statistical Analysis
3. Results and Discussion
3.1. Pollen Analysis
3.2. Moisture Content
3.3. pH
3.4. Free Acidity
3.5. Electrical Conductivity
3.6. Color
3.7. HMF
3.8. Sugars
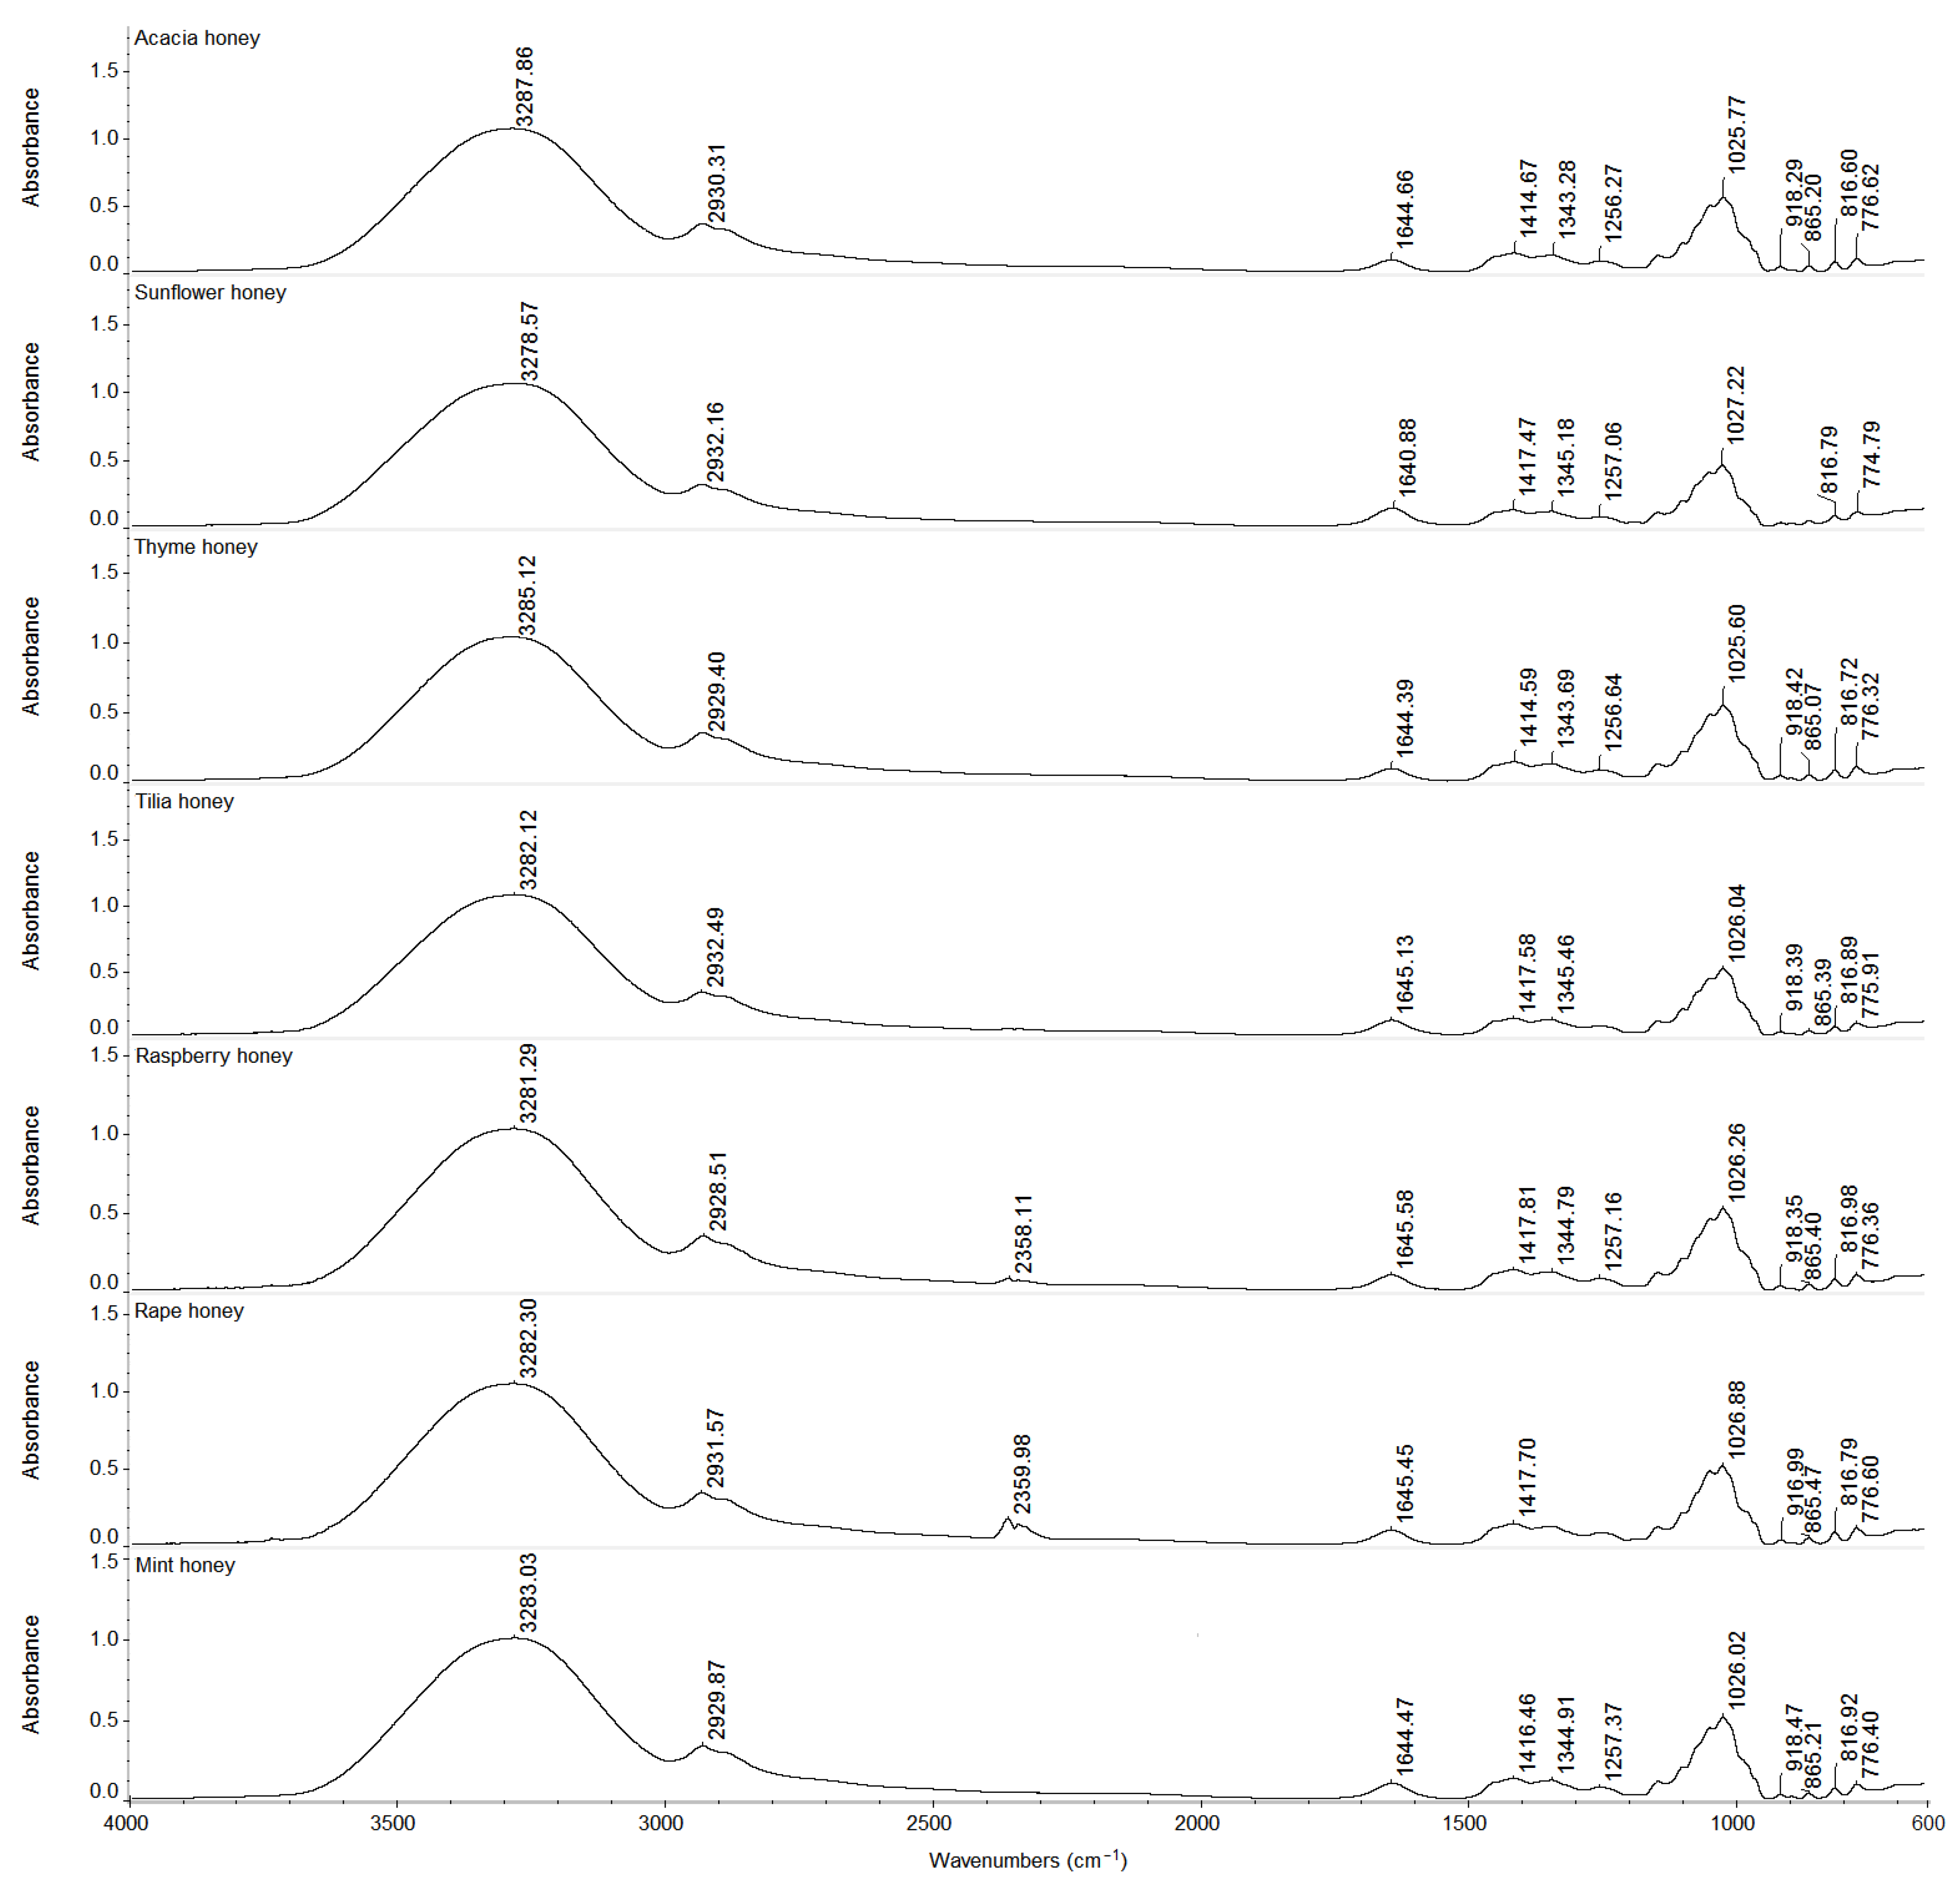
3.9. FT-IR Analysis
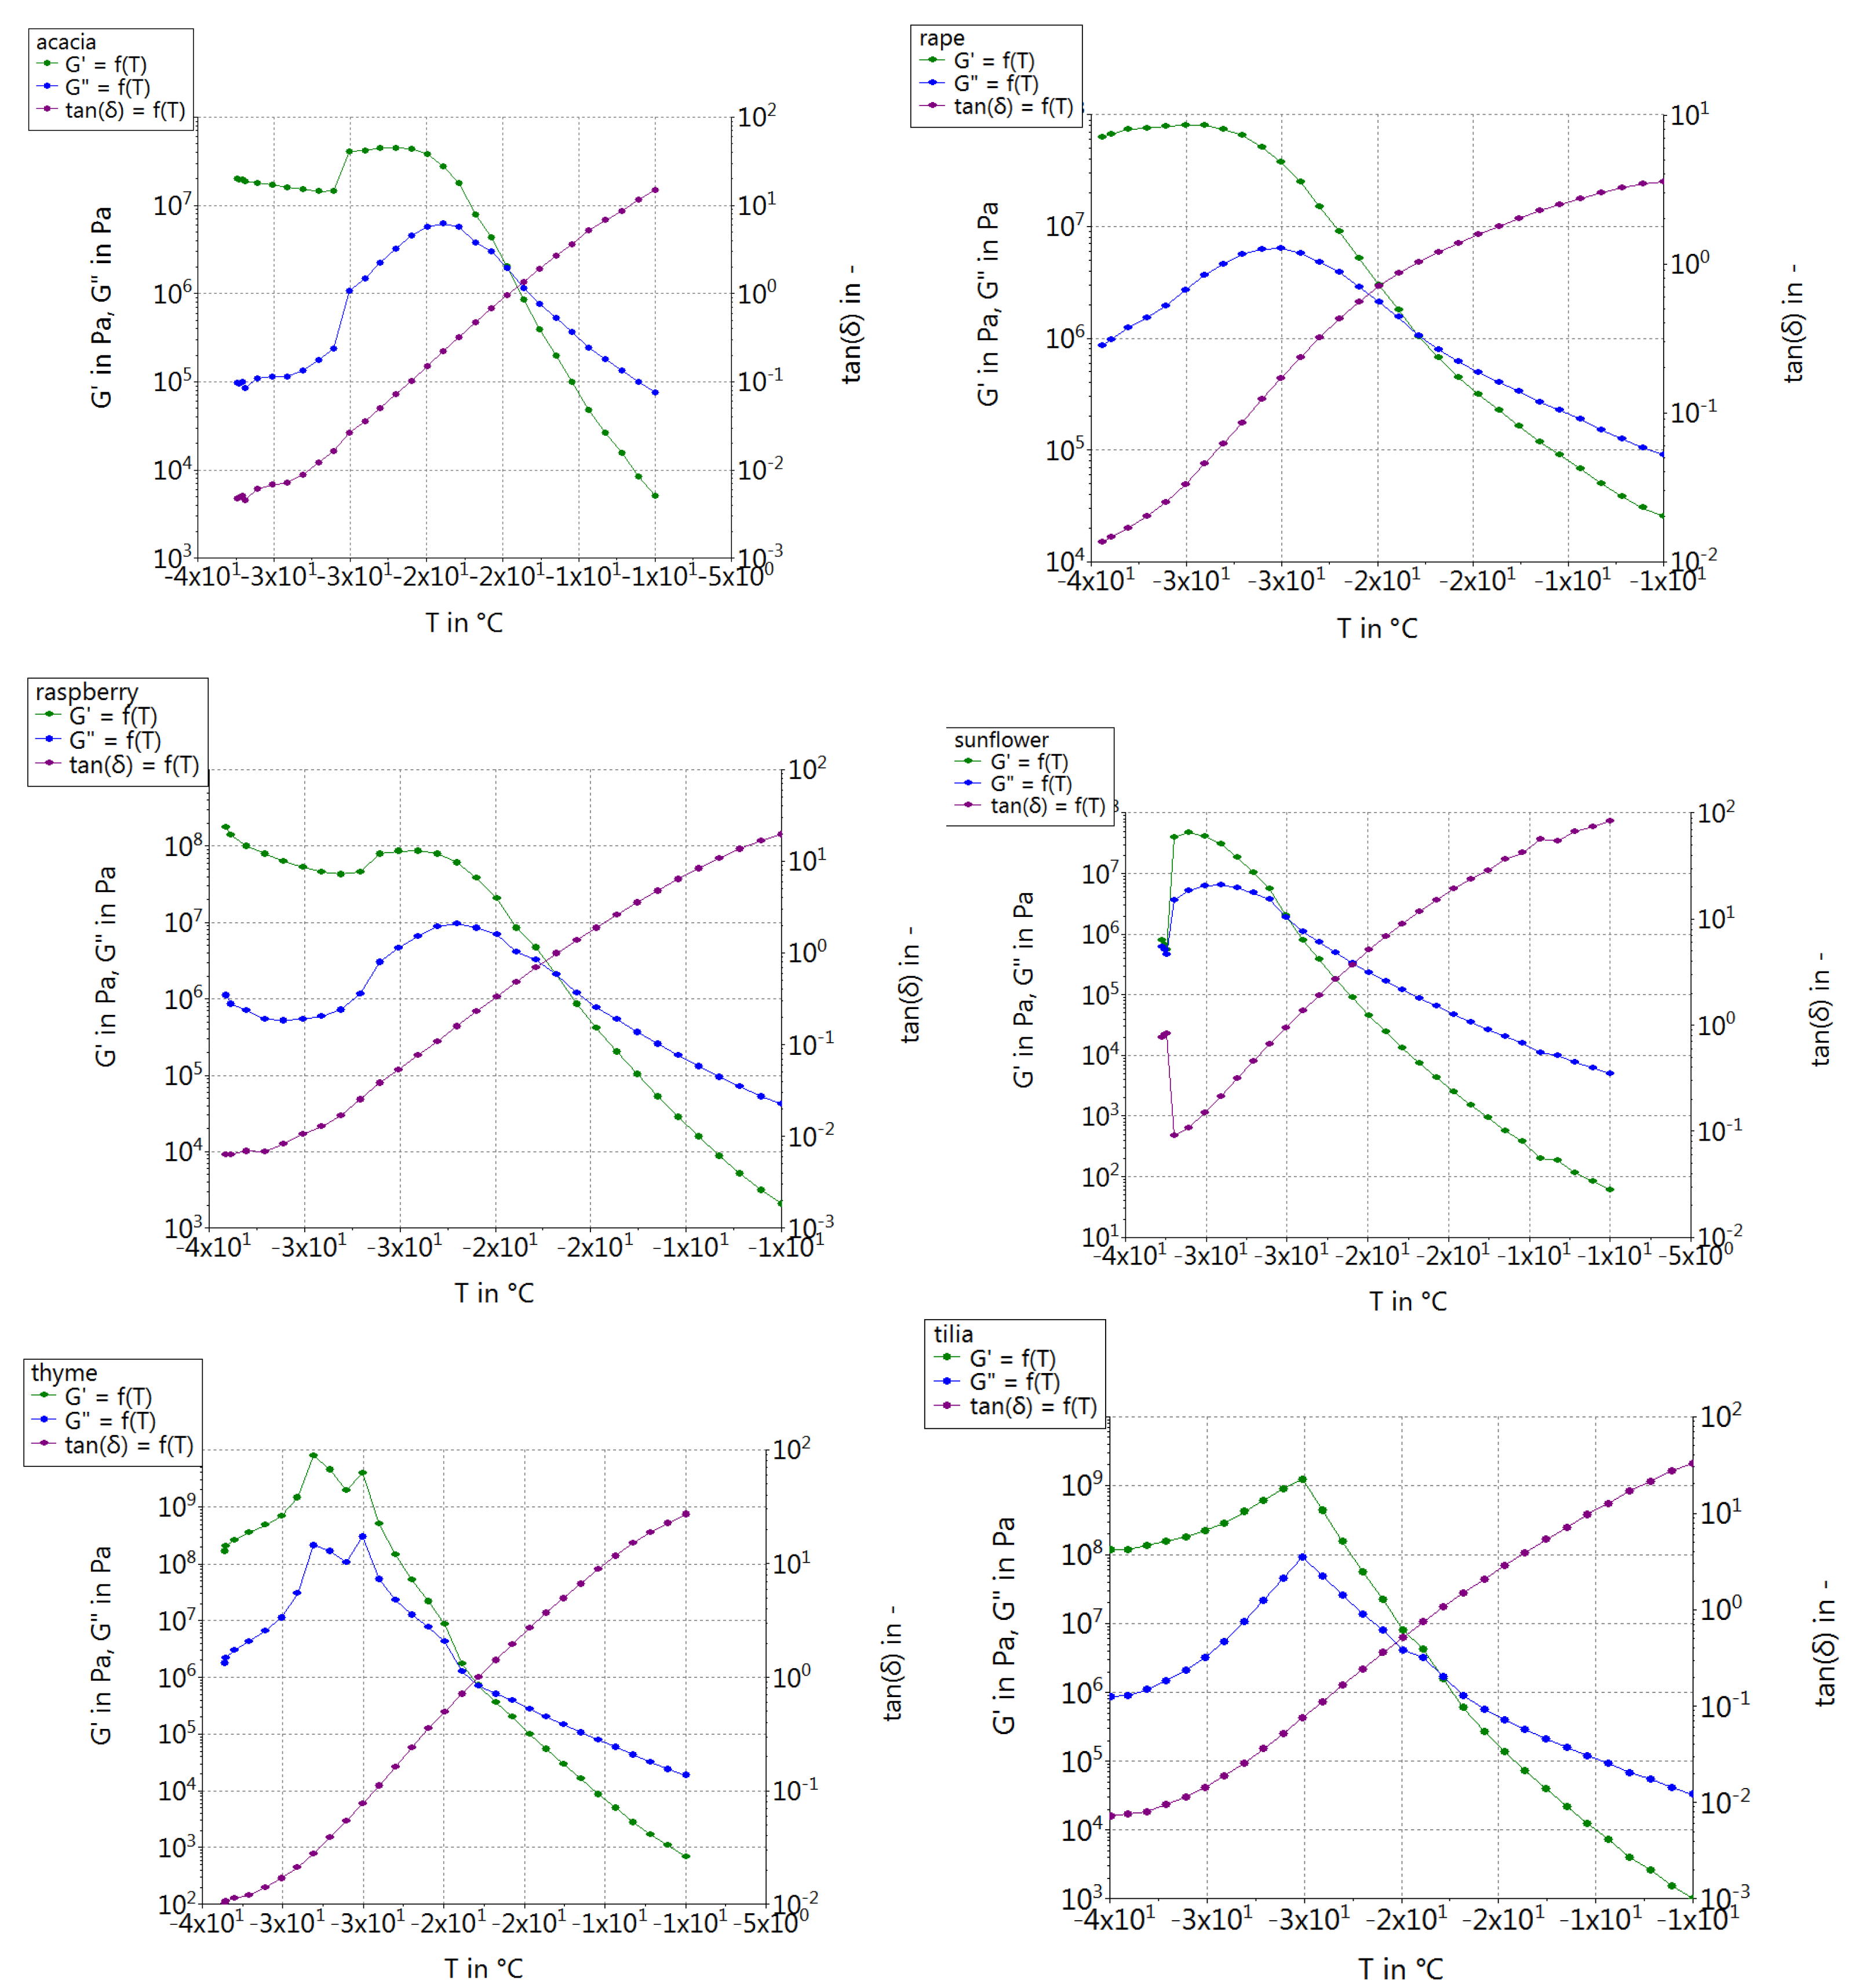
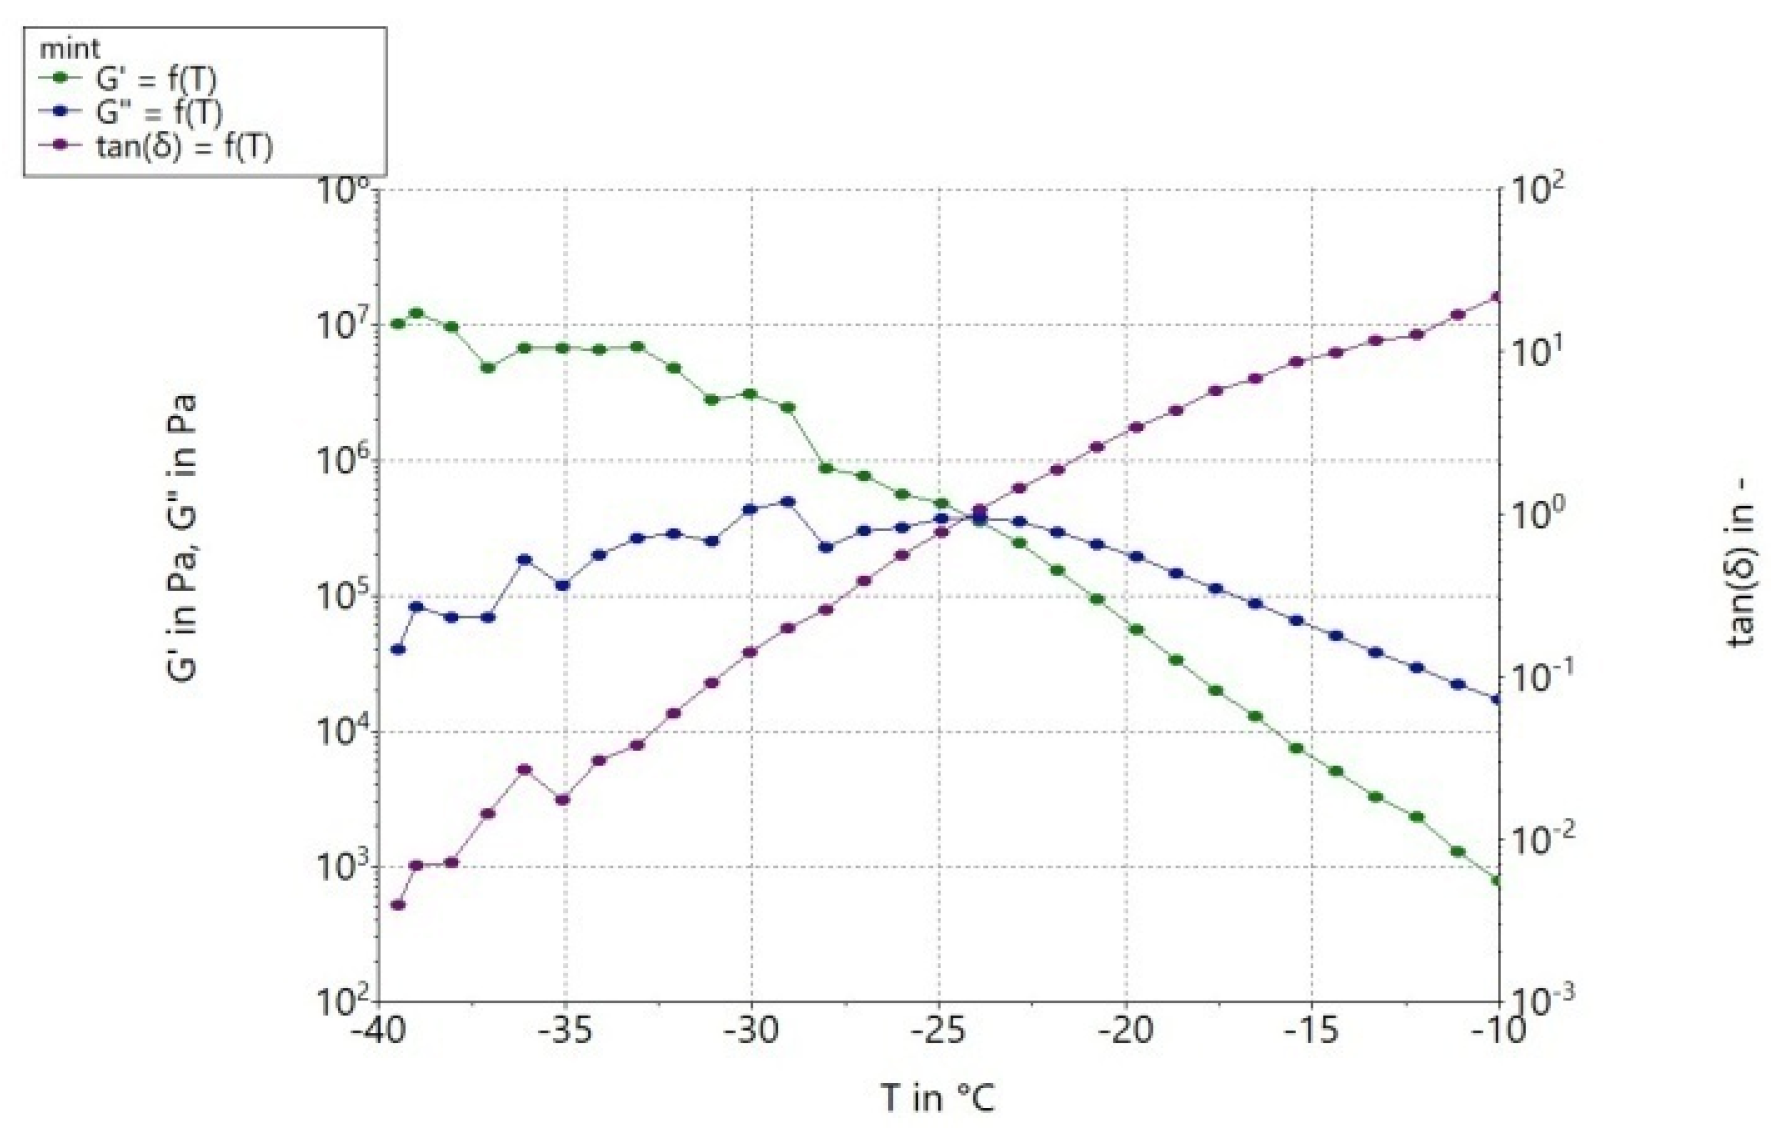
3.10. Rheological Properties
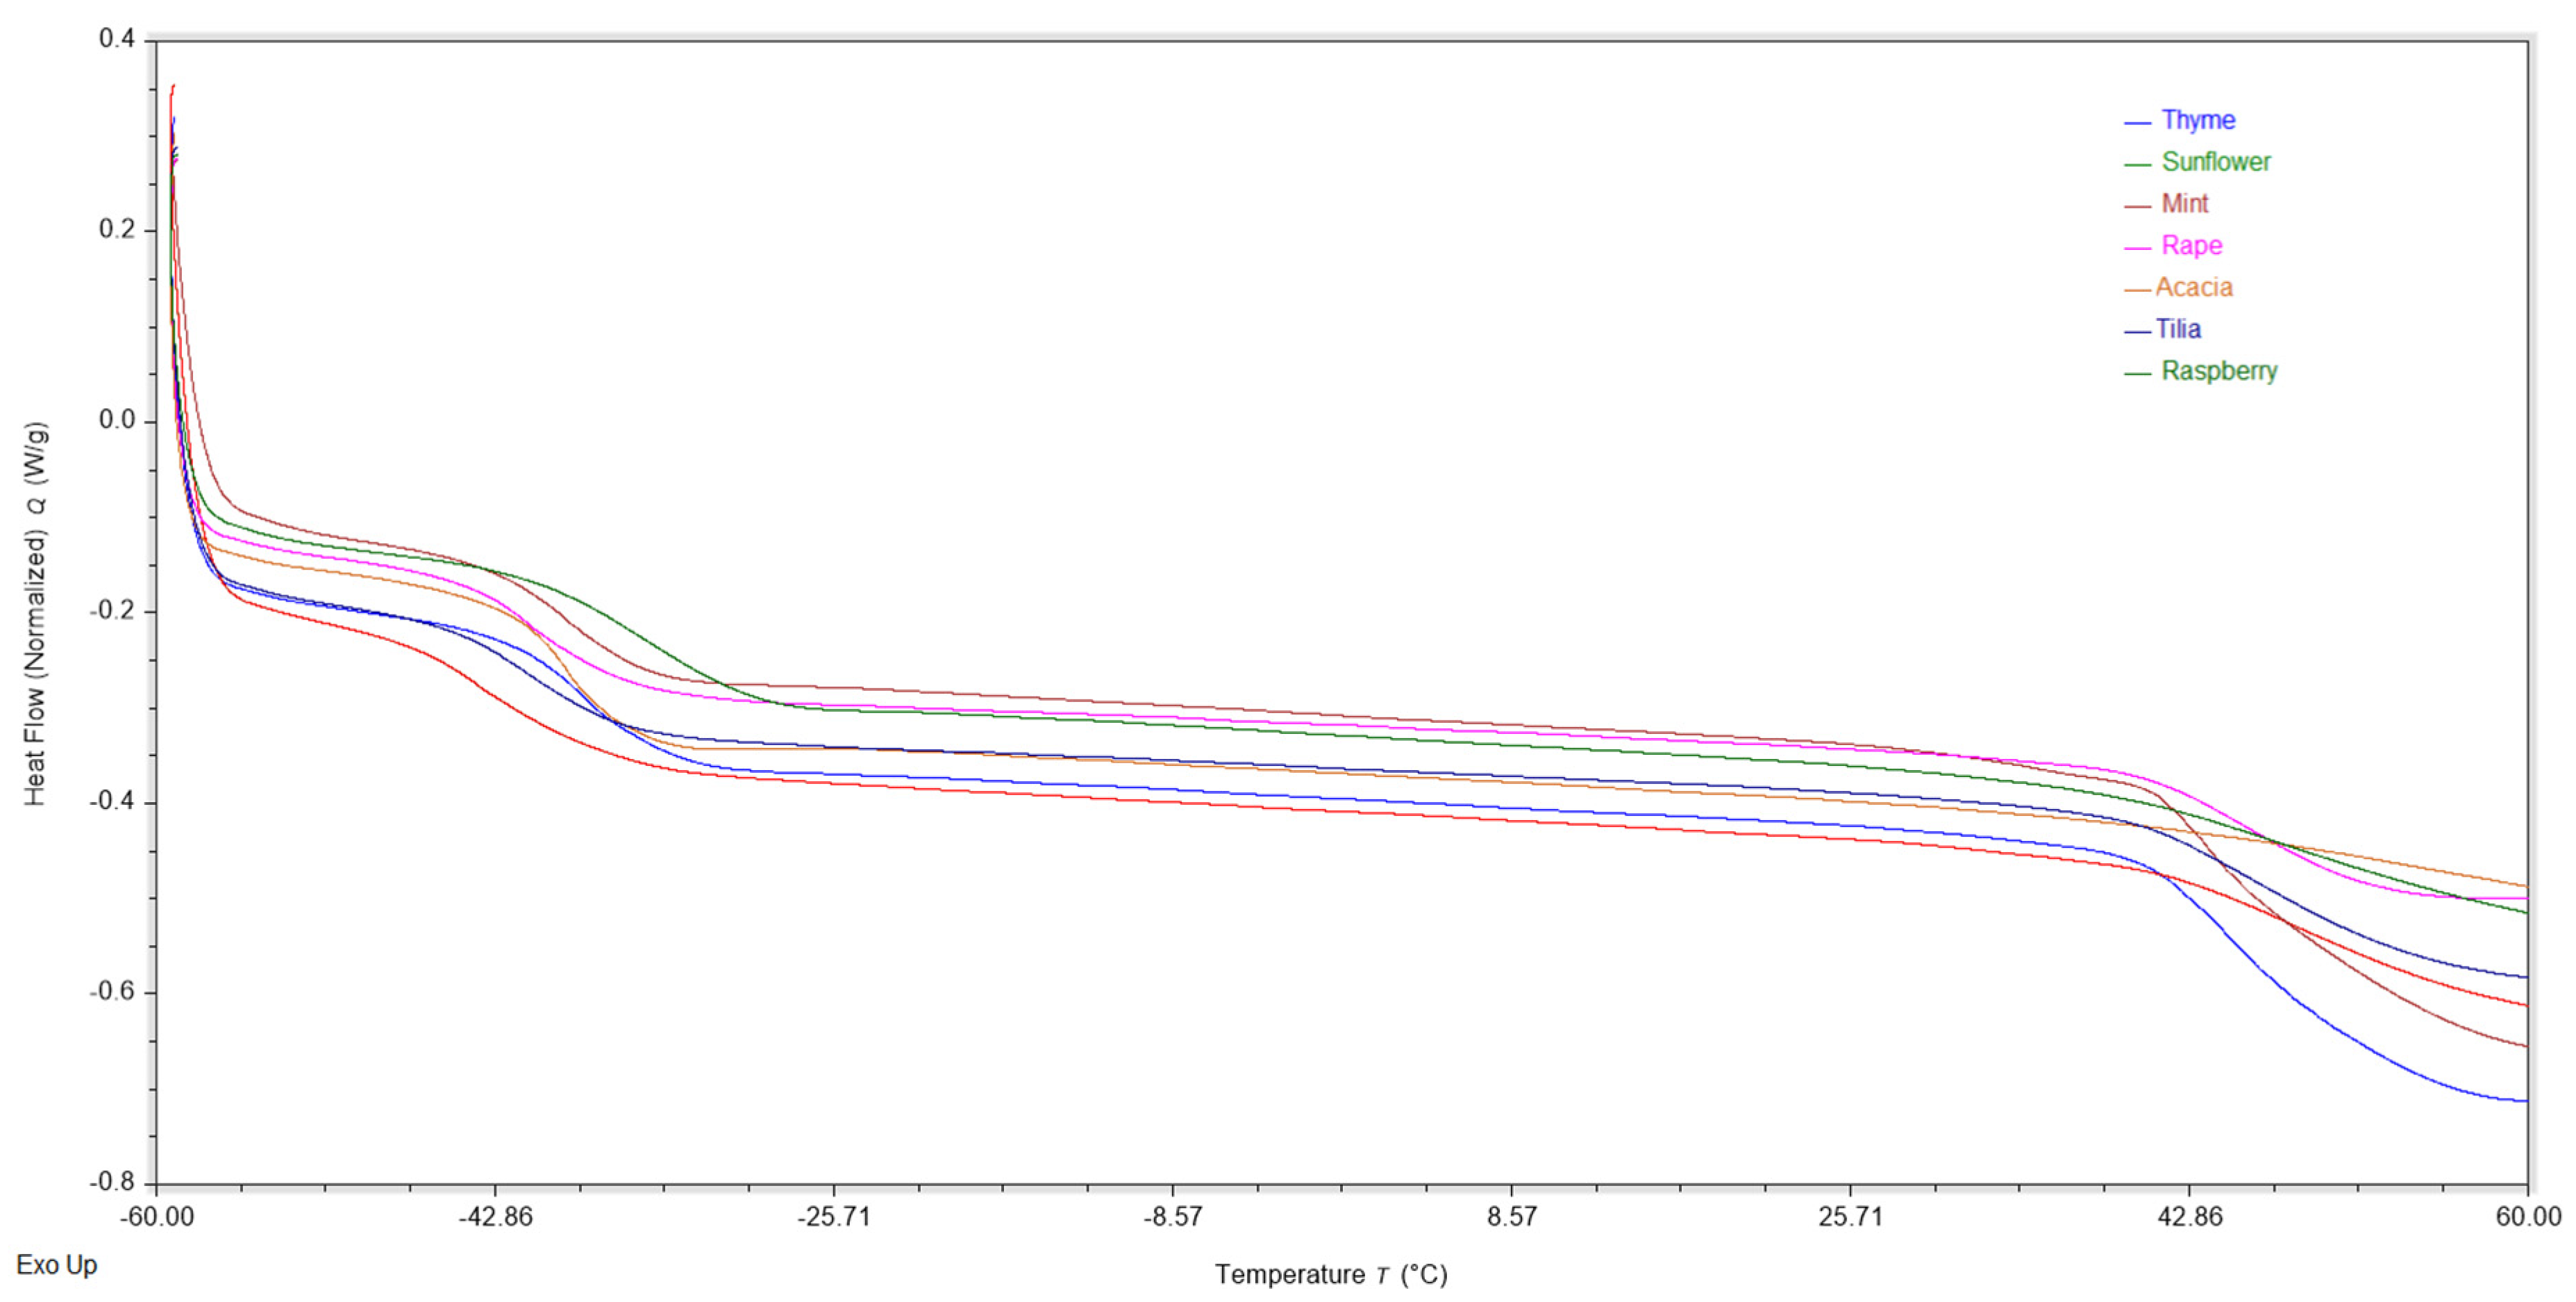
3.11. Differential Scanning Calorimetry (DSC)
4. Conclusions
Author Contributions
Funding
Institutional Review Board Statement
Informed Consent Statement
Acknowledgments
Conflicts of Interest
References
- Da Silva, P.M.; Gauche, C.; Gonzaga, L.V.; Costa, A.C.O.; Fett, R. Honey: Chemical Composition, Stability and Authenticity. Food Chem. 2016, 196, 309–323. [Google Scholar] [CrossRef] [PubMed]
- Rahman, M.M.; Alam, M.N.; Fatima, N.; Shahjalal, H.M.; Gan, S.H.; Khalil, M.I. Chemical Composition and Biological Properties of Aromatic Compounds in Honey: An Overview. J. Food Biochem. 2017, 41, e12405. [Google Scholar] [CrossRef]
- Kasprzyk, I.; Depciuch, J.; Grabek-Lejko, D.; Parlinska-Wojtan, M. FTIR-ATR Spectroscopy of Pollen and Honey as a Tool for Unifloral Honey Authentication. The Case Study of Rape Honey. Food Control 2018, 84, 33–40. [Google Scholar] [CrossRef]
- do Nascimento, K.S.; Sattler, J.A.G.; Macedo, L.F.L.; González, C.V.S.; de Melo, I.L.P.; da Silva Araújo, E.; Granato, D.; Sattler, A.; de Almeida-Muradian, L.B. Phenolic Compounds, Antioxidant Capacity and Physicochemical Properties of Brazilian Apis Mellifera Honeys. LWT-Food Sci. Technol. 2018, 91, 85–94. [Google Scholar] [CrossRef]
- Carpenter, R.P.; Lyon, D.H.; Hasdell, T.A. Guidelines for Sensory Analysis in Food Product Development and Quality Control; Aspen Publishers, Inc.: Gaithersburg, MD, USA, 2000. [Google Scholar]
- White, J.W. Isotope Ratio Testing of Honey: Demystifying the Internal Standard Test. Am. Bee J. 2000, 140, 318–321. [Google Scholar]
- Escuredo, O.; Dobre, I.; Fernández-González, M.; Seijo, M.C. Contribution of Botanical Origin and Sugar Composition of Honeys on the Crystallization Phenomenon. Food Chem. 2014, 149, 84–90. [Google Scholar] [CrossRef] [PubMed]
- Jandrić, Z.; Haughey, S.A.; Frew, R.D.; McComb, K.; Galvin-King, P.; Elliott, C.T.; Cannavan, A. Discrimination of Honey of Different Floral Origins by a Combination of Various Chemical Parameters. Food Chem. 2015, 189, 52–59. [Google Scholar] [CrossRef] [PubMed]
- Louveaux, J.; Maurizio, A.; Vorwohl, G. Methods of Melissopalynology. Bee World 1978, 59, 139–157. [Google Scholar] [CrossRef]
- Bogdanov, S.; Lullmann, C.; Martin, P.; Von Der Ohe, W.; Russmann, H.; Vorwohl, G. Honey Quality, Methods of Analysis and International Regulatory Standards: Review of the Work of the International Honey Commission; Swiss Bee Research Centre: Bern, Switzerland, 1999. [Google Scholar]
- Bogdanov, S.; Martin, P. Honey Authenticity. Mitt. Lebensm. Hyg. 2002, 93, 232–254. [Google Scholar]
- Tuberoso, C.I.G.; Jerković, I.; Sarais, G.; Congiu, F.; Marijanović, Z.; Kuś, P.M. Color Evaluation of Seventeen European Unifloral Honey Types by Means of Spectrophotometrically Determined CIE L*C*abh°ab Chromaticity Coordinates. Food Chem. 2014, 145, 284–291. [Google Scholar] [CrossRef]
- Pauliuc, D.; Dranca, F.; Oroian, M. Antioxidant Activity, Total Phenolic Content, Individual Phenolics and Physicochemical Parameters Suitability for Romanian Honey Authentication. Foods 2020, 9, 306. [Google Scholar] [CrossRef] [PubMed] [Green Version]
- Siddiqui, A.J.; Musharraf, S.G.; Choudhary, M.I.; Rahman, A. Application of Analytical Methods in Authentication and Adulteration of Honey. Food Chem. 2017, 217, 687–698. [Google Scholar] [CrossRef] [PubMed]
- Karabagias, I.K.; Badeka, A.; Kontakos, S.; Karabournioti, S.; Kontominas, M.G. Characterization and Classification of Thymus capitatus (L.) Honey According to Geographical Origin Based on Volatile Compounds, Physicochemical Parameters and Chemometrics. Food Res. Int. 2014, 55, 363–372. [Google Scholar] [CrossRef]
- Codex Stan 12-1981; Codex Alimentarius Commission Standards. Codex Alimentarius Commission: Rome, Italy, 2001.
- Singh, I.; Singh, S. Honey Moisture Reduction and Its Quality. J. Food Sci. Technol. 2018, 55, 3861–3871. [Google Scholar] [CrossRef] [PubMed]
- Prica, N.; Živkov Baloš, M.; Jakšić, S.; Mihaljev, Ž.; Kartalović, B.; Babić, J.; Savić, S. Moisture and Acidity as Indicators of the Quality of Honey Originating from Vojvodina Region. Arch. Vet. Med. 2015, 7, 99–109. [Google Scholar] [CrossRef]
- Albu, A.; Radu-Rusu, C.G.; Pop, I.M.; Frunza, G.; Nacu, G. Quality Assessment of Raw Honey Issued from Eastern Romania. Agriculture 2021, 11, 247. [Google Scholar] [CrossRef]
- Snowdon, J.A.; Cliver, D.O. Microorganisms in Honey. Int. J. Food Microbiol. 1996, 31, 1–26. [Google Scholar] [CrossRef]
- White, J.W. Spectrophotometric Method for Hydroxymethylfurfural in Honey. J. Assoc. Off. Anal. Chem. 1979, 62, 509–514. [Google Scholar] [CrossRef]
- Gheldof, N.; Engeseth, N.J. Antioxidant Capacity of Honeys from Various Floral Sources Based on the Determination of Oxygen Radical Absorbance Capacity and Inhibition of in Vitro Lipoprotein Oxidation in Human Serum Samples. J. Agric. Food Chem. 2002, 50, 3050–3055. [Google Scholar] [CrossRef]
- Krishnasree, V.; Ukkuru, P.M. Quality Analysis of Bee Honeys. Int. J. Curr. Microbiol. Appl. Sci. 2017, 6, 626–636. [Google Scholar] [CrossRef] [Green Version]
- Ciulu, M.; Serra, R.; Caredda, M.; Salis, S.; Floris, I.; Pilo, M.I.; Spano, N.; Panzanelli, A.; Sanna, G. Chemometric Treatment of Simple Physical and Chemical Data for the Discrimination of Unifloral Honeys. Talanta 2018, 190, 382–390. [Google Scholar] [CrossRef] [PubMed]
- Ciursă, P.; Pauliuc, D.; Dranca, F.; Ropciuc, S.; Oroian, M. Detection of Honey Adulterated with Agave, Corn, Inverted Sugar, Maple and Rice Syrups Using FTIR Analysis. Food Control 2021, 130, 108266. [Google Scholar] [CrossRef]
- Crăciun, M.E.; Pârvulescu, O.C.; Donise, A.C.; Dobre, T.; Stanciu, D.R. Characterization and Classification of Romanian Acacia Honey Based on Its Physicochemical Parameters and Chemometrics. Sci. Rep. 2020, 10, 20690. [Google Scholar] [CrossRef] [PubMed]
- Ratiu, I.A.; Al-Suod, H.; Bukowska, M.; Ligor, M.; Buszewski, B. Correlation Study of Honey Regarding Their Physicochemical Properties and Sugars and Cyclitols Content. Molecules 2020, 25, 34. [Google Scholar] [CrossRef] [PubMed] [Green Version]
- Kaškoniene, V.; Venskutonis, P.R.; Čeksteryte, V. Carbohydrate Composition and Electrical Conductivity of Different Origin Honeys from Lithuania. LWT-Food Sci. Technol. 2010, 43, 801–807. [Google Scholar] [CrossRef]
- Terrab, A.; González, A.G.; Díez, M.J.; Heredia, F.J. Characterisation of Moroccan Unifloral Honeys Using Multivariate Analysis. Eur. Food Res. Technol. 2003, 218, 88–95. [Google Scholar] [CrossRef]
- De-Melo, A.A.M.; Estevinho, L.M.; Moreira, M.M.; Delerue-Matos, C.; de Freitas, A.d.S.; Barth, O.M.; de Almeida-Muradian, L.B. A Multivariate Approach Based on Physicochemical Parameters and Biological Potential for the Bdotanical and Geographical Discrimination of Brazilian Bee Pollen. Food Biosci. 2018, 25, 91–110. [Google Scholar] [CrossRef] [Green Version]
- Commission, E. Commission Decision 2002/657/EC Implementing Council Directive 96/23/EC Concerning the Performance of Analytical Methods and the Interpretation of Results. Off. J. Eur. Union 2002, L221, 8–36. [Google Scholar] [CrossRef]
- Saxena, S.; Gautam, S.; Sharma, A. Microbial Decontamination of Honey of Indian Origin Using Gamma Radiation and Its Biochemical and Organoleptic Properties. J. Food Sci. 2010, 75, M19–M27. [Google Scholar] [CrossRef]
- Chirsanova, A.; Capcanari, T.; Boistean, A.; Siminiuc, R. Physico-Chemical Profile of Four Types of Honey from the South of the Republic of Moldova. Food Nutr. Sci. 2021, 12, 874–888. [Google Scholar] [CrossRef]
- Alygizou, A.; Grigorakis, S.; Gotsiou, P.; Loupassaki, S.; Calokerinos, A.C. Quantification of Hydrogen Peroxide in Cretan Honey and Correlation with Physicochemical Parameters. J. Anal. Methods Chem. 2021, 2021, 5554305. [Google Scholar] [CrossRef] [PubMed]
- Mohamed, M.; Sirajudeen, K.N.S.; Swamy, M.; Yaacob, N.S.; Sulaiman, S.A. Studies on the Antioxidant Properties of Tualang Honey of Malaysia. Afr. J. Tradit. Complement. Altern. Med. 2010, 7, 59–63. [Google Scholar] [CrossRef] [PubMed] [Green Version]
- Castiglioni, S.; Astolfi, P.; Conti, C.; Monaci, E.; Stefano, M.; Carloni, P. Morphological, Physicochemical and FTIR Spectroscopic Properties of Bee Pollen Loads from Different Botanical Origin. Molecules 2019, 24, 3974. [Google Scholar] [CrossRef] [PubMed] [Green Version]
- Can, Z.; Yildiz, O.; Sahin, H.; Akyuz Turumtay, E.; Silici, S.; Kolayli, S. An Investigation of Turkish Honeys: Their Physico-Chemical Properties, Antioxidant Capacities and Phenolic Profiles. Food Chem. 2015, 180, 133–141. [Google Scholar] [CrossRef] [PubMed]
- Tornuk, F.; Karaman, S.; Ozturk, I.; Toker, O.S.; Tastemur, B.; Sagdic, O.; Dogan, M.; Kayacier, A. Quality Characterization of Artisanal and Retail Turkish Blossom Honeys: Determination of Physicochemical, Microbiological, Bioactive Properties and Aroma Profile. Ind. Crops Prod. 2013, 46, 124–131. [Google Scholar] [CrossRef]
- Demir Kanbur, E.; Yuksek, T.; Atamov, V.; Ozcelik, A.E. A Comparison of the Physicochemical Properties of Chestnut and Highland Honey: The Case of Senoz Valley in the Rize Province of Turkey. Food Chem. 2021, 345, 128864. [Google Scholar] [CrossRef]
- Manzanares, A.B.; García, Z.H.; Galdón, B.R.; Rodríguez, E.R.; Romero, C.D. Physicochemical Characteristics of Minor Monofloral Honeys from Tenerife, Spain. LWT-Food Sci. Technol. 2014, 55, 572–578. [Google Scholar] [CrossRef]
- Nozal, M.J.; Bernal, J.L.; Toribio, L.; Jiménez, J.J.; Martín, M.T. High-Performance Liquid Chromatographic Determination of Methyl Anthranilate, Hydroxymethylfurfural and Related Compounds in Honey. J. Chromatogr. A 2001, 917, 95–103. [Google Scholar] [CrossRef]
- Belitz, H.-D.; Grosch, W. Sugars, Sugar Alcohols and Honey. In Food Chemistry; Springer: Berlin/Heidelberg, Germany, 1999; pp. 801–828. [Google Scholar] [CrossRef]
- Shapla, U.M.; Solayman, M.; Alam, N.; Khalil, M.I.; Gan, S.H. 5-Hydroxymethylfurfural (HMF) Levels in Honey and Other Food Products: Effects on Bees and Human Health. Chem. Cent. J. 2018, 12, 35. [Google Scholar] [CrossRef]
- Bath, P.K.; Singh, N. A Comparison between Helianthus Annuus and Eucalyptus Lanceolatus Honey. Food Chem. 1999, 67, 389–397. [Google Scholar] [CrossRef]
- Kozłowicz, K.; Różyło, R.; Gładyszewska, B.; Matwijczuk, A.; Gładyszewski, G.; Chocyk, D.; Samborska, K.; Piekut, J.; Smolewska, M. Identification of Sugars and Phenolic Compounds in Honey Powders with the Use of GC–MS, FTIR Spectroscopy, and X-Ray Diffraction. Sci. Rep. 2020, 10, 16269. [Google Scholar] [CrossRef]
- Anjos, O.; Campos, M.G.; Ruiz, P.C.; Antunes, P. Application of FTIR-ATR Spectroscopy to the Quantification of Sugar in Honey. Food Chem. 2015, 169, 218–223. [Google Scholar] [CrossRef] [PubMed]
- Pauliuc, D.; Ciursă, P.; Ropciuc, S.; Dranca, F.; Oroian, M. Physicochemical Parameters Prediction and Authentication of Different Monofloral Honeys Based on FTIR Spectra. J. Food Compos. Anal. 2021, 102, 104021. [Google Scholar] [CrossRef]
- Anguebes, F.; Pat, L.; Ali, B.; Guerrero, A.; Córdova, A.V.; Abatal, M.; Garduza, J.P. Application of Multivariable Analysis and FTIR-ATR Spectroscopy to the Prediction of Properties in Campeche Honey. J. Anal. Methods Chem. 2016, 2016, 5427526. [Google Scholar] [CrossRef] [Green Version]
- Gok, S.; Severcan, M.; Goormaghtigh, E.; Kandemir, I.; Severcan, F. Differentiation of Anatolian Honey Samples from Different Botanical Origins by ATR-FTIR Spectroscopy Using Multivariate Analysis. Food Chem. 2015, 170, 234–240. [Google Scholar] [CrossRef]
- Horvatinec, J.; Svečnjak, L. Infrared (FTIR) Spectral Features of Honey Bee (Apis mellifera L.) Hemolymph. J. Cent. Eur. Agric. 2020, 21, 37–41. [Google Scholar] [CrossRef]
- Ciursa, P.; Oroian, M. Rheological Behavior of Honey Adulterated with Agave, Maple, Corn, Rice and Inverted Sugar Syrups. Sci. Rep. 2021, 11, 23408. [Google Scholar] [CrossRef]
- Nguyen, H.T.L.; Panyoyai, N.; Paramita, V.D.; Mantri, N.; Kasapis, S. Physicochemical and Viscoelastic Properties of Honey from Medicinal Plants. Food Chem. 2018, 241, 143–149. [Google Scholar] [CrossRef] [PubMed]
- Sperling, L.H. Introduction to Physical Polymer Science, 4th ed.; John Wiley & Sons: Hoboken, NJ, USA, 2005. [Google Scholar]
- Roos, Y.H. Glass Transition Temperature and Its Relevance in Food Processing. Annu. Rev. Food Sci. Technol. 2010, 1, 469–496. [Google Scholar] [CrossRef]
- Cordella, C.; Antinelli, J.F.; Aurieres, C.; Faucon, J.P.; Cabrol-Bass, D.; Sbirrazzuoli, N. Use of Differential Scanning Calorimetry (DSC) as a New Technique for Detection of Adulteration in Honeys. 1. Study of Adulteration Effect on Honey Thermal Behavior. J. Agric. Food Chem. 2002, 50, 203–208. [Google Scholar] [CrossRef]
- Ouchemoukh, S.; Schweitzer, P.; Bachir Bey, M.; Djoudad-Kadji, H.; Louaileche, H. HPLC Sugar Profiles of Algerian Honeys. Food Chem. 2010, 121, 561–568. [Google Scholar] [CrossRef]
- Jouppila, K.; Roos, Y.H. Glass Transitions and Crystallization in Milk Powders. J. Dairy Sci. 1994, 77, 2907–2915. [Google Scholar] [CrossRef]
- Genin, N.; René, F. Analyse Du Rôle de La Transition Vitreuse Dans Les Procédés de Conservation Agro-Alimentaires. J. Food Eng. 1995, 26, 391–408. [Google Scholar] [CrossRef]
- Kim, M.J.; Yoo, B. Glass Transition Temperature of Honey Using Modulated Differential Scanning Calorimetry (MDSC): Effect of Moisture Content. J. Food Sci. Nutr. 2010, 15, 356–359. [Google Scholar] [CrossRef] [Green Version]
- Roos, Y.; Karel, M. Applying State Diagrams to Food Processing and Development. Food Technol. 1991, 45, 66–68. [Google Scholar]


| Parameter | Honey Type | F Value | ||||||
|---|---|---|---|---|---|---|---|---|
| Acacia | Mint | Rape | Raspberry | Sunflower | Thyme | Tilia | ||
| L* | 44.01(0.39) e | 42.50(0.39) d | 36.44(0.39) b | 38.39(0.39) c | 33.60(0.39) a | 35.23(0.39) b | 37.76(0.39) c | 95.41 *** |
| h*ab | 84.48(0.83) c | 78.24(0.83) b | 92.87(0.83) d | 74.19(0.83) a | 82.37(0.83) c | 81.07(0.83) c | 83.21(0.83) c | 47.50 *** |
| C*ab | 24.99(0.25) d | 21.08(0.25) b | 18.33(0.25) a | 25.19(0.25) d | 23.09(0.25) c | 26.95(0.25) e | 29.04(0.25) f | 215.22 *** |
| Pfund, mm Pfund | 12.87(0.44) a | 63.86(0.44) e | 36.14(0.44) c | 63.36(0.44) e | 33.66(0.44) b | 39.60(0.44) d | 35.64(0.44) c | 1623.21 *** |
| pH | 4.31(0.04) b | 4.52(0.04) c | 4.11(0.04) a | 4.27(0.04) b | 4.04(0.04) a | 4.03(0.04) a | 4.05(0.04) a | 19.17 ** |
| Free Acidity, meq/kg | 3.86(0.21) a | 33.17(0.21) g | 17.33(0.21) c | 24.06(0.21) f | 18.32(0.21) d | 19.31(0.21) e | 14.55(0.21) b | 1874.80 *** |
| Electrical conductivity, μS/cm | 122.27(3.70) a | 601.92(3.70) g | 146.67(3.70) b | 518.76(3.70) f | 314.82(3.70) d | 242.55(3.70) c | 333.63(0.70) e | 2368.37 *** |
| Moisture, % | 15.96(0.17) b | 16.24(0.17) b c | 17.31(0.17) d | 17.27(0.17) d | 16.95(0.17) d | 15.25(0.17) a | 16.75(0.17) c d | 20.45 *** |
| HMF, mg/kg | 18.97(0.14) e | 10.52(0.14) c | 9.48(0.14) b | 6.51(0.14) a | 10.96(0.14) c | 19.12(0.14) e | 13.34(0.14) d | 1239.39 *** |
| Fructose, % | 37.19(0.36) c | 34.20(0.36) a b | 35.23(0.36) b | 34.62(0.36) a b | 34.53(0.36) a b | 38.97(0.36) d | 33.65(0.36) a | 28.20 *** |
| Glucose, % | 25.93(0.28) b c | 24.41(0.28) a | 36.09(0.28) e | 25.79(0.28) b c | 26.15(0.28) c | 25.17(0.28) a b | 30.61(0.28) d | 219.29 *** |
| Sucrose, % | 0.45(0.006) e | 0.30(0.006) d | ND | 0.13(0.006) b | 1.37(0.006) f | 0.17(0.006) c | ND | 7125.60 *** |
| Turanose, % | 0.17(0.002) d | 0.07(0.002) a | 0.29(0.002) f | 0.11(0.002) b | 0.12(0.002) c | 0.20(0.002) e | 0.36(0.002) g | 2270.48 *** |
| Maltose, % | 2.19(0.02) e | 2.25(0.02) f | 0.94(0.02) a | 1.84(0.02) c | 1.99(0.02) d | 2.34(0.02) g | 1.15(0.12) b | 849.50 *** |
| Trehalose, % | 1.15(0.02) b | 2.62(0.02) e | 0.99(0.02) a | 2.31(0.02) d | 3.17(0.02) f | 2.63(0.02) e | 1.45(0.02) c | 1452.81 *** |
| Melezitose, % | 1.32((0.01) e | 1.46(0.01) f | 0.63(0.01) a | 1.24(0.01) d | 0.98(0.01) c | 1.63(0.01) g | 0.75(0.01) b | 941.37 *** |
| Raffinose, % | 0.51(0.005) e | 0.62(0.005) f | 0.11(0.005) a | 0.44(0.005) d | 0.42(0.005) c | 0.73(0.005) g | 0.18(0.005) b | 2111.83 *** |
| F/G | 1.42(0.01) d | 1.39(0.01) d | 0.97(0.01) a | 1.33(0.01) c | 1.31(0.01) c | 1.53(0.01) e | 1.09(0.01) b | 223.58 *** |
| Honey Type | Transition 1 | Transition 2 | ||||||||||||
|---|---|---|---|---|---|---|---|---|---|---|---|---|---|---|
| T Onset x (°C) | Heat Flow (W/g) Onset y | T End x (°C) | Heat Flow (W/g) End y | T Midpoint (°C) | ΔCp (J/(g·°C)) | ΔH J/g | T Onset x(°C) | Heat Flow (W/g) Onset y | T End x (°C) | Heat Flow (W/g) End y | T Midpoint (°C) | ΔCp J/(g.°C) | ΔH J/g | |
| Sunflower | −45.82 | −0.24 | −40.48 | −0.32 | −43.13 | 0.47 | 1.06 | 41.98 | −0.47 | 52.31 | −0.56 | 47.14 | 0.58 | 4.38 |
| Raspberry | −38.54 | −0.18 | −33.18 | −0.25 | −35.86 | 0.41 | 3.46 | 40.39 | −0.39 | 48.89 | −0.45 | 44.58 | 0.35 | 3.06 |
| Mint | −41.03 | −0.17 | −38.35 | −0.22 | −39.66 | 0.27 | 1.88 | 40.98 | −0.37 | 45.38 | −0.48 | 43.14 | 0.65 | 5.20 |
| Thyme | −41.11 | −0.23 | −35.18 | −0.35 | −38.16 | 0.70 | 0.90 | 40.66 | −0.44 | 48.79 | −0.62 | 44.72 | 1.06 | 10.16 |
| Rape | −43.24 | −0.17 | −39.81 | −0.23 | −41.52 | 0.34 | 1.92 | 40.67 | −0.36 | 47.80 | −0.44 | 44.22 | 0.50 | 4.74 |
| Acacia | −41.74 | −0.18 | −38.31 | −0.28 | −40.08 | 0.60 | 4.07 | - | - | - | - | - | - | - |
| Tilia | −43.14 | −0.23 | −39.30 | −0.29 | −41.22 | 0.32 | 1.53 | 39.84 | −0.40 | 49.40 | −0.51 | 44.62 | 0.66 | 5.03 |
Publisher’s Note: MDPI stays neutral with regard to jurisdictional claims in published maps and institutional affiliations. |
© 2022 by the authors. Licensee MDPI, Basel, Switzerland. This article is an open access article distributed under the terms and conditions of the Creative Commons Attribution (CC BY) license (https://creativecommons.org/licenses/by/4.0/).
Share and Cite
Pauliuc, D.; Dranca, F.; Ropciuc, S.; Oroian, M. Advanced Characterization of Monofloral Honeys from Romania. Agriculture 2022, 12, 526. https://doi.org/10.3390/agriculture12040526
Pauliuc D, Dranca F, Ropciuc S, Oroian M. Advanced Characterization of Monofloral Honeys from Romania. Agriculture. 2022; 12(4):526. https://doi.org/10.3390/agriculture12040526
Chicago/Turabian StylePauliuc, Daniela, Florina Dranca, Sorina Ropciuc, and Mircea Oroian. 2022. "Advanced Characterization of Monofloral Honeys from Romania" Agriculture 12, no. 4: 526. https://doi.org/10.3390/agriculture12040526