Article

Barley-Based Cropping Systems and Weed Control Strategies Influence Weed Infestation, Soil Properties and Barley Productivity

1
Department of Agronomy, Bahauddin Zakariya University, Multan 60800, Pakistan
2
Department of Soil Science, Bahauddin Zakariya University, Multan 60800, Pakistan
3
College of Agriculture, Bahauddin Zakariya University, Bahadur Sub-Campus, Layyah 31200, Pakistan
4
Department of Plant Sciences, College of Agricultural and Marine Sciences, Sultan Qaboos University, Al-Khoud 123, Oman
5
Department of Plant Protection, Faculty of Agriculture, Harran University, Şanlıurfa 63050, Turkey
6
School of Veterinary and Life Sciences, Murdoch University, 90 South Street, Murdoch, WA 6150, Australia
*
Author to whom correspondence should be addressed.
Agriculture 2022, 12(4), 487; https://doi.org/10.3390/agriculture12040487
Submission received: 25 December 2021 / Revised: 14 March 2022 / Accepted: 28 March 2022 / Published: 30 March 2022
(This article belongs to the Special Issue Integrated Crop Management in Sustainable Agriculture)

Abstract

:
Barley-based cropping systems (BCS) alter barley production by influencing weed infestation rates and soil nutrient dynamics. This two-year field study evaluated the interactive effects of five BCS and five weed control strategies (WCS) on soil properties and the growth and yield of barley. Barley was planted in five different cropping systems, i.e., fallow-barley (FB), maize-barley (MaB), cotton-barley (CB), mungbean-barley (MuB) and sorghum-barley (SB). Similarly, five different WCS, weed-free (control, WF), weedy-check (control, WC), false seedbeds (FS), chemical control (CC) and use of allelopathic water extracts (AWE), were included in the study. The SB system had the highest soil bulk density (1.48 and 1.47 g cm−3 during the period 2017–2018 and 2018–2019, respectively) and lowest total soil porosity (41.40 and 41.07% during the period 2017–2018 and 2018–2019, respectively). However, WCS remained non-significant for bulk density and total soil porosity during both years of the study. Barley with WF had a higher leaf area index (5.28 and 4.75) and specific leaf area (65.5 and 64.9 cm−2 g−1) compared with barley grown under WC. The MuB system under WC had the highest values of extractable NH4-N (5.42 and 5.58 mg kg−1), NO3-N (5.79 and 5.93 mg kg−1), P (19.9 and 19.5 mg kg−1), and K (195.6 and 194.3 mg kg−1) with statistically similar NO3-N in the MaB system under WC and extractable K in the MuB system under FS. Grain yield ranged between 2.8–3.2 and 2.9–3.3 t ha−1 during the period 2017–2018 and 2018–2019, respectively, among different WCS. Similarly, grain yield ranged between 2.9–3.2 and 3.0–3.2 t ha−1 during the period 2017–2018 and 2018–2019, respectively, within different BCS. Among WCS, the highest grain yield (3.29 and 3.32 t ha−1) along with yield-related traits of barley were in WF as compared to WC. Overall, MuB system recorded better yield and yield-related traits, whereas the lowest values of these traits were recorded for FB systems. In conclusion, the MuB system with WF improved soil characteristics and barley yield over other cropping systems. The AWE significantly suppressed weeds and was equally effective as the chemical control. Therefore, MuB and AWE could be used to improve barley productivity and suppress weeds infestation.

1. Introduction

The type and sequence of the crops grown over a large area and practices opted for the production of the crops are collectively known as cropping systems [1]. Overall, the cropping system refers to all cropping sequences being practiced over a large area. Successful crop production in a particular cropping system depends on the management of different components of that system. Significant management efforts are needed regarding tillage, crop residue management, cropping sequence, nutrients, irrigation and erosion control to successfully grow a crop in a specific cropping system [1]. Soil and water conservation greatly depend on the management of the cropping system. A balanced and well-designed cropping system increases soil fertility, decreases soil erosion, and improves soil properties. However, a cropping system with poor management results in decreased soil fertility and increased erosion. A narrow cropping system (monocropping) results in reduced crop diversity, poor soil properties, increased use of fertilizers and pesticides, weed and pest invasions, and reduced crop yields [1]. Therefore, a cropping system should be diverse and include the crops which could improve soil properties, decrease weed infestation and have higher economic benefits.
Soil chemical properties are significantly altered by the cropping system through moisture and nutrient uptake and the amount and quality of crop residues [2]. The crops included in a cropping system significantly differ for nutrient removal from the soil; however, the nutrient status of the soil could be improved through returned residues after crop harvest [3,4]. The legumes can fix atmospheric nitrogen (N), and their residues could supply it to the crops sown after them. Mono-cropping of maize (Zea mays L.) resulted in lower nutrients in the soil compared to the cropping system containing soybean (Glycine max L.) in rotation [3]. Similarly, soil phosphorus contents are increased in diversified cropping systems compared to mono-cropping systems. Hence, diversifying cropping systems with legumes could improve soil properties compared with narrow cropping systems.
Adaptation of a suitable cropping system has a significant role in sustainable agricultural production [5]. The inclusion of various crops in the cropping systems plays a significant role in maintaining soil fertility. Legumes help to lower N2O emission along with accelerating the decomposition of mineralizable N-containing compounds and hence improve plant nutrition [6,7]. Similarly, the addition of allelopathic crops like millet (Pennisetum glaucum (L.) R.Br.), wheat (Triticum aestivum L.), sunflower (Helianthus annuus L.), maize, sorghum (Sorghum bicolor L.), buckwheat (Fagopyrum esculentum Moench), rice (Oryza sativa L.) and canola (Brassica napus L.) in crop rotations can suppress the weed flora and improve the crop yields [8,9].
Barley (Hordeum vulgare L.) is one of the oldest domesticated cereals, which currently ranks fourth after maize, wheat, and rice in terms of production globally [10]. It is cultivated for brewing and malting processes, human food, and livestock fodder. Barley was cultivated over 60 thousand ha in Pakistan during the period 2017–2018 which produced 58 thousand tonnes of barley grains [11]. The average barley yield in the country is 0.95 tonnes per ha which is far below the global average of 3 t per ha. The annual barley demand of Pakistan is 100 thousand tonnes. In total, 40 thousand tonnes of barley are imported to fulfill the country’s requirements. Weed infestation, low yielding cultivars, cultivation on marginal lands and poor crop management are responsible for the low average yield in the country [11].
Weed infestation significantly reduces the yield and quality of barley [12,13,14,15]. Weeds compete with crops for essential resources (moisture, nutrients, and light) resulting in lower crop productivity. Weeds could decrease barley yields by 50% depending upon the nature of weed species and the intensity of infestation [13]. Therefore, the successful management of weeds is necessary to improve the yield of barley. Different weed-controlling methods (chemical, mechanical, allelopathic, cultural, and biological) are used to manage weed infestation in barley. Herbicides are used for weed management in barley; however, concerns are raising on their use due to environmental pollution and negative impacts on human health. The rising herbicide costs and evolution of herbicide resistance require alternative weed management methods in barley.
Allelopathy is a relatively environmentally friendly weed management approach compared to herbicides [16]. Allelopathy is the biological phenomenon in which biochemicals produced by one plant negatively or positively influence the germination, growth, survival, and reproduction of other organisms. Allelopathy has been exploited to suppress weeds in different crops through the use of allelopathic crop water extracts [17,18,19], inclusion of allelopathic crops in cropping systems [20,21,22] and mulches [23]. All these methods significantly reduced weed infestation; therefore, they can be combined with other methods for suppressing weed flora in different cropping systems.
False seedbeds are another weed management technique used for suppressing weed infestation in winter and summer crops. The false seedbed technique is the preparation of a seedbed before sowing the crop which results in the emergence of weeds well before a crop is sown. The subsequent tillage operations used to prepare the true seedbed destroy the emerged weeds; thus, providing significant control over weed infestation. False seedbed preparation reduced weed infestation up to 85% as compared to the direct sowing method [12]. However, the efficiency of this method depends on various factors like soil and climatic situations, and the method and time of preparation of seedbeds [24].
Weed management strategies and cropping systems significantly affect weed infestation, soil physico-chemical properties, crop allometry, and crop yield [25,26,27,28]. However, the interactive effect of barley-based cropping systems and weed management methods on weed infestations, soil physico-chemical properties, crop allometry, and barley yield has not been investigated. Therefore, this study was conducted to investigate the impact of different barley-based cropping systems (combinations with exhaustive, restorative, and allelopathic crops) and weed management strategies on soil physio-chemical properties, crop allometry, and barley growth and yield.

2. Materials and Methods

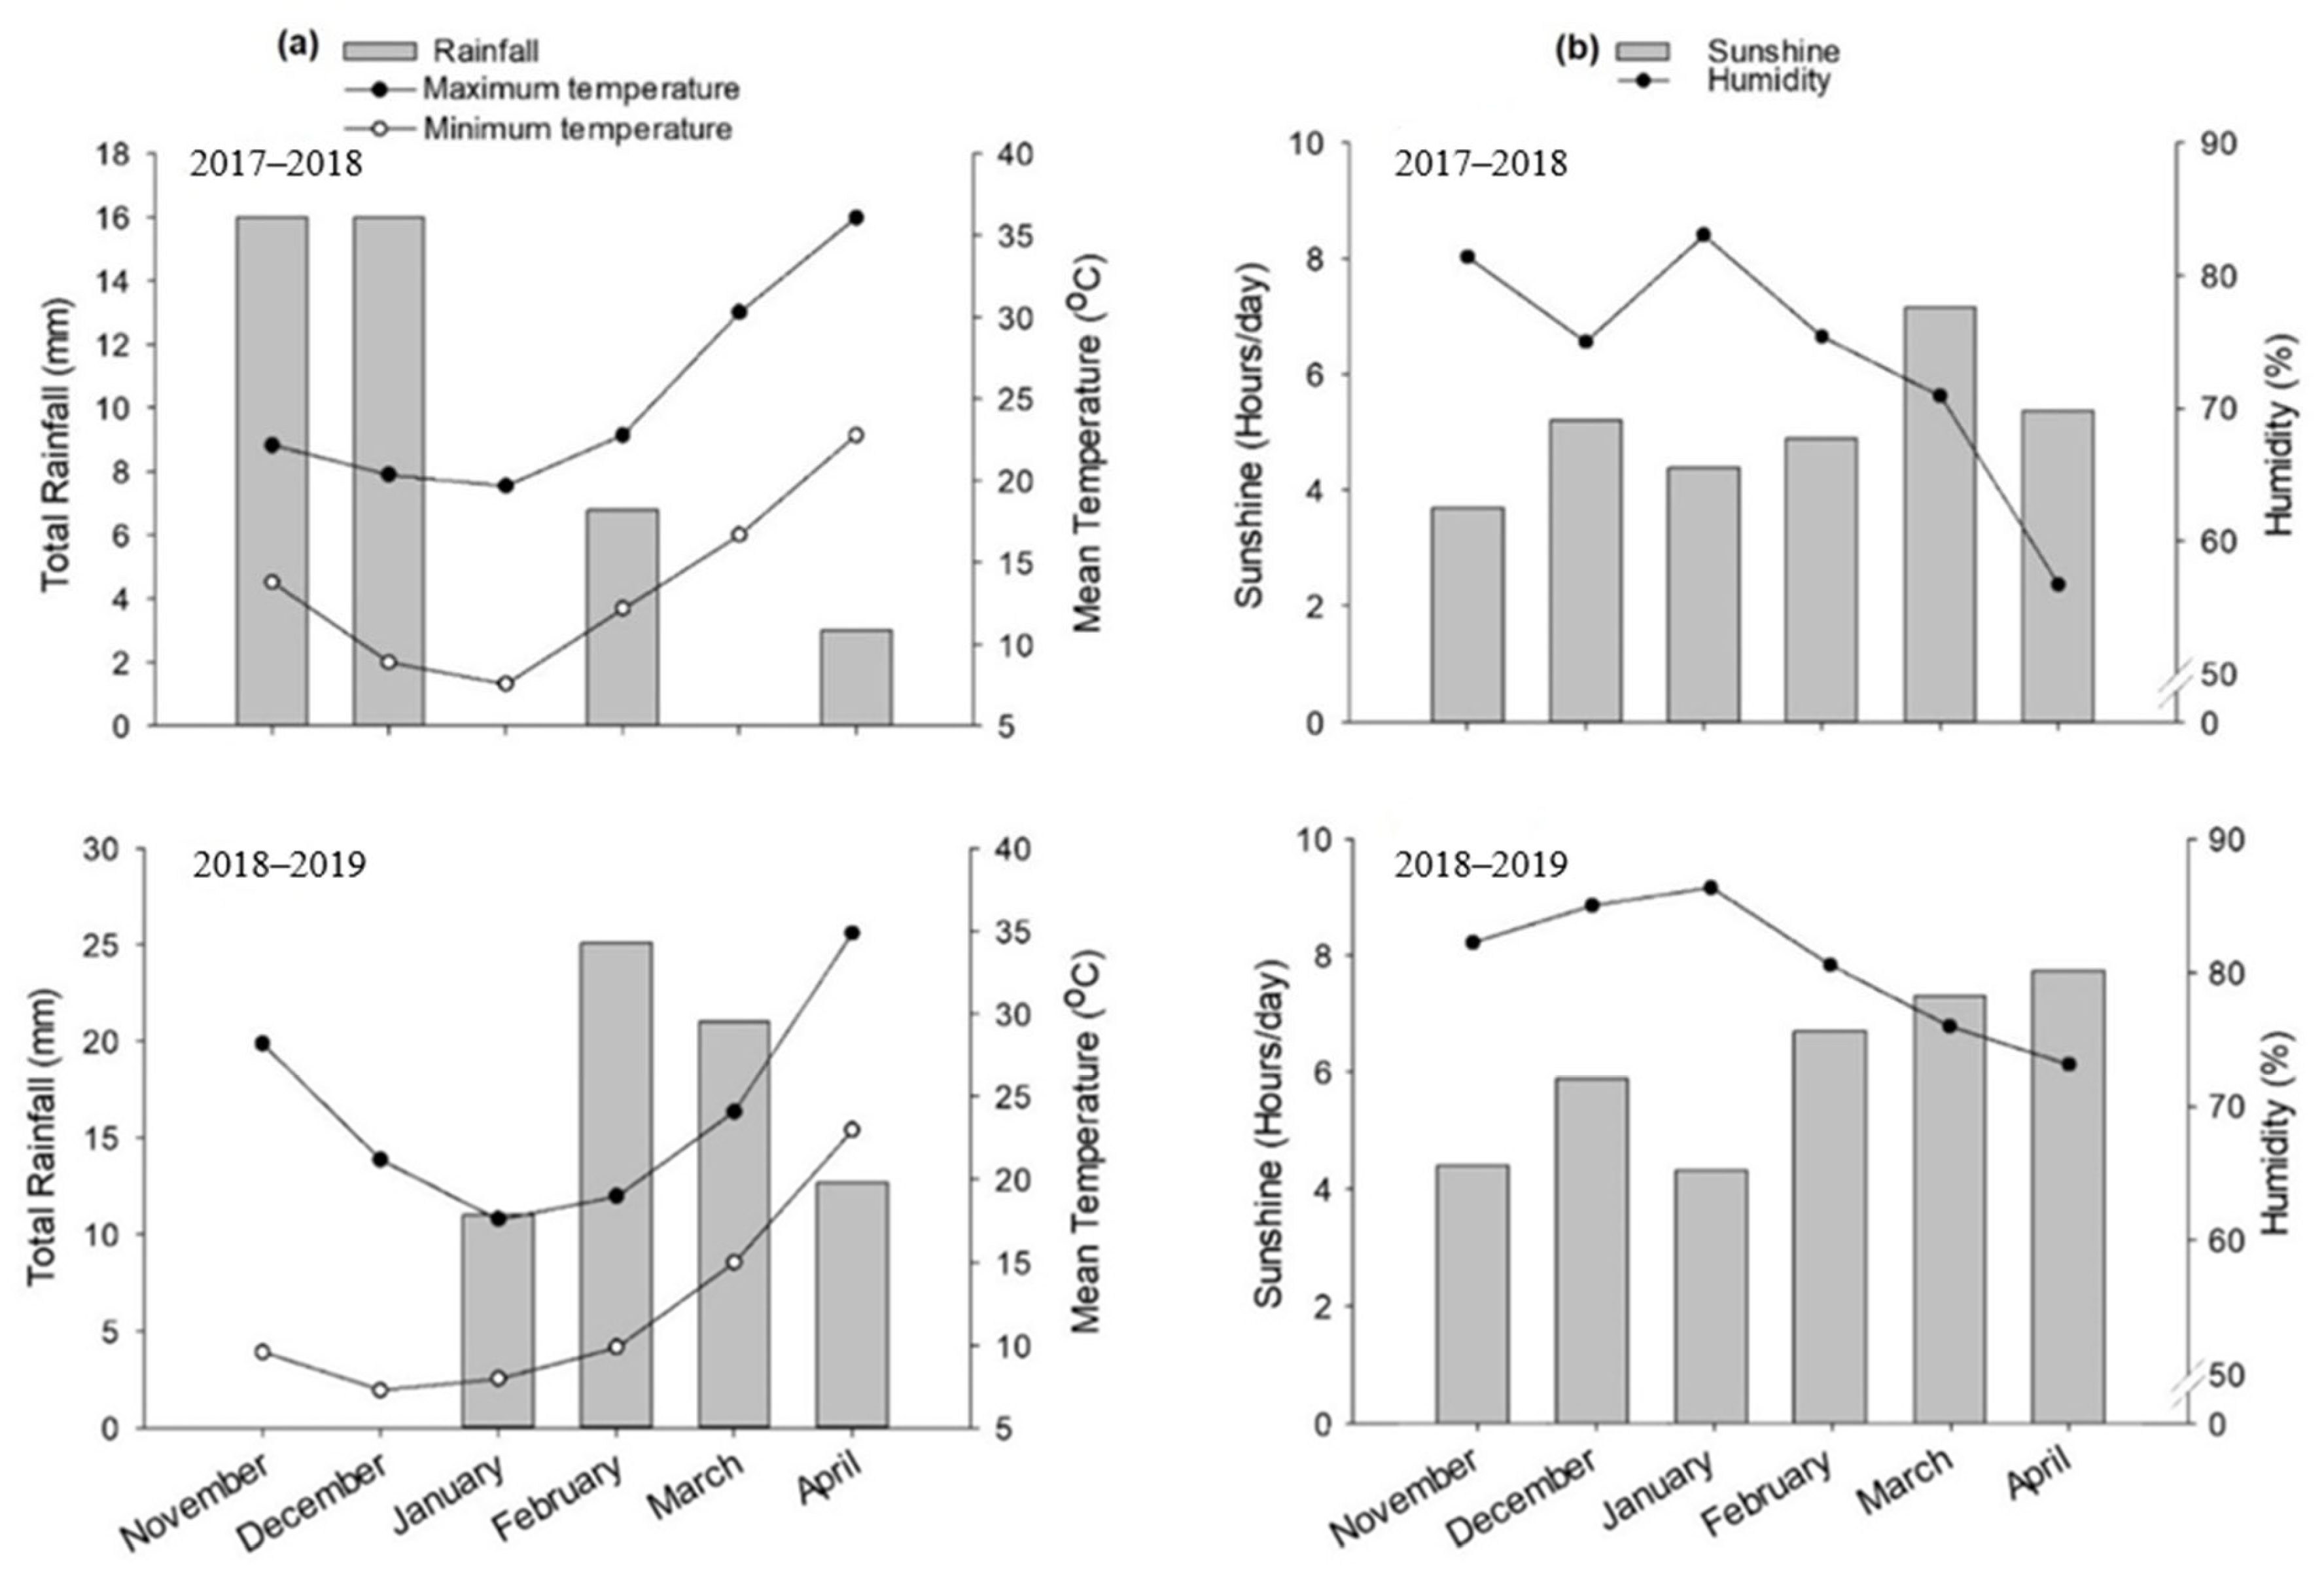
2.1. Experimental Site and Treatment

This two-year (2017–2019) field experiment was conducted at Agronomic Research Farm, Bahauddin Zakariya University, Multan (30.26° N, 71.51° E, and 122 m above sea level), Pakistan. The climate of Multan is arid to semi-arid. The weather data during the growth period are given in Figure 1. For pre-sowing soil analysis, soil samples (3 samples from the site designated for each cropping system) were collected (0–15 cm depth), dried, and crushed to pass through a 2 mm sieve. The soil was alkaline in reaction with a pH of 8.20. The other soil properties were: EC (2.78 dS m−1), organic matter content (0.60%), available N (0.03 mg kg−1), available phosphorus (P, 7.25 mg kg−1), and available potassium (K, 240 mg kg−1).
The experiment consisted of five barley-based cropping systems (BCS), i.e., fallow-barley (FB), maize-barley (MaB), cotton-barley (CB), mungbean-barley (MuB), and sorghum-barley (SB). The BCS were factorially combined with five weed control strategies (WCS), i.e., weed-free (WF), weedy-check (WC), false seedbeds (FS), chemical control (CC), and allelopathic weed control (AWE). The experiment was laid out following a randomized complete block design (RCBD) in a split-plot layout (cropping systems in main plots and weed control strategies in sub-plots). In both years, the experiment was replicated three times with a net plot size of 3 m × 5 m. For WF treatment, weeds were manually removed at their emergence during the entire barley growth period. In WC treatment, weeds were allowed to grow with no control measures. In FS, the plots were cultivated to destroy weeds one week before the seedbed preparation. For chemical control, Buctril M by Bayer Crop Science (Bromoxynil+MCPA (60% EC)) was sprayed (at 1.25 L ha−1) after one week of first irrigation to barley. In AWE, a balanced volume-based mixture (1:1:1:1) of water extracts of mulberry, sorghum, eucalyptus, and sunflower was sprayed (at 12 L ha−1; Shahzad et al. [28]) after one week of first irrigation to barley. The leaves and branches of all crops were taken, chopped into small pieces, and dried under the sun for the preparation of AWE. The dried materials were then soaked in distilled water (1:20 ratio), separately for 24 h. The solutions were filtered after 24 h to obtain the extracts. The resulting extracts were then mixed in a 1:1:1:1 ratio, diluted by 10 times and sprayed.

2.2. Crop Husbandry

During both seasons, pre-soaking irrigation of 10 cm was applied to the experimental area. Seedbeds of all crops were prepared once the soil reached field capacity. All crops were cultivated as per recommended production technology for the area and are shown in Table 1. Barley was manually sown in lines with a hand drill. The crop was irrigated according to its requirement (6 cm of water in each irrigation) by following the surface irrigation method. The fertilizers applied were urea and di-ammonium phosphate (DAP). The full dose of P and 1/3rd of N was applied at sowing time. The remaining doses of N were applied at first and second irrigations. Diseases, insects, and pests were controlled in both cropping seasons by following the recommended agronomic and crop protection measures. The barley crop was harvested once all the ear heads turned yellow. After proper cleaning and winnowing, the grain yield of each plot was noted at 12% moisture content. The experiment was conducted in the same field during both years of the study.

2.3. Post-Harvest Soil Analysis

For post-harvest soil analysis, composite soil samples were collected (0–15 cm depth) from each experimental unit. The samples were oven-dried at 105 °C for 24 h to measure dry weights and then bulk density [29] and total soil porosity [30] were determined. Another batch of composite soil samples was air-dried and sieved through a 2 mm sieve. Plant-available concentrations of NH4-N, NO3-N, P, and K in the soil were estimated by ammonium bicarbonate-DTPA method (AB-DTPA) as detailed by Soltanpour and Workman [31].

2.4. Weed Dry Biomass

Data for weed biomass were collected at the booting stage of the barley crop (Zadok stage 4.5). An area of 1 m2 was selected randomly from each experimental unit, and all weeds present in the area were collected. Collected weeds were sun-dried followed by oven drying until a constant weight was reached. The weight of dried weeds was recorded on an electronic balance.

2.5. Allometric Traits of Barley

Allometric traits of barley were estimated 105 days after sowing (DAS). Three places (0.5 m row of barley) were harvested to ground level, leaves were separated from harvested plants and immediately weighed to record fresh leaf weight. Leaf area was then assessed by using a leaf area meter (DT Area Meter, model MK2). The measured leaf area was converted to the total leaf area of the harvested samples. After that, the leaf area index (LAI) was calculated as a ratio of total leaf area to ground area [32]. The leaf samples were then dried in an oven and weighed. Specific leaf area (SLA) was calculated as total leaf area to leaf dry weight [33].

2.6. Agronomic and Yield-Related Traits of Barley

The number of productive tillers was counted from three random positions (1 m2) within each experimental unit and averaged. The number of grains per spike was noted from each experimental unit at crop maturity by choosing twenty spikes at random. The 1000-grain weight was averaged from five samples of 1000 grains from each experimental unit. Crops from each experimental unit were harvested manually, dried under the sun, and weighed to record biological yield. The harvested samples were threshed to record grain yield. Harvest index (%) was determined as the proportion of seed yield to biological yield.

2.7. Statistical Analysis

The collected data on allometric and yield-related traits of barley, weed dry biomass and soil properties were analyzed in four different steps. First, the differences among years were tested, which were significant. Therefore, data from both years were analyzed and interpreted separately. Normality in the dataset was tested in the second step through a Shapiro–Wilk normality test [34] and variables with non-normal distribution were normalized by the Arcsine transformation technique. Two-way analysis of variance (ANOVA) was used in the third step to infer the significance in the data. The least significant difference (LSD) post hoc test at a 5% level of probability [35] was used to rank the means of different treatments where ANOVA indicated significant differences. The interactive effect of BCS and WCS was non-significant for most of the recorded traits, except soil NH4-N, soil NO3-N, number of productive tillers per plant, number of grains per spike and weed dry biomass. Therefore, individual effects of BCS and WCS were presented and interpreted for the traits having non-significant BCS by WCS interaction. For the traits having significant BCS by WCS interaction, each BCS was analyzed for its effects on all WCS. Similarly, all WCS were individually analyzed for their impact on different BCS. All statistical computations were done on SPSS statistical software version 21 [36].

3. Results

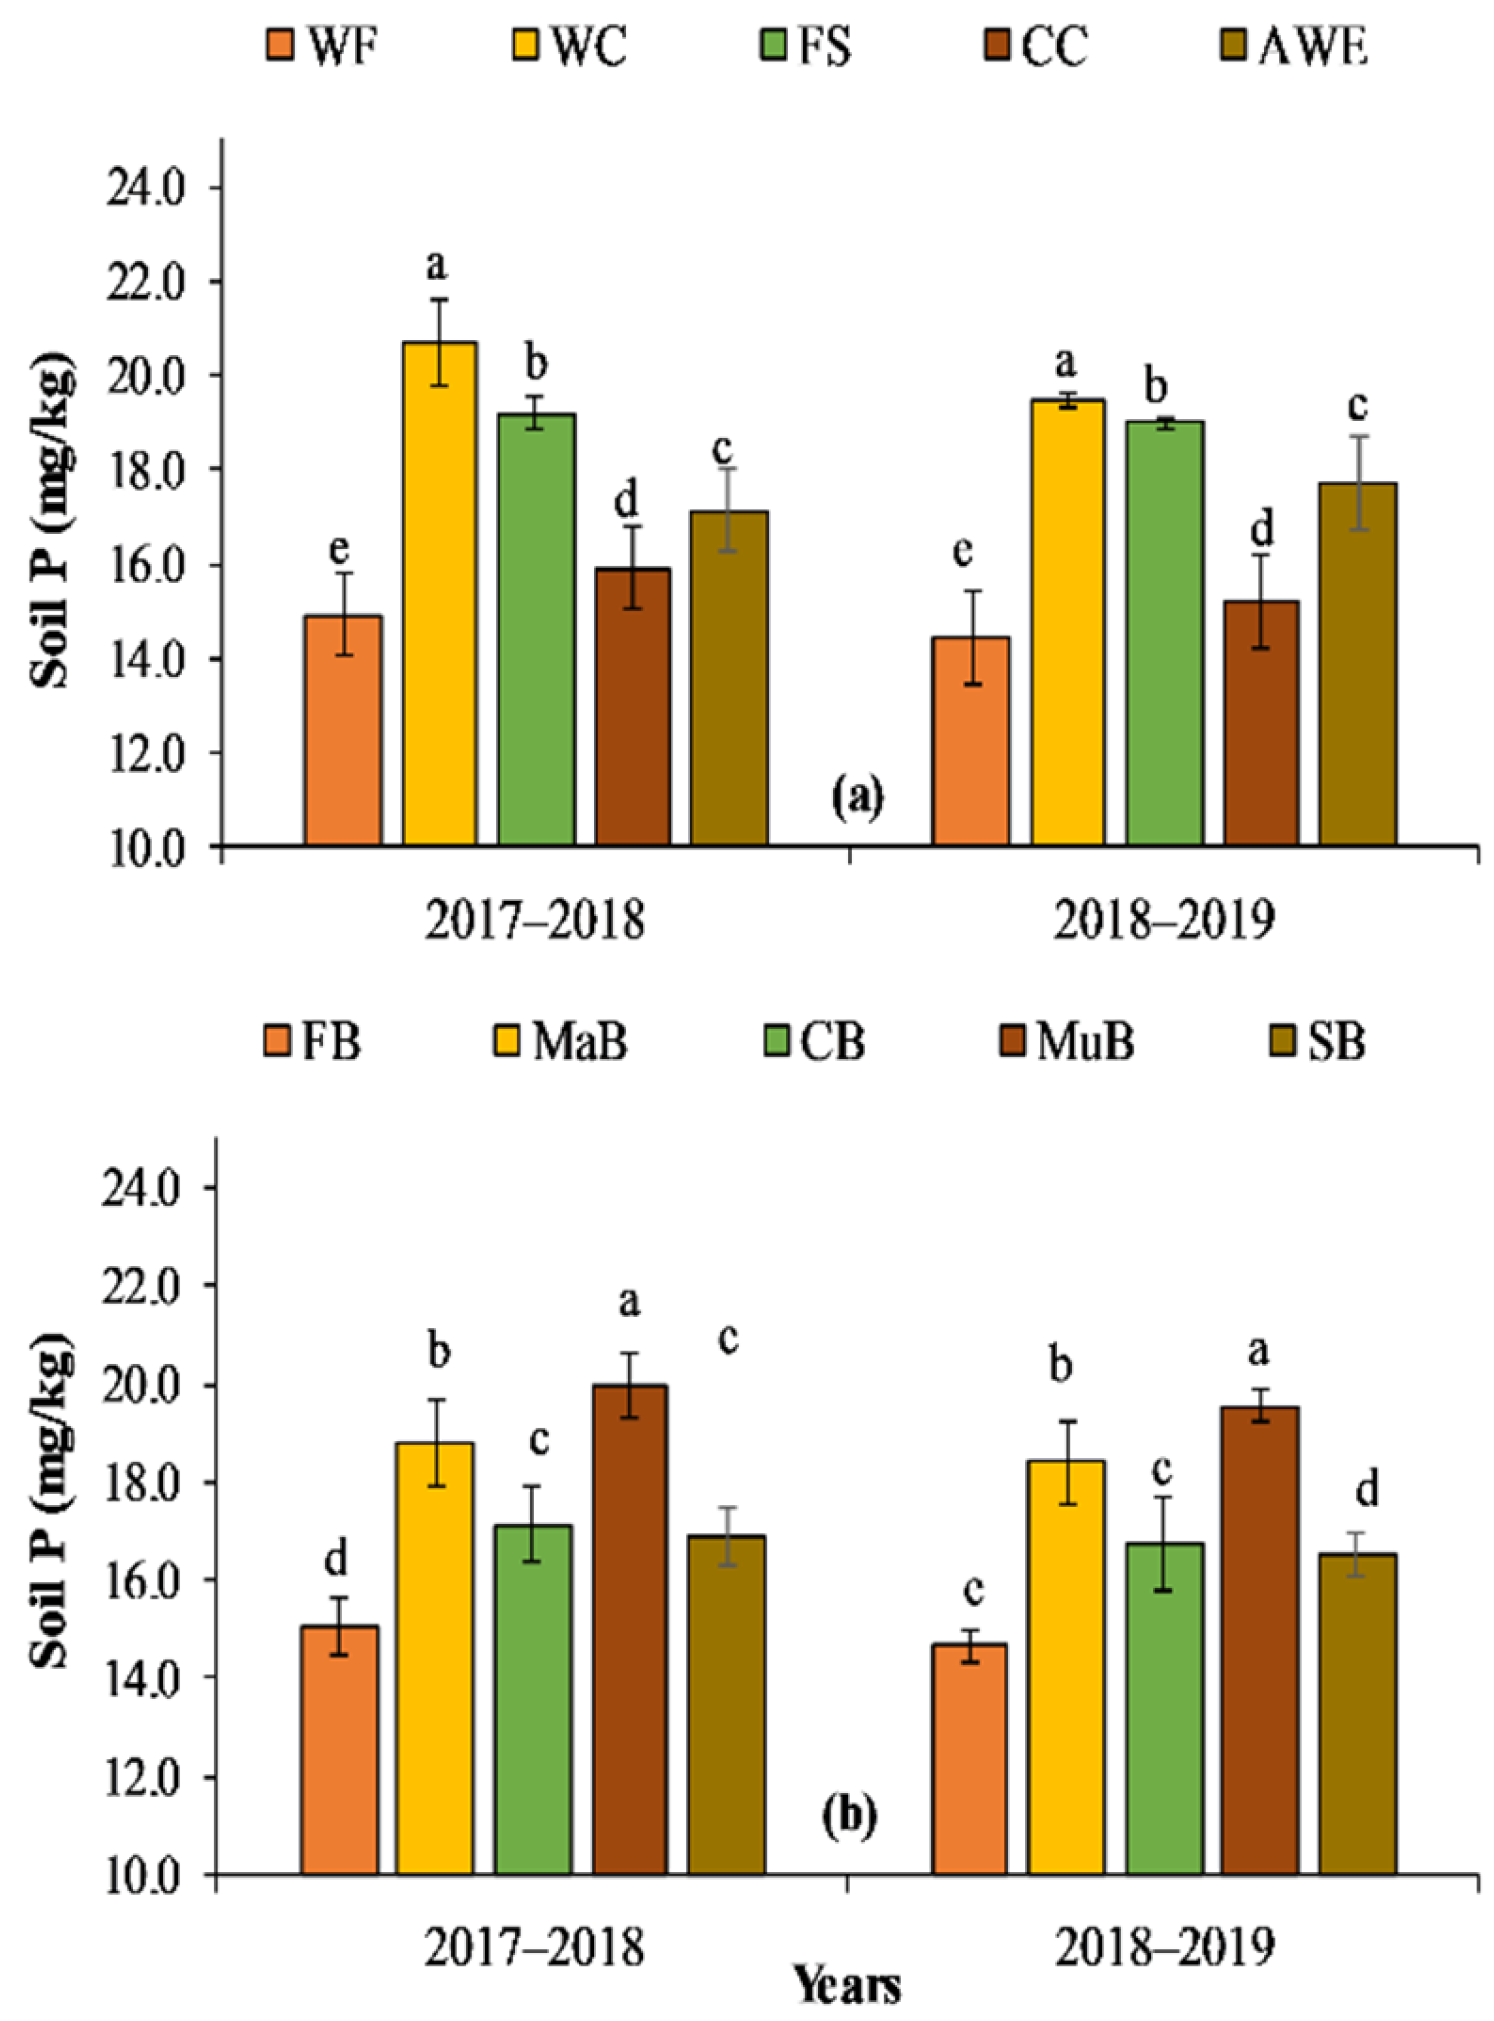
3.1. Soil Properties

Different WCS had non-significant impact on soil bulk density during both years of the study; however, BCS significantly altered it. The SB cropping system recorded the highest soil bulk density during both years of study, whereas FB recorded the lowest values for bulk density during both years (Figure 2).
Different WCS had a non-significant impact on soil porosity during both years of the study; however, BCS significantly altered it. The FB, CB and MuB cropping systems recorded the highest values for soil porosity during both years of study, whereas SB recorded the lowest values during both years (Figure 3).
Soil available K was significantly altered by WCS and BCS during both years of the study. It ranged from 178 to 199 mg/kg during the period 2017–2018 and 179 to 197 mg/kg during the period 2018–2019 among different WCS included in the study. The WC and FS resulted in the highest values of soil available K during both years, whereas WF and CC treatments resulted in the lowest values of soil available K during both years (Figure 4). Similarly, soil available K ranged from 183 to 195 and 182 to 194 mg/kg during the periods 2017–2018 and 2018–2019, respectively. The highest and the lowest values for soil available K were recorded for MuB and FB cropping systems, respectively, during both years of the study (Figure 4).
Soil available P was significantly altered by WCS and BCS during both years of the study. It ranged from 14.9 to 20.6 and 14.4 to 19.4 mg/kg during the periods 2017–2018 and 2018–2019, respectively, for different WCS. The highest and the lowest soil available P was noted for WC and WF treatments, respectively, during both years (Figure 5). Similarly, soil available P ranged from 15.0 to 19.9 and 14.6 to 19.5 mg/kg during the periods 2017–2018 and 2018–2019, respectively, among different BCS. The highest and the lowest values for soil available P were recorded for MuB and FB cropping systems, respectively, during both years of the study (Figure 5).
The interactive effect of BCS and WCS significantly altered NH4-N during both years of the study. The NH4-N ranged from 3.74 to 5.42 mg kg−1 during the period 2017–2018, and 3.88 to 5.58 mg kg−1 during the period 2018–2019 (Table 2). All WCS recorded the highest (4.20–5.42 mg kg−1) NH4-N in the MuB cropping system during the period 2017–2018, whereas the lowest (3.74–4.98 mg kg−1) NH4-N was noted for the FB cropping system with all WCS. Similarly, all WCS recorded the highest (4.34–5.58 mg kg−1) NH4-N in the MuB cropping system against the lowest (3.88–4.98 mg kg−1) in the FB cropping system during the period 2018–2019 (Table 2). All BCS recorded the highest NH4-N in WC treatment, whereas the lowest values were recorded for WF treatment during both years of the study (Table 2).
The NO3-N was significantly affected by the interactive effect of BCS and WCS during both years of the study. The NO3-N ranged from 4.08 to 5.79 mg kg−1 during the period 2017–2018, and 4.22 to 5.93 mg kg−1 during the period 2018–2019 (Table 3). All WCS recorded the highest (4.54–5.79 mg kg−1) NO3-N in the MuB cropping system during the period 2017–2018, whereas the lowest (4.40–5.35 mg kg−1) NO3-N was noted for the FB cropping system with all WCS. Similarly, all WCS recorded the highest (4.68–5.93 mg kg−1) NH4-N in the MuB cropping system against the lowest (4.22–5.48 mg kg−1) in the FB cropping system during the period 2018–2019 (Table 3). All BCS recorded the highest NO3-N in WC treatment, whereas the lowest values were recorded for WF treatment during both years of the study (Table 3).

3.2. Weed Dry Biomass

The interactive effect of BCS and WCS significantly altered the dry biomass of observed weed species during both years of the study. The dry biomass ranged from 0.31 to 18.10 g/m−2 during the period 2017–2018, and 1.22 to 41.41 g/m−2 during the period 2018–2019 (Table 4). All BCS recorded the lowest dry biomass of weeds with CC, which was followed by AWE during both years of the study (Table 4). All BCS recorded the highest dry biomass of weeds with WC treatment, whereas the lowest values were recorded for the SB cropping system in both years of the study (Table 4). Overall, FB and CB were highly infested BCS, whereas SB was the least infested cropping system during both years of the study (Table 4).

3.3. Crop Allometry

The LAI was significantly altered by WCS and BCS during both years of the study. It ranged from 4.74 to 5.28 and 4.28 to 4.76 during the periods 2017–2018 and 2018–2019, respectively, among different WCS. The highest and the lowest LAI was noted for WF and WC treatments, respectively, during both years (Figure 6). Similarly, LAI ranged from 4.87 to 5.23 and 4.36 to 4.72 during the periods 2017–2018 and 2018–2019, respectively, within different BCS. The highest and the lowest values for LAI were recorded for SB and FB cropping systems, respectively, during both years of the study (Figure 6).
Different WCS and BCS significantly altered the SLA of barley crops during both years of the study. It ranged from 63.2 to 65.4 and 61.2 to 65.1 cm−2 g−1 during the periods 2017–2018 and 2018–2019, respectively, among different WCS. The highest and the lowest SLA was noted for WF and CC, and WC treatments, respectively, during both years (Figure 7). Similarly, SLA ranged between 62.7–65.0 and 62.2–64.8 cm−2 g−1 during the periods 2017–2018 and 2018–2019, respectively, within different BCS. The highest and the lowest values for SLA were recorded for MaB and MuB, and SB cropping systems, respectively, during both years of the study (Figure 7).

3.4. Yield and Associated Traits

The number of grains per spike was significantly affected by the interactive effect of BCS and WCS during both years of the study. The number of grains per spike ranged from 171 to 244 mg/kg−1 during the period 2017–2018, and 241 to 251 mg/kg−1 during the period 2018–2019 (Table 5). All WCS recorded a similar number of grains per spike under WF treatment. Similarly, SB and MuB WCS recorded the highest number of grains per spike with the rest of the WCS during both years of the study, whereas the FB cropping system recorded the lowest number of grains per spike (Table 5). All BCS (except FB) recorded a similar number of grains per spike with all WCS except WC, which recorded the lowest values (Table 5). The FB cropping system had a similar number of grains per spike under WF and CC treatments, whereas the lowest number of grains per spike was recorded for WC treatment (Table 5).
The number of productive tillers was significantly affected by the interactive effect of BCS and WCS during both years of the study. All WCS recorded a similar number of tillers in the MuB cropping system. Similarly, all BCS recorded the highest number of productive tillers in WF treatment, which were followed by CC and AWE during both years of study (Table 6).
Different WCS and BCS significantly altered the 1000-grain weight of the barley crop during both years of the study. It ranged between 37.0–39.9 and 38.2–40.1 g during the periods 2017–2018 and 2018–2019, respectively, among different WCS. The highest and lowest 1000-grain weight was noted for WF and WC treatments, respectively, during both years (Figure 8). Similarly, the 1000-grain weight ranged between 37.3–39.1 and 37.6–39.3 g during the periods 2017–2018 and 2018–2019, respectively, within different BCS. The highest and the lowest values for the 1000-grain weight were recorded for MuB and FB cropping systems, respectively, during both years of the study (Figure 8).
Different WCS and BCS significantly altered the grain yield of barley crops during both years of the study. Grain yield ranged between 2.8–3.2 and 2.9–3.3 t/ha during the periods 2017–2018 and 2018–2019, respectively, among different WCS. The highest and the lowest grain yield was noted for WF and CC treatments, and WC and FS treatments, respectively, during both years (Figure 9). Similarly, grain yield ranged between 2.9–3.2 and 3.0–3.2 t/ha during the periods 2017–2018 and 2018–2019, respectively, within different BCS. The highest and the lowest values for grain yield were recorded for MuB and FB cropping systems, respectively, during both years of the study (Figure 9).
Different WCS and BCS significantly altered the biological yield of barley crops during both years of the study. Biological yield ranged between 9.7–10.4 and 9.8–10.5 t/ha during the periods 2017–2018 and 2018–2019, respectively, among different WCS. The highest and the lowest biological yield was noted for WF and CC treatments, and WC treatments, respectively, during both years (Figure 10). Similarly, biological yield ranged between 9.7–10.3 and 9.9–10.4 t/ha during the periods 2017–2018 and 2018–2019, respectively, within different BCS. The highest and the lowest values for biological yield were recorded for MuB and FB cropping systems, respectively, during both years of the study (Figure 10). The MaB and CB also produced comparable biological yields to MuB cropping system during both years of the study.
Different WCS and BCS significantly altered the harvest of barley crops during both years of the study. Harvest index ranged between 29.2–31.5 and 30.2–31.5% during the periods 2017–2018 and 2018–2019, respectively, among different WCS. The highest and the lowest harvest index was noted for WF and CC treatments, and WC treatment, respectively, during the period 2017–2018. However, all WCS (except WC) had a similar harvest index during the period 2018–2019 (Figure 11). Similarly, the harvest index ranged between 29.7–31.2 and 30.5–31.7% during the periods 2017–2018 and 2018–2019, respectively, within different BCS. The highest and the lowest values for harvest index were recorded for MuB and FB cropping systems, respectively, during both years of the study (Figure 11).

4. Discussion

Soil is a key component for plant growth and development as it provides physical support, water, and nutrients. Different crops have different root systems that significantly impact soil properties. The present study revealed that soil bulk density and porosity were significantly influenced by BCS (Figure 2 and Figure 3). The change in soil bulk density and soil porosity can be attributed to the differences in the root system of the crops [37]. Burr-Hersey et al. [38] reported that crops with a high root surface area (like fibrous root systems of barley and mungbean) proliferate more in the soil; thus, increasing soil porosity and reducing soil bulk density. Changes in soil bulk density and porosity due to different cropping systems also suggest the role of crop rotation in sustainable soil management [39,40].
Different BCS significantly influenced the nutrient status of the soil (Figure 4 and Figure 5). The macronutrients (P, K) were higher in the MuB cropping system followed by CB (Figure 4 and Figure 5). The high availability of soil macronutrients in the MuB system can be attributed to the restorative nature of mungbean crop [41,42,43] as it transorms atmospheric N2 into plant-available N. Moreover, the efficiency of soil microbes, which enhance P and K availability, also increases in legumes [41,43]. It may also be attributed to the influence of crop residue retention and management practices on soil nutrient dynamics. In WCS, the highest values for available NH4-N, NO3-N, P, and K contents were noted in WC, whereas the WF and CC had the lowest values (Table 2 and Table 3). It may be due to more weed–crop competition for essential resources and ultimately crops utilized more nutrients in WF treatment [25].
All cropping systems with WF and CC resulted in better allometric traits of barley as compared to WC (Figure 6 and Figure 7). The better allometric traits of barley crops may be due to less weed–crop competition for essential resources (i.e., water, light, and nutrients) in WF or CC; hence, improving crop performance. Moreover, herbicides improved crop performance by reducing weed dry biomass [44,45]. Babiker et al. [46] found that weeds in maize crops were reduced by 97% by using a herbicidal mixture (Gesaprim @1.6 kg ha−1 + Stomp @1.5 L ha−1). As compared to direct sowing, the preparation of false seedbeds is an efficient technique to control annual weeds and improve barley yield [12]. Similarly, allelopathic crops, e.g., sorghum, significantly reduced the dry biomass of weeds in the current study. Some crops like sunflower, barley, rice, sorghum and wheat have allelopathic potential to suppress weeds [47]. This potential is due to the presence of hydrophobic compounds (e.g., sorgoleone), phenolic acids and hydrophilic substances [48]. Weeds like Avena fatua L., Chenopodium album L., Phalaris minor Retz., etc. were significantly controlled by the use of aqueous extracts of allelopathic crops (Moringa oleifera Lam., 1785, Cannabis sativa L., and Parthenium hysterophorus L.), which increased crop yields [49]. Better weed control was achieved in this study due to the foliar application of allelopathic water extracts (eucalyptus, sunflower, mulberry, and sorghum).
Among BCS, the MuB system performed better, whereas the SB and FB systems resulted in poor allometric traits of barley (Table 5). The better allometric (Figure 2, Figure 3 and Figure 4) traits of barley in the MuB system are attributed to an increase in soil physical properties and fertility (Table 2 and Table 3), which ultimately enhanced the LAI, SLA and CGR [25,27]. Therefore, the MuB system improved the soil’s physical and fertility status, hence enhancing barley allometry (Figure 6 and Figure 7). Nonetheless, the SB system negatively influenced barley allometry. It may be due to the allelopathic potential of sorghum crops which reduced the weed’s population (as discussed above) and forthcoming barley performance. It was reported by Shirgapure and Ghosh [50] that the allelochemicals released from any crop can influence the growth of weeds and upcoming crops, and this effect was also observed in the current study.
The yield and related traits of barley were significantly affected by the different WCS (Table 5 and Table 6 and Figure 8, Figure 9, Figure 10 and Figure 11). Barley sown in WF and CC under MuB systems significantly improved the yield and related traits which may be attributed to improvement in soil physio-chemical properties under the MuB system. It may be due to better soil conditions which improved the crop performance as was described by Shahzad et al. [51]. The sowing of cereals after legumes can get N through biological N fixation [52] because the atmospheric N can be fixed by the bacteria existing in root nodules of legumes. However, barley yield was negatively influenced by sorghum crop in the SB system due to its allelopathic ability [53]. As discussed above, better allometric traits of barley in WF control significantly improved the yield-related traits of the crop. The interception of more light in WF control improved the LAI [54] also assimilate more carbohydrates which turn into productivity. Therefore, crop yield was better in WF control as compared to other weed management methods. Kandhro et al. [55] and Khaliq et al. [56] reported that AWE, FS and CC significantly improved the crop yield by decreasing the weed’s dry weight. The lowest crop yield in WC was due to competition of weeds with crops for necessary amounts of light, nutrients, and space [57].

5. Conclusions

Barley-based cropping systems and weed control systems interacted to improve soil physiochemical properties, weed control, growth and yield of barley crop. The MuB system under WF proved better for soil quality and crop yield. Moreover, AWE with MuB cropping system improved soil physiochemical properties, weed control, growth and yield of barley nearly equal to CC; hence, it is an eco-friendly approach which can be opted for sustainable barley production.

Author Contributions

Conceptualization, S.H., S.U.-A., M.F., S.F. and M.H.; Data curation, M.N. and W.A.M.; Formal analysis, M.N. and W.A.M.; Funding acquisition, M.H.; Methodology, S.U.-A.; Project administration, M.H.; Supervision, M.F. and M.H.; Validation, M.N. and S.H.; Visualization, M.N. and W.A.M.; Writing—original draft, M.N.; Writing—review and editing, W.A.M., S.H., S.F., S.U.-A., M.F. and M.H. All authors have read and agreed to the published version of the manuscript.

Funding

The first author acknowledges the financial grant from Higher Education Commission, Islamabad, Pakistan to complete the doctoral studies through grant number 17-6/HEC/HRD/IS-II-5/2019.

Institutional Review Board Statement

Not applicable.

Informed Consent Statement

Not applicable.

Data Availability Statement

All data are within the manuscript.

Acknowledgments

This paper forms part of the Ph.D. thesis of Muhammad Naeem (2021).

Conflicts of Interest

The authors declare no conflict of interest.

References

  1. Blanco-Canqui, H.; Lal, R. Cropping Systems. In Principles of Soil Conservation and Management; Springer: Dordrecht, The Netherlands, 2010; pp. 165–193. [Google Scholar]
  2. Sainju, U.M.; Alasinrin, S.Y. Changes in soil chemical properties and crop yields with long-term cropping system and nitrogen fertilization. Agrosyst. Geosci. Environ. 2020, 3, e20019. [Google Scholar] [CrossRef] [Green Version]
  3. Ashworth, A.J.; Allen, F.L.; DeBruyn, J.M.; Owens, P.R.; Sams, C. Crop Rotations and Poultry Litter Affect Dynamic Soil Chemical Properties and Soil Biota Long Term. J. Environ. Qual. 2018, 47, 1327–1338. [Google Scholar] [CrossRef] [PubMed] [Green Version]
  4. Sainju, U.M.; Allen, B.L.; Caesar-TonThat, T.; Lenssen, A.W. Dryland soil chemical properties and crop yields affected by long-term tillage and cropping sequence. Springerplus 2015, 4, 320. [Google Scholar] [CrossRef] [Green Version]
  5. Metherell, A.K.; Cambardella, C.A.; Parton, W.J.; Peterson, G.A.; Harding, L.A.; Cole, C. V Simulation of soil organic matter dynamics in dryland wheat-fallow cropping systems. In Soil Management and Greenhouse Effect; CRC Press: Boca Raton, FL, USA, 2018; pp. 259–270. ISBN 0203739310. [Google Scholar]
  6. Duchene, O.; Vian, J.-F.; Celette, F. Intercropping with legume for agroecological cropping systems: Complementarity and facilitation processes and the importance of soil microorganisms. A review. Agric. Ecosyst. Environ. 2017, 240, 148–161. [Google Scholar] [CrossRef]
  7. Scalise, A.; Pappa, V.A.; Gelsomino, A.; Rees, R.M. Pea cultivar and wheat residues affect carbon/nitrogen dynamics in pea-triticale intercropping: A microcosms approach. Sci. Total Environ. 2017, 592, 436–450. [Google Scholar] [CrossRef] [PubMed]
  8. Jabran, K. Allelopathy: Introduction and concepts. In Manipulation of Allelopathic Crops for Weed Control; Springer: Berlin/Heidelberg, Germany, 2017; pp. 1–12. [Google Scholar]
  9. Mennan, H.; Jabran, K.; Zandstra, B.H.; Pala, F. Non-Chemical Weed Management in Vegetables by Using Cover Crops: A Review. Agronomy 2020, 10, 257. [Google Scholar] [CrossRef] [Green Version]
  10. FAO. Available online: www.faostat.fao.org (accessed on 10 November 2021).
  11. GOP. Economic Survey of Pakistan; Govt. of Pakistan, Economic Advisory Wing: Islamabad, Pakistan, 2020.
  12. Kanatas, P.J.J.; Travlos, I.S.S.; Gazoulis, J.; Antonopoulos, N.; Tsekoura, A.; Tataridas, A.; Zannopoulos, S. The combined effects of false seedbed technique, post-emergence chemical control and cultivar on weed management and yield of barley in Greece. Phytoparasitica 2020, 48, 131–143. [Google Scholar] [CrossRef]
  13. Woźniak, A. Effect of various systems of tillage on winter barley yield, weed infestation and soil properties. Appl. Ecol. Environ. Res. 2020, 18, 3483–3496. [Google Scholar] [CrossRef]
  14. Watson, P.R.; Derksen, D.A.; Van Acker, R.C. The ability of 29 barley cultivars to compete and withstand competition. Weed Sci. 2006, 54, 783–792. [Google Scholar] [CrossRef]
  15. Mahajan, G.; Hickey, L.; Chauhan, B.S. Response of barley genotypes to weed interference in Australia. Agronomy 2020, 10, 99. [Google Scholar] [CrossRef] [Green Version]
  16. Mushtaq, W.; Siddiqui, M.B.; Hakeem, K.R. Allelopathic control of native weeds. In Allelopathy; Springer: Berlin/Heidelberg, Germany, 2020; pp. 53–59. [Google Scholar]
  17. Jabran, K.; Cheema, Z.A.; Farooq, M.; Hussain, M. lower doses of pendimethalin mixed with allelopathic crop water extracts for weed management in canola (Brassica napus). Int. J. Agric. Biol. 2010, 12, 335–340. [Google Scholar]
  18. Khan, M.B.; Ahmad, M.; Hussain, M.; Jabran, K.; Farooq, S.; Waqas-Ul-Haq, M. Allelopathic plant water extracts tank mixed with reduced doses of atrazine efficiently control Trianthema portulacastrum L. in Zea mays L. J. Anim. Plant Sci. 2012, 22, 339–346. [Google Scholar]
  19. Tanveer, A.; Jabbar, M.K.; Kahliq, A.; Matloob, A.; Abbas, R.N.; Javaid, M.M. Allelopathic effects of aqueous and organic fractions of Euphorbia dracunculoides Lam. on germination and seedling growth of chickpea and wheat. Chil. J. Agric. Res. 2012, 72, 495–501. [Google Scholar] [CrossRef]
  20. Farooq, M.; Khan, I.; Nawaz, A.; Cheema, M.A.; Siddique, K.H.M. Using sorghum to suppress weeds in autumn planted maize. Crop Prot. 2020, 133, 105162. [Google Scholar] [CrossRef]
  21. Mahmood, A.; Cheema, Z.A.; Mushtaq, M.N.; Farooq, M. Maize–sorghum intercropping systems for purple nutsedge management. Arch. Agron. Soil Sci. 2013, 59, 1279–1288. [Google Scholar] [CrossRef]
  22. Hussain, M.I.; Danish, S.; Sánchez-Moreiras, A.M.; Vicente, Ó.; Jabran, K.; Chaudhry, U.K.; Branca, F.; Reigosa, M.J. Unraveling Sorghum Allelopathy in Agriculture: Concepts and Implications. Plants 2021, 10, 1795. [Google Scholar] [CrossRef] [PubMed]
  23. Riaz Marral, M.W.; Khan, M.B.; Ahmad, F.; Farooq, S.; Hussain, M. The influence of transgenic (Bt) and non-transgenic (non-Bt) cotton mulches on weed dynamics, soil properties and productivity of different winter crops. PLoS ONE 2020, 15, e0238716. [Google Scholar] [CrossRef]
  24. Singh, R. Weed management in major kharif and rabi crops. In Proceedings of the National Training on Advances in Weed Management, Jabalpur, India, 13–18 December 2021; pp. 31–40. [Google Scholar]
  25. Naeem, M.; Farooq, M.; Farooq, S.; Ul-Allah, S.; Alfarraj, S.; Hussain, M. The impact of different crop sequences on weed infestation and productivity of barley (Hordeum vulgare L.) under different tillage systems. Crop Prot. 2021, 149, 105759. [Google Scholar] [CrossRef]
  26. Naeem, M.; Hussain, M.; Farooq, M.; Farooq, S. Weed flora composition of different barley-based cropping systems under conventional and conservation tillage practices. Phytoparasitica 2021, 49, 751–769. [Google Scholar] [CrossRef]
  27. Naeem, M.; Mehboob, N.; Farooq, M.; Farooq, S.; Hussain, S.; Ali, H.M.; Hussain, M. Impact of Different Barley-Based Cropping Systems on Soil Physicochemical Properties and Barley Growth under Conventional and Conservation Tillage Systems. Agronomy 2021, 11, 8. [Google Scholar] [CrossRef]
  28. Shahzad, M.; Jabran, K.; Hussain, M.; Raza, M.A.S.; Wijaya, L.; El-Sheikh, M.A.; Alyemeni, M.N. The impact of different weed management strategies on weed flora of wheat-based cropping systems. PLoS ONE 2021, 16, e0247137. [Google Scholar] [CrossRef]
  29. Blake, G.R.; Hartge, K.H. Bulk density. In Methods of Soil Analysis. Part 1 Physical and Mineralogical Methods, 5.1, 2nd ed.; American Society of Agronomy: Madison, WI, USA, 1986; pp. 363–375. [Google Scholar]
  30. Danielson, R.E.; Sutherland, P.L. Porosity. Methods Soil Anal. Part 1 Physical and Mineralogical Methods, 5.1, 2nd ed.; American Society of Agronomy: Madison, WI, USA, 1986; pp. 443–461. [Google Scholar]
  31. Soltanpour, P.N.; Workman, S. Modification of the NH4HCO3-DTPA Soil Test to Omit Carbon Black1. Commun. Soil Sci. Plant Anal. 1979, 10, 1411–1420. [Google Scholar] [CrossRef]
  32. Watson, D.J. Comparative physiological studies on the growth of field crops: I. Variation in net assimilation rate and leaf area between species and varieties, and within and between years. Ann. Bot. 1947, 11, 41–76. [Google Scholar] [CrossRef]
  33. Garnier, E.; Shipley, B.; Roumet, C.; Laurent, G. A standardized protocol for the determination of specific leaf area and leaf dry matter content. Funct. Ecol. 2001, 15, 688–695. [Google Scholar] [CrossRef]
  34. Shapiro, S.S.; Wilk, M.B. An analysis of variance test for normality (complete samples). Biometrika 1965, 52, 591–611. [Google Scholar] [CrossRef]
  35. Steel, R.; Torrei, J.; Dickey, D. Principles and Procedures of Statistics A Biometrical Approach; McGraw-Hill: New York, NY, USA, 1997. [Google Scholar]
  36. Ibm, C. SPSS Statistics for Windows; IBM Corp. Released, Version 20; IBM Corporation: Armonk, NY, USA, 2012; pp. 1–8. [Google Scholar]
  37. Çerçioğlu, M.; Anderson, S.H.; Udawatta, R.P.; Alagele, S. Effect of cover crop management on soil hydraulic properties. Geoderma 2019, 343, 247–253. [Google Scholar] [CrossRef]
  38. Burr-Hersey, J.E.; Mooney, S.J.; Bengough, A.G.; Mairhofer, S.; Ritz, K. Developmental morphology of cover crop species exhibit contrasting behaviour to changes in soil bulk density, revealed by X-ray computed tomography. PLoS ONE 2017, 12, e0181872. [Google Scholar] [CrossRef] [Green Version]
  39. Haruna, S.I.; Nkongolo, N.V. Tillage, cover crop and crop rotation effects on selected soil chemical properties. Sustainability 2019, 11, 2770. [Google Scholar] [CrossRef] [Green Version]
  40. de Moura, M.S.; Silva, B.M.; Mota, P.K.; Borghi, E.; de Resende, A.V.; Acuña-Guzman, S.F.; Araújo, G.S.S.; da Silva, L.D.C.M.; de Oliveira, G.C.; Curi, N. Soil management and diverse crop rotation can mitigate early-stage no-till compaction and improve least limiting water range in a Ferralsol. Agric. Water Manag. 2021, 243, 106523. [Google Scholar] [CrossRef]
  41. Naz, S.; Fatima, Z.; Iqbal, P.; Khan, A.; Zakir, I.; Noreen, S.; Younis, H.; Abbas, G.; Ahmad, S. Agronomic crops: Types and uses. In Agronomic Crops; Springer: Berlin/Heidelberg, Germany, 2019; pp. 1–18. [Google Scholar]
  42. Ali, H.Q.Z.; Choudhary, F.A.; Hayat, S.; Iqbal, R.; Khaliq, T.; Ahmad, A. Viable alternatives to cotton-wheat crop rotation for semi-arid climatic conditions. J. Dev. Agric. Econ. 2019, 11, 57–62. [Google Scholar]
  43. Ahmad, M.; Adil, Z.; Hussain, A.; Mumtaz, M.Z.; Nafees, M.; Ahmad, I.; Jamil, M. Potential of phosphate solubilizing Bacillus strains for improving growth and nutrient uptake in mungbean and maize crops. Pak. J. Agric. Sci. 2019, 56, 283–289. [Google Scholar]
  44. Singh, T.; Satapathy, B.S.; Gautam, P.; Lal, B.; Kumar, U.; Saikia, K.; Pun, K.B. Comparative efficacy of herbicides in weed control and enhancement of productivity and profitability of rice. Exp. Agric. 2018, 54, 363–381. [Google Scholar] [CrossRef]
  45. Alsaadawi, I.S.; Khaliq, A.; Farooq, M. Integration of allelopathy and less herbicides effect on weed management in field crops and soil biota: A Review. Plant Arch. 2020, 20, 225–237. [Google Scholar]
  46. Babiker, M.M.; Salah, A.E.; Mukhtaret, M.U. Impact of herbicides Pendimethalin, Gesaprim and their combination on weed control under maize (Zea mays L.). JAIS 2013, 1, 17–22. [Google Scholar]
  47. Farooq, N.; Abbas, T.; Tanveer, A.; Jabran, K. Allelopathy for weed management. In Co-Evolution of Secondary Metabolites; Springer: Cham, Switzerland, 2020; pp. 505–519. [Google Scholar]
  48. Czarnota, M.A.; Paul, R.N.; Weston, L.A.; Duke, S.O. Anatomy of Sorgoleone-Secreting Root Hairs of Sorghum Species. Int. J. Plant Sci. 2003, 164, 861–866. [Google Scholar] [CrossRef]
  49. Gurmani, A.R.; Khan, S.U.; Mehmood, T.; Ahmed, W.; Rafique, M. Exploring the allelopathic potential of plant extracts for weed suppression and productivity in wheat (Triticum aestivum L.). Gesunde Pflanz. 2021, 73, 29–37. [Google Scholar] [CrossRef]
  50. Shirgapure, K.H.; Ghosh, P. Allelopathy a tool for sustainable weed management. Arch. Curr. Res. Int. 2020, 20, 17–25. [Google Scholar] [CrossRef]
  51. Shahzad, M.; Farooq, M.; Hussain, M. Weed spectrum in different wheat-based cropping systems under conservation and conventional tillage practices in Punjab, Pakistan. Soil Tillage Res. 2016, 163, 71–79. [Google Scholar] [CrossRef]
  52. Alarcón, R.; Hernández-Plaza, E.; Navarrete, L.; Sánchez, M.J.; Escudero, A.; Hernanz, J.L.; Sánchez-Giron, V.; Sánchez, A.M. Effects of no-tillage and non-inversion tillage on weed community diversity and crop yield over nine years in a Mediterranean cereal-legume cropland. Soil Tillage Res. 2018, 179, 54–62. [Google Scholar] [CrossRef]
  53. Bachheti, A.; Sharma, A.; Bachheti, R.K.; Husen, A.; Pandey, D.P. Plant Allelochemicals and Their Various Applications. Co-Evolution of Secondary Metabolites; Springer: Cham, Switzerland, 2020; pp. 441–465. [Google Scholar]
  54. Drews, S.; Neuhoff, D.; Köpke, U. Weed suppression ability of three winter wheat varieties at different row spacing under organic farming conditions. Weed Res. 2009, 49, 526–533. [Google Scholar] [CrossRef]
  55. Kandhro, M.N.; Tunio, S.; Rajpar, I.; Chachar, Q. Allelopathic impact of sorghum and sunflower intercropping on weed management and yield enhancement in cotton. Sarhad J. Agric. 2014, 30, 311–318. [Google Scholar]
  56. Khaliq, A.; Matloob, A.; Ihsan, M.Z.; Abbas, R.N.; Aslam, Z.; Rasool, F. Supplementing herbicides with manual weeding improves weed control efficiency, growth and yield of direct seeded rice. Int. J. Agric. Biol. 2013, 15, 191–199. [Google Scholar]
  57. Ibrahim, M.; Ahmad, N.; Shinwari, Z.K.; Bano, A.; Ullah, F. Allelopathic assessment of genetically modified and non modified maize (Zea mays L.) on physiology of wheat (Triticum aestivum L.). Pak. J. Bot 2013, 45, 235–240. [Google Scholar]
Figure 1. Weather data of the experimental site, i.e., rainfall and temperature (a) and sunshinbe hours and relative humidity (b) during barley growing seasons of 2017–2018 and 2018–2019. (Source: climate observatory at the Department of Agricultural Engineering 1 Km from the experimental location).
Agriculture 12 00487 g001
Figure 2. Influence of various weed control strategies (a) and barley-based cropping systems (b) on soil bulk density. WF = weed-free, WC = weedy-check, FS = false-seedbed, CC = chemical-control, AWE = allelopathic-water-extract, FB = fallow-barley, MaB = maize-barley, CB = cotton-barley, MuB = mungbean-barley and SB = sorghum-barley, the bar indicates the means ± standard errors of the means. Any two means sharing different letters are statistically different (p ≤ 0.05) from each other.
Agriculture 12 00487 g002
Figure 3. Influence of various weed control strategies (a) and barley-based cropping systems (b) on soil porosity. WF = weed-free, WC = weedy-check, FS = false-seedbed, CC = chemical-control, AWE = allelopathic-water extract, FB = fallow-barley, MaB = maize-barley, CB = cotton-barley, MuB = mungbean-barley and SB = sorghum-barley, the bar indicates the means ± standard errors of the means. Any two means sharing different letters are statistically different (p ≤ 0.05) from each other.
Agriculture 12 00487 g003
Figure 4. Influence of various weed control strategies (a) and barley-based cropping systems (b) on soil available potassium. WF = weed-free, WC = weedy-check, FS = false-seedbed, CC = chemical control, AWE = allelopathic-water-extract, FB = fallow-barley, MaB = maize-barley, CB = cotton-barley, MuB = mungbean-barley and SB = sorghum-barley, the bar indicates the means ± standard errors of the means. Any two means sharing different letters are statistically different (p ≤ 0.05) from each other.
Agriculture 12 00487 g004
Figure 5. Influence of various weed control strategies (a) and barley-based cropping systems (b) on soil available phosphorus. WF = weed-free, WC = weedy-check, FS = false-seedbed, CC = chemical control, AWE = allelopathic-water-extract, FB = fallow-barley, MaB = maize-barley, CB = cotton-barley, MuB = mungbean-barley and SB = sorghum-barley, the bar indicates the means ± standard errors of the means. Any two means sharing different letters are statistically different (p ≤ 0.05) from each other.
Agriculture 12 00487 g005
Figure 6. Influence of various weed control strategies (a) and barley-based cropping systems (b) on leaf area index of barley. WF = weed-free, WC = weedy-check, FS = false-seedbed, CC = chemical-control, AWE = allelopathic-water-extract, FB = fallow-barley, MaB = maize-barley, CB = cotton-barley, MuB = mungbean-barley and SB = sorghum-barley, the bar indicates the means ± standard errors of the means. Any two means sharing different letters are statistically different (p ≤ 0.05) from each other.
Agriculture 12 00487 g006
Figure 7. Influence of various weed control strategies (a) and barley-based cropping systems (b) on specific leaf area of barley. WF = weed-free, WC = weedy-check, FS = false-seedbed, CC = chemical-control, AWE = allelopathic-water-extract, FB = fallow-barley, MaB = maize-barley, CB = cotton-barley, MuB = mungbean-barley and SB = sorghum-barley, the bar indicates the means ± standard errors of the means. Any two means sharing different letters are statistically different (p ≤ 0.05) from each other.
Agriculture 12 00487 g007
Figure 8. Influence of various weed control strategies (a) and barley-based cropping systems (b) on 1000-grain weight of barley. WF = weed-free, WC = weedy-check, FS = false-seedbed, CC = chemical-control, AWE = allelopathic-water-extract, FB = fallow-barley, MaB = maize-barley, CB = cotton-barley, MuB = mungbean-barley and SB = sorghum-barley, the bar indicates the means ± standard errors of the means. Any two means sharing different letters are statistically different (p ≤ 0.05) from each other.
Agriculture 12 00487 g008
Figure 9. Influence of various weed control strategies (a) and barley-based cropping systems (b) on grain yield of barley. WF = weed-free, WC = weedy-check, FS = false-seedbed, CC = chemical-control, AWE = allelopathic-water-extract, FB = fallow-barley, MaB = maize-barley, CB = cotton-barley, MuB = mungbean-barley and SB = sorghum-barley, the bar indicates the means ± standard errors of the means. Any two means sharing different letters are statistically different (p ≤ 0.05) from each other.
Agriculture 12 00487 g009
Figure 10. Influence of various weed control strategies (a) and barley-based cropping systems (b) on biological yield of barley. WF = weed-free, WC = weedy-check, FS = false-seedbed, CC = chemical-control, AWE = allelopathic-water-extract, FB = fallow-barley, MaB = maize-barley, CB = cotton-barley, MuB = mungbean-barley and SB = sorghum-barley, the bar indicates the means ± standard errors of the means. Any two means sharing different letters are statistically different (p ≤ 0.05) from each other.
Agriculture 12 00487 g010
Figure 11. Influence of various weed control strategies (a) and barley-based cropping systems (b) on harvest index of barley. WF = weed-free, WC = weedy-check, FS = false-seedbed, CC = chemical-control, AWE = allelopathic-water-extract, FB = fallow-barley, MaB = maize-barley, CB = cotton-barley, MuB = mungbean-barley and SB = sorghum-barley, the bar indicates the means ± standard errors of the means. Any two means sharing different letters are statistically different (p ≤ 0.05) from each other.
Agriculture 12 00487 g011
Table 1. Crop husbandry of different crops included in barley-based cropping systems of the study (2017–2019).
CropsSowing TimeCultivarsSeed Rate
(kg ha−1)
Fertilizer NPK
(kg ha−1)
P–P (cm)R–R (cm)Harvesting TimeHarvest Method
Cotton14 MayIUB-201325250–200–0207528 October (Last picking)Manual
Sorghum13 JuneYS-1610100–60–0156029 OctoberManual
Mungbean15 JuneNIAB-Mung 20112020–60–0103027 SeptemberManual
Maize26 JulyYH-189825200–150–0227530 OctoberManual
Barley15 and 18 NovemberHaider-938050–25–0-257 and 9 AprilManual
P–P = Plant spacing; R–R = Row spacing.
Table 2. Influence of different barley-based cropping systems and weed control strategies on soil NH4-N (mg kg−1) during the periods 2017–2018 and 2018–2019.
FBMaBCBMuBSBLSD WCS
2017–2018
WF3.74 ± 0.02 c E *4.07 ± 0.03 b E3.96 ± 0.05 b E4.20 ± 0.02 a E4.07 ± 0.04 b E0.11
WC4.98 ± 0.02 d A5.30 ± 0.03 ab A5.23 ± 0.03 bc A5.42 ± 0.03 a A5.14 ± 0.07 c A0.12
FS4.73 ± 0.03 c B4.93 ± 0.05 b B4.84 ± 0.02 bc B5.09 ± 0.04 a B4.74 ± 0.03 c B0.12
CC4.06 ± 0.05 c D4.23 ±0.02 b D4.16 ± 0.04 bc D4.35 ± 0.02 a D4.21 ± 0.03 b D0.10
AWE4.38 ± 0.03 d C4.73 ± 0.03 ab C4.65 ± 0.05 bc C4.81 ± 0.03 a C4.56 ± 0.02 c C0.11
LSD CS0.090.110.130.100.12
2018–2019
WF3.88 ± 0.03 d E4.18 ± 0.02 bc E4.11 ± 0.02 c E4.34 ± 0.05 a E4.20 ± 0.01 b E0.08
WC5.14 ± 0.02 d A5.48 ± 0.03 ab A5.44 ± 0.03 b A5.58 ± 0.04 a A5.30 ± 0.05 c A0.10
FS4.98 ± 0.02 c B5.09 ± 0.02 b B5.18 ± 0.05 b B5.34 ± 0.03 a B4.98 ± 0.04 c B0.10
CC4.20 ± 0.07 b D4.29 ± 0.05 b D4.33 ± 0.06 b D4.49 ± 003 a D4.34 ± 0.04 ab D0.15
AWE4.57 ± 0.03 d C4.84 ± 0.03 bc C4.92 ± 0.04 ab C5.00 ± 0.02 a C4.75 ± 0.04 c C0.09
LSD WCS0.110.090.120.100.11
* The lowercase letters denote how respective weed control strategy varied among barley-based cropping systems, whereas uppercase letters indicate how a cropping system differed among various weed control strategies included in the study. Means followed by different lower or uppercase letters significantly (p ≤ 0.05) differ from each within a row and column, respectively. WF = weed-free, WC = weedy-check, FS = false-seedbed, CC = chemical-control, AWE = allelopathic-water-extract, FB = fallow-barley, MaB = maize-barley, CB = cotton-barley, MuB = mungbean-barley and SB = sorghum-barley, CS = cropping-systems, WCS = weed-control strategies.
Table 3. Influence of different barley-based cropping systems and weed control strategies on soil NO3-N (mg kg−1) during the periods 2017–2018 and 2018–2019.
FBMaBCBMuBSBLSD WCS
2017–2018
WF4.08 ± 0.02 d E4.38 ± 0.03 bc E4.31 ± 0.05 c E4.54 ± 0.02 a E4.41 ± 0.04 b E0.07
WC5.35 ± 0.02 d A5.73 ± 0.03 ab A5.64 ± 0.03 b A5.79 ± 0.03 a A5.51 ± 0.07 c A0.12
FS5.07 ± 0.03 c B5.18 ± 0.05 bc B5.27 ± 0.02 b B5.43 ± 0.04 a B5.08 ± 0.03 c B0.11
CC4.40 ± 0.05 c D4.50 ± 0.02 b D4.53 ± 0.04 b D4.69 ± 0.02 a D4.55 ± 0.03 b D0.06
AWE4.77 ± 0.03 e C5.04 ± 0.03 c C5.12 ± 0.05 b C5.20 ± 0.03 a C4.95 ± 0.02 d C0.07
LSD CS0.080.090.100.100.08
2018–2019
WF4.22 ± 0.04 d E4.55 ± 0.03 b E4.44 ± 0.04 c E4.68 ± 0.03 a E4.55 ± 0.03 bc E0.10
WC5.48 ± 0.03 d A5.80 ± 0.03 ab A5.70 ± 0.05 bc A5.93 ± 0.06 a A5.65 ± 0.03 c A0.12
FS5.32 ± 0.04 c B5.53 ± 0.04 b B5.45 ± 0.04 b B5.68 ± 0.05 a B5.32 ± 0.02 c B0.12
CC4.54 ± 0.02 c D4.68 ± 0.04 b D4.62 ± 0.03 bc D4.83 ± 0.03 a D4.68 ± 0.02 b D0.09
AWE4.91 ± 0.03 d C5.28 ± 0.03 ab C5.22 ± 0.04 b C5.34 ± 0.03 a C5.09 ± 0.02 c C0.09
LSD WCS0.100.110.120.120.07
The lowercase letters denote how respective weed control strategy varied among barley-based cropping systems, whereas uppercase letters indicate how a cropping system differed among various weed control strategies included in the study. Means followed by different lower or uppercase letters significantly (p ≤ 0.05) differ from each within a row and column, respectively. WF = weed-free, WC = weedy-check, FS = false-seedbed, CC = chemical-control, AWE = allelopathic-water-extract, FB = fallow-barley, MaB = maize-barley, CB = cotton-barley, MuB = mungbean-barley and SB = sorghum-barley, CS = cropping-systems, WCS = weed-control-strategies.
Table 4. Influence of different barley-based cropping systems and weed control strategies on total dry biomass (g m−2) of weed species recorded in barley crop during the periods 2017–2018 and 2018–2019.
FBMaBCBMuBSBLSD CS
2017–2018
WC18.10 ± 0.29 a A7.85 ± 0.26 a C17.87 ± 0.12 a A15.87 ± 0.48 a B6.85 ± 0.13 a D0.85
FS10.15 ± 0.15 b A3.52 ± 0.17 b D8.56 ± 0.25 c B6.03 ± 0.48 b C1.99 ± 0.25 b E0.89
CC0.97 ± 0.16 d A0.33 ± 0.01 c B1.17 ± 0.14 d A0.86 ± 0.13 c A0.31 ± 0.02 c B0.35
AWE9.15 ± 0.47 c A3.67 ± 0.20 b C9.46 ± 0.33 b A6.71 ± 0.11 b B2.16 ± 0.47 b D1.09
LSD WCS0.960.510.741.130.88
2018–2019
WC41.41 ± 0.94 a B22.13 ± 0.92 a D38.85 ± 0.02 a C47.14 ± 0.40 a A19.45 ± 0.53 a E2.08
FS23.75 ± 0.84 b B13.47 ± 0.38 b C22.33 ± 0.69 b B27.55 ± 1.12 b A10.59 ± 1.72 b C3.31
CC4.59 ± 0.17 c AB2.96 ± 0.40 c BC4.83 ± 1.01 c AB6.04 ± 0.84 c A1.22 ± 0.06 c C1.94
AWE23.62 ± 0.43 b B13.69 ± 0.59 b C22.62 ± 0.23 b B26.74 ± 0.73 b A11.12 ± 0.43 b D1.60
LSD WCS2.192.002.022.643.01
The lowercase letters denote how respective cropping system differed among various weed control strategies, whereas uppercase letters indicate how a weed control strategy varied among barley-based cropping systems included in the study. Means followed by different lower or uppercase letters significantly (p ≤ 0.05) differ from each within a column and row, respectively. WF = weed-free, WC = weedy-check, FS = false-seedbed, CC = chemical-control, AWE = allelopathic-water extract, FB = fallow-barley, MaB = maize-barley, CB = cotton-barley, MuB = mungbean-barley and SB = sorghum-barley, CS = cropping-systems, WCS = weed-control-strategies.
Table 5. Influence of different barley-based cropping systems and weed control strategies on number of grains per spike of barley during the periods 2017–2018 and 2018–2019.
FBMaBCBMuBSBLSD WCS
2017–2018
WF238.51 ± 1.91 a A242.23 ± 3.58 a A238.52 ± 3.01 a A244.67 ± 2.59 a A239.92 ± 2.07 a A8.50
WC171.35 ± 2.45 c D206.23 ± 2.23 ab C199.84 ± 3.69 b C206.18 ± 3.55 ab B209.61 ± 1.32 a C8.79
FS206.89 ± 2.99 b C231.51 ± 2.81 a B225.01 ± 2.76 a B233.84 ± 4.53 a A230.12 ± 1.66 a B9.73
CC234.03 ± 3.52 a A234.24 ± 3.13 a AB233.19 ± 3.93 a AB242.39 ± 3.43 a A242.12 ± 4.60 a A11.83
AWE216.73 ± 1.56 b B236.44 ± 2.17 a AB233.71 ± 3.20 a AB239.87 ± 4.04 a A236.19 ± 1.75 a AB8.54
LSD CS8.138.9310.5411.618.09
2018–2019
WF241.90 ± 3.47 a A245.24 ± 2.90 a A247.28 ± 2.39 a A251.06 ± 4.07 a A244.98 ± 3.33 a A10.34
WC174.74 ± 1.11 b C205.53 ± 3.10 a B209.62 ± 2.45 a B210.29 ± 1.71 a B211.67 ± 4.03 a B8.45
FS218.44 ± 2.14 b B238.56 ± 3.86 a A241.73 ± 2.91 a A245.39 ± 3.77 a A241.67 ± 2.20 a A9.66
CC240.75 ± 2.59 a A242.58 ± 4.36 a A240.96 ± 2.54 a A247.11 ± 2.06 a A247.18 ± 3.42 a A9.77
AWE224.23 ± 2.43 b B243.55 ± 3.90 a A242.60 ± 1.80 a A245.04 ± 3.39 a A243.69 ± 3.56 a A9.82
LSD WCS7.7711.557.709.9110.66
The lowercase letters denote how respective weed control strategy varied among barley-based cropping systems, whereas uppercase letters indicate how a cropping system differed among various weed control strategies included in the study. Means followed by different lower or uppercase letters significantly (p ≤ 0.05) differ from each within a row and column, respectively.WF = weed-free, WC = weedy-check, FS = false-seedbed, CC = chemical-control, AWE = allelopathic-water-extract, FB = fallow-barley, MaB = maize-barley, CB = cotton-barley, MuB = mungbean-barley and SB = sorghum-barley, CS = cropping-systems, WCS = weed-control-strategies.
Table 6. Influence of different barley-based cropping systems and weed control strategies on number of productive tillers (m−2) of barley during the periods 2017–2018 and 2018–2019.
FBMaBCBMuBSBLSD WCS
2017–2018
WF49.54 ± 0.91 c A51.83 ± 0.65 b AB52.65 ± 0.41 ab A54.23 ± 0.62 a A53.60 ± 0.77 ab A2.18
WC46.43 ± 0.88 b BC48.66 ± 0.68 ab C47.93 ± 0.67 ab B47.76 ± 0.62 b C50.06 ± 0.70 a B2.25
FS45.53 ± 0.70 b C51.68 ± 0.78 a AB50.92 ± 1.03 a A50.68 ± 0.88 a B47.41 ± 0.33 b C2.45
CC48.92 ± 1.15 c AB52.38 ± 0.76 ab A50.61 ± 0.98 abc A52.81 ± 0.68 a AB49.70 ± 0.80 bc B2.81
AWE48.32 ± 1.13 b ABC49.71 ± 0.97 ab BC50.82 ± 0.15 ab A52.20 ± 0.73 a AB48.97 ± 0.86 b BC2.64
LSD CS3.052.442.302.242.26
2018–2019
WF50.58 ± 0.78 c A53.69 ± 0.50 ab A52.55 ± 0.63 bc A55.27 ± 0.96 a A54.57 ± 1.10 ab A2.59
WC48.14 ± 0.50 a AB48.55 ± 0.83 a B47.97 ± 0.38 a B47.27 ± 0.40 a C47.69 ± 0.67 a C1.82
FS47.90 ± 0.83 b B51.95 ± 0.87 a A52.40 ± 0.52 a A51.71 ± 0.87 a B50.89 ± 0.49 a B2.32
CC50.41 ± 0.53 b A52.10 ± 0.82 ab A51.78 ± 0.82 ab A53.87 ± 0.69 a AB51.12 ± 0.64 b B2.22
AWE49.69 ± 1.11 b AB52.13 ± 0.85 ab A50.83 ± 0.76 b A53.57 ± 0.41 a AB50.27 ± 0.82 b B2.59
LSD WCS2.462.472.012.222.42
The lowercase letters denote how respective weed control strategy varied among barley-based cropping systems, whereas uppercase letters indicate how a cropping system differed among various weed control strategies included in the study. Means followed by different lower or uppercase letters significantly (p ≤ 0.05) differ from each within a row and column, respectively. WF = weed-free, WC = weedy-check, FS = false-seedbed, CC = chemical-control, AWE = allelopathic-water-extract, FB = fallow-barley, MaB = maize-barley, CB = cotton-barley, MuB = mungbean-barley and SB = sorghum-barley, CS = cropping-systems, WCS = weed-control-strategies.
Publisher’s Note: MDPI stays neutral with regard to jurisdictional claims in published maps and institutional affiliations.

