
The Quantitative Genetics of Flowering Traits in Wide Crosses of Chickpea

 , , and
Abstract
:1. Introduction
2. Materials and Methods
2.1. Field Experiments
2.2. Laboratory Experiments
2.3. Quantitative Genetics Analysis
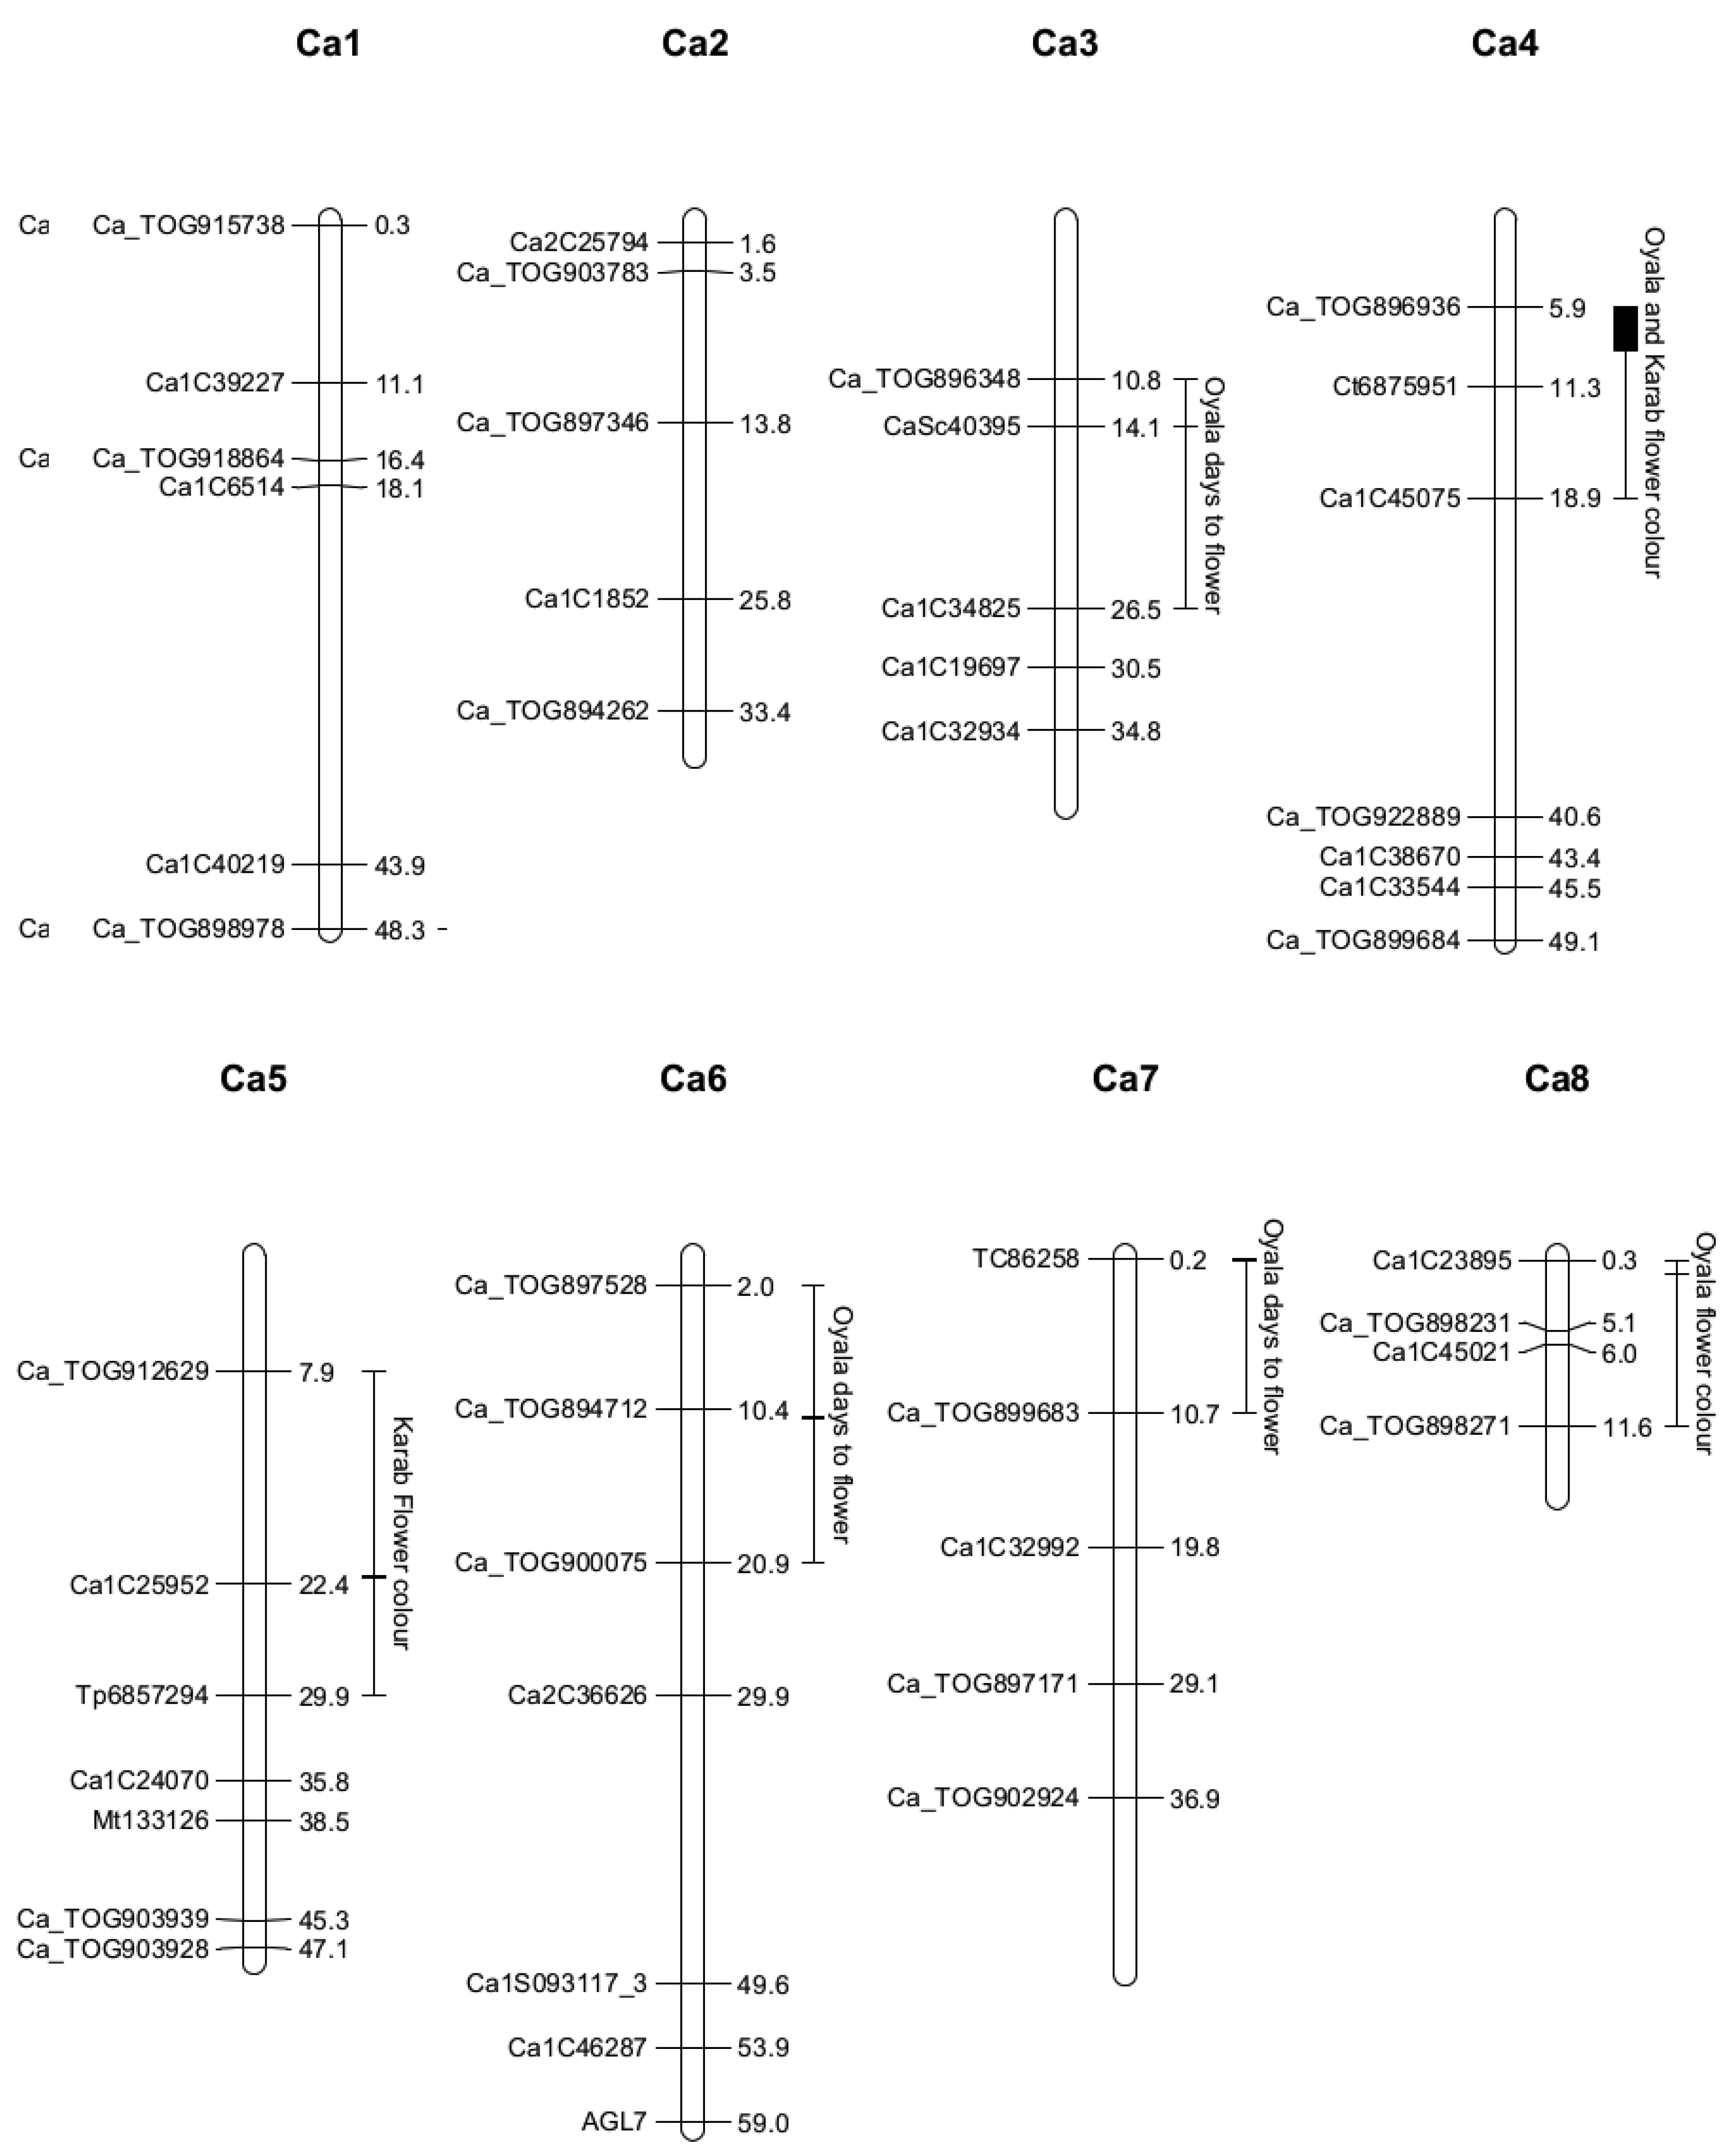
2.4. Quantitative Trait Locus Mapping
3. Results
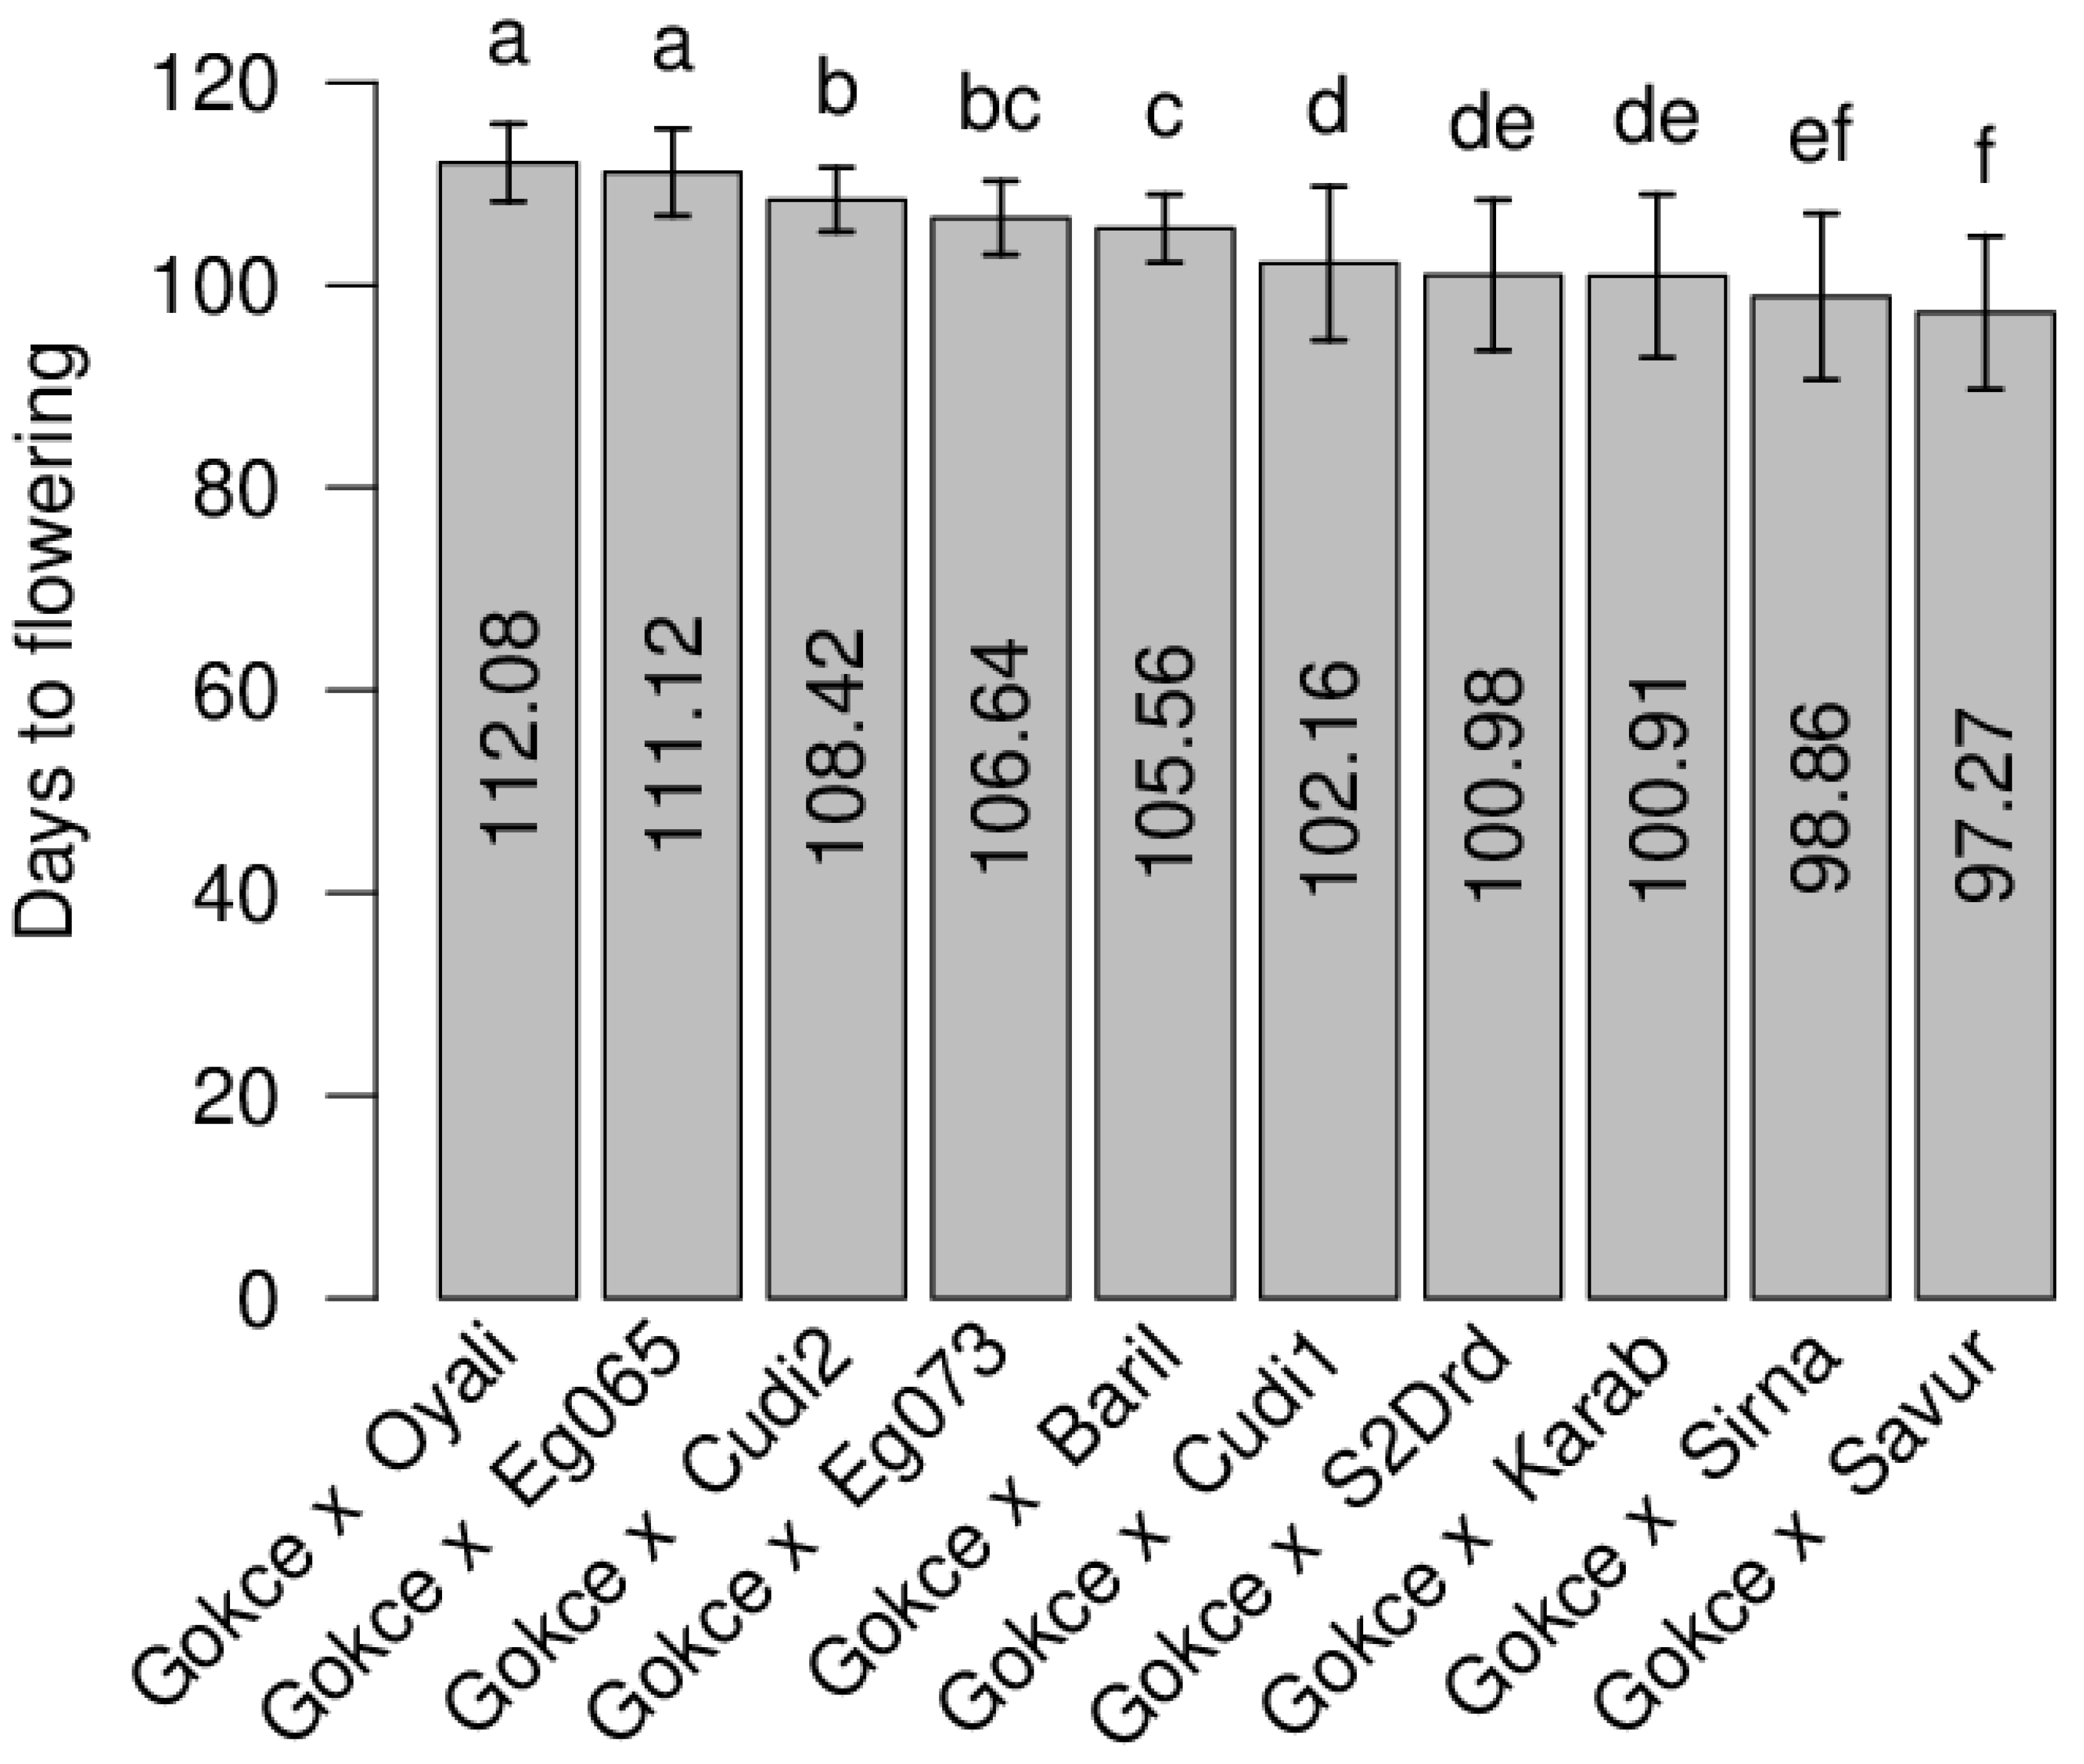
3.1. Flowering Time
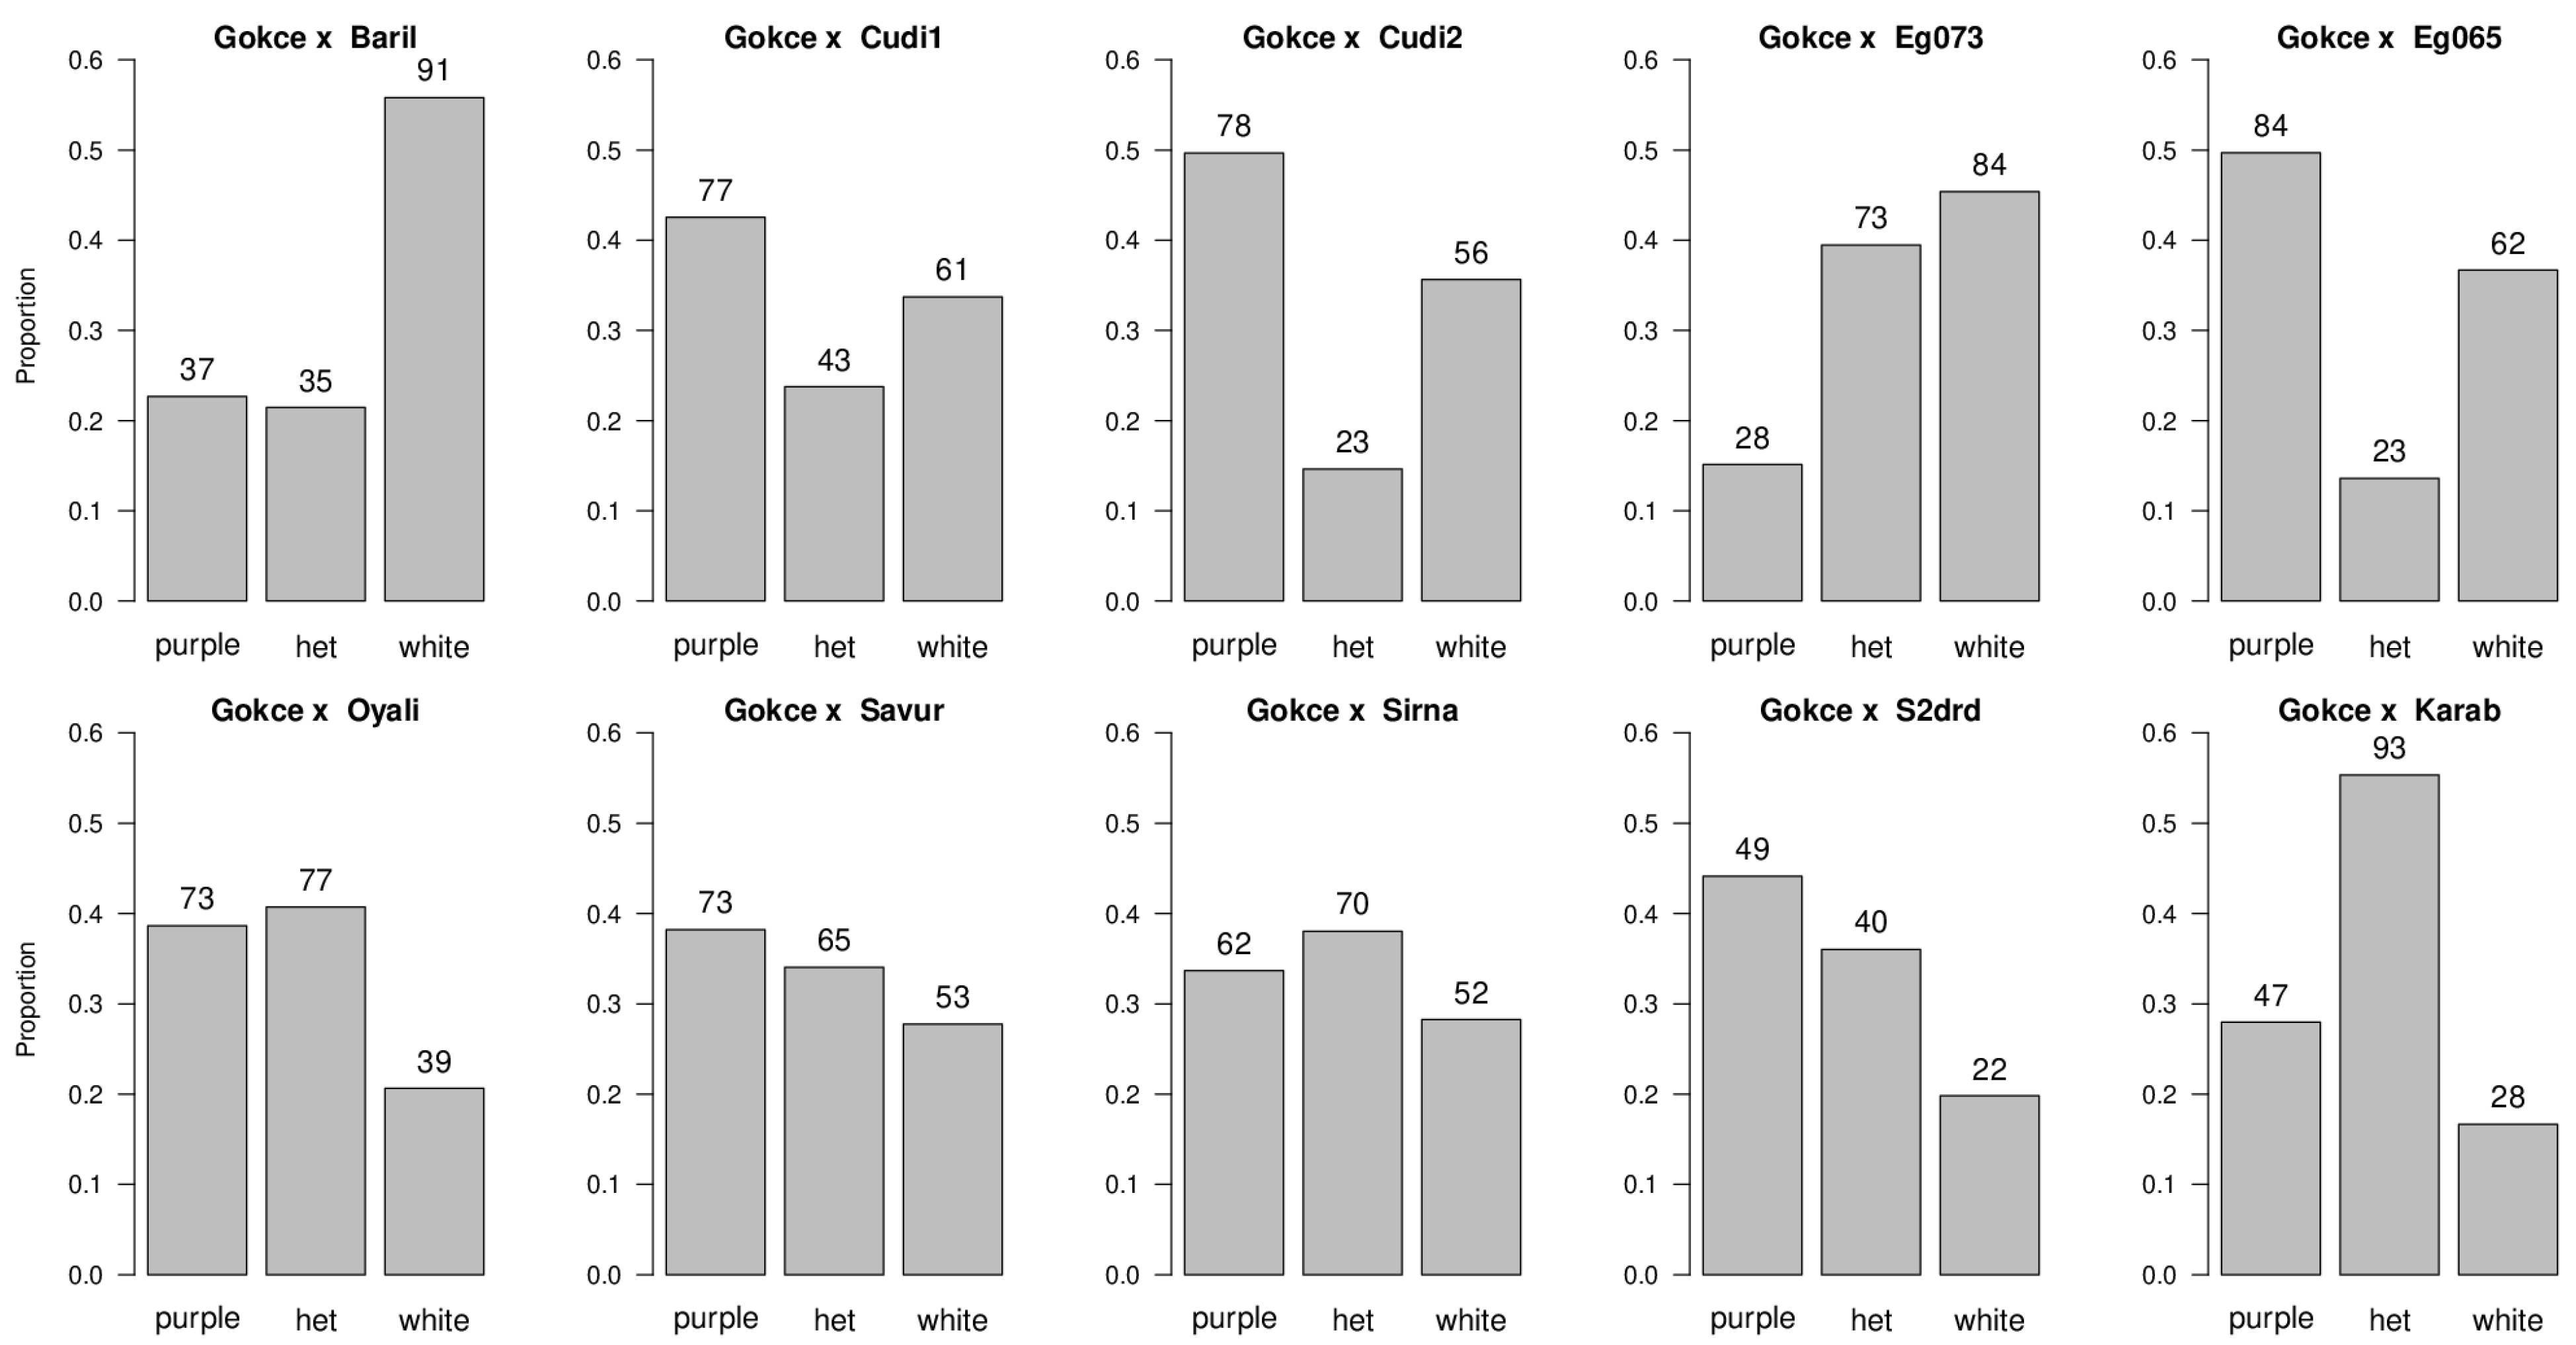
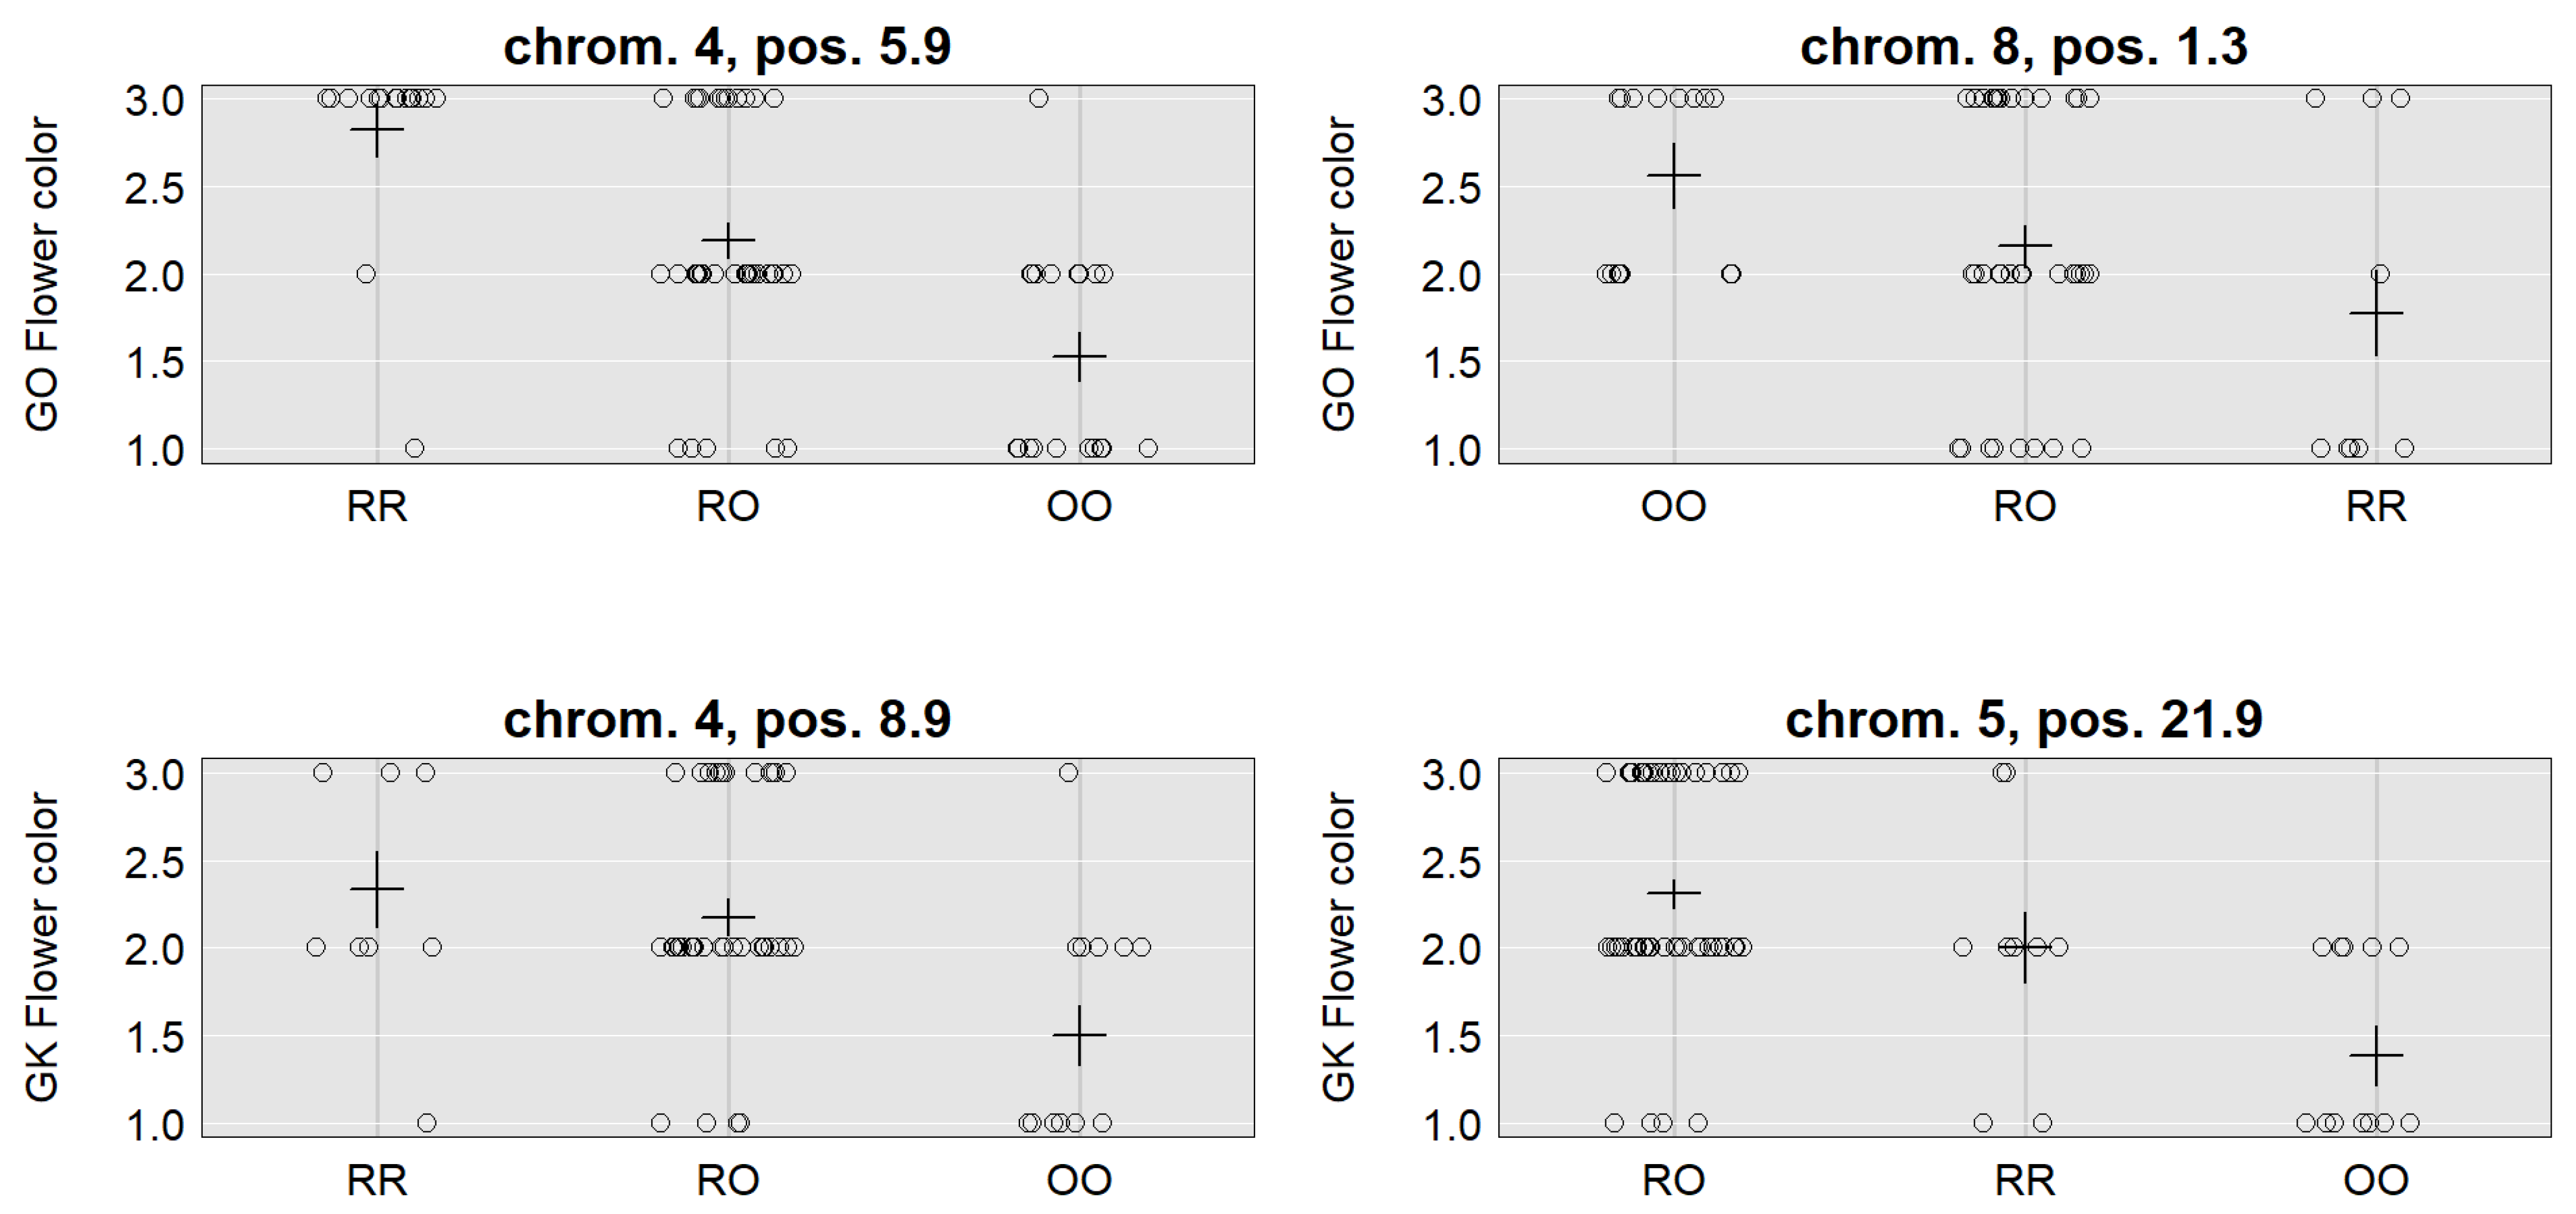
3.2. Flower Color
3.3. Flowering Trait Correlations
4. Discussion
5. Conclusions
Supplementary Materials
Author Contributions
Funding
Institutional Review Board Statement
Data Availability Statement
Acknowledgments
Conflicts of Interest
References
- Jung, C.; Müller, A.E. Flowering time control and applications in plant breeding. Trends Plant Sci. 2009, 14, 563–573. [Google Scholar] [CrossRef] [PubMed]
- Blümel, M.; Dally, N.; Jung, C. Flowering time regulation in crops—What did we learn from Arabidopsis? Curr. Opin. Biotechnol. 2015, 32, 121–129. [Google Scholar] [CrossRef] [PubMed]
- Ducrocq, S.; Madur, D.; Veyrieras, J.B.; Camus-Kulandaivelu, L.; Kloiber-Maitz, M.; Presterl, T.; Ouzunova, M.; Manicacci, D.; Charcosset, A. Key impact of Vgt1 on flowering time adaptation in maize: Evidence from association mapping and ecogeographical information. Genetics 2008, 178, 2433–2437. [Google Scholar] [CrossRef] [PubMed] [Green Version]
- FAOSTAT Database. Available online: http://faostat.fao.org/site/291/default.aspx (accessed on 26 September 2019).
- Young, V.R.; Pellett, P.L. Plant proteins in relation to human protein and amino acid nutrition. Am. J. Clin. Nutr. 1994, 59, 1203S–1212S. [Google Scholar] [CrossRef] [PubMed]
- Woolf, P.J.; Fu, L.L.; Basu, A. vProtein: Identifying optimal amino acid complements from plant-based foods. PLoS ONE 2011, 6, e18836. [Google Scholar] [CrossRef] [PubMed] [Green Version]
- Abbo, S.; Berger, J.; Turner, N.C. Evolution of cultivated chickpea: Four bottlenecks limit diversity and constrain adaptation. Funct. Plant Biol. 2003, 30, 1081–1087. [Google Scholar] [CrossRef] [PubMed] [Green Version]
- Thudi, M.; Chitikineni, A.; Liu, X.; He, W.; Roorkiwal, M.; Yang, W.; Jian, J.; Doddamani, D.; Gaur, P.M.; Rathore, A.; et al. Recent breeding programs enhanced genetic diversity in both desi and kabuli varieties of chickpea (Cicer arietinum L.). Sci. Rep. 2016, 6, 38636. [Google Scholar] [CrossRef] [Green Version]
- Varshney, R.K.; Thudi, M.; Roorkiwal, M.; He, W.; Upadhyaya, H.D.; Yang, W.; Bajaj, P.; Cubry, P.; Rathore, A.; Jian, J.; et al. Resequencing of 429 chickpea accessions from 45 countries provides insights into genome diversity, domestication and agronomic traits. Nat. Genet. 2019, 51, 857–864. [Google Scholar] [CrossRef] [Green Version]
- Mba, C.; Guimaraes, E.P.; Ghosh, K. Re-orienting crop improvement for the changing climatic conditions of the 21st century. Agric. Food Secur. 2012, 1, 7. [Google Scholar] [CrossRef] [Green Version]
- Warschefsky, E.; Penmetsa, R.V.; Cook, D.R.; Von Wettberg, E.J. Back to the wilds: Tapping evolutionary adaptations for resilient crops through systematic hybridization with crop wild relatives. Am. J. Bot. 2014, 101, 1791–1800. [Google Scholar] [CrossRef]
- Coyne, C.J.; Kumar, S.; von Wettberg, E.J.; Marques, E.; Berger, J.D.; Redden, R.J.; Ellis, T.N.; Brus, J.; Zablatzká, L.; Smýkal, P. Potential and limits of exploitation of crop wild relatives for pea, lentil, and chickpea improvement. Legume Sci. 2020, 2, e36. [Google Scholar] [CrossRef] [Green Version]
- Bohra, A.; Kilian, B.; Sivasankar, S.; Caccamo, M.; Mba, C.; McCouch, S.R.; Varshney, R.K. Reap the crop wild relatives for breeding future crops. Trends Biotechnol. 2022, in press. [Google Scholar] [CrossRef] [PubMed]
- Berger, J.; Abbo, S.; Turner, N.C. Ecogeography of annual wild Cicer species: The poor state of the world collection. Crop Sci. 2003, 43, 1076–1090. [Google Scholar] [CrossRef]
- Von Wettberg, E.J.; Chang, P.L.; Başdemir, F.; Carrasquila-Garcia, N.; Korbu, L.B.; Moenga, S.M.; Bedada, G.; Greenlon, A.; Moriuchi, K.S.; Singh, V.; et al. Ecology and genomics of an important crop wild relative as a prelude to agricultural innovation. Nat. Commun. 2018, 9, 649. [Google Scholar] [CrossRef] [PubMed] [Green Version]
- Kumar, J.; Abbo, S. Genetics of flowering time in chickpea and its bearing on productivity in semiarid environments. Adv. Agron. 2001, 72, 107–138. [Google Scholar]
- Anbessa, Y.; Warkentin, T.; Vandenberg, A.; Ball, R. Inheritance of time to flowering in chickpea in a shortseason temperate environment. J. Hered. 2003, 97, 55–61. [Google Scholar] [CrossRef] [PubMed] [Green Version]
- Weller, J.L.; Ortega, R. Genetic control of flowering time in legumes. Front. Plant Sci. 2015, 6, 207. [Google Scholar] [CrossRef] [PubMed] [Green Version]
- Ridge, S.; Deokar, A.; Lee, R.; Daba, K.; Macknight, R.C.; Weller, J.L.; Tarán, B. The chickpea Early Flowering 1 (Efl1) locus is an ortholog of Arabidopsis ELF3. Plant Physiol. 2017, 175, 802–815. [Google Scholar] [CrossRef] [Green Version]
- Wilczek, A.M.; Roe, J.L.; Knapp, M.C.; Cooper, M.D.; Lopez-Gallego, C.; Martin, L.J.; Muir, C.D.; Sim, S.; Walker, A.; Anderson, J.; et al. Effects of genetic perturbation on seasonal life history plasticity. Science 2009, 323, 930–934. [Google Scholar] [CrossRef]
- Banta, J.A.; Ehrenreich, I.M.; Gerard, S.; Chou, L.; Wilczek, A.; Schmitt, J.; Kover, P.X.; Purugganan, M.D. Climate envelope modeling reveals intraspecific relationships among flowering phenology, niche breadth, and potential range size in Arabidopsis thaliana. Ecol. Lett. 2012, 15, 769–777. [Google Scholar] [CrossRef]
- Leinonen, P.H.; Remington, D.L.; Leppala, J.; Savolainen, O. Genetic basis of local adaptation and flowering time variation in Arabidopsis lyrata. Mol. Ecol. 2013, 22, 709–723. [Google Scholar] [CrossRef] [PubMed]
- Haware, M.P.; Nene, Y.L.; Pundir, R.P.S.; Rao, J.N. Screening of world chickpea germplasm for resistance to fusarium wilt. Field Crops Res. 1992, 30, 147–154. [Google Scholar] [CrossRef] [Green Version]
- Gil, J.; Cubero, J.I. Inheritance of seed coat thickness in chickpea (Cicer arietinum L.) and its evolutionary implications. Plant Breed. 1993, 111, 257–260. [Google Scholar] [CrossRef]
- Upadhyaya, H.D.; Ortiz, R. A mini core subset for capturing diversity and promoting utilization of chickpea genetic resources in crop improvement. Theor. Appl. Genet. 2001, 102, 1292–1298. [Google Scholar] [CrossRef] [Green Version]
- Cobos, M.; Winter, P.; Kharrat, M.; Cubero, J.; Gil, J.; Millan, T.; Rubio, J. Genetic analysis of agronomic traits in a wide cross of chickpea. Field Crop Res. 2009, 111, 130–136. [Google Scholar] [CrossRef]
- Upadhyaya, H.D.; Bajaj, D.; Das, S.; Saxena, M.S.; Badoni, S.; Kumar, V.; Tripathi, S.; Gowda, C.L.L.; Sharma, S.; Tyagi, A.K.; et al. A genome-scale integrated approach aids in genetic dissection of complex flowering time trait in chickpea. Plant Mol. Biol. 2015, 89, 403–420. [Google Scholar] [CrossRef] [Green Version]
- Gumberm, R.K.; Sarvjeet, S. Genetics of flowering time in chickpea: A preliminary report. Crop Improv. 1996, 23, 295–296. [Google Scholar]
- Or, E.; Hovay, R.; Abbo, S. A major gene for flowering time in chickpea. Crop Sci. 1999, 39, 315–322. [Google Scholar]
- Kumar, J.; van Rheenen, H.A. A major gene for time of flowering in chickpea. J. Hered. 2000, 91, 67–76. [Google Scholar] [CrossRef] [Green Version]
- Gaur, P.M.; Samineni, S.; Tripathi, S.; Varshney, R.K.; Gowda, C.L.L. Allelic relationships of flowering time genes in chickpea. Euphytica 2015, 203, 295–308. [Google Scholar] [CrossRef]
- Cho, S.; Kumar, J.; Shultz, J.L.; Anupama, K.; Tefera, F.; Muehlbauer, F.J. Mapping genes for double podding and other morphological traits in chickpea. Euphytica 2002, 128, 285–292. [Google Scholar] [CrossRef] [Green Version]
- Aryamanesh, N.; Nelson, M.N.; Yan, G.; Clarke, H.J.; Siddique, K.H.M. Mapping a major gene for growth habit and QTLs for ascochyta blight resistance and flowering time in a population between chickpea and Cicer reticulatum. Euphytica 2010, 173, 307–319. [Google Scholar] [CrossRef]
- Mallikarjuna, B.P.; Samineni, S.; Thudi, M.; Sajja, S.B.; Khan, A.W.; Patil, A.; Viswanatha, K.P.; Varshney, R.V.; Gaur, P.M. Molecular mapping of flowering time major genes and QTLs in Chickpea (Cicer arietinum L.). Front. Plant Sci. 2017, 8, 1140. [Google Scholar] [CrossRef] [Green Version]
- Das, S.; Upadhyaya, H.D.; Bajaj, D.; Kujur, A.; Badoni, S.; Kumar, V.; Tripathi, S.; Gowda, C.L.; Sharma, S.; Singh, S.; et al. Deploying QTL-seq for rapid delineation of a potential candidate gene underlying major trait-associated QTL in chickpea. DNA Res. 2015, 22, 193–203. [Google Scholar] [CrossRef] [PubMed]
- Srivastava, R.; Upadhyaya, H.D.; Kumar, R.; Daware, A.; Basu, U.; Shimray, P.W.; Tripathi, S.; Bharadwaj, C.; Tyagi, A.K.; Parida, S.K. A multiple QTL-Seq strategy delineates potential genomic loci governing flowering time in chickpea. Front. Plant Sci. 2017, 8, 1105. [Google Scholar] [CrossRef] [PubMed]
- Kumar, J.; Rao, B.V. Registration of ICCV 96029, a super early and double podded chickpea germplasm. Crop Sci. 2001, 41, 605. [Google Scholar] [CrossRef]
- Jamalabadi, J.G.; Saidi, A.; Karami, E.; Kharkesh, M.; Talebi, R. Molecular mapping and characterization of genes governing time to flowering, seed weight, and plant height in an intraspecific genetic linkage map of chickpea (Cicer arietinum). Biochem. Genet. 2013, 51, 387–397. [Google Scholar] [CrossRef]
- Yu, J.; Holland, J.B.; McMullen, M.D.; Buckler, E.S. Genetic design and statistical power of nested association mapping in maize. Genetics 2008, 178, 539–551. [Google Scholar] [CrossRef] [Green Version]
- Jordan, D.; Mace, E.; Cruickshank, A.; Hunt, C.; Henzell, R. Exploring and exploiting genetic variation from unadapted sorghum germplasm in a breeding program. Crop Sci. 2011, 51, 1444–1457. [Google Scholar] [CrossRef]
- Maurer, A.; Draba, V.; Jiang, Y.; Schnaithmann, F.; Sharma, R.; Schumann, E.; Kilian, B.; Reif, J.C.; Pillen, K. Modelling the genetic architecture of flowering time control in barley through nested association mapping. BMC Genomics 2015, 16, 290. [Google Scholar] [CrossRef] [Green Version]
- Knights, E.J.; Hobson, K.B. Chickpea: Overview. In Encyclopedia of Food Grains; Wrigley, C., Corke, H., Seetharaman, K., Faubion, J., Eds.; Academic Press: Cambridge, MA, USA, 2016; pp. 316–323. [Google Scholar]
- Kusmenglu, I.; Malhotra, R.S.; Aydin, N.; Singh, K.B. Registration of ‘Gokce’ a kabuli chickpea cultivar. Crop Sci. 2006, 46, 2703–2704. [Google Scholar] [CrossRef]
- Federer, W.T. Augmented designs with one-way elimination of heterogeneity. Biometrics 1961, 17, 447–473. [Google Scholar] [CrossRef]
- Li, H.; Durbin, R. Fast and accurate short read alignment with Burrows-Wheeler transform. Bioinformatics 2009, 25, 1754–1760. [Google Scholar] [CrossRef] [PubMed] [Green Version]
- Li, H.; Handsaker, B.; Wysoker, A.; Fennell, T.; Ruan, J.; Homer, N.; Marth, G.; Abecasis, G.; Durbin, R. 1000 Genome Project Data Processing Subgroup. The Sequence alignment/map (SAM) format and SAMtools. Bioinformatics 2009, 25, 2078–2079. [Google Scholar] [CrossRef] [PubMed] [Green Version]
- Poplin, R.; Ruano-Rubio, V.; DePristo, M.A.; Fennell, T.J.; Carneiro, M.O.; Van der Auwera, G.A.; Kling, D.E.; Gauthier, L.D.; Levy-Moonshine, A.; Roazen, D.; et al. Scaling accurate genetic variant discovery to tens of thousands of samples. BioRxiv 2017, 201178. [Google Scholar] [CrossRef] [Green Version]
- McKenna, A.; Hanna, M.; Banks, E.; Sivachenko, A.; Cibulskis, K.; Kernytsky, A.; Garimella, K.; Altshuler, D.; Gabriel, S.; Daly, M.; et al. The Genome Analysis Toolkit: A MapReduce framework for analyzing next-generation DNA sequencing data. Genome Res. 2010, 20, 1297–1303. [Google Scholar] [CrossRef] [PubMed] [Green Version]
- Robinson, J.T.; Thorvaldsdóttir, H.; Winckler, W.; Guttman, M.; Lander, E.S.; Getz, G.; Mesirov, J.P. Integrative Genomics Viewer. Nat. Biotechnol. 2011, 29, 24–26. [Google Scholar] [CrossRef] [Green Version]
- R Core Team. R: A Language and Environment for Statistical Computing; R Foundation for Statistical Computing: Vienna, Austria, 2019; Available online: https://www.R-project.org/ (accessed on 26 September 2019).
- Rosyara, U. Plantbreeding: R Software Package for Analysis and Visualization of Data from Plant Breeding and Genetics Experiments. Available online: http://plantbreeding.r-forge.r-project.org (accessed on 26 September 2019).
- Hossain, S.; Ford, R.; McNeil, D.; Pittock, C.; Panozzo, J.F. Inheritance of seed size in chickpea (Cicer arietinum L.) and identification of QTL based on 100-seed weight and seed size index. Aust. J. Crop Sci. 2010, 4, 126–135. [Google Scholar]
- Broman, K.W.; Gatti, D.M.; Simecek, P.; Furlotte, N.A.; Prins, P.; Sen, Ś.; Yandell, B.S.; Churchill, G.A. R/qtl2: Software for mapping quantitative trait loci with high-dimensional data and multi-parent populations. Genetics 2018, 211, 495–502. [Google Scholar] [CrossRef] [Green Version]
- Voorrips, R.E. MapChart: Software for the graphical presentation of linkage maps and QTLs. J. Hered. 2002, 93, 77–78. [Google Scholar] [CrossRef] [Green Version]
- Weller, J.L.; Reid, J.B.; Taylor, S.A.; Murfet, I.C. The genetic control of flowering time in pea. Trends Plant Sci. 1997, 2, 412–418. [Google Scholar] [CrossRef]
- Ortega, R.; Hecht, V.F.G.; Freeman, J.S.; Rubio, J.; Carrasquilla-Garcia, N.; Mir, R.R.; Penmetsa, R.V.; Cook, D.R.; Millan, T.; Weller, J.L. Altered expression of an FT cluster underlies a major locus controlling domestication-related changes to chickpea phenology and growth habit. Front. Plant Sci. 2019, 10, 824. [Google Scholar] [CrossRef] [PubMed] [Green Version]
- Kumar, J.; Vijayalakshmi, N.V.S.; Rao, T.N. Inheritance of flower color in chickpea. J. Hered. 2000, 91, 416–421. [Google Scholar] [CrossRef] [PubMed] [Green Version]
- Penmetsa, R.V.; Carrasquilla-Garcia, N.; Bergmann, E.M.; Vance, L.; Castro, B.; Kassa, M.T.; Sarma, B.K.; Datta, S.; Farmer, A.D.; Baek, J.M.; et al. Multiple post-domestication origins of kabuli chickpea through allelic variation in a diversification-associated transcription factor. New Phytol. 2016, 211, 1440–1451. [Google Scholar] [CrossRef] [PubMed] [Green Version]


| Population | Parent 1 (Female) | Species | Parent 2 (Male) | Species | Total Lines Planted |
|---|---|---|---|---|---|
| POP1 | Gokce | C. arietinum | Bari1-092 | C. reticulatum | 161 |
| POP2 | Gokce | C. arietinum | Cudi 2-152 | C. reticulatum | 184 |
| POP3 | Gokce | C. arietinum | Cudi1-022 | C. reticulatum | 155 |
| POP4 | Gokce | C. arietinum | Egil-073 | C. reticulatum | 185 |
| POP5 | Gokce | C. arietinum | Egil-065 | C. reticulatum | 169 |
| POP6 | Gokce | C. arietinum | Oyali-084 | C. reticulatum | 189 |
| POP7 | Gokce | C. arietinum | Savur-063 | C. reticulatum | 191 |
| POP8 | Gokce | C. arietinum | Sirna-060 | C. reticulatum | 185 |
| POP9 | Gokce | C. arietinum | S2Drd-065 | C. echinosphermum | 113 |
| POP10 | Gokce | C. arietinum | Karab-092 | C. echinosphermum | 168 |
| Male Parent Mean | Male Parent St. Error | Mid-Parents | Population Mean | Std. Error of Mean | Range | Variance | Correlation | |
|---|---|---|---|---|---|---|---|---|
| POP1 Gokce × Bari1-092 | 107 | 0.38 | 106 | 105.63 | 0.62 | 93–113 | 11.23 | 0.009 |
| POP2 Gokce × Cudi1-152 | 95 | 0.27 | 99.5 | 102.20 | 0.75 | 88–120 | 58.16 | 0.049 |
| POP3 Gokce × Cudi2-022 | 113 | 0.79 | 109 | 108.27 | 0.24 | 101–120 | 8.98 | 0.223 ** |
| POP4 Gokce × Egil-073 | 110 | 0.46 | 107.5 | 106.60 | 0.26 | 92–116 | 12.87 | 0.094 |
| POP5 Gokce × Egil-065 | 118 | 0.31 | 111.5 | 110.70 | 0.33 | 101–120 | 19.73 | −0.019 |
| POP6 Gokce × Oyali-084 | 119 | 0.28 | 112 | 112.08 | 0.27 | 97–120 | 14.19 | 0.158 * |
| POP7 Gokce × Savur-063 | 90 | 0.46 | 97.5 | 97.13 | 0.55 | 87–119 | 57.19 | 0.044 |
| POP8 Gokce × Sirna-060 | 90 | 0.33 | 97.5 | 98.91 | 0.61 | 87–116 | 67.46 | 0.078 |
| POP9 Gokce × S2Drd-065 | 97 | 0.32 | 101 | 100.98 | 0.71 | 87–119 | 55.43 | 0.077 |
| POP10 Gokce × Karab-092 | 92 | 0.31 | 98.5 | 100.92 | 0.62 | 86–119 | 64.73 | 0.058 |
| Population | Early Flowering Phenotype | Late Flowering Phenotype | df | Ratio Tested | χ2 | p-Value |
|---|---|---|---|---|---|---|
| POP1 Gokce × Bari1-092 | 38 | 11 | 1 | 1:1 1:3 1:7 | 14.88 0.17 NS 4.43 | p < 0.05 p > 0.05 p < 0.05 |
| POP2 Gokce × Cudi1-152 | 16 | 61 | 1 | 1:1 1:3 1:7 | 26.30 0.73 NS 4.82 | p < 0.05 p > 0.05 p < 0.05 |
| POP3 Gokce × Cudi2-022 | 0 | 0 | - | - | - | - |
| POP4 Gokce × Egil-073 | 32 | 15 | 1 | 1:1 1:3 1:7 | 16.15 1.20 NS 16.20 | p < 0.05 p > 0.05 p < 0.05 |
| POP5 Gokce × Egil-065 | 3 | 0 | - | - | - | - |
| POP6 Gokce × Oyali-084 | 1 | 0 | - | - | - | - |
| POP7 Gokce × Savur-063 | 9 | 28 | 1 | 1:1 1:3 1:7 | 9.76 0.01 NS 4.7 | p < 0.05 p > 0.05 p < 0.05 |
| POP8 Gokce × Sirna-060 | 2 | 35 | 1 | 1:1 1:3 1:7 | 29.43 7.57 1.70 NS | p < 0.05 p < 0.05 p > 0.05 |
| POP9 Gokce × S 2Drd-065 | 23 | 27 | 1 | 1:1 1:3 1:7 | 0.32 NS 11.76 51.30 | p> 0.05 p < 0.05 p < 0.05 |
| POP10 Gokce × Karab-092 | 14 | 32 | 1 | 1:1 1:3 1:7 | 7.04 0.72 NS 13.53 | p < 0.05 p > 0.05 p < 0.05 |
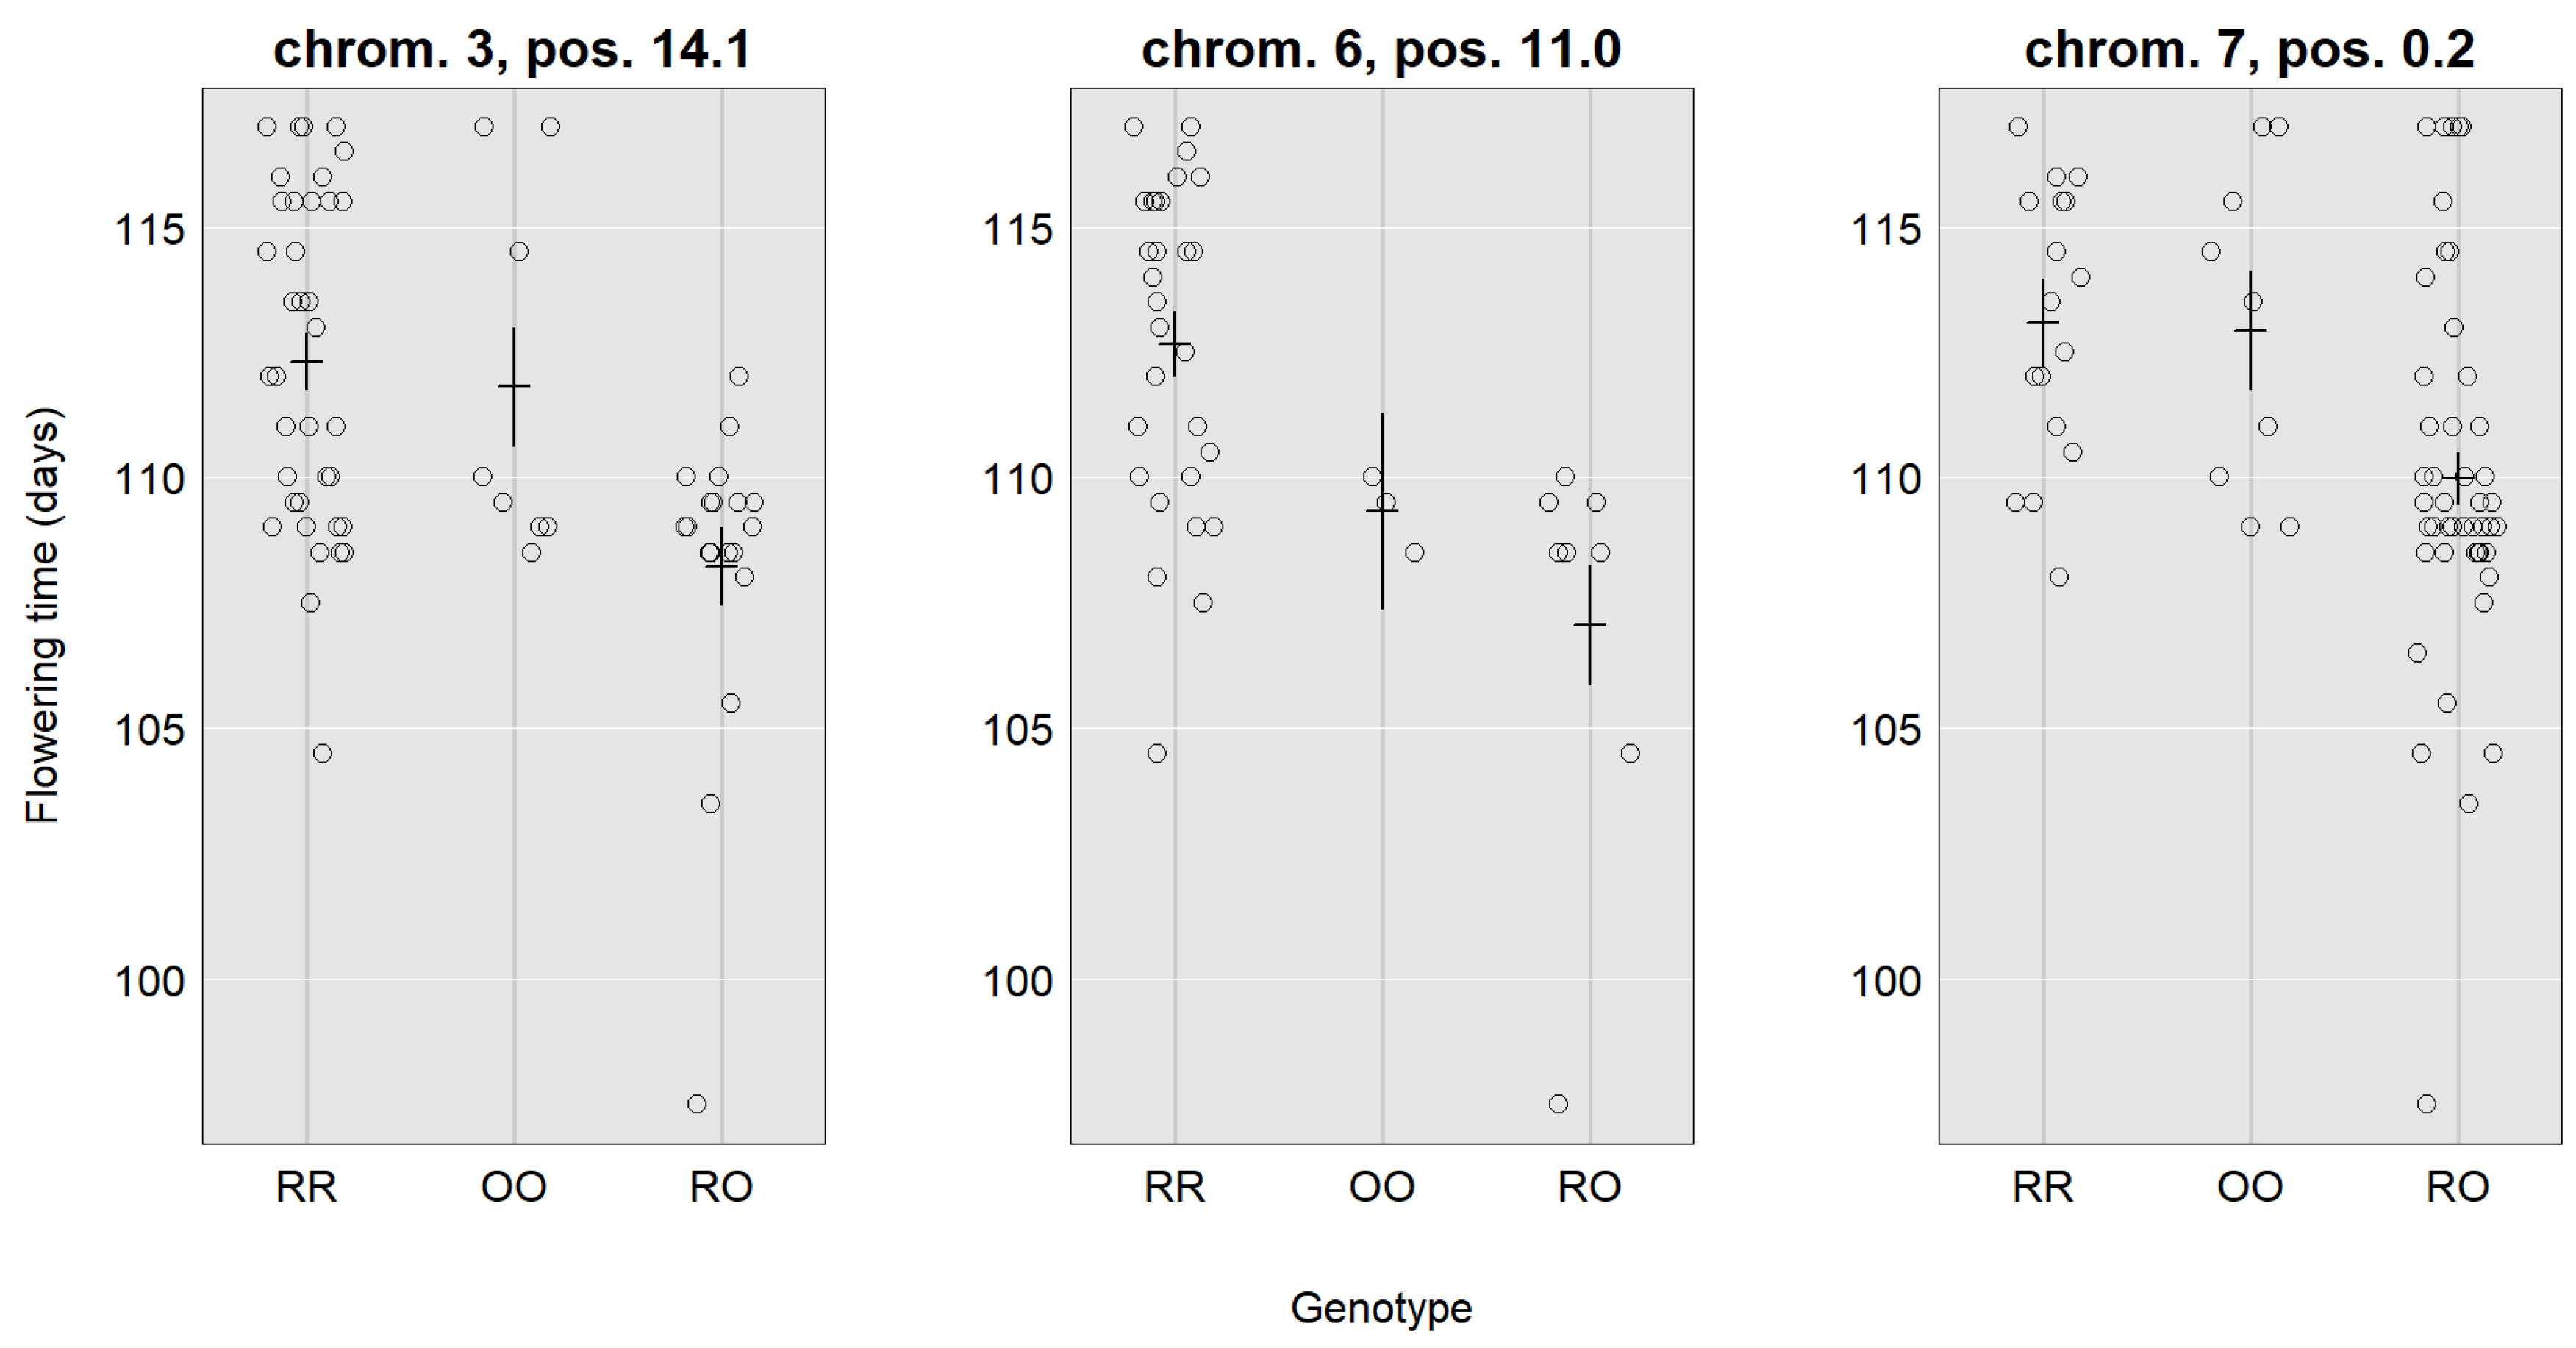
| Trait | Flowering Time | Flower Color | |||||
|---|---|---|---|---|---|---|---|
| Family | Gokce × Oyali | Gokce × Oyali | Gokce × Karab | ||||
| Location | 3, 14.1 (10.8–26.5) | 6, 11.0 (2.0–20.9) | 7, 0.2 (0.2–10.7) | 4, 5.9 (5.9–11.3) | 8, 1.3 (0.3–11.6) | 4, 8.9 (5.9–18.9) | 5, 21.9 (7.9–29.9) |
| LOD | 4.24 | 3.19 | 3.7 | 10.78 | 3.70 | 3.64 | 6.60 |
| SNP | CaSc40395 | c6.loc11 | TC86258 | Ca_TOG896936 | c8.loc1 | c4.loc9 | c5.loc22 |
| Mu | 111.24 | 110.43 | 111.98 | 2.14 | 2.08 | 2.12 | 1.93 |
| RR | 1.53 | 2.31 | 1.04 | 0.69 | −0.48 | 0.41 | 0.25 |
| RO | −2.73 | −2.45 | −2.00 | 0.05 | 0.09 | 0.12 | 0.39 |
| OO | 1.20 | 0.13 | 0.95 | −0.74 | 0.39 | −0.53 | −0.65 |
| Add. effect | −0.17 | −1.09 | −0.05 | −0.72 | 0.44 | −0.47 | −0.45 |
| Population | Purple Flowering Phenotype | White Flowering Phenotype | df | Ratio Tested | χ2 | p-Value |
|---|---|---|---|---|---|---|
| POP1 Gokce × Bari1-092 | 37 | 91 | 1 | 1:1 1:3 1:7 | 22.78 1.04 NS 31.50 | p < 0.05 p > 0.05 p < 0.05 |
| POP2 Gokce × Cudi1-152 | 77 | 61 | 1 | 1:1 1:3 1:7 | 1.86 NS 27.14 126.81 | p > 0.05 p < 0.05 p < 0.05 |
| POP3 Gokce × Cudi2-022 | 78 | 56 | 1 | 1:1 1:3 1:7 | 3.61 NS 20.15 105.11 | p > 0.05 p < 0.05 p < 0.05 |
| POP4 Gokce × Egil-073 | 28 | 84 | 1 | 1:1 1:3 1:7 | 28.00 0.00 NS 16.00 | p < 0.05 p > 0.05 p < 0.05 |
| POP5 Gokce × Egil-065 | 84 | 62 | 1 | 1:1 1:3 1:7 | 3.27 NS 24.36 119.86 | p > 0.05 p < 0.05 p < 0.05 |
| POP6 Gokce × Oyali-084 | 73 | 39 | 1 | 1:1 1:3 1:7 | 10.32 5.76 51.02 | p < 0.05 p < 0.05 p < 0.05 |
| POP7 Gokce × Savur-063 | 73 | 53 | 1 | 1:1 1:3 1:7 | 3.17 NS 19.57 100.68 | p > 0.05 p < 0.05 p < 0.05 |
| POP8 Gokce × Sirna-060 | 62 | 52 | 1 | 1:1 1:3 1:7 | 0.88 NS 25.84 114.29 | p > 0.05 p < 0.05 p < 0.05 |
| POP9 Gokce × S2Drd-065 | 49 | 22 | 1 | 1:1 1:3 1:7 | 10.27 4.84 22.18 | p < 0.05 p < 0.05 p < 0.05 |
| POP10 Gokce × Karab-092 | 47 | 28 | 1 | 1:1 1:3 1:7 | 4.81 6.08 42.29 | p < 0.05 p < 0.05 p < 0.05 |
Publisher’s Note: MDPI stays neutral with regard to jurisdictional claims in published maps and institutional affiliations. |
© 2022 by the authors. Licensee MDPI, Basel, Switzerland. This article is an open access article distributed under the terms and conditions of the Creative Commons Attribution (CC BY) license (https://creativecommons.org/licenses/by/4.0/).
Share and Cite
Lakmes, A.; Jhar, A.; Penmetsa, R.V.; Wei, W.; Brennan, A.C.; Kahriman, A. The Quantitative Genetics of Flowering Traits in Wide Crosses of Chickpea. Agriculture 2022, 12, 486. https://doi.org/10.3390/agriculture12040486
Lakmes A, Jhar A, Penmetsa RV, Wei W, Brennan AC, Kahriman A. The Quantitative Genetics of Flowering Traits in Wide Crosses of Chickpea. Agriculture. 2022; 12(4):486. https://doi.org/10.3390/agriculture12040486
Chicago/Turabian StyleLakmes, Abdulkarim, Abdullah Jhar, R. Varma Penmetsa, Wenbin Wei, Adrian C. Brennan, and Abdullah Kahriman. 2022. "The Quantitative Genetics of Flowering Traits in Wide Crosses of Chickpea" Agriculture 12, no. 4: 486. https://doi.org/10.3390/agriculture12040486