Article

Revealing a Significant Latent Loss of Dry Matter in Rice Based on Accurate Measurement of Grain Growth Curve

1
School of Biological and Agricultural Engineering, Jilin University, Changchun 130022, China
2
School of Grain Science and Technology, Jilin Business and Technology College, Changchun 130507, China
*
Author to whom correspondence should be addressed.
Agriculture 2022, 12(4), 465; https://doi.org/10.3390/agriculture12040465
Submission received: 20 February 2022 / Accepted: 23 March 2022 / Published: 25 March 2022

Abstract

:
Against the background of increased population and resource depletion, managing food losses means conserving agricultural production resources and increasing farmer income. This paper mainly introduces the discovery and value of latent loss. In 2019, our experimental team formulated the 5T management method, which concerned the rice harvest period. Moreover, to promote the 5T management method, our team conducted relevant experiments about rice grain growth curve and found an accidental reduction in the dry matter weight of rice. To ensure the accuracy of the results of the latent rice loss in 2019, easy-to-use nuclear magnetic resonance is a non-destructive, rapid evaluation method, which is suitable for accurately determining high-moisture content and multi-variety rice. Overall, the experimental results in 2020 showed that if rice was harvested at the optimal time, the rice loss rate could be reduced by 3.5346%, which is equivalent to a yield of 235,051 tons of rice. The results are in agreement with evidence from field trials and suggest that the latent loss of dry matter caused by delayed harvest not only causes yield losses and economic losses but also increases postharvest grain loss and rice seed shattering loss. This significant factor, the optimal harvest time, in harvest period is strictly controlled to prevent the dry matter loss caused by innate knowledge and traditional management and to provide new possibilities for increasing the amount of available fertile land and generating income.

1. Introduction

Food loss and waste have become major global issues that not only affect the relationships between food supply and markets and farmer income but also threaten global food security and environmental sustainability [1,2]. Since 2015, the FAO’s Global Initiative on Food Loss and Waste program has issued a number of case studies, and the results indicated that harvest appears to be a common critical point for losses involving all types of food crop species [3].
Almost one-third of global food production in terms of weight is lost or wasted. In sub-Saharan Africa and South/Southeast Asia, the per capita food loss is 120~170 kg/year [4]. Food loss can either be the result of a precise quantitative loss or arise indirectly due to qualitative loss [5]. In developing countries, the main causes of food loss are related to outdated harvest techniques and limited postharvest handling and infrastructure [6]. Specifically, postharvest losses in Peru are estimated to be 15%~27% of production [7]. A study [8] conducted on rice postharvest losses in Nigeria estimated a postharvest loss of 24.9%; the loss from paddies accounted for 19% of the total cultivated area, among which the loss during harvest was 4.43%. Another survey [3] showed that on-farm losses of cereals and pulses are highest in sub-Saharan Africa and in Eastern and Southeast Asia, and their losses range from 0.1% to 18%. ALavi et al. stated that the percentage of rice loss in Southeast Asia was 10%~37% [9]. Another postharvest loss study in India estimated a 10.3% increase in rice harvest losses due to delayed harvest because of a lack of adequate harvest equipment [10].
As a major global food producer, China has experienced severe postharvest problems. The rice harvest loss varies with maturity and the absolute loss rate is between 1.00% and 6.80% [11].There are many dynamic and complex factors involved in the process of rice harvest and storage, mainly those that focus on postharvest grain loss [12,13,14,15], including loss due to mechanical harvest [16,17], loss due to transportation and dispersal [18], loss during the drying process [19], loss caused by mildew [20], loss during storage [21], loss due to over-processing [22], etc. Based on statistics from China’s Ministry of Agriculture, the fixed loss rate of grain during harvest is 5.5%. At this rate, China loses 35 billion kilograms of grain annually. Moreover, the losses during storage and transportation are equally large—approximately 35 billion kilograms annually [23].
Most of the loss problems in rice growth are due to the high moisture content of grain, which is generally above 30% and difficult to measure. The traditional method for moisture determination, i.e., the Oven-drying method, requires complex steps and is time-consuming and susceptible to interference. In order to make a large number of measurements, a non-destructive rice moisture content detection method, Nuclear magnetic resonance (NMR), was proposed [24], which can reveal the moisture variation more directly and accurately during rice growing. The operation is also simple and chemical reagents and chemical analysts are not needed [25], thus the results can be used to determine the standard-moisture 1000-grain weight for rice grains.
With the purpose of exploring the rice growth curve, our team studied how to reduce the post-harvest loss of rice. In previous studies [26,27,28,29], it was found that high-moisture content rice (≥30%) was generally not involved; the rice grain growth process was not focused on and the sampling period was not fixed once per day. Through designing relevant experiments, our team carried out a 5T management experiment involving the high-quality rice harvesting and storage of three rice varieties in 2019, and developed the “DB22/T 3113-2020 5T Postharvest management protocol for high-quality paddies” [30] based on the preliminary investigation and experimental operation. Furthermore, the growth pattern of rice followed an irregular S-shaped curve was discovered [31,32], and the dry matter of rice grains peaked on a certain day after the plants entered the mature stage and then declined to a certain value over time, which was defined as latent loss of dry matter. However, the existence of this loss has not been noted in the literature. To prove that this phenomenon does not exist because of error, our team selected 18 representative rice varieties in Jilin Province and examined their quality indicators. In particular, NMR moisture detection technology was used and a model of the standard-moisture 1000-grain weight for rice grains was established. The potential loss and rate of loss were calculated and compared to the actual data recorded during harvest and storage operations in Jilin Province, Northeast China.

2. Materials and Methods

2.1. Plot Location and Test Materials

The experiment was carried out in the experimental plot of Gudianzi town, Changyi district, Jilin City, Jilin Province, China (longitude, 126.37°; latitude, 44.02°) and Nanweizi, Gongzhuling city, Siping city, Jilin province (longitude, 124.75°; latitude, 43.47°) in 2019, Gudianzi town, Changyi district, Jilin City, Jilin Province, China (longitude, 126.37°; latitude, 44.02°) in 2020. The experimental field has a deep soil layer, convenient irrigation and drainage, water and fertilizer conservation, good permeability, and the surrounding environment, planting density, fertilization and pesticide spraying; other conditions are basically the same.
The rice variety tested was divided into two types based on grain type: round-grained varieties and long-grained varieties. In 2019, the round-grained varieties were Jijing 816 and Jijing 528; the long-grained varieties were Wuyoudao 4. In 2020, the round-grained varieties included Jijing 511, Jijing 816, Jinongda 667*, and Qinglin 611*; the long-grained varieties included Tianlong 619, Wokeshou 1, Fangyuan 77*, Zhongke 804*, Zhongkefa 5*, Daohuaxiang 9*, Wuyoudao 4, Longyang 13, Zaoxiang 7*, Longyang 16*, Songjing 29*, Longyang 7, DF416, and Jijing 561 (* means a medium-maturing variety with a growth period of less than 140 days, whereas the others are late-maturing varieties with a growth period of more than 140 days).

2.2. Experimental Design

This experimental process is shown in Figure 1. There were some differences in experimental details between 2019 and 2020. First, the selection of experimental varieties was different, and the varieties tested in 2020 were more representative; second, the continuous sampling time of the experiment was different: 30 days in 2019 and 43 days in 2020; third, the moisture measurement method was different: using the oven water method in 2019 and using NMR technology for determination in 2020.
Although the results of the two-moisture determination method were accurate, it was not appropriate to use the oven water method under the test conditions of various varieties, short sampling period and heavy sample size. Furthermore, NMR moisture detection equipment was used to measure moisture, which has the advantage of not damaging seeds, high sensitivity, strong pertinence, short detection time, no complicated steps and sample preparation for targeted analysis, and the results are equally accurate. Due to the existence of NMR technology, it is possible to detect 18 varieties of rice at the same time to determine the existence of latent losses.
By analysing the relaxation times of solid and bound water, our team were able to rapidly and accurately determine rice moisture samples [33,34] using a seeds oil content analyser benchtop NMR analyser (model PQ001-12-0040V; range 13%~80%, relative standard deviation (RSD) <5%). For this, an accurately weighed sample was placed in the centre of the radio frequency coil at the central position of the permanent magnet to measure the moisture content of the grain. The sequence parameters were as follows: SF, 11 MHz; O1, 929,168.73 Hz; P1, 5.00 µs; TD, 1024; TW, 1500.000 ms; NS, 16; and RFD, 0.002 ms.
The measurement accuracy of Seeds Oil Content Benchtop NMR Analyzer was less than or equal to 0.5%, and the water measurement range was 0.05%~100%. In addition, the moisture content of the rice and the total amplitude of NMR signals were positively correlated. The regression equation was y = 938.587x − 92.0737, the correlation coefficient was R = 0.9992, and the determination coefficient was R2 = 0.9984.

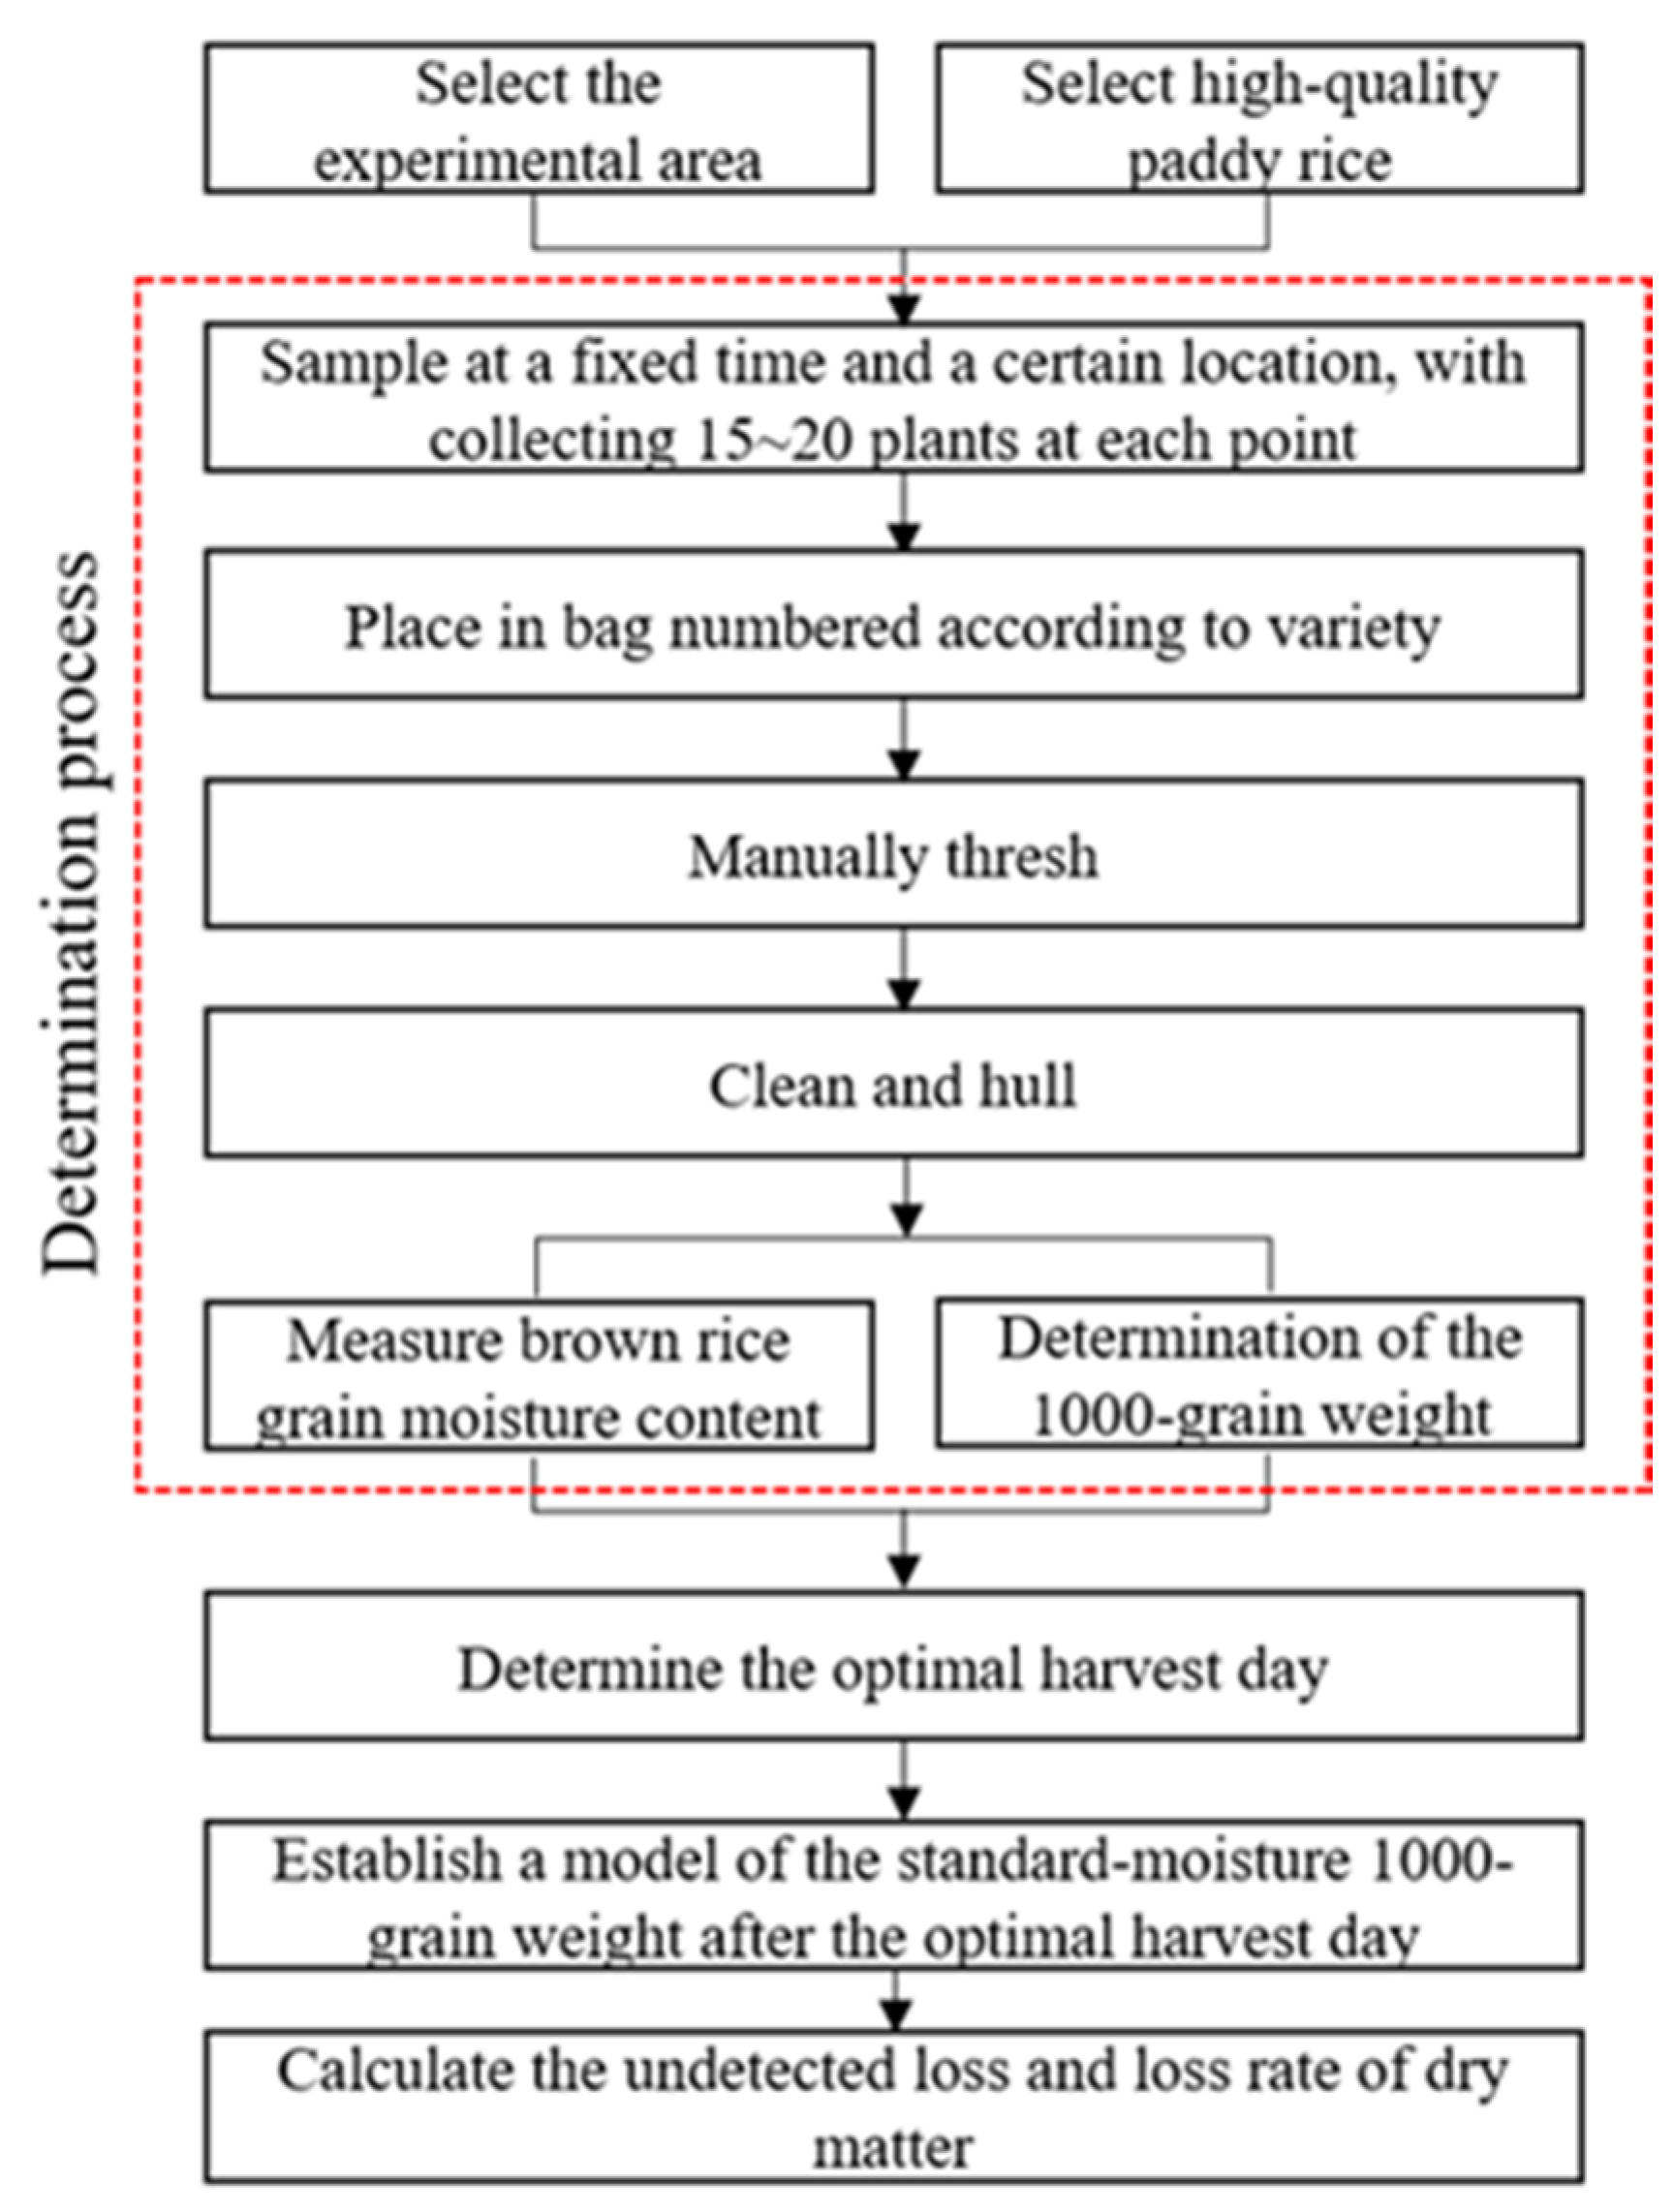
2.3. Sample Collection

The following process was performed during the experiment. First, the middle 10 m × 10 m portion of each field was selected (where it was flat and fertile) as the experimental area for each rice variety and divided it into five representative points according to the 5-point sampling method. At each sampling point, the ear leaves were cut from random plants and 15~20 plants were collected at 10 a.m. every day, avoiding the edge of the field. The ear leaves were placed in bag numbered according to variety; all the samples were then manually threshed by stainless steel hose clamps, cleaned and hulled by a rubber-roll husker to determine the 1000-grain dry matter weight and the brown rice grain moisture content.

2.4. Data Processing and Statistical Analyses

The optimal harvest day of each variety was determined by analysing the data, and a model of the standard-moisture 1000-grain weight after the optimal harvest day was established. Based on the average harvest day of high-quality rice in Northeast China, the latent loss and loss rate of dry matter were calculated via a nonlinear regression model. The various indicators were measured and calculated as follows.

2.4.1. Determination of Sample 1000 Grains of the Standard-Moisture Weight

The moisture content of brown rice grains (WH2O) was measured by using rapid and accurate moisture detection method. For ease of measuring the 1000-grain weight (m1), approximately 500 brown rice grains were randomly omitted by quartering, the unbroken grains were selected, weighed (mt), and the number of whole grains (N) was recorded, Then, the weight of 1000 grains of dry matter (M) was calculated, which is accurate to 0.0001 g in Formula (1):
M (g) = mt × 10 × (100 − WH2O) ÷ N
Here, all the test results need to be repeated three times to obtain the average value. Finally, the dry weight of 1000 grains were converted into the standard-moisture weight of 1000 grains, and its moisture content was 15.0%.

2.4.2. Determination of Sample Optimal Harvest Days

During the data processing, the maximum value and the minimum value of the standard-moisture 1000-grain weight data of each rice variety were determined, and if the value was at either end of all the data, the value was omitted; if not, the beginning and ending data were averaged, and the rest of the data were filled in accordingly. Finally, all the data were processed to obtain the standard-moisture 1000-grain weight homogenization data of the different rice varieties.
To analyse the direct effects of the standard-moisture 1000-grain weight and time after heading, both linear and nonlinear regressions were performed using all the data obtained. To determine the best model for each relationship, first- and second-order linear models were constructed, and the model with the highest adjusted R2 value was ultimately chosen. A linear regression equation between the standard-moisture 1000-grain weight (g) of water and the number of days after heading (days) was established using the determined optimal harvest day as the starting point, and the R2 value was calculated. The optimal harvest day was the day when the dry matter weight of grains reached the maximum value during rice growth (Table 1).

2.4.3. Latent Dry Matter Loss and Loss Rate

The latent loss of dry matter
(△m) was defined as the weight change value between the standard-moisture 1000-grain weight of the optimal harvest day (m30) and the standard-moisture 1000-grain weight of the average harvest day (m31) in the experimental area. The Formula is as follows (2):
△m = m30 − m31
The latent loss rate of dry matter (ULR) is defined as ratio of the latent loss of dry matter to the standard-moisture 1000-grain weight on the optimal harvest day, as shown in Formula (3):
ULR = (m30 − m31) ÷ m30×100%

3. Results

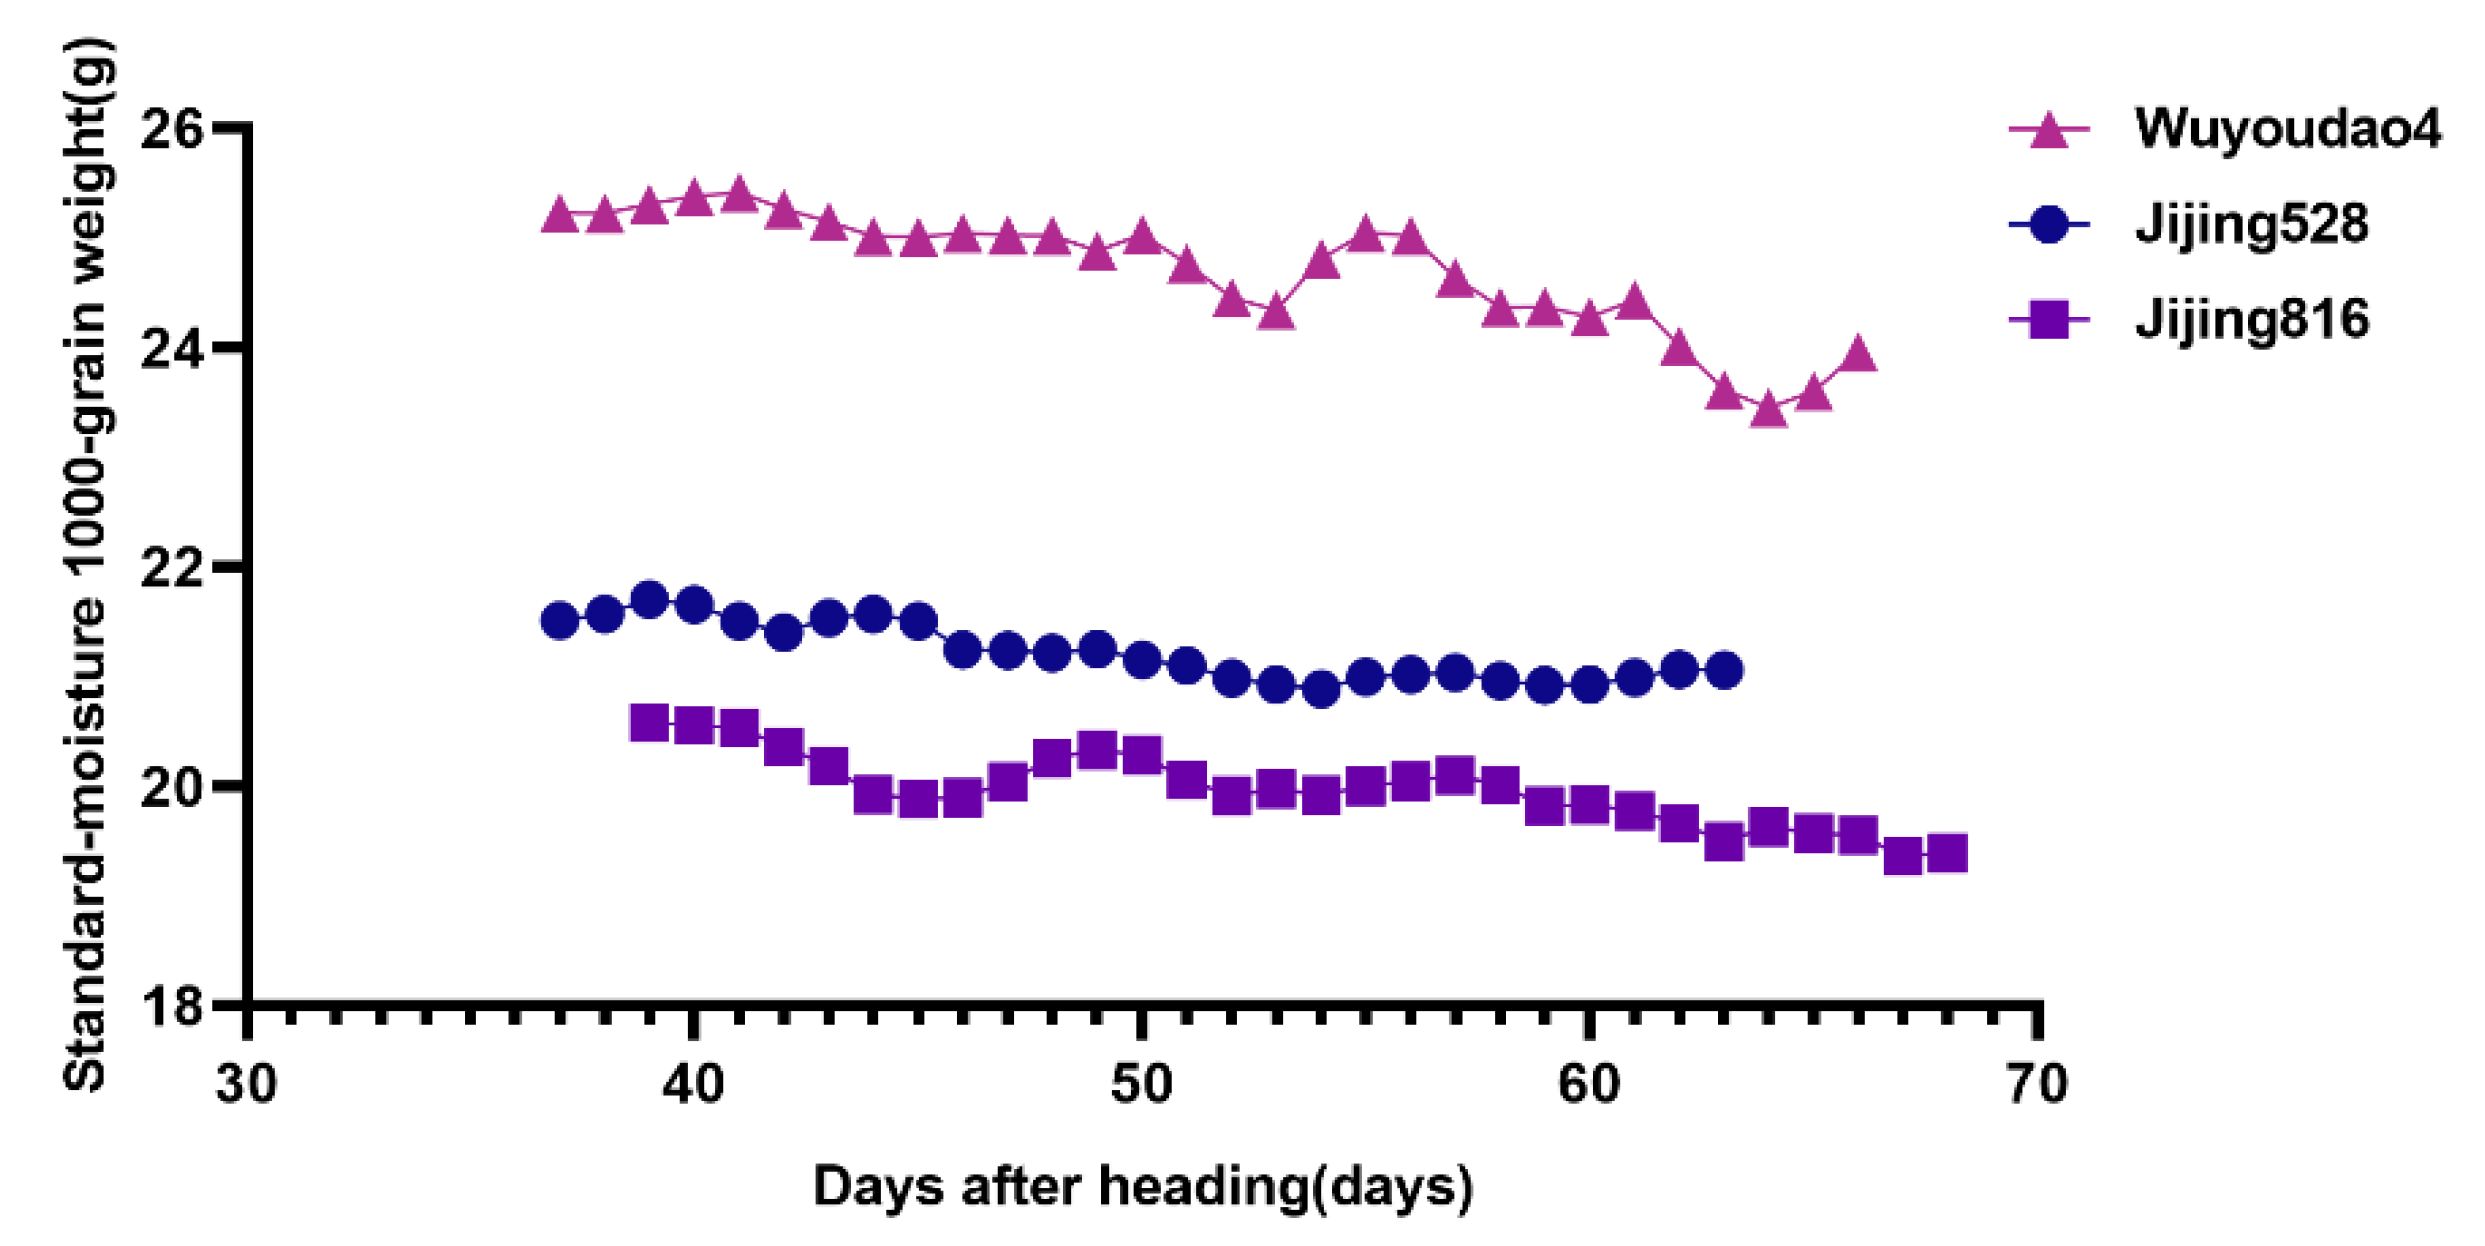
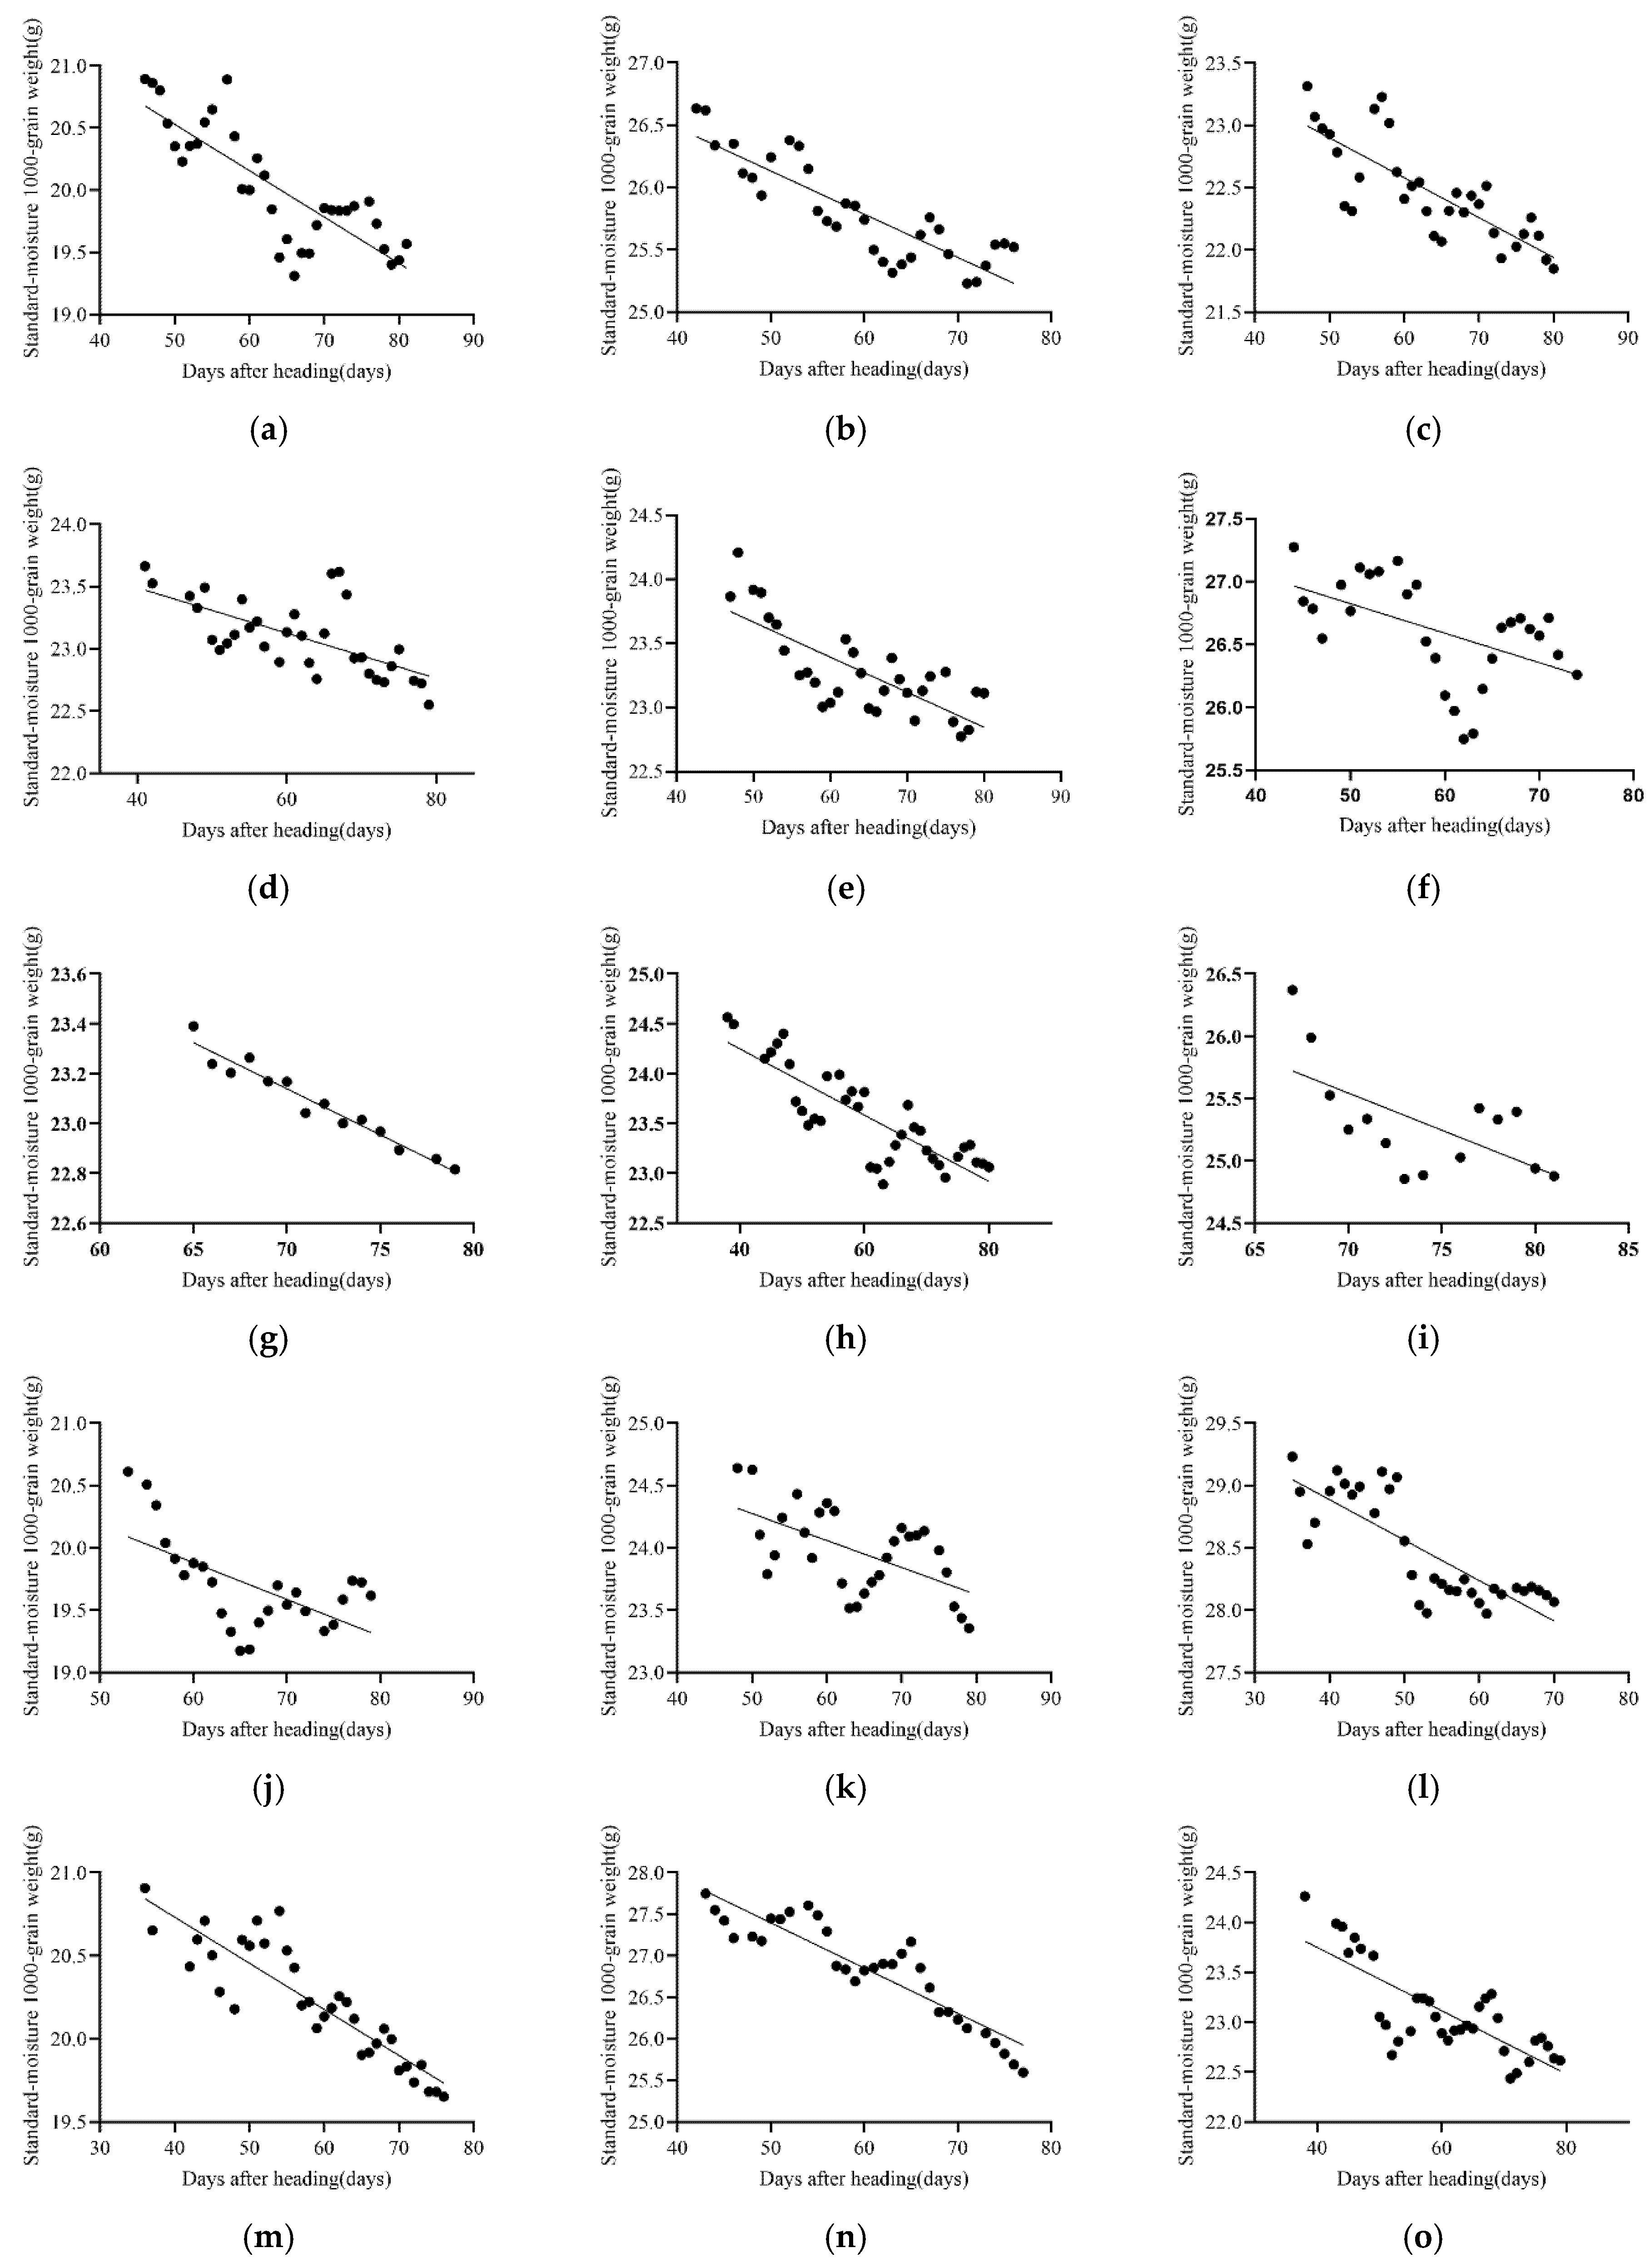
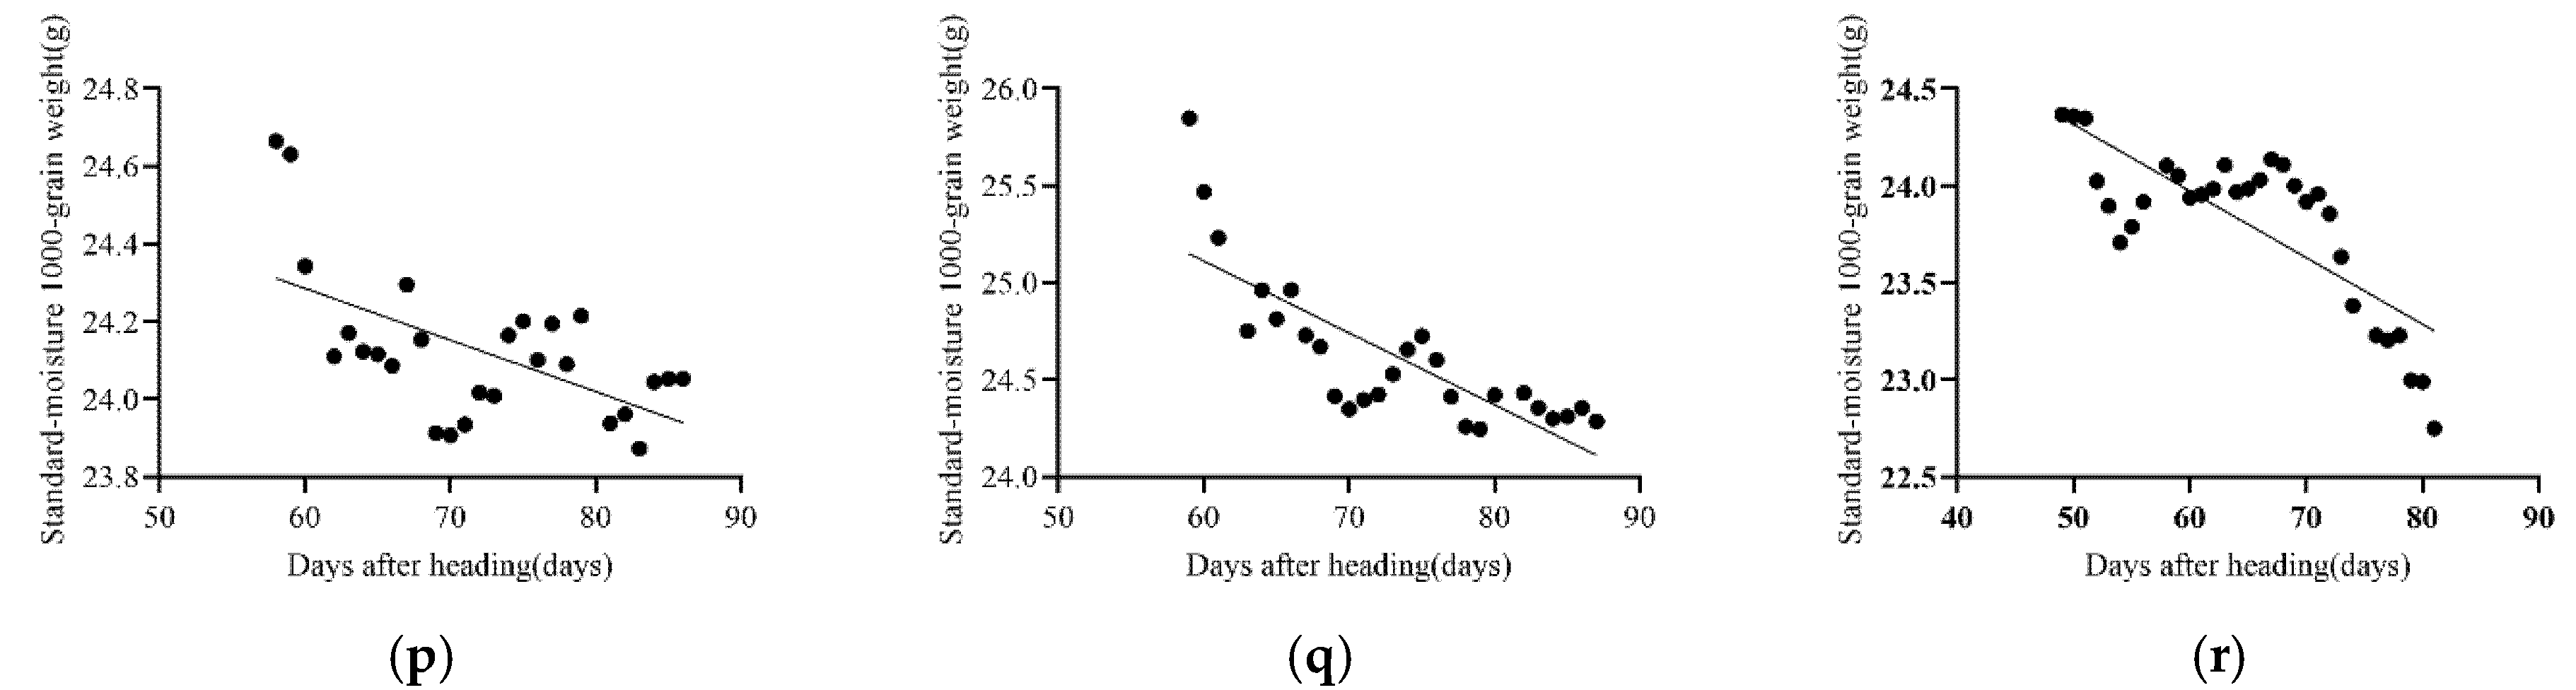
3.1. Standard-Moisture 1000-Grain Weight Model

Taking the determined best harvest day as the starting point, the linear regression equation was applied to the experimental data of various rice varieties. All of the models revealed a negative X coefficient, 100% of the R2 values of the 3 kinds of paddies were greater than 0.5 in 2019 and 66.7% of the R2 values of 12 regression equations for the 18 kinds of paddies were greater than 0.5 in 2020, further explaining why dry matter weight gradually decreased with time and increasing rice growth (Table 1).

3.2. Latent Dry Matter Loss and Loss Rate

Assuming that the rice loss at the optimal harvest day was 0, the latent weight loss and dry matter loss rate at 70 days and 75 days after heading were calculated in Table 2. According to the local harvesting method in Northeast China, farmers generally harvest approximately 75 days after heading.

4. Discussion

4.1. Rice Growth Curve and Optimal Harvest Days

During the autumn of 2019, three kinds of high-quality rice planted in different locations was sampled and cultivated via different methods [35], as shown in Figure 2.
From Figure 2, it can be seen that the rice growth curve showed a downward trend, and the dry matter weight decreased with the heading days. In other words, if rice cannot harvest at the right time, the yield of paddy will decrease rather than increase as the number of days after heading increases. To verify that this conclusion does not exist by accident, our team introduced NMR moisture detection equipment to ensure the accuracy of the data and selected 18 representative varieties of high-quality rice from the experimental station in Northeast China, Jilin Province. Rapid and accurate NMR moisture detection technology was used to measure the moisture content of the brown rice grains of the different rice varieties (Supplementary Materials Table S1), after which the 1000-grain dry matter weight (Supplementary Materials Table S2). According to the data of the standard-moisture 1000-grain weight of the rice varieties (Supplementary Materials Table S3), the optimal harvest day was determined on the basis of the analysis results, as shown in Table 3.
The inherent randomness of the sampling method led to certain fluctuations in the measured value of the 1000-grain dry matter weight. On the basis of the statistical analysis, it was considered that after heading, all the rice grains remained green and immature, dry matter began to accumulate continuously, and the moisture content increased; in the dough period, the number of green immature grains began to decrease, the moisture content of the brown rice grains decreased rapidly, and the dry matter increased slowly, peaking at approximately 48 days. During the harvest period, the number of green immature grains significantly reduced, the moisture content was reduced to less than 30%, and the dry matter content began to decrease, resulting in a latent loss. This latent loss of dry matter is a common postharvest phenomenon, and 7 days before and after the date of the maximum dry matter weight of the different rice varieties was defined as the best harvest time. Of course, the best harvest date of rice will be influenced by temperature, humidity and other factors.

4.2. The Possibility of Latent Loss Exists

In many studies [32,36,37,38,39,40], latent losses have not been directly described in terms of rice growth curve measurements. There may be three reasons for this: first, in some previous studies, the sampling period was approximately seven days; thus, the relatively small amount of dry matter loss was masked due to randomness. Second, the error of the experimental method used in the past research was too large, and the balance used was too imprecise and incapable of revealing latent losses. Additionally, last but not least, the moisture content was determined by nuclear magnetic resonance technology instead of the standard oven method, making it possible to determine 18 rice varieties simultaneously.
During the autumn experiment of 2019, during the process of measuring the growth of the paddies and generating maturity curves, a decrease in 1000-grain dry matter in the later rice growth period was found. As such, the whole rice was tracked in the autumn experiment in 2020. Under the conditions of a short sampling period (1~2 days) and with multiple rice planted, the brown rice grain moisture was measured via NMR moisture detection, and continuous and intensive sampling was carried out throughout the growth process after heading, which further confirmed that there was a latent loss of dry matter during the rice growth process (Figure 3). After the best harvest day, the dry matter content of the rice obviously decreased slowly. Therefore, the keys to revealing latent losses are short sampling periods and stable and accurate moisture detection.

4.3. Calculation of the Latent Loss of Dry Matter

Rice losses on the optimal harvest day were assumed to be 0, and the latent weight loss and dry matter loss rate were calculated according to the data recorded on the actual harvest day. The data show that the later the rice was harvested, the greater the dry matter loss was, which verified the existence of latent loss of dry matter. In other words, if rice is not harvested at the appropriate time, the yield will decrease rather than increase with the number of days after heading (Table 4).
The estimation of latent losses requires two time points: one is the optimal harvest period for rice growth, and the other is the day of the current actual harvest operation. In actual rice operations, due to weather, operation methods, the use of different rice varieties and differences in planting areas, the appropriate harvest period of rice varieties varies from 40~50 days after heading [29]. The optimal harvest days (Table 3) are essentially consistent with the appropriate harvest period. Based on the results of our field investigations and experiments, the rice ears began to grow around August 1, and the optimal harvest is usually around September 15. However, the actual harvest time in some locations was around October 10, a difference of 25 days.
The dry matter weight of rice decreased with heading time, and the results of the analysis showed that a delayed harvesting date is the primary cause for the loss, as it causes potential reductions in dry matter. Although, this part of the loss can easily be ignored, Table 4 shows that when rice was not harvested at the optimal time, the dry matter loss reached 3.5346%. The average weight loss and 1000-grain dry matter loss rate of all of the above-mentioned varieties were 0.8591 g and 3.5346%, respectively, on the average harvest day (75 days after heading) in Northeast China. The average loss weight and 1000-grain dry matter loss rate of the round-grained, long-grained, medium-maturing and late-maturing varieties were 0.9914 g, 0.8213 g, 0.6869 g, and 1.0312 g and 4.6203%, 3.2243%, 2.8820%, and 4.1871%, respectively.

4.4. Latent Losses of Dry Matter May Lead to Economic Losses

In addition to losses due to food loss and food waste, latent loss of dry matter can be added as a new form. The latent loss of dry matter not only causes yield losses and economic losses but also increases the amount of postharvest loss, such as grain loss.
The amount of rice production in Jilin Province is 6.65 million tons annually [41]. If seventy-five days after heading is taken as the final harvest day, the weight of the latent dry matter loss is 6.65 million tons × 3.5346% = 235,051 tons. In addition, assuming that the average purchase price is 2600 yuan/ton, the economic loss caused by the latent dry matter loss is approximately 2600 yuan/ton × 235,051 tons = 611,130,600 yuan. If the cost for a set of harvesting equipment is RMB 300,000, then 2037 sets of harvesters could be purchased with the money lost due to latent losses. In other words, timely harvesting can reduce the dry matter loss by 3.5346% in 2020.
By shortening the sampling period and using NMR moisture detection technology, on the basis of accurately constructed growth curves of the high-quality paddies, we determined that there is an optimal harvest day for high-quality paddies and that harvesting beyond this day leads to latent losses of dry matter. Latent losses of dry matter not only cause direct economic losses but also cause obvious decreases in harvestable paddies due to overdue harvest. If the grains fall off in the field, mechanical harvest damage also increases and can even lead to a decrease in the flavour of rice and the sale price of rice. These economic losses need to be further measured and estimated.

5. Conclusions

  • Latent loss of rice dry matter does exist and is not invisible. Latent loss is the loss of dry matter during harvest operations, not loss of moisture from the grain. To compute the latent losses of rice, dry matter must be on the basis of the same moisture content in order to calculate the loss of weight. The dry matter weight of rice was found to reduce with the heading time due to the delayed harvest. This is called “latent loss of dry matter” and it is an aspect of grain loss that is easily overlooked. It was concluded that if the paddy is not harvested at the right harvest time, the dry matter loss of rice can reach 3.5346%, which is equivalent to 235,051 tons of paddy.
  • A decrease in dry matter mass was initially found when the rice grain harvest was delayed; the more mature the grain was, the easier the over-ripe grains fell off and were not harvested [42]. This part of the loss is a chain reaction after the latent loss of dry matter caused by not harvesting at the optimal time, which eventually leads to economic losses. Our team found that the main reasons for this phenomenon are as follows. First, our experimental group were able to take short and continuous sampling intervals and closely observe every detail of the rice growth process; second, the use of modern technology for large-scale sampling and testing was no longer limited to one or two varieties; third, on the basis of the experiment in 2019, the experiment in 2020 extended the duration of the experiment, thus covering the growth link of rice with high water content (≥30%) [29], which made the conclusion of latent loss of dry matter more convincing; finally, it avoided the influence of the traditional idea that farmers should harvest rice as late as possible, and proves to some extent that delayed harvesting will reduce the total rice yield, rather than increase the harvest;
  • Reducing food loss and waste is a long-term and arduous task. During the actual experiment, our research team discovered and put forward a brand-new perspective, applying NMR detection technology to make meticulous and multi-variety measurements aiming to improve the 5T management process [43], avoid the loss caused by wrong ideas and improper management, increase intangible fertile land, further changing the concept and habits of agricultural production, popularizing the technology of grain loss reduction and reducing the grain loss in the harvesting process.

Supplementary Materials

The following supporting information can be downloaded at: https://www.mdpi.com/article/10.3390/agriculture12040465/s1, Table S1: The moisture content of the brown rice grains of the 18 different paddy varieties in 2020; Table S2: 1000-grain dry matter weight of the 18 different paddy varieties in 2020; Table S3: Standard-moisture 1000-grain weight of the 18 paddy varieties in 2020.

Author Contributions

Conceptualization, W.W.; methodology, Y.W.; validation, N.Z. and S.L.; formal analysis, Y.W.; investigation, Y.W.; resources, N.Z. and S.L.; writing—original draft preparation, Y.W.; writing—review and editing, Y.W.; supervision, W.W. and X.M.; project administration, W.W. and Z.W. All authors have read and agreed to the published version of the manuscript.

Funding

This research was funded by the National Key R&D Program of China, grant number 2016YFD0401001.

Institutional Review Board Statement

Not applicable.

Informed Consent Statement

Not applicable.

Data Availability Statement

The data presented in this study are available in the graphs, tables and Supplementary Materials provided in the manuscript.

Conflicts of Interest

The authors declare no conflict of interest.

References

  1. Majid, S.-J.; Ximing, C. Reducing food loss and waste to enhance food security and environmental sustainability. Environ. Sci. Technol. 2016, 50, 8432–8443. [Google Scholar] [CrossRef]
  2. FAO; IFAD; UNICF; WFP; WHO. The State of Food Security and Nutrition in the World 2020: Transforming Food Systems for Affordable Healthy Diets; FAO: Rome, Italy, 2020. [Google Scholar]
  3. FAO. The State of Food and Agriculture 2019: Moving Forward on Food Loss and Waste Reduction; FAO: Rome, Italy, 2019. [Google Scholar]
  4. FAO. Global Food Losses and Food Waste: Extent, Causes and Prevention; FAO: Rome, Italy, 2011. [Google Scholar]
  5. Aulakh, J.; Regmi, A. Post-Harvest Food Losses Estimation-Development of Consistent Methodology; FAO: Rome, Italy, 2013. [Google Scholar]
  6. Bendinelli, W.E.; Su, C.T.; Pera, T.G.; Caixeta Filho, J.V. What are the main factors that determine post-harvest losses of grains? Sustain. Prod. Consum. 2020, 21, 228–238. [Google Scholar] [CrossRef]
  7. Diaz-Valderrama, J.R.; Njoroge, A.W.; Macedo-Valdivia, D.; Orihuela-Ordonez, N.; Smith, B.W.; Casa-Coila, V.; Ramirez-Calderon, N.; Zanabria-Galvez, J.; Woloshuk, C.; Baributsa, D. Postharvest practices, challenges and opportunities for grain producers in Arequipa, Peru. PLoS ONE 2020, 15, e0240857. [Google Scholar] [CrossRef]
  8. Oguntade, A.E.; Thylmann, D.; Deimling, S. Post-Harvest Losses of Rice in Nigeria and Their Ecological Footprint; Federal Ministry for Economic Coopration and Development: Bonn, Germany, 2014.
  9. Alavi, H.R.; Htenas, A.; Kopicki, R.; Shepherd, A.W.; Clarete, R. Trusting Trade and the Private Sector for Food Security in Southeast Asia; World Bank Publications: Washington, DC, USA, 2012. [Google Scholar]
  10. Kannan, E.; Kumar, P.; Vishnu, K.; Vishnu, K.; Abraham, H. Assessment of Pre and Post Harvest Losses of Rice and Red Gram in Karnataka. Agricultural Situation in India. 2015, 72, 101–105. [Google Scholar]
  11. Wang, G.; Yi, Z.; Chen, C.; Cao, G. Effect of harvesting date on loss component characteristics of rice mechanical harvested in rice and wheat rotation area. Trans. Chin. Soc. Agric. Eng. 2016, 32, 36–42. [Google Scholar] [CrossRef]
  12. Yanzhi, G.; Yao, C.; Jingli, G. Analysis and countermeasures on the Loss of grain industry chain from field to table in China. Agric. Econ. 2014, 1, 23–24. [Google Scholar] [CrossRef]
  13. Gou, Y.; Yang, W.; Lin, S.; Gao, Y.; Luan, X. Research progress on rice shattering. Chin. J. Rice Sci. 2019, 33, 479–488. [Google Scholar] [CrossRef]
  14. Xiaoxin, Y. Causes analysis and countermeasures of loss in grain storage and transportation. Agric. Sci. Technol. Equip. 2020, 5, 74–75. [Google Scholar] [CrossRef]
  15. Kumar, D.; Kalita, P. Reducing postharvest losses during storage of grain crops to strengthen food security in developing countries. Foods 2017, 6, 8. [Google Scholar] [CrossRef] [Green Version]
  16. Aiping, M. Reducing the post-harvest loss of grain is equal to building an intangible fertile land in Chinese. Grain Sci. Technol. Econ. 2020, 45, 6–7. [Google Scholar]
  17. Chen, Z.; Wassgren, C.; Ambrose, K. A review of grain kernel damage: Mechanisms, modeling, and testing procedures. Trans. ASABE 2020, 63, 455–475. [Google Scholar] [CrossRef]
  18. Gao, L.; Xu, S.; Li, Z.; Cheng, S.; Yu, W.; Zhang, Y.; Li, D.; Wang, Y.; Wu, C. Main grain crop postharvest losses and its reducing potential in China. Trans. Chin. Soc. Agric. Eng. 2016, 32, 1–11. [Google Scholar] [CrossRef]
  19. Sasaki, T. Present situation and energy saving and environmental protection trend of paddy drying and storage technology in Japan. Grain Storage 2011, 40, 13–17. [Google Scholar]
  20. Wang, R.; Song, Y.; Fu, P. Present situation and development trend of rice storage technology and equipment in China. China Rice 2021, 27, 66–70. [Google Scholar] [CrossRef]
  21. Katta, Y.M.; Kamara, M.M.; Abd El–Aty, M.S.; Elgamal, W.H.; Soleiman, R.M.; Mousa, K.M.; Ueno, T. Effect of Storage Temperature on Storage Efficacy, Germination and Physical Characters of Some Paddy Rice Cultivars during Different Storage Periods. J. Fac. Agric. Kyushu Univ. 2019, 64, 61–69. [Google Scholar] [CrossRef]
  22. Sisi, C.; Qi, F. Research on nutrient loss and waste during rice over processing in China. Cereals Oils 2020, 33, 10–13. [Google Scholar]
  23. Jie, L. China’s food waste is staggering. Ecol. Econ. 2017, 33, 10–13. [Google Scholar]
  24. Yu, H.-Y.; Myoung, S.; Ahn, S. Recent Applications of Benchtop Nuclear Magnetic Resonance Spectroscopy. Magnetochemistry 2021, 7, 121. [Google Scholar] [CrossRef]
  25. Kirtil, E.; Oztop, M.H. 1H Nuclear magnetic resonance relaxometry and magnetic resonance imaging and applications in food science and processing. Food Eng. Rev. 2016, 8, 1–22. [Google Scholar] [CrossRef]
  26. Rongwen, L.; Wulan, B.; Xiaoliang, Q.; Yanling, B. Comparison of differences in paddy moisture determination methods. Grain Storage 2021, 50, 38–41. [Google Scholar] [CrossRef]
  27. Jie, Z. Comparison and Analysis of Methods for Determination of Rice Moisture. Mod. Food 2020, 26, 159–161. [Google Scholar] [CrossRef]
  28. Jianjun, Z.; Hong, L.; Xiaoping, J.; Chunyuan, L.; Qinglin, H.; Xiaoxia, Z. Effects of Direct-seeding Methods and Seeding Rate Combinations on Population Development and Yield Components of Rice. Chin. Agric. Sci. Bull. 2021, 37, 1–7. [Google Scholar]
  29. Houqing, L.; Tao, Z. The effect on the taste quality from the timely harvesting and drying process of rice. North Rice 2017, 47, 1–6. [Google Scholar] [CrossRef]
  30. DB22/T 3113-2020. 5T Post-Harvest Management Technique Code for High Quality Paddy; Jilin Market Supervision and Management Department: Jilin, China, 2020. [Google Scholar]
  31. Caiqin, Z.; Chi, Y. Simulation of plant growth and mathematical modeling Study. J. Inn. Mong. Univ. 2006, 37, 435–440. [Google Scholar]
  32. Miaonan, J. Mathematical pattern for the elongation growth of rice. J. Biomath. 1995, 10, 54–63. [Google Scholar]
  33. Linlin, J.; ALin, X. Rapid prediction of ricewater content and activity based on low field nuclear magnetic resonance technique. Food Mach. 2018, 34, 70–74, 95. [Google Scholar] [CrossRef]
  34. Yong, L.; Lei, Z.; Chunxiang, T. Research on multiple applications of low field nuclear magnetic resonance technology in food inspection. Guangdong Chem. Ind. 2020, 47, 140–142. [Google Scholar]
  35. Zhang, N.; Wu, W.; Wang, Y.; Li, S. Hazard Analysis of Traditional Post-Harvest Operation Methods and the Loss Reduction Effect Based on Five Time (5T) Management: The Case of Rice in Jilin Province, China. Agriculture 2021, 11, 877. [Google Scholar] [CrossRef]
  36. Hongzhang, Y.; Yunkang, S.; Yin, C.; Zhixin, Y.; Bichang, L. Accumulation and redistribuyion of dry matter in rice after flowering. J. Integr. Plant Biol. 1956, 5, 177–194. [Google Scholar]
  37. Hongzhang, Y. Allometric growth and economic yield in rice; Correlation between leaf-sheath ratio and ear weight. Acta Agron. Sin. 1964, 02, 1–14. [Google Scholar]
  38. Dingchun, Y.; Yan, Z.; Weixing, C.; Shaohua, W. A knowledge model for design of suitable dynamics of growth index in rice. Chin. Acad. Agric. Scicences 2005, 38, 38–44. [Google Scholar] [CrossRef]
  39. Xinyou, Y.; Changhan, Q. Studies on the rice growth calendar simulation model and it’s application. Acta Agron. Sin. 1994, 20, 339–346. [Google Scholar] [CrossRef]
  40. Hongzhang, Y. Physiological study on high yield of rice and wheat in Chinese. Plant Physiol. Commun. 1964, 13–22. [Google Scholar] [CrossRef]
  41. Statistical Bureau of Jilin. Statistical Bulletin on National Economic and Social Development of Jilin Province in 2020. Available online: http://tjj.jl.gov.cn/tjsj/tjgb/ndgb/202104/t20210415_8027371.html (accessed on 12 April 2021).
  42. Shiyu, L.; Dan, H.; Jinghan, Z.; Li, B. Causes and mitigation strategies of rice harvest and postnatal loss from the perspective of farmers: A survey from four major producing areas in Jilin Province. Henan Nongye 2020, 8–10. [Google Scholar] [CrossRef]
  43. Wenfu, W.; Na, Z.; Shuyao, L.; Yujia, W.; Wen, X.; Xianmei, M.; Hang, Z.; Jiangtao, Q.; Xiaoguang, Z.; Houqing, L. Construction and application exploration of 5T smart farm management systems. Trans. Chin. Soc. Agric. Eng. (Trans. CSAE) 2021, 37, 340–349. [Google Scholar] [CrossRef]
Figure 1. Experimental process.
Agriculture 12 00465 g001
Figure 2. The relationship between standard-moisture 1000-grain weight of rice and days after heading was tested in 2019.
Agriculture 12 00465 g002
Figure 3. Linear regression curve of the standard-moisture 1000-grain weight in 2020:(ar) means 18 rice varieties in 2020’s experiment, (a) Jijing 816; (b) Wuyoudao 4; (c) Longyang 16; (d) Songjing 29; (e) Longyang 7; (f) Fangyuan 77; (g) Jijing 561; (h) Longyang 13; (i) Zhongkefa 5; (j) Jinongda 667; (k) Wokeshou 1; (l) Tianlong 619; (m) Jijing 511; (n) DF 416; (o) Qinglin 611; (p) Daohuaxiang 9; (q) Zaoxiang 7; (r) Zhongke 804.
Agriculture 12 00465 g003aAgriculture 12 00465 g003b
Table 1. Standard-moisture 1000-grain weight models based on a standard 15% moisture content in 2019 and 2020.
YearVarietyRegression EquationR2pVarietyRegression EquationR2p
2019Jijing 816y = −0.0325x + 21.7040.7551<0.0001Jijing 528y = −0.0302x + 22.7590.7775<0.0001
Wuyoudao 4y = −0.0628x + 27.9730.7809<0.0001
2020Jijing 816y = −0.0372x + 22.3900.6850<0.0001Zhongke 804y = −0.0344x + 26.0350.6178<0.0001
Wuyoudao 4y = −0.0347x + 27.8650.7502<0.0001Jinongda 667y = −0.0295x + 21.6540.38050.0010
Longyang 16y = −0.0320x + 24.5020.6337<0.0001Wokeshou 1y = −0.0216x + 25.3580.33450.0010
Songjing 29y = −0.0182x + 24.2180.4218<0.0001Tianlong 619y = −0.0324x + 30.1830.6548<0.0001
Longyang 7y = −0.0274x + 25.0380.5872<0.0001Jijing 511y = −0.0273x + 21.8220.8062<0.0001
Fangyuan 77y = −0.0234x + 27.9970.26200.0054DF 416y = −0.0545x + 30.1210.8323<0.0001
Jijing 561y = −0.0370x + 25.7280.9489<0.0001Qinglin 611y = −0.0317x + 25.0200.6190<0.0001
Longyang 13y = −0.0333x + 25.5800.7035<0.0001Daohuaxiang 9y = −0.0133x + 25.0840.34480.0013
Zhongkefa 5y = −0.0595x + 29.7080.39840.0155Zaoxiang 7y = −0.0371x + 27.3370.6381<0.0001
Table 2. Latent loss weight and dry matter loss rate based on a standard 15% moisture content.
YearVarietyDays after Heading (days)
7075
Loss Weight/gLoss Rate/%Loss Weight/gLoss Rate/%
2019Jijing 8161.00754.92991.17005.7251
Jijing 5280.93624.33801.08725.0377
Wuyoudao 41.82127.17062.13528.4069
2020Longyang 160.73603.20030.89603.8960
Songjing 290.52782.24870.61882.6364
Jijing 5110.92824.45411.06475.1091
Zhongke 8040.72242.96680.89443.6732
Jijing 8160.89284.31741.07885.2168
Wokeshou 10.47521.95390.58322.3979
Qinglin 6111.01444.25941.17294.9250
Longyang 70.63022.65350.76723.2303
Jijing 5610.18500.79320.37001.5864
Longyang 131.06564.38261.23215.0673
Zhongkefa 50.17850.69400.47601.8506
Fangyuan 770.53822.00100.65522.4359
Wuyoudao 40.97163.67921.14514.3363
Tianlong 6191.13403.90371.29604.4614
DF 4161.47155.29751.74406.2785
Jinongda 6670.50152.49620.64903.2304
Zaoxiang 70.40811.62280.59362.3604
Daohuaxiang 90.15960.65640.22610.9300
Table 3. Optimal harvest days of rice and the number of days after heading in 2019 and 2020.
YearVarietyOptimal Harvest DayDays after HeadingVarietyOptimal Harvest DayDays after HeadingVarietyOptimal Harvest DayDays after Heading
2019Jijing 81611 Sept.39Jijing 52814 Sept.39Wuyoudao 415 Sept.41
2020Longyang 1614 Sept.47Qinglin 6116 Sept.38Wuyoudao 413 Sept.42
Songjing 295 Sept.41Longyang 714 Sept.47Tianlong 61912 Sept.35
Jijing 5115 Sept.36Jijing 56129 Sept.65DF 41612 Sept.43
Zhongke 80414 Sept.49Longyang 135 Sept.38Jinongda 66721 Sept.53
Jijing 81612 Sept.46Zhongkefa 53 Oct.67Zaoxiang 719 Sept.59
Wokeshou 115 Sept.48Fangyuan 7712 Sept.44Daohuaxiang 919 Sept.58
Table 4. Average dry matter loss weight and loss rate of 18 different varieties of paddies in 2020.
VarietyRound GrainedLong GrainedMedium MaturingLate MaturingAverage
Days after heading (days)70757075707570757075
Average loss weight (g)0.83420.99140.65740.82130.53180.68690.86161.03120.69670.8591
Average loss rate (%)3.88184.62032.57533.22432.23842.88203.49284.18712.86563.5346
Publisher’s Note: MDPI stays neutral with regard to jurisdictional claims in published maps and institutional affiliations.

