Article

Optimizing the In-Vessel Composting Process of Sugarbeet Dry-Cleaning Residue

1
Agricultural Engineering Department, Faculty of Agriculture, Kafrelsheikh University, Kafrelsheikh 33516, Egypt
2
Community College at Muhyle, King Khalid University, Abha 62587, Saudi Arabia
3
Agriculture Economic Department, Faculty of Agriculture, Tanta University, Tanta 31527, Egypt
4
Microbiological Research Department, Solis, Water & Environment Research Institute (SWERI), Agriculture Research Center (ARC), Giza 12112, Egypt
5
Agricultural Engineering Department, Faculty of Agriculture, Tanta University, Tanta 31527, Egypt
6
Agricultural Engineering, Evaluation of Natural Resources Department, Environmental Studies and Research Institute, University of Sadat City, Minufiya 32897, Egypt
*
Author to whom correspondence should be addressed.
Agriculture 2022, 12(3), 427; https://doi.org/10.3390/agriculture12030427
Submission received: 30 January 2022 / Revised: 10 March 2022 / Accepted: 15 March 2022 / Published: 18 March 2022

Abstract

:
Rapid urbanization and industrialization around the world have created massive amounts of organic residues, which have been prioritized for conversion into valuable resources through the composting process to keep their harmful effect at a minimum. This research aimed to assess the influence of active and passive aeration on composting mass of sugar beet residues in the case of using additives (e.g., charcoal only or manure only or combination). Some physicochemical properties of composting mass were analyzed on certain days of composting. Some parameters including temperature–time profile, carbon to nitrogen ratio (C/N ratio), moisture content, electrical conductivity, pH, germination and microbial population enumeration of compost were measured. Cress germination test was conducted for each medium of germination which contains a mixture of soil and compost (at a ratio of 3:1) taken from each treatment. The results showed that temperature–time profile data of composting mass showed an irregularity. Forcedly aerated composting mass did not demonstrate a thermophilic phase while passively aerated ones did not show a mesophilic phase. Carbon to nitrogen (C/N) ratio reduction was greater in most forcedly aerated composting mass than passively aerated on days from 1 to 33 of composting period. The results further showed that electrical conductivity decreased at the end of the composting period where it ranged from 2.55 to 3.1 dS/m. Germination medium containing forcedly aerated compost treated with a combination of charcoal and manure achieved the highest germination index which was higher than the control sample by 58.63% followed by forcedly aerated composting mass treated by charcoal only which exceeded the control sample by 5.35%. Strong correlation coefficient (r > 0.80) for the relationship between germination index and number of bacteria was obtained on day 17th of composting period.

1. Introduction

The increasing amount of organic waste (e.g., agricultural residues) is considered one of the most challenging environmental problems, particularly in developing countries such as Egypt [1,2,3]. Environmental problems comprised of air pollution, fire hazard, and water pollution are elevating as a result of inefficient management of solid wastes [4,5]. The main obstacles of optimum solid waste management include overpopulation in developing countries, lack of fund, urbanization and improper solid waste management strategies [6,7]. There are several methods of dealing with solid wastes such as landfill, firing and pyrolysis [8,9]. Although these methods are somehow efficient, they cause many environmental and health problems as the later restricting carbon in a nondegradable form and thus preventing its release into the atmosphere as greenhouse gases. In this regard, composting can be a reliable way to convert solid wastes into useful materials such as biofertilizers. It is a biological process that aims to convert organic materials of solid wastes to useful products and byproducts. The advantages of composting when properly managed are slightly low air and water pollution, low input costs and therefore high total return [10,11,12,13].
Sugar beet crop is cultivated at a large scale in Egypt in the winter season [14,15]. The amount of sugar beet residues produced by sugar factories is enormous, and they must be converted into biofertilizers or another valuable organic product. At the beginning of sugar beet processing, the product goes through a dry-cleaning (dry-screening) station, at which loose soil, sand, small stones, beet tops and leaves can be removed from the beets, and some undesired materials such as large stones and weeds are excluded from the separation at this stage [16]. The possibility of benefiting from one of the wastes of an Egyptian sugar beet factory’s residues is being investigated in this study. After topping or pinching the beet tops from roots, the two processes of dry-cleaning and peeling produce a residue that is a mixture of soil stuck to the beets and the peels, which can be used to make compost. In Egypt, sugar beet is cultivated and processed, as the total harvested area was of 207,527 hectares in 2019 [17], and it is the largest source of sugar production in Egypt (averaging 1.25 million Mg of sugar production annually since 2013, versus cane sugar’s 1.0 million Mg). Egypt has seven beet factories; five of which are mostly held by the government (Noubaria, Delta, Dakahlia, Fayoum and Abu Kerkas) and two of which are privately owned (Alexandria sugar and Nile sugar) [18]. To mitigate any environmental problems, the huge amount of produced waste must be recycled. Several residues and byproducts of sugar beet processing were previously assessed to investigate the possibility of converting them into useful materials [14,15,16]. In a previous study, it was revealed that drying sugar beet tops for haymaking is a potential process to benefit from [19], and the usefulness of sugar beet factory byproducts (e.g., lime, vinasse, compost mixed with vinasse) and press mud (filter cake) application on sandy soil properties and productivity of some crops were proven [20,21,22]. Vinasse is a liquid byproduct of the fermentation and distillation of molasses liquid. Composting of Dry-cleaning Station Residues (DSR) of an Egyptian sugar beet industry was conducted in this research using the FAO in-vessel composting technique [23] identification after [24], except for turning, where no agitation was done and plastic barrels were used for composting process as previously recommended by [25,26,27]. There was an intervention in six process factors among these reported by Dalzell et al. [28], which include aeration, nutrients, additives, moisture and temperature to explore some physicochemical characteristics of composting mass. Earlier studies were conducted before applying aeration methodology during composting process [29,30,31,32,33,34,35]. Concerning additives, an informative review published by Barthod et al. [36] investigated the effects of additives on composting process and listed several kinds of additives. Although, DSR contains soil stuck to the beets and may contain bentonite clay mineral which is considered itself as an additive. Some farms in Wadi El-Natroun region, El-Alamein Road, Egypt, add DSR to the soil to enhance its properties. Adding organic wastes to the soil having inadequate range of C/N ratio could cause problems to the plants, or it may slightly affect the soil structure. Micro-organisms will be deprived of nitrogen that are essential for oxidizing excess nitrogen and consequently will compete with plants to consume soil-soluble nitrogen. Therefore, through composting process of DSR, this research presents some parameters and variables during in-vessel composting of a static composting mass under passive and forced aeration. Aeration mainly helps to keep the appropriate conditions compost viz., CO2/O2 levels, temperature, Ph, moisture content necessary for ideal thermophilic micro-organisms growth. To the best our knowledge, very little attention has been given to produce compost as a source of biofertilizers from sugar beet residues. The massive amount of sugar beet residue would be useful when converted to compost rich in essential elements for soil fertility and resolving the problem of high cost of fertilization indirectly. This research was based on the hypothesis that compost quality can be improved through choosing the proper aeration method, additives and moistening. Thus, the main aim of the current investigation was to determine the optimal composting process for sugar beet dry cleaning station residues, which can be achieved through the following objectives: (i) assess the effect of additives type (charcoal and manure) on compost quality; (ii) assess the effect of aeration method and frequency on compost quality; and (iii) assess the effect of moistening frequency on compost quality.

2. Materials and Methods

2.1. Experimentation

Dry-cleaning Station Residues (DSR) were collected from Nobaria Sugar and Refining Company (El Behira Province, Egypt) in August 2019; it was a mixture of soil stuck to the beets and the beet peels, and samples were collected earlier from a waste pile at the end of June 2019. These residues were kept and delivered in sacks to the composting location and then distributed on a concrete surface for a certain period of time to dry naturally. The experiment was conducted to produce compost from DSR in El Garhi Village, Beyala, Kafr Elsheikh Province, Egypt starting from 2 December 2019 on a house roof consisted of one floor and the experiment lasted for fifty days (composting period). As shown in Figure 1, eight barrels were used for composting. The barrels were covered with thermal insulating material brought from the Glass Rock Thermal Insulation Factory based in El-Sadat City, El-Menoufia Province, Egypt, then the drums were covered with aluminum foil and the barrels were placed on wooden beams of 15 cm height from the roof. The manure (cow dung) required for making compost was brought from a barn located in the same village nearby composting process location. Basically, two main types of aeration methods have been performed, which were passive aeration with barrels from 5 to 8 and second type forced aeration using an air compressor with barrels from 1 to 4.

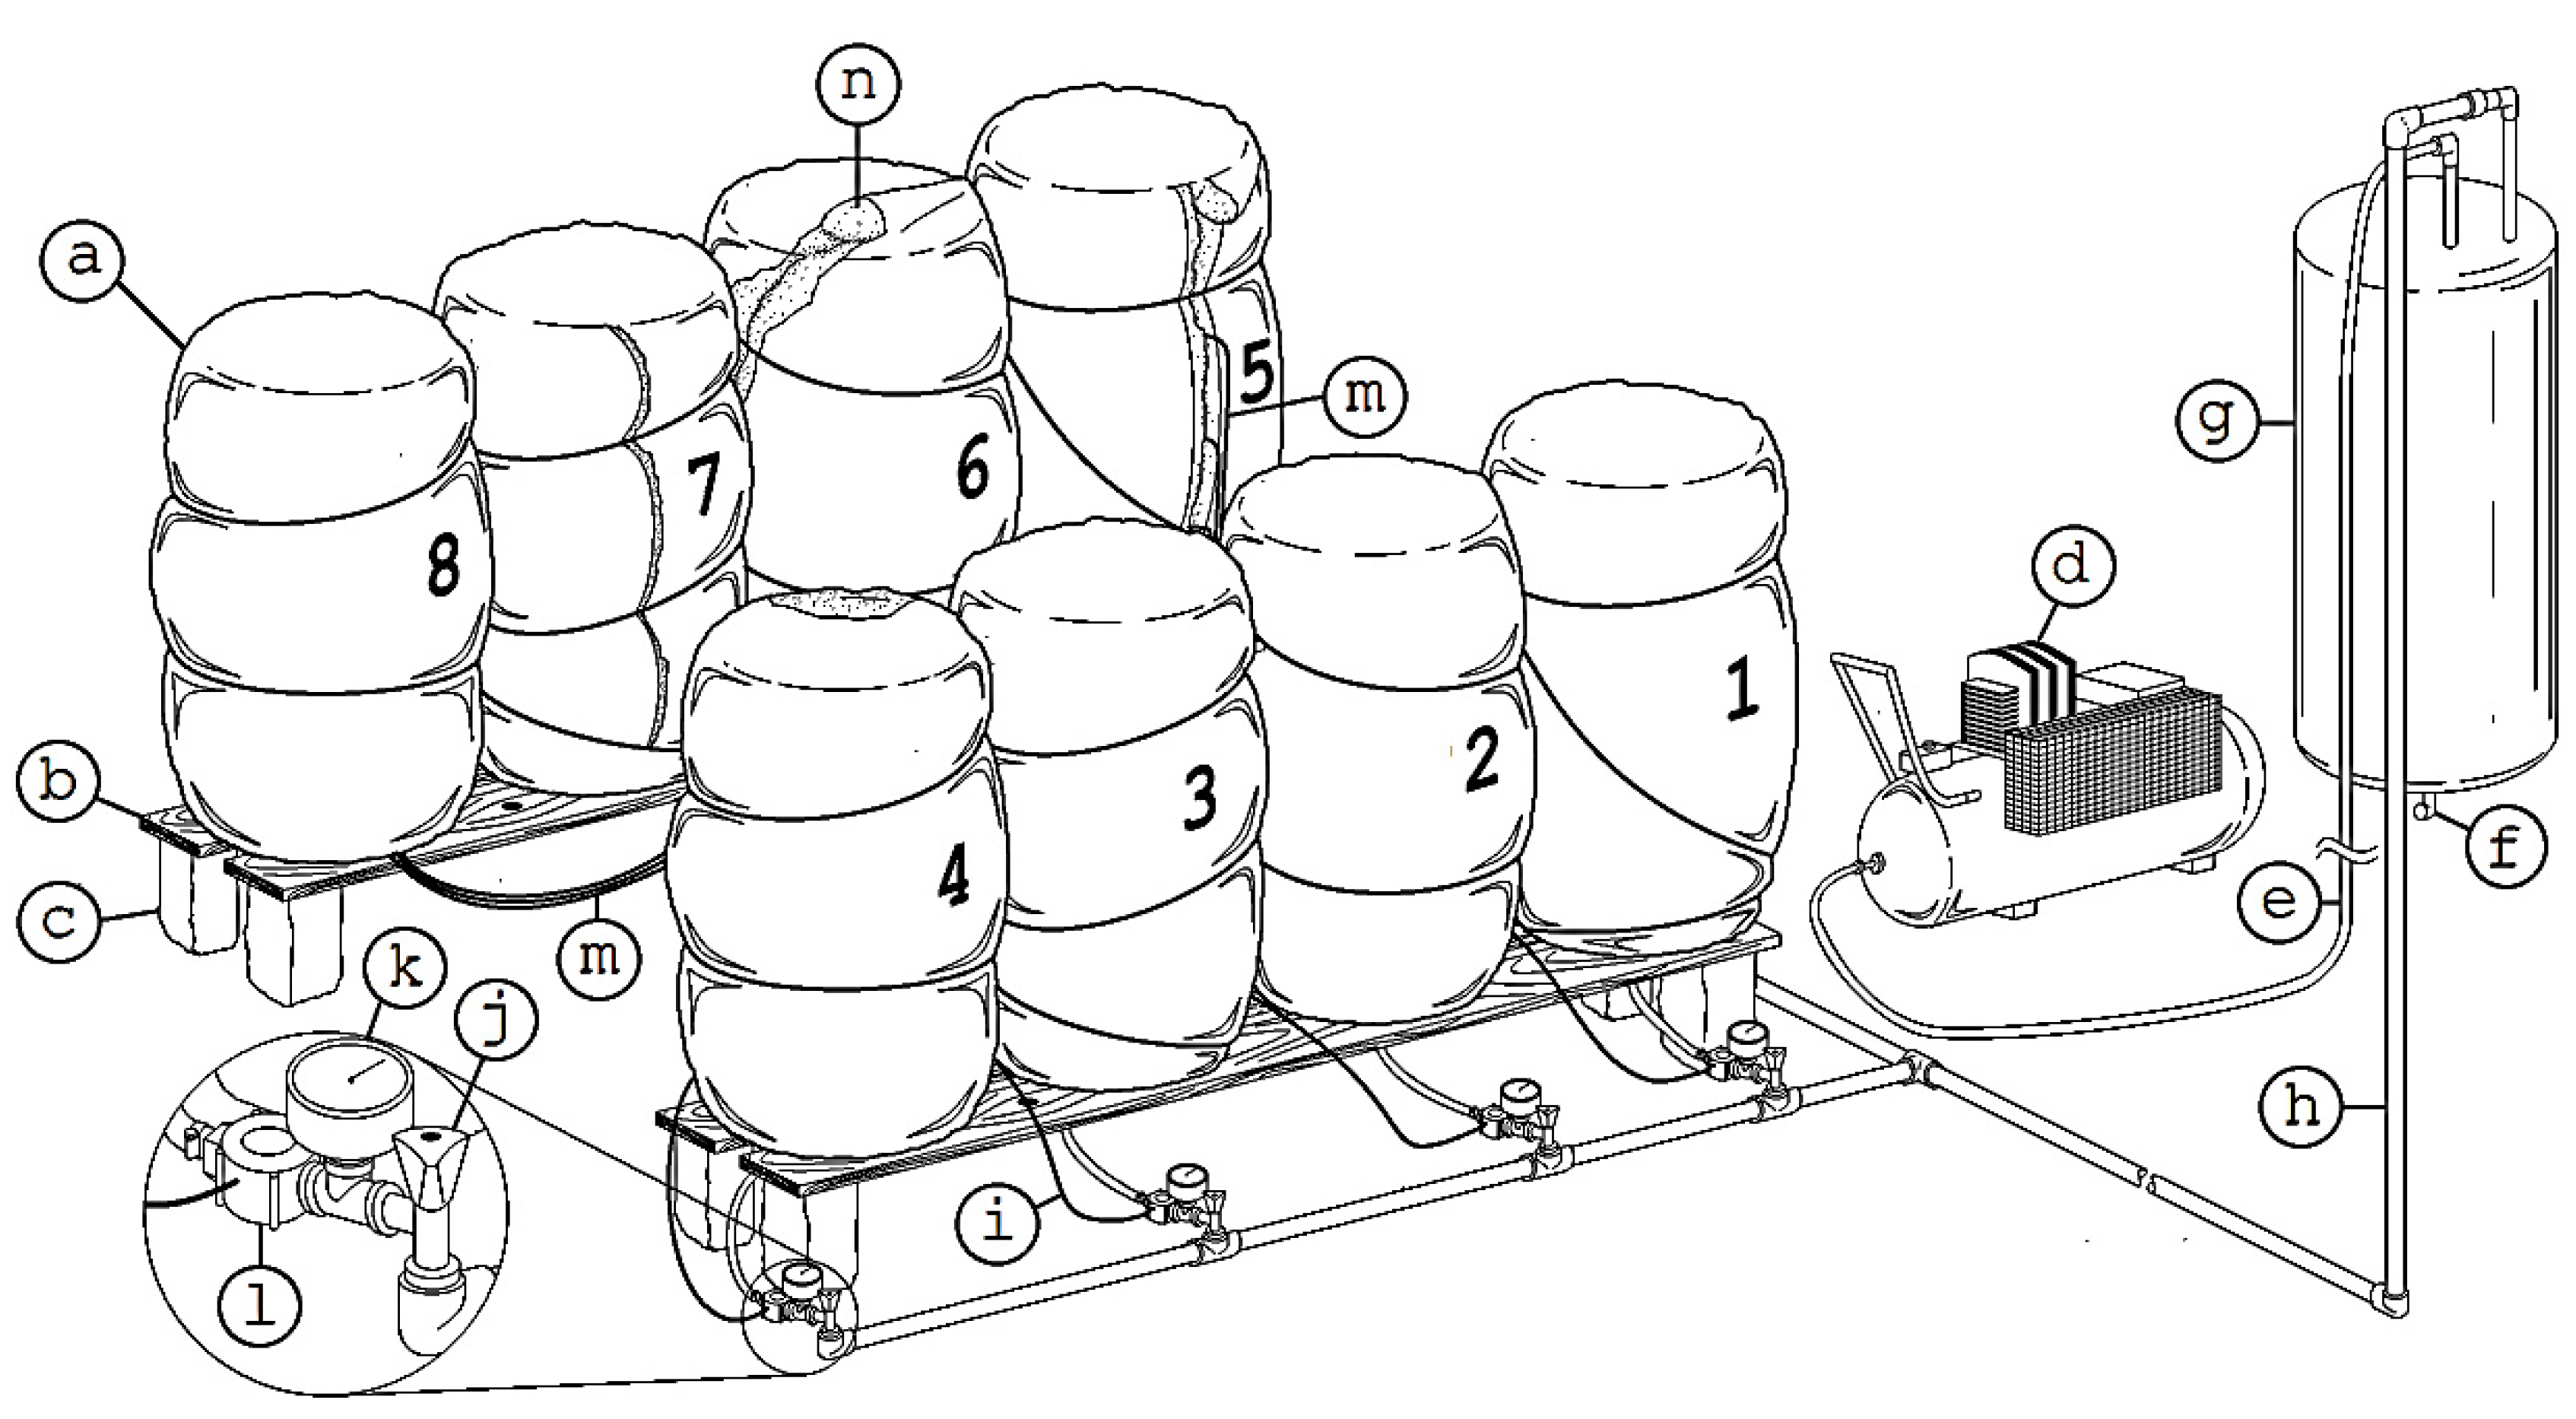
2.2. Installation and Operation Procedures

Prior to installation, optimum hole diameter that is required to distribute air and water vapor mixture spray in a proper way which was needed in forced aerated barrels for aeration and moistening was identified. In the passively aerated barrels, if there is a need for moistening, it was found that the optimum diameter of holes was 4 mm which is the smallest among the tested diameters. The spray covered a larger area and the holes were made at three levels with 15 cm spacing vertically and orientation axis of each two opposite holes staggered in one level from the next by a circular arc of 2.5 cm long on the circumference of the tube, as shown in Figure 2. There was also another hole at the bottom of each barrel for draining water. Several attempts were performed to find the optimum water level inside the water heating vessel which allows no water to enter the barrels during operating compressor. It was identified at 20 cm of the side length of the vessel which is 60 cm long as depicted in Figure 3 and it was determined using a transparent hose connected to the vessel to know the water level inside it. Before operating, to ensure that the water was at the required level, the ball valve that shown in Figure 4 must be opened to evacuate the vessel from any pressure higher than the ambient atmospheric pressure, then water would be added in the vessel until it reaches the required level that is marked on the transparent hose. Afterwards the system is operated until the pipes become warm as a sign that air and water vapor mixture is ready for moistening and aeration, then the ball valve (Figure 4) would be closed and the valves shown in Figure 1 would be opened.

2.3. Experimental Design

In this research study, there were two main types of composting mass aeration: passive and forced aeration. The composting mass in each barrel was subjected to eight different treatments as listed in Table 1, wherein each barrel 60 kg (loose filling) of composting mass was prepared and in the case of using an additive (charcoal). The materials for composting were taken from a pile at the end of June 2019 and kept on the house roof for natural drying until the beginning of the experimental work on 2 December 2019. To achieve some kind of homogeneity, the 60 kg composting mass was divided into six amounts of 10 kg each which contains 0.5 kg of either charcoal or manure and 9.5 kg of DSR that was mixed thoroughly and likewise in the case of using cow dung. There was an intervention to reduce the C/N ratio on the 1st day of composting period before operating the system and after mixing additives with DSR in case of barrels which were experimentally designed to contain either charcoal or manure. Urea as a source of nitrogen was added after calculating the adequate amount to reduce C/N ratio from 120 to 28 in each composting mass of each barrel. DSR contained 12% total organic matter and 0.1% total nitrogen; hence, to reduce C/N ratio to 28, DSR total nitrogen should be raised from 0.1 to 0.42%. Therefore, the difference which is 0.32% (0.192 kg N/barrel) must be added to the composting mass using urea 46% (0.46 kg N/kg urea); subsequently, the weight of urea supplying 0.192 kg N is 0.417 kg urea to each barrel. The required amount of urea was diluted in water and divided into six installments, from which everyone was added to each 10 kg of composting mass for homogeneity. The C/N ratio was determined according to FCQAO and BGK, 2003. Four factors were chosen among the relationship between tested factors and responses. The first factor is aeration method; although it is considered a qualitative factor, it was represented as a quantitative factor because it has two levels where the low level whose value is 0 represents the passive aeration while the high level whose value is 1 represents forced aeration. The other factors and response are listed in Table 1B. Concerning accumulative C/N reduction percentage as a response variable, a fully randomized multilevel factorial design comprised of twenty-four runs was created and it is to be run in a single block. It consisted of thirty-two runs for each of physicochemical properties of composting mass as response and including moisture content, pH, electrical conductivity, temperature uniformity coefficient and difference between maximum and ambient temperature. The modeling was conducted for the period until day 33 so that variation intervals were equal. The previous statistical procedures were performed using STATGRAPHICS Centurion XVI software, Version 16.0.03, Evaluation edition, StatPoint Technologies, Inc. The chemical composition of citrus wood charcoal is listed in Table 1C where the charcoal which brought from a local charcoal kiln using pyrolysis for production of charcoal for different purposes was of orange tree wood.

2.4. Aeration and Moistening

Concerning forced aerated barrels (No. 1–4), an air compressor (Model: AH2055) powered by 3 hp electric motor was used where pressure was adjusted at 2.068 bar (30 lb/in2). A locally manufactured water heating vessel was also used. Forced aeration of composting mass was in parallel with moistening via forcing air and water vapor mixture produced by heating water into barrels using two electric heating units as depicted in Figure 3 which was set at 100 °C, and then this water vapor would be used to moisten the inlet air which was distributed into barrels using a pipe that was equipped with water valves, manometers and water flow sensors allocated to each barrel as illustrated in Figure 1, so air and water vapor mixture would move through the valve into the manometer and flow meter to a hose and then to the 1.27 cm internal diameter perforated tube that was described earlier in the procedures section. Forced aeration and moistening was performed four times a day (every six hours). In passively aerated barrels (No. 5–8) the manual piping of air and water vapor mixture outlet is seen in Figure 4. If there is a need for moistening by evaluating subjectively on a sample of composting mass removed and by squeezing on it, the sample should be consistent. When pressing on a sample with fingers, it should loosen, and thus there is no need for moistening. Moistening was conducted every three days for 15 min by opening the valve depicted in Figure 4 for a while until the tube become warm as an indicator of air and water vapor mixture existence and then each hose of barrels (No. 5–8) piped to air and water vapor mixture outlet for a 15 min duration for each barrel consequently. It happened once in a rainy day that the cover of passively aerated barrels was revealed and there was no need for moistening because of rain, so all barrels were supported by a burlap sack cover and then covered by plastic sacks. Aeration and moistening were stopped on the 45th day of composting process.

2.5. Instrumentation and Measurements

To study the temperature profile during composting duration in different barrels, temperature readings were measured at three levels: lower, middle and upper level whose heights from the bottom of barrel were 12.5, 25 and 37.5 cm, respectively, as illustrated in Figure 2. Digital sensors (Model: DS18B20) were used for measuring temperature through a 7 mm diameter hole which was adjusted at the required level. As depicted in Figure 3, the sensors No. (1–8), (9–16) and (17–24) measured temperature inside composting barrels at upper, middle and lower levels, respectively, while sensors No. 25–28 which were installed next to the box that contains a Data Acquisition Card (DAQ) measured ambient temperature. Readings were recorded every five minutes to the DAQ memory. It was not necessary that the three sensors at various levels in each barrel take the reading at the same time. A water flow sensor (Model: YF-S201) was also connected to each forcedly aerated barrel. Temperature uniformity coefficient among the three temperature digital sensors was calculated as percentages in every day of composting period using the following equation according to Wu et al. [37] and Saxena et al. [38]:
Coefficient of uniformity % = 100 (1 − CV)
where CV is the coefficient of variation expressed in decimal, as the standard deviation divided by mean value of temperature.

2.6. Laboratory Analysis

Final products of composting process samples were analyzed at The Central Laboratory of Environmental Studies, Kafrelsheikh University, Egypt in March 2020, while DSR samples were analyzed in October 2019 before composting process. A compost sample was taken weekly from the middle of each barrel for analysis to identify carbon to nitrogen ratio, moisture content, electrical conductivity, pH and microbial population. Microbial enumeration was done for bacteria, actinomycetes and fungi for each composting mass on the 9th, 17th and 50th day of composting. The enumeration was expressed as the logarithm of colony-forming unit per gram (log CFU/g).

2.7. Cress Germination Test

The final product, compost, was tested through seeds germination test of a medium that contains a mixture of soil and compost. Cress seeds were used for germination test [39] where in the summer of 2021, nine revealed boxes were used for the test. At the same roof where the experiment was undertaken, one box was used for the control sample and the other eight boxes contained a germination medium (a mixture of soil and compost: 3:1). Where the compost remained from the experiment was used for the test, each box contained a hundred cress seeds where the germination data of the 10th day old test were logged. Germination parameters including germination index (GI, dimensionless), final germination percentage (FGP%), mean germination time (MGT, day), first day of germination (FDG, day), last day of germination (LDG, day), coefficient of velocity of germination (CVG, dimensionless), time spread of germination (TSG, day) and germination rate index (GRI%/day) were calculated for each medium according to Kader [40].

2.8. Statistical Analyses

To test the impacts of active and passive aeration, coal manure and moistening procedures on C/N, EC, PH, MC and GI of final compost, the analysis of variance (ANOVA), appropriate for randomized multilevel factorial design, was used with three replicates for each parameter. To compare the differences between the mean values of the C/N, EC, PH, MC and GI between the treatments, Duncan’s test at a p ≤ 0.01 and 0.05 significance level was applied.

3. Results and Discussion

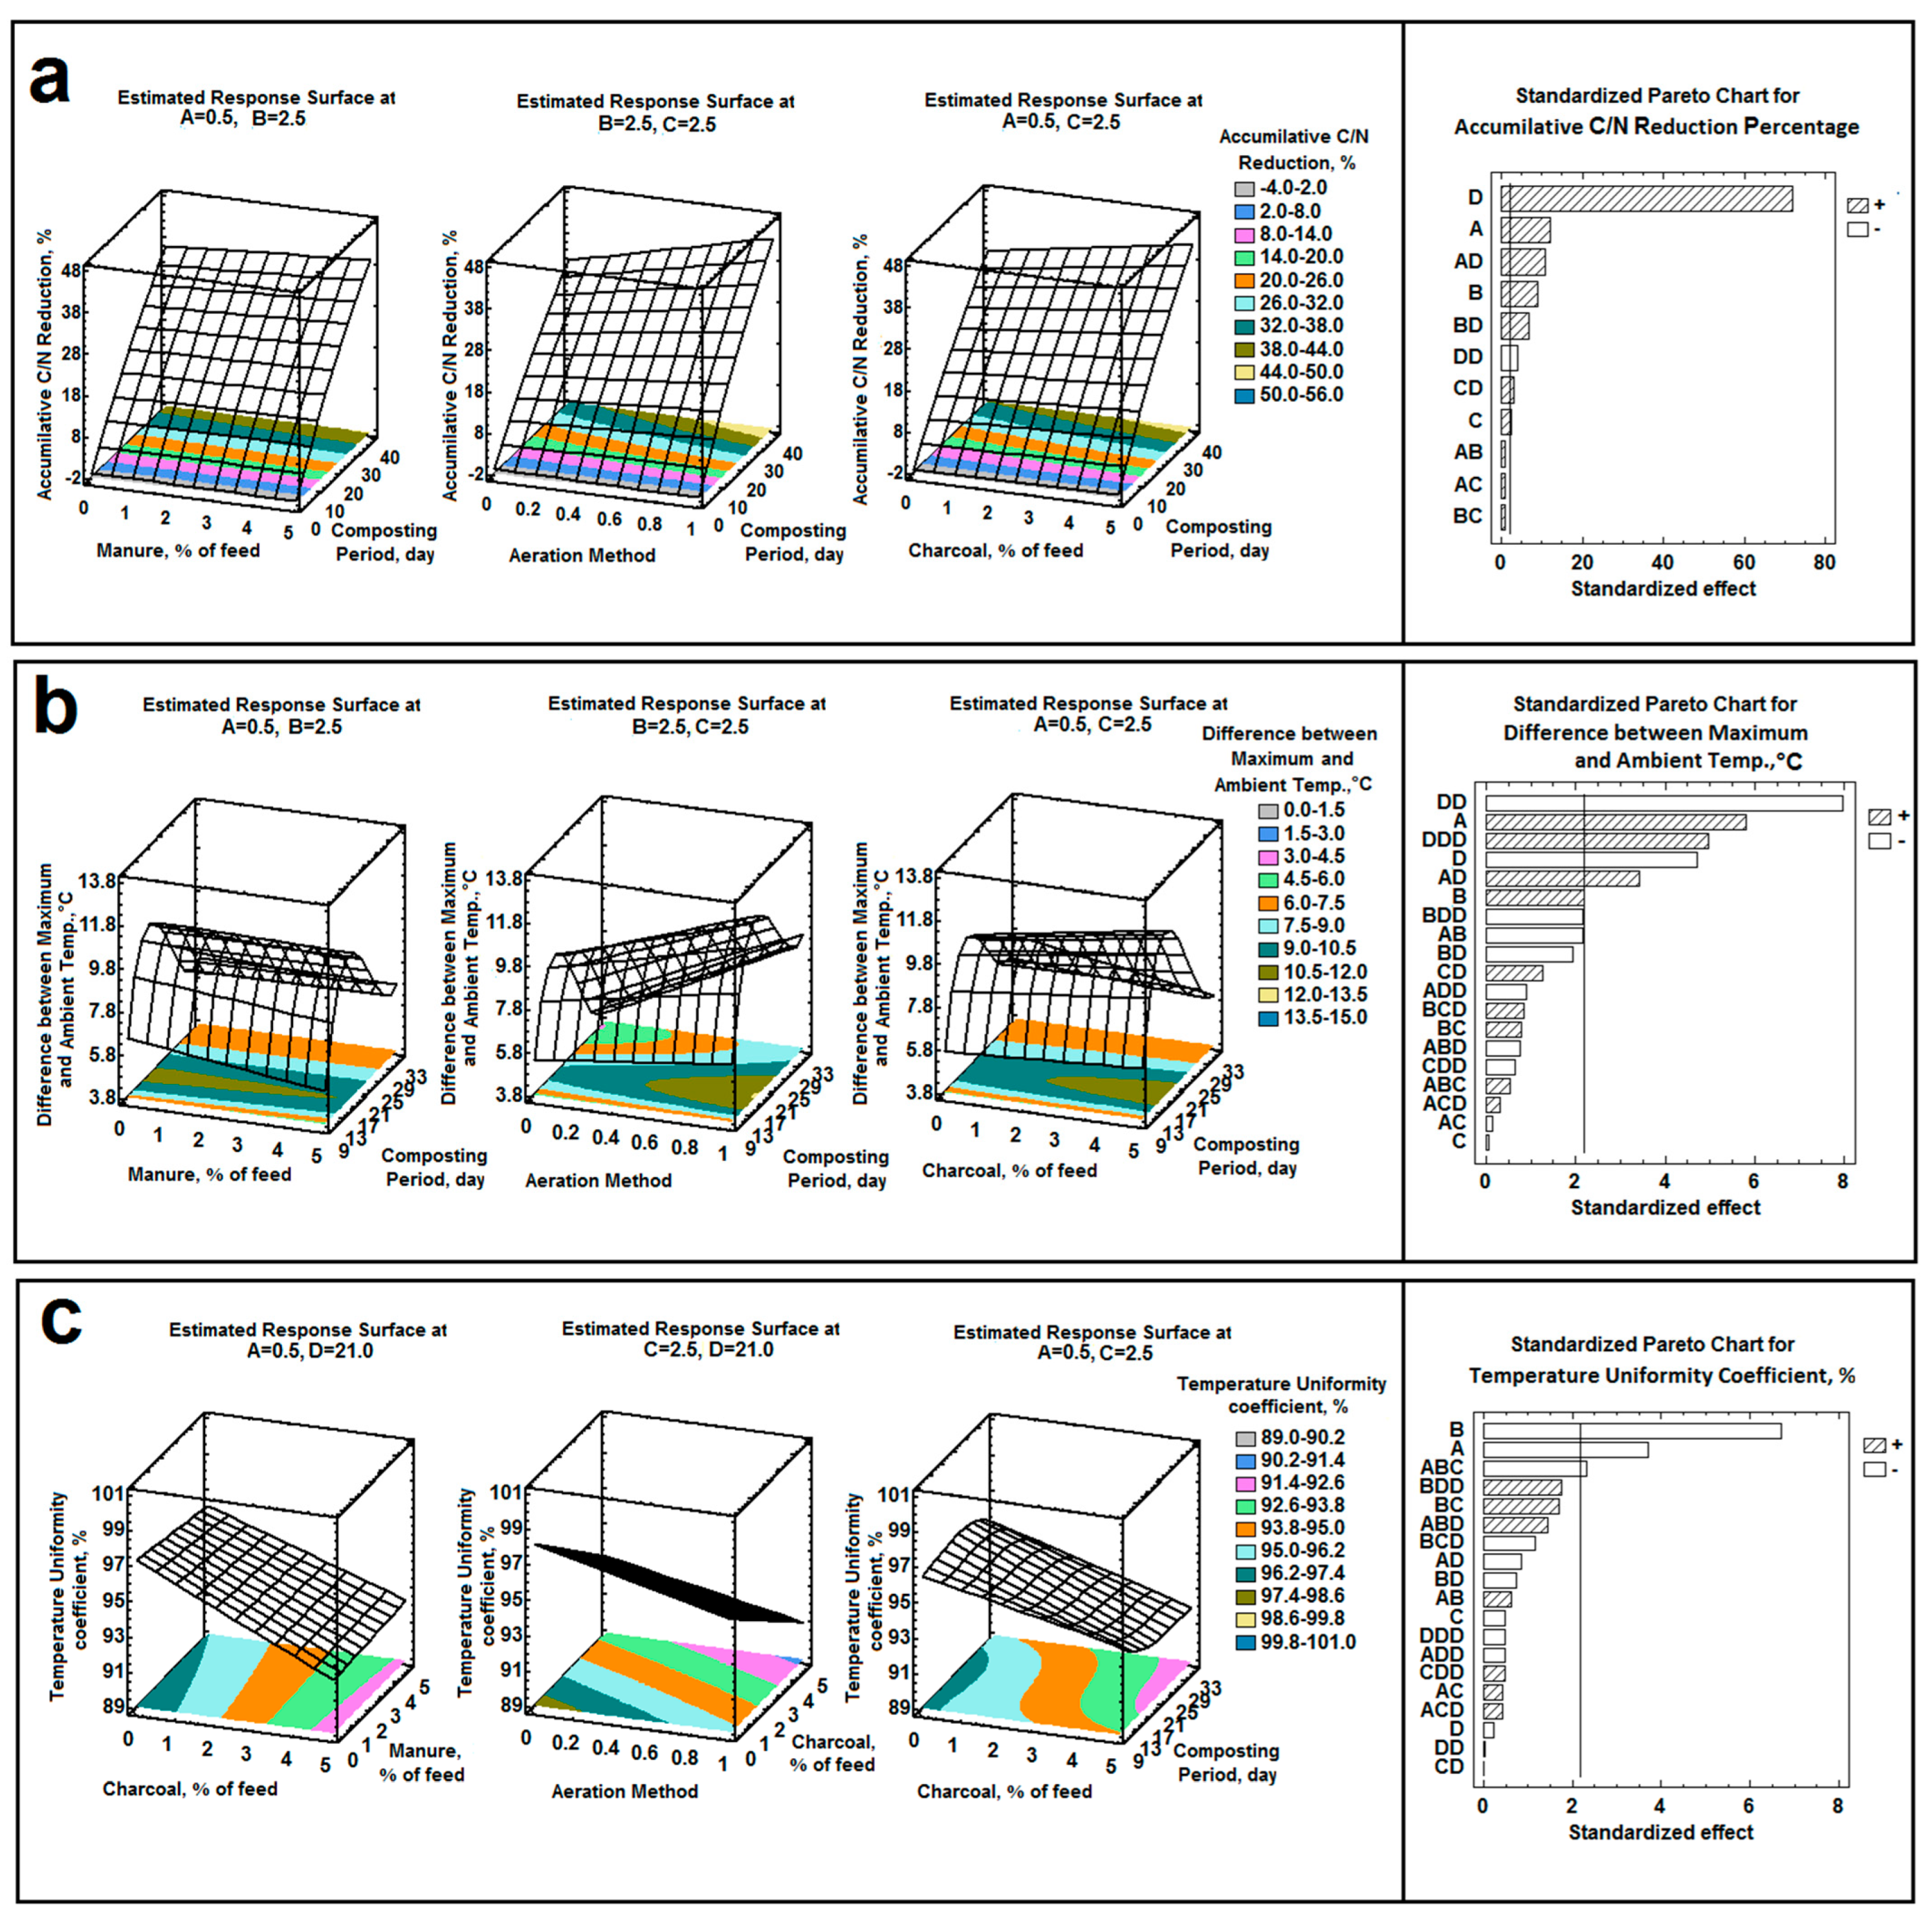
3.1. Temperature–Time Profile

Because compost window temperature is connected to the pace of decomposition and microbial activity during composting, temperature monitoring is generally acknowledged as a useful indicator for determining the degree of composting success and compost stability [41,42,43,44,45]. A fifty-day-duration experiment was conducted in December 2019 to produce compost from Dry-cleaning Station Residues (DSR). The results of temperature readings during composting period are illustrated in Figure 5, showing the recorded temperature at upper, middle and lower levels of each barrel and also ambient air temperature. It is obvious from temperature–time pattern that there was an irregularity which is inconsistent with temperature ranges reported by Mohee [46]. It was also obvious that composting mass in forced aerated barrels did not show a thermophilic phase (>45 °C); the composting process ended around mesophilic range (25–45 °C) where the maximum temperature was measured at 31.61, 30.33, 29.76 and 29.72 °C in barrels No. 1–4, respectively. These highest values were recorded on the 21st, 14th, 21st, and 21st day of composting, respectively. While composting mass in passively aerated barrels did not show a mesophilic phase, the composting process ended around the psychrophilic range (<25 °C) where the maximum temperatures measured either in upper, middle or lower level was 22.90, 24.37, 22.89 and 23.58 °C in barrels No. 5–8, respectively, that were recorded on the 21st, 8th, 21st, 21st day of composting. Concerning the difference in temperatures between the parts of a single vessel, it could be due not only to differing microbial activity but also to the degree of insulation achieved at each point. The point at the core, for example, retains the temperature of microbial activity compared to the temperature at the periphery. A point close to the surface will lose heat quickly compared to the bottom. The reason the temperature did not rise to the level appropriate for the growth and dominance of thermophilic bacteria could be due to the small amount of the residue present in each transaction. There is also the nature of the residue which is largely made up of soil, but the breakdown of cellulose is not just a matter of thermophilic microbes, fungi and other bacteria that break down cellulose as well.
At the beginning of warming up of passively aerated composting mass, the maximum measured temperature exceeded 20 °C earlier than forcedly aerated one in general, and that was on the 7th, 4th, 9th and 5th day of composting for barrels No. 5–8, respectively, while that was on the 9th, 9th, 9th and 7th day for barrels No. 1–4, respectively. Temperature fall began earlier in passively aerated composting mass than forcedly aerated one where it was on the 23rd, 24th, 23rd and 23rd day for barrels No. 5–8, respectively, while that was on the 38th, 30th, 29th and 32nd day for barrels No. 1–4, repectively. In passively aerated composting mass and after warming up to a maximum measured temperature of 20 °C, there was a decrease in temperature below 20 °C (Figure 5E–H), in case of barrel No. 5 on days from 12th to 16th; barrel No. 6 on the 12th day; barrel No. 7 in the days from 11th to 14th; and barrel No. 8 in the days from 12th to 14th of composting. Due to irregularity in temperature–time curve (Figure 5A–D) and according to maximum measured temperature, mesophilic phase I was in barrels No. 1–4 on days from 11th to 16th; from 12th to 16th; from 13th to 16th; and on 12th day, respectively, where the first exceeding 25 °C was barrel No. 4 on the 12th day of composting only. Mesophilic phase II was found on days from 19th to 31st; 19th to 22nd; 19th to 24th and 18th to 23rd, respectively, while mesophilic phase III was found in barrels No. 2 and 3 on days from 27th to 30th, respectively. Insam and de Bertoli [47], Mehta et al. [48] found that finally, during the mesophilic phase or maturation, temperature slowly decreases due to reduced microbial activity resulting from a decrease of biodegradable compounds. Composting involves a succession of microbial communities.
Average of temperature uniformity coefficients in passively aerated composting mass was higher than forcedly aerated one. In general, except for barrel No. 6, the highest one was in barrel No. 5 and the lowest one was in barrel No. 3 (Figure 5I). Temperature uniformity coefficient indicates uniformity of measured temperature from the lower, middle and upper-level sensors, and higher value does not mean a good composting.

3.2. Carbon to Nitrogen Ratio (C/N Ratio)

At the beginning of the experiment, the C/N ratio of composting mass in each barrel was unified to 28 on the 1st day of composting by adding a calculated amount of urea in each barrel. The ratio was also analyzed on the 17th, 33rd and 50th day of composting period. The results are depicted in Figure 6A. The results demonstrated that among all barrels, the decrease in C/N ratio of composting mass was the fastest on days from 1 to 33 in barrels No. 3 and 4. In barrel No. 3, the decrease continued with the same rate during the period from day 17 to 33, with the fastest values followed by barrel No. 4 until they both met at the same ratio of C/N in barrel No. 2 on day 50 of composting, Table 2. In the period from day 33 to 50, the other barrels were relatively faster than barrels No. 3 and 4; the fastest decrease was in barrel No. 5 where it decreased until it met at the same ratio in barrels No. 3 and 4. In general, in the duration from day 1 to 33, the C/N ratio decrease was higher in most of forcedly aerated composting mass than passively aerated ones except for barrels No. 1 and 8 where it was equal. Bernai et al. [49] reported that the C/N ratio, which is normally used as an indicator of compost stability, should decrease as composting progresses. The decrease in the C:N ratio was caused by the loss of TC in the form of carbon dioxide, while higher percentage of TN was caused by the strong biological oxidation of organic matter throughout the composting phase [50] and the contribution of nitrogen-fixing bacteria [51,52].

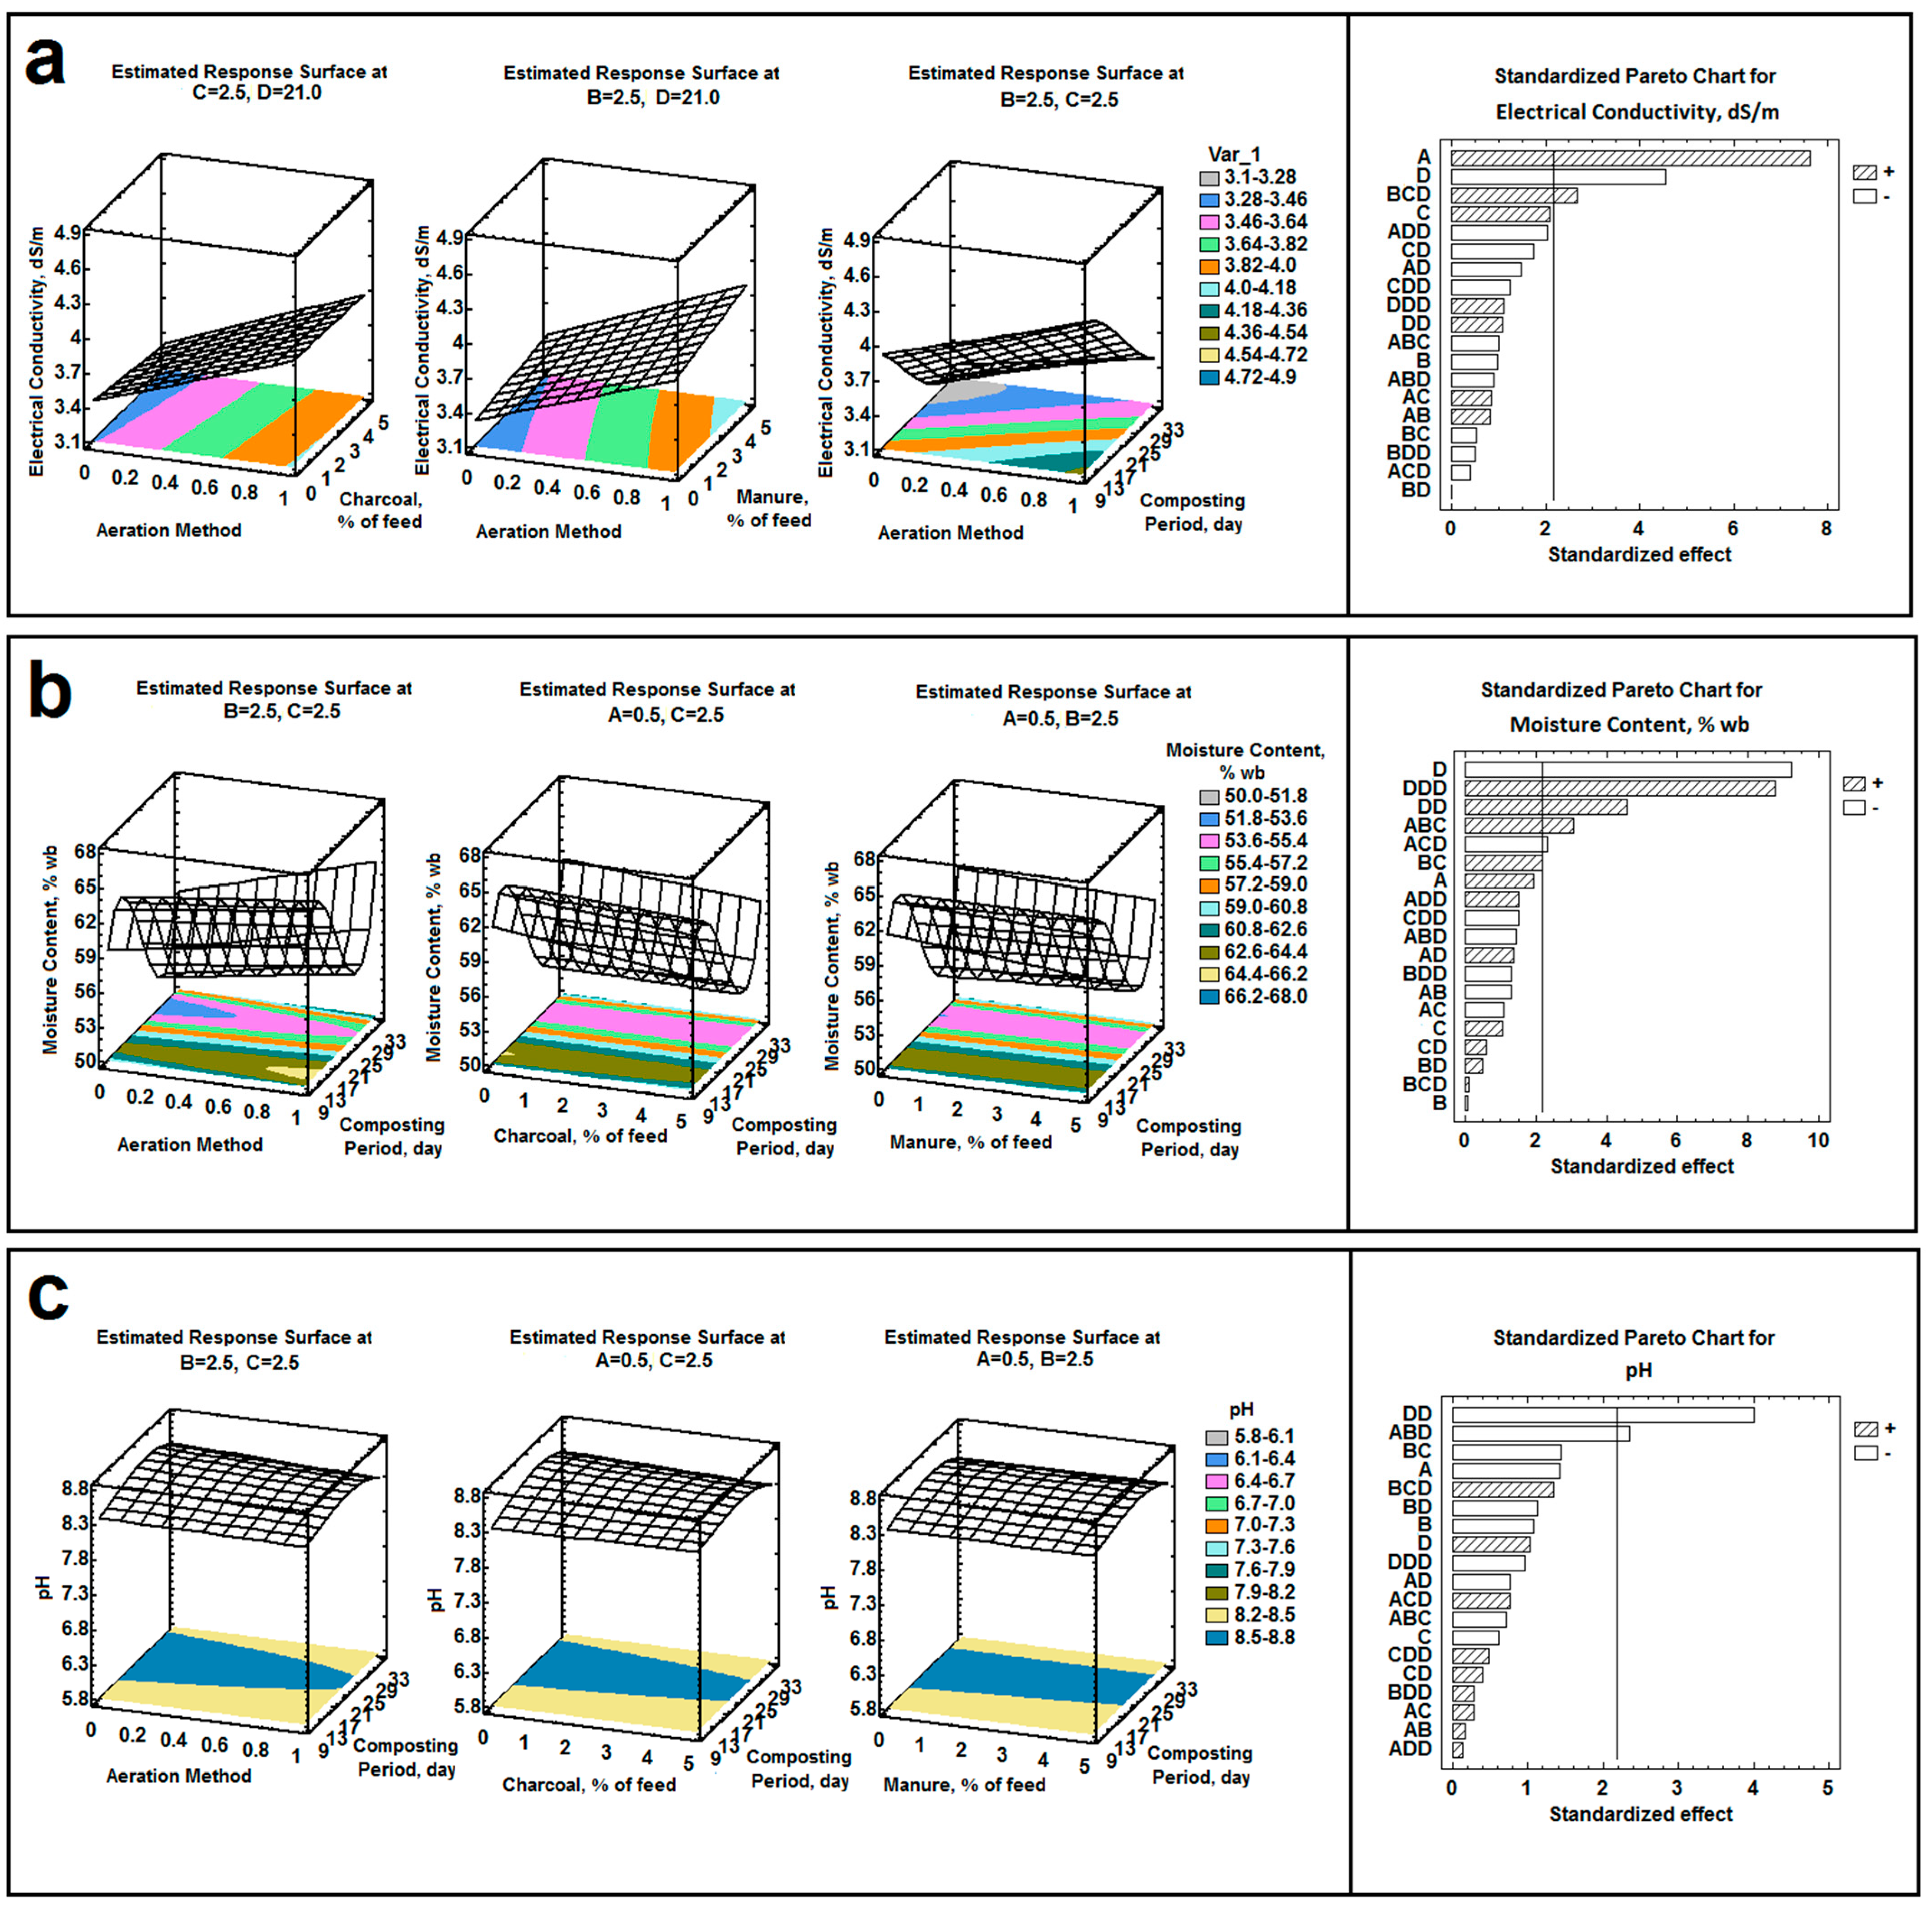
3.3. Moisture Content of Compost

One of the most important elements influencing the biodegradation process is moisture content. Many prior researchers have revealed that the right amount of moisture is required for a successful composting process [54,55,56,57,58]. The moisture content (wet basis; w.b) of composting mass in each barrel was identified on the 9th, 17th, 25th, 33rd and 50th day of composting as shown in Figure 6B. In all barrels, there was a noticeable increase of moisture content of composting mass on the 17th and 33rd day. Moreover, the moisture content at the end of composting period decreased where it was the highest and exceeded 50% wb in case of barrels No. 3, 2 and 4, respectively. It was also obvious that in barrel No. 3, the difference in moisture content between levels was relatively the smallest except for the period from day 33 to day 50 of composting where the difference was the same with barrel No. 2. Hence, moisture content (mean ± SD) in case of barrel No. 3 was the smallest, followed by barrels No. 4 and 2 where mean ± SD was 60.20 ± 4.76, 57.60 ± 5.85 and 59.40 ± 5.94%, respectively. Moisture content was the highest in case of barrel No. 8 at the end of composting period. Many studies have performed at the influence of moisture content on decomposition rate. Optimal moisture concentrations for composting have previously been reported to vary from 25% to 80% on a wet basis (w.b.), with values in the 50% to 70% range being commonly suggested [54,58,59]. There is no generally applicable optimal moisture content for composting materials, as seen by the very large range of published values. Because each material has its own set of physical, chemical, and biological features, the link between moisture content and its corollary elements such as water availability, particle size, porosity, and permeability is affected. Barrels No. 3 showed the lower reduction in terms of moisture, which could be related to the addition of charcoal at 5% and manure at 5% and properties of charcoal. Moreover, Barthod et al. [36] found that adding organic or mineral materials induces changes in the moisture content, temperature, etc.
Microbial activity is limited by low moisture content (less than 40%). High moisture content, however, causes anaerobic conditions because the pore spaces of solid matrices are filled with water instead of air [60,61].

3.4. Electrical Conductivity and pH

Electrical conductivity (EC) is a valuable measure that shows the degree of compost salinity and the number of ions in the composting material, and it signals possible phytotoxicity on plant development [56]. The EC value, however, is determined by the rate of organic matter breakdown, which results in the buildup of various ionic species [62]. EC and pH were analyzed for DSR before composting and mixing with additives and also for composting mass of each barrel on the 9th, 17th, 25th, 33rd and 50th day of composting as illustrated in Figure 7. Electrical conductivity decreased in all barrels at the end of composting period where it ranged from 2.55–3.1 dS/m as listed in Table 2. According to Avnimelech et al. [26], the EC was initially 7.5 mS/cm and then reduced to around 4 mS/cm after composting.
Additionally, one of the important indicators used to determine compost maturity is the pH value of the compost [50]. Concerning pH, composting mass can be divided into four categories according to the day which achieved the highest pH level of the mentioned days for which data are available; the first one reached the highest level earlier on the 17th day of composting (barrels No. 3 and 4), the second one was recorded on the 25th day (barrels No. 2, 5, 6 and 7), the third was recorded on the 33rd day (barrel No. 1), and the fourth was recorded on the 50th day (barrel No. 8). The highest and the earliest level of pH and also the lowest one at the end of composting period was found in the case of barrel No. 4 (Table 2), while the lowest peak is shown in Figure 7B and the second lowest level was found for barrel No. 3. This can be attributed to intensive mesophilic microbe activity and organic matter breakdown with the generation of organic acids (such as acetic and butyric acid) at high temperatures, or to substantial CO2 losses during the first stage of lignocellulose decomposition in the compost windrow [50,63]. The Table 2 showed that pH varies very slightly (7.75 ≤ pH ≤ 8.45), indicating a good quality compost and within the suggested range of 6–8.5 as has been reported by several studies [25].

3.5. Germination Parameters

At 10 days old, a test of each germination medium which contains a mixture of soil and compost (at a ratio of 3:1) of each barrel was used, and also a control sample was tested. The previously mentioned germination parameters were assessed for all germination mediums as listed in Table 3. A higher GI value denotes a higher germination percentage and rate. As shown in Figure 8 germination medium No. 3 achieved the highest GI which increased GI by 58.63% compared with the control followed by medium No. 4 which was higher than the control sample by 5.35%. The GI values of the other mediums were less than the control. Medium No. 3 was considered the best among all other investigated mediums and even better than the control sample. Moreover, there was no correlation between FGP and LDG; hence the latter is not a very useful representation of the overall seed germination activity. The reader could find notes about what these germination parameters indicate and emphasize in Kader [40]. From the initial results of germination index, the usage of both charcoal with manure during forced aeration with moistening frequency every six hours daily has a remarkably positive effect on germination index.

3.6. Microbial Population Enumeration

Compost stability is linked to microbial activity throughout the composting process. Micro-organisms broke down the degradable organic matter and nitrogenous compounds in pig manure during composting [64]. Microbial population of composting mass in each barrel was obtained on days 9, 17 and 50 of composting as depicted in Figure 9. The number of bacteria during these days was the highest followed by actinomycetes and fungi, and among these days, it was obvious that the highest values were recorded on day 17. Moreover, we noticed that the number of bacteria in barrel No. 3 was the highest on the previously mentioned days followed by barrel No. 2, while barrel No. 5 was the least among all tested barrels. The flatness of variation in the number of bacteria in barrel No. 2, 1 and 3 is noticeable as depicted in Figure 9A; the number of bacteria in these barrels as mean ± SD was 7.733 ± 0.152, 6.600 ± 0.173 and 7.866 ± 0.208 log CFU/g, respectively.

3.7. Correlation between Parameters

The barrels neither show a thermophilic phase nor a mesophilic phase as expected at the beginning of composting process where the composting process ended around psychrophilic range. There was also an irregularity in temperature–time pattern. Table 4 details the correlation coefficients between germination indicators and some properties of composting mass such as C/N ratio, moisture content, pH average, temperature uniformity coefficients and number of bacteria over the experiment. A significant positive correlation (r > 0.80) between GI and both C/N difference during days from 1 to 33 and also the number of bacteria on day 17 was found. Regarding microbial population, in most cases the correlation coefficients between GI and the number of bacteria on all days were greater than 0.70 as listed in Table 4. Concerning correlation between composting, mass parameters in some days and temperature uniformity coefficients in the same days was listed in Table 5 where the highest correlation was found between temperature uniformity coefficient and C/N in days 17 and 33 of composting where it was 0.958 and 0.790, respectively, while it was 0.744 between temperature uniformity coefficient and pH in day 25 of composting.

3.8. Optimization Results

The results of response surface modeling of process parameters are illustrated in Figure 10 and Figure 11 where they show the estimated response as a function of each two factors, while the other factors are held constant, and the height of the surface represents the value of the response. Moreover, the regression equation coefficients which have been fitted to the data are listed in Table 6 and Table 7, in addition to optimized response according to optimization goal in Table 8 that shows the combination of factors levels which achieve the optimized response; either the optimization goal is to minimize the response or to maintain it at a value over the indicated region. The results showed that the second order polynomial regression achieved R2 of 99.78%, indicating a good fitting where all the mean factors and some of their interactions have a significant effect on accumulative C/N reduction percentage as depicted by Pareto chart in Figure 10a, where the length of each bar is proportional to the standardized effect, which is estimated effect divided by its standard error. Any bars extending beyond the line correspond to effects which are statistically significant at 95% confidence level. Hence four main effects are significant. The following multiple linear regression model (Equation (2)) represents the effect of each factor on the response:
Y = a0 + a1 A + a2 B + a3 C + a4 D + a5 A B + a6 A C + a7 A D + a8 B C + a9 B D + a10 C D + a11 D2
where Y is the response; an is a constant; A is aeration method represented in a quantitative value; B is charcoal % of feed; C is manure % of feed; and D is composting period. The effect of composting period is very clear on the response surface, while with the increase of composting period, the effect of other factors begins to be obvious. Concerning the other responses, the third order polynomial regression model (Equation (3)) achieved a higher R2 than the second order one. In regards to difference between maximum and ambient temperature, six factors have a significant effect on the response where it includes all main factors except manure and the interactive effect between aeration method and composting period. The response of the third order effect of composting period on the response surface shape is obvious in Figure 10b.
Y = a0 + a1 A + a2 B + a3 C + a4 D + a5 A B + a6 A C + a7 A D + a8 B C + a9 B D + a10 C D + a11 D2 + a12 A D2 + a13 B D2 + a14 C D2 + a15 D3 + a16 A B C + a17 A B D + a18 A C D + a19 B C D
Concerning temperature uniformity coefficient, only two main factors and one interaction effect between aeration method, charcoal and manure percentage of feed have a significant effect. It was found from the optimization data that the response tends to be higher in the case of passive aeration, and when the use of charcoal decreases, this is not conducive to good aeration condition. El Zein et al. [65] found a significant correlation between the moisture content and temperature distribution within the pile, but in this study case, the correlation between moisture content on day 9, 17, 25, 33 and 50 of composting of each barrel and temperature uniformity coefficient on the same days was not significant. Concerning the difference in temperatures between the parts of a single vessel, it could be due not only to differing microbial activity but also to the aeration condition. The reason the temperature did not rise to the level appropriate for the growth and dominance of thermophilic bacteria could be due to the small amount of the residue present in each transaction. There is also the nature of the residue which is largely made up of soil, but the breakdown of cellulose is not just a matter of thermophilic microbes, fungi and other bacteria that break down cellulose as well. In Figure 11b,c, the third and second order effect of composting period on moisture content and pH is obvious.

4. Conclusions

In the present study, composting of dry-cleaning station residues of an Egyptian sugar beet factory with different treatments was conducted in barrels subjected to forced and passive aeration. Composting mass properties including C/N ratio, moisture content, pH average, temperature uniformity coefficient, and number of bacteria during specific days of the process were obtained. Based on the work described in this research, the temperature–time pattern was irregular, and composting mass in forcedly aerated treatments did not show a thermophilic phase, ending around the mesophilic range, while in passively aerated treatments, it did not show a mesophilic phase and ended around the psychrophilic range. On days from 1 to 33 of composting period, C/N ratio decrease was higher in more of the forcedly aerated treatments than passively aerated composting mass, except for treatment No. 1 and 8 where the C/N ratios were equal for both. The results further showed that the germination medium which contains 75% soil and 25% compost from treatment No. 3 achieved the best results among the other mediums—even better than the control sample based on germination index value. Correlation coefficient value was greater than 0.80 between germination index (GI) and both C/N ratio difference between days from 1 to 33 and the number of bacteria on the 17th day, while it was greater than 0.70 between GI and the number of bacteria on days 9 and 50. For the Number of fungi and actinomycetes, the maximum was found on days 9 and 17.

Author Contributions

Conceptualization, S.E.A.; methodology, S.E.A., T.E., W.M.E. and R.E.; software, S.E.A., T.E., W.M.E., R.E. and Y.S.A.M.; validation, S.E.A., T.E., W.M.E., R.E.; S.E. and A.H.E.; formal analysis, S.E.A., T.E., W.M.E. and R.E.; investigation, S.E.A., T.E., W.M.E., R.E. and A.H.E. resources, S.E.A. and Y.S.A.M.; data curation, S.E.A., T.E., W.M.E. and R.E.; writing—original draft preparation, S.E.A., T.E. and W.M.E., writing—review and editing, S.E.A., T.E., W.M.E., A.H.E. and S.E.; visualization, S.E.A., T.E., W.M.E., A.H.E., Y.S.A.M. and S.E.; supervision, S.E.A.; project administration, S.E.A., T.E., W.M.E. and Y.S.A.M.; funding acquisition, Y.S.A.M. All authors have read and agreed to the published version of the manuscript.

Funding

King Khalid University for funding this work through Program of Research Groups under grant number (RGP 2/67/43).

Institutional Review Board Statement

Not applicable.

Informed Consent Statement

Not applicable.

Data Availability Statement

All data are presented within the article.

Acknowledgments

The authors extend their appreciation to the Deanship of Scientific Research at King Khalid University for funding this work through Program of Research Groups under grant number (RGP 2/67/43).

Conflicts of Interest

The authors declare no conflict of interest.

References

  1. Gupta, N.; Yadav, K.K.; Kumar, V. A review on current status of municipal solid waste management in India. J. Environ. Sci. 2015, 37, 206–217. [Google Scholar] [CrossRef] [PubMed]
  2. Vitorino de Souza Melaré, A.; Montenegro González, S.; Faceli, K.; Casadei, V. Technologies and decision support systems to aid solid-waste management: A systematic review. Waste Manag. 2017, 59, 567–584. [Google Scholar] [CrossRef] [PubMed]
  3. Ferronato, N.; Torretta, V.; Ragazzi, M.; Rada, E.C. Waste mismanagement in developing countries: A case study of environmental contamination. UPB Sci. Bull. Ser. D Mech. Eng. 2017, 79, 185–196. [Google Scholar]
  4. Ahmed, M.F.; Rahman, M.M. Water Supply and Sanitation: Rural and Low Income Urban Communities; ITN: Dhaka, Bangaladish, 2000. [Google Scholar]
  5. Vongdala, N.; Tran, H.D.; Xuan, T.D.; Teschke, R.; Khanh, T.D. Heavy metal accumulation in water, soil, and plants of municipal solid waste landfill in Vientiane, Laos. Int. J. Environ. Res. Public Health 2019, 16, 22. [Google Scholar] [CrossRef] [Green Version]
  6. Gutberlet, J.; Baeder, A.M. Informal recycling and occupational health in Santo André, Brazil. Int. J. Environ. Health Res. 2008, 18, 1–15. [Google Scholar] [CrossRef]
  7. UNEP-Global. Marine Litter: A Global Challenge; UNEP: Athens, Greece, 2009; ISBN 9789280730296. [Google Scholar]
  8. Chen, P.; Qinglong, X.; Addy, M.; Zhou, W.; Liu, Y.; Wang, Y.; Cheng, Y.; Li, K.; Ruan, R. Utilization of municipal solid and liquid wastes for bioenergy and bioproducts production. Bioresour. Technol. 2016, 215, 163–172. [Google Scholar] [CrossRef] [Green Version]
  9. Chen, D.Z.; Yin, L.; Wang, H.; He, P. Pyrolysis technologies for municipal solid waste: A review. Waste Manag. 2014, 12, 2466–2486. [Google Scholar] [CrossRef]
  10. Abu Qdais, H.; Wuensch, C.; Dornack, C.; Nassour, A. The role of solid-waste composting in mitigating climate change in Jordan. Waste Manag. Res. 2019, 37, 833–842. [Google Scholar] [CrossRef]
  11. Chaher, N.E.H.; Chakchouk, M.; Nassour, A.; Nelles, M.; Hamdi, M. Potential of windrow food and green waste composting in Tunisia. Environ. Sci. Pollut. Res. Int. 2020, 28, 46540–46552. [Google Scholar] [CrossRef]
  12. Oazana, S.; Naor, M.; Grinshpun, J.; Halachmi, I.; Raviv, M.; Saadi, I.; Avidov, R.; Varma, V.S.; Rosenfeld, L.; Gross, A. A flexible control system designed for lab-scale simulations and optimization of composting processes. Waste Manag. 2018, 72, 150–160. [Google Scholar] [CrossRef]
  13. Taiwo, A.M. Composting as a sustainable waste management technique in developing countries. J. Environ. Sci. Technol. 2011, 4, 93–102. [Google Scholar] [CrossRef] [Green Version]
  14. Abdel-Galil, M.A.; El-Ghobashy, Y.E.; Lamlom, M.M. Sugar beet productivity and profitability as affected by three cropping systems and mineral nitrogen fertilizer rates. In Proceedings of the 8th International Conference on Technology and Sustainable Development in the Third millennium, Alexandria, Egypt, 22–24 November 2014; pp. 161–188. [Google Scholar]
  15. Osama, S.; Elkholy, M.; Kansoh, R.M. Optimization of the cropping pattern in Egypt. Alex. Eng. J. 2017, 56, 557–566. [Google Scholar] [CrossRef]
  16. Mosen, A. Beet-Sugar Handbook; John Wiley & Sons, Inc.: Hoboken, NJ, USA, 2007. [Google Scholar]
  17. FAOSTAT. Food and Agriculture Organization of the United Nations (FAO), Rome, Italy. 2021. Available online: www.fao.org (accessed on 10 December 2021).
  18. FAO-EBRD Cooperation. Review of the Egyptian Sugar Sector; Food and Agriculture Organization of the United Nation (FAO): Rome, Italy; European Bank for Reconstruction and Development (EBRD): London, UK, 2019. [Google Scholar]
  19. Abdallah, S.E. Thermal efficiency enhancement of a solar drier for hay making from sugarbeet tops. AMA Agric. 2010, 41, 87–98. [Google Scholar]
  20. El-Tayeh, N.A.; Salama, F.M.; Loutfy, N.; Abou Alhamd, M.F. Effect of sandy soil amendment with filter mud cake on growth and some ecophysiological parameters of Daucus carota and Beta vulgaris plants. Catrina 2019, 18, 97–103. [Google Scholar] [CrossRef]
  21. Kheir, A.M.S.; Kamara, M.M. Effect of sugarbeet factory lime, vinasse and compost mixed with vinasse application on sandy soil properties and canola productivity. Soil Sci. Agric. Eng. Mansoura Univ. 2019, 10, 69–77. [Google Scholar]
  22. El-Hadidi, E.M.; El-Sherpiny, M.A.; Ezzat, S.; Abo El-Ezz, S.F. Response of barley grown on different soils to soil amendments. Soil Sci. Agric. Eng. Mansoura Univ. 2020, 11, 347–353. [Google Scholar]
  23. FAO—Food and Agriculture Organization of the United Nations. On-Farm Composting Methods. LAND and Water Discussion Paper No. 2; FAO: Rome, Italy, 2003. [Google Scholar]
  24. NRAES—Natural Resource, Agriculture, and Engineering Service. On-Farm Composting; Rynk, R., Ed.; NRAES Cooperative Extension: Ithaca, NY, USA, 1992. [Google Scholar]
  25. Fu, J.; Pan, F.; Song, S.; Zhang, L.; Luo, Y.; Chen, W.; Liang, Y. Biodegradation of phthalic acid esters in sewage sludge by composting with pig manure and rice straw. Environ. Earth Sci. 2013, 68, 2289–2299. [Google Scholar] [CrossRef]
  26. Manu, M.K.; Kumar, R.; Garg, A. Drum composting of food waste: A kinetic study. Procedia Environ. Sci. 2016, 35, 456–463. [Google Scholar] [CrossRef]
  27. Manu, M.K.; Kumar, R.; Garg, A. Performance assessment of improved composting system for food waste with varying aeration and use of microbial inoculum. Bioresour. Technol. 2017, 234, 167–177. [Google Scholar] [CrossRef]
  28. Dalzell, H.W.; Biddlestone, A.J.; Gray, K.R.; Thurairajan, K. Soil Management: Compost Production and Use in Tropical and Subtropical Environments; FAO Soils Bulletin No. 56.; FAO: Rome, Italy, 1987. [Google Scholar]
  29. Ewida, E.H.; El-Awady, M.N.; Kamel, O.M.; Geneady, M.A.; El-Berdiney, M. Technical and economical study for composting aeration under Egyptian conditions. Misr J. Agric. Eng. 2009, 26, 485–497. [Google Scholar] [CrossRef]
  30. Abdallah, S.E.; Basiouny, M.A.; Ghanem, G.H. Effectiveness of the aeration method and pile shape during composting process. AMA Agric. 2012, 43, 18–28. [Google Scholar] [CrossRef]
  31. Cayuela, M.L.; Sánchez-Monedero, M.A.; Roig, A. Evaluation of two different aeration systems for composting two-phase olive mill wastes. Process Biochem. 2006, 41, 616–623. [Google Scholar] [CrossRef]
  32. Chowdhury, M.A.; de Neergaard, A.; Jensen, L.S. Potential of aeration flow rate and bio-char addition to reduce greenhouse gas and ammonia emissions during manure Composting. Chemosphere 2014, 97, 16–25. [Google Scholar] [CrossRef] [PubMed]
  33. Wang, Y.; Qiu, H.; Li, M.; Ghanney, P. Influence of aeration method on gaseous emissions and the losses of the carbon and nitrogen during cow manure composting. Appl. Sci. 2021, 11, 11639. [Google Scholar] [CrossRef]
  34. Abu Koura, H.; EL-Zemrany, H.; El-Boraie, A. Effect of two aeration systems on the physicochemical parameters during composting of the cattle and poultry manures. Menoufia J. Soil Sci. 2020, 5, 33–49. [Google Scholar] [CrossRef]
  35. Gao, M.; Li, B.; Yu, A.; Liang, F.; Yang, L.; Sun, Y. The effect of aeration rate on forced-aeration composting of chicken manure and sawdust. Bioresour. Technol. 2010, 101, 1899–1903. [Google Scholar] [CrossRef]
  36. Barthod, J.; Rumpel, C.; Dignac, M. Composting with additives to improve organic amendments. A review. Agron. Sustain. Dev. 2018, 38, 17. [Google Scholar] [CrossRef] [Green Version]
  37. Wu, I.-P.; Barragan, J.; Vincent, F.B. Chapter 10: Field performance and evaluation. In Microirrigation for Crop Production: Design, Operation and Management; Lamm, F.R., Ayars, J.E., Nakayama, F.S., Eds.; Elsevier: Amsterdam, The Netherlands, 2006. [Google Scholar]
  38. Saxena, C.K.; Bajpai, A.; Nayak, A.K.; Pyasi, S.K.; Singh, R.; Gupta, S.K. Chapter 7: Hydraulic performance of litchi and banana under drip irrigation. In Micro Irrigation Scheduling and Practices; Megh, R., Goyal, B.P., Sudhindra, N.P., Eds.; CRC Press: Boca Raton, FL, USA, 2017. [Google Scholar]
  39. Alberta Environment. Mid-Scale Composting Manual; T/506; Olds College: Olds, AB, Canada, 1999. [Google Scholar]
  40. Kader, M.A. A comparison of seed germination calculation formulae and the associated interpretation of resulting data. J. Proc. R. Soc. N. S. W. 2005, 138, 65–75. [Google Scholar]
  41. Al-Alawi, M.; Szegi, T.; El Fels, L.; Hafidi, M.; Simon, B.; Gulyas, M. Green waste composting under GORE(R) cover membrane at industrial scale: Physico-chemical properties and spectroscopic assessment. Int. J. Recycl. Org. Waste Agricult. 2019, 8, 385–397. [Google Scholar] [CrossRef] [Green Version]
  42. Tiquia, S.M. Microbiological parameters as indicators of compost maturity. J. Appl. Microbiol. 2005, 99, 816–828. [Google Scholar] [CrossRef] [Green Version]
  43. Khalil, A.; Domeizel, M.; Prudent, P. Monitoring of green waste composting process based on redox potential. Bioresour. Technol. 2008, 99, 6037–6045. [Google Scholar] [CrossRef]
  44. Bernal, M.P.; Alburquerque, J.A.; Moral, R. Composting of animal manures and chemical criteria for compost maturity assessment. A review. Bioresour. Technol. 2009, 100, 5444–5453. [Google Scholar] [CrossRef] [PubMed]
  45. González, I.; Robledo-Mahón, T.; Silva-Castro, G.A.; Rodríguez-Calvo, A.; Gutiérrez, M.C.; Martín, M.Á.; Chica, A.F.; Calvo, C. Evolution of the composting process with semi-permeable film technology at industrial scale. J. Clean. Prod. 2016, 115, 245–254. [Google Scholar] [CrossRef]
  46. Mohee, R. Waste management opportunities for rural communities: Composting as an effective waste management strategy for farm households and others. In Agricultural and Food Engineering Working Document No. 6; FAO: Rome, Italy, 2007. [Google Scholar]
  47. Insam, H.; de Bertoli, M. Microbiology of the composting process. Waste Manag. Ser. 2007, 8, 25–48. [Google Scholar]
  48. Mehta, C.M.; Palni, U.; Franke-Whittle, I.H.; Sharma, A.K. Compost: Its role, mechanism and impact on reducing soil-borne plant diseases. Waste Manag. 2014, 34, 607–622. [Google Scholar] [CrossRef] [PubMed]
  49. Bernai, M.P.; Paredes, C.; Sánchez-Monedero, M.A.; Cegarra, J. Maturity and stability parameters of composts prepared with a wide range of organic wastes. Bioresour. Technol. 1998, 63, 91–99. [Google Scholar] [CrossRef]
  50. Azim, K.; Soudi, B.; Boukhari, S.; Perissol, C.; Roussos, S.; Thami Alami, I. Composting parameters and compost quality: A literature review. Org. Agric. 2018, 8, 141–158. [Google Scholar] [CrossRef]
  51. Garcia, C.; Hernandez, T.; Costa, F.; Ayuso, M. Evaluation of the maturity of municipal waste compost using simple chemical parameters. Commun. Soil Sci. Plant Anal. 1992, 23, 1501–1512. [Google Scholar] [CrossRef]
  52. Fontanive, V.; Effron, D.; Tortarolo, F.; Arrigo, N. Evaluation of parameters during composting of two contrasting raw materials. Compost Sci. Util. 2004, 12, 268–272. [Google Scholar] [CrossRef]
  53. Mbeah, M. Composting piggery waste: A review. Bioresour Technol. 1997, 63, 197–203. [Google Scholar]
  54. Haug, R.T. Process kinetics and product stability. In The Practical Handbook of Compost Engineering; Lewis Publishers: Boca Raton, FL, USA, 1993; pp. 335–383. [Google Scholar]
  55. de Bertoldi, M.; Vallini, G.; Pera, A. The biology of composting: A review. Waste Manag. Res. 1983, 1, 157–176. [Google Scholar] [CrossRef]
  56. Das, K.; Keener, H.M. Moisture effect on compaction and permeability in composts. J. Environ. Eng. 1997, 123, 275–281. [Google Scholar] [CrossRef]
  57. Liang, C.; Das, K.C.; McClendon, R.W. The influence of temperature and moisture contents regimes on the aerobic microbial activity of a biosolids composting blend. Bioresour. Technol. 2003, 86, 131–137. [Google Scholar] [CrossRef]
  58. Ahn, H.K.; Richard, T.L.; Glanville, T.D. Optimum moisture levels for biodegradation of mortality composting envelope materials. Waste Manag. 2008, 28, 1411–1416. [Google Scholar] [CrossRef] [PubMed]
  59. Cronjé, A.L.; Turner, C.; Williams, A.G.; Barker, A.J.; Guy, S. The respiration rate of composting pig manure. Compost Sci. Util. 2004, 12, 119–129. [Google Scholar] [CrossRef]
  60. Gao, M.; Liang, F.; Yu, A.; Li, B.; Yang, L. Evaluation of stability and maturity during forced-aeration composting of chicken manure and sawdust at different C/N ratios. Chemosphere 2010, 78, 614–619. [Google Scholar] [CrossRef]
  61. Chan, M.T.; Selvam, A.; Wong, J.W.C. Reducing nitrogen loss and salinity during ‘struvite’ food waste composting by zeolite amendment. Bioresour. Technol. 2016, 200, 838–844. [Google Scholar] [CrossRef]
  62. Senesi, N. Composted materials as organic fertilizers. Sci. Total Environ. 1989, 81–82, 521–542. [Google Scholar] [CrossRef]
  63. Sánchez-Bascones, M.; Díez-Gutiérrez, M.A.; Gangas, E.R.; Hernández-Navarro, S.; Corrêa-Guimarães, A.; Navas-Gracia, L.M.; Martín-Gil, J. Use of potato peelings in composting techniques: A high-priority and low-cost alternative for environmental remediation. Dyn. Soil Dyn. Plant 2008, 72–89. [Google Scholar]
  64. Veeken, A.; Nierop, K.; De Wilde, V.; Hamelers, B. Characterization of NaOH-extracted humic acids during composting of a biowaste. Bioresour. Technol. 2000, 72, 33–41. [Google Scholar] [CrossRef]
  65. El Zein, A.; Hamdy, S.; Essam, G. Moisture content and thermal balance during composting of fish, banana mulch and municipal solid wastes. Eur. Sci. J. 2015, 11, 169–187. [Google Scholar]
Figure 1. Experimental setup of composting DSR. (a) barrels covered with insulation material and aluminum foil; (b) wooden beam; (c) base from bricks, (d) air compressor, (e) hose for forcing air into the heater, (f) water inlet, (g) water heating vessel, (h) air and water vapor mixture outlet, (i) water flow sensor cable, (j) valve, (k) manometer, (l) water flow sensor, (m) temperature sensors cables, and (n) insulating material.
Agriculture 12 00427 g001
Figure 2. Configuration of each investigated barrel. (a) perforated tube of 0.5 in internal diameter, (b) temperature digital sensor, (c) cable, (d) air and water vapor mixture inlet, (e) two opposite holes of 4 mm diameter (f) like (part: e) but staggered from it by a circular arc of 2.5 cm, and (g) like (part: f) but staggered from it by a circular arc of 2.5 cm.
Agriculture 12 00427 g002
Figure 3. Configuration of a local-made water heating vessel. (a) Water heating vessel, (b) water inlet, (c) transparent hose, (d) forced air inlet, (e) air and water vapor mixture outlet, (f) electric heating element, (g) electric wires.
Agriculture 12 00427 g003
Figure 4. Perspective view showing an approximate placement of temperature digital sensors through barrels and ambient (A) box containing DAQ for data logging, (B) flipped barrel as a stand for DAQ box, (C) ball valve, (D) air and water vapor mixture inlet, (E) air and water vapor mixture outlet furnished for manual piping, (F) hose piped to (Part: E).
Agriculture 12 00427 g004
Figure 5. Temperature–time profile of each barrel measured at three various levels and temperature uniformity coefficients between them during composting period (AH); Temperature uniformity coefficients averages for the whole period in each barrel where every two barrels contain the same composting mass were collected together for comparison (I).
Agriculture 12 00427 g005
Figure 6. (A) Carbon to Nitrogen ratio (C/N) and (B) moisture content of composting mass on different days of composting period.
Agriculture 12 00427 g006
Figure 7. (A) Electrical conductivity and (B) pH value of composting mass on the 9th, 17th, 25th, 33rd and 50th day of composting period and before mixing DSR with additives.
Agriculture 12 00427 g007
Figure 8. Germination index of each germination medium calculated according to Kader [40].
Agriculture 12 00427 g008
Figure 9. Microbial population on days 9, 17 and 50 of composting for (A) bacteria; (B) fungi; and (C) actinomycetes.
Agriculture 12 00427 g009
Figure 10. Estimated response surfaces and their contours below as a function of each two factors at a constant value of other factors with Pareto charts for each response of (a) accumulative C/N reduction percentage; (b) difference between maximum and ambient temperature; and (c) temperature uniformity coefficient.
Agriculture 12 00427 g010
Figure 11. Estimated response surfaces and their contours below as a function of each two factors at a constant value of other factors with Pareto charts for each response of (a) electrical conductivity; (b) moisture content; and (c) pH.
Agriculture 12 00427 g011
Table 1. A. Experimental design of each barrel. B. Levels and variation intervals of each factor in the experimental design. C. chemical composition of citrus wood charcoal (Abu Bakr, 2008).
A
Barrel
No.
Aeration
Method
Additives and NutrientsAeration FrequencyMoistening Frequency
Charcoal,
% of Feed
Manure,
% of Feed
Urea,
g
1Forced004004 times per day
(every six hours)
4 times per day
(every six hours) within aeration
2Forced05400
3Forced55400
4Forced50400
5Passive00400Continuously except during moistening with forced moist air1/4 h every three days (if there is a need)
6Passive50400
7Passive05400
8Passive55400
B
ResponseFactorLevelsNo. of LevelsVariation Intervals
Low (−1)High (+1)
C/N accumulative reduction percentageAeration method (qualitative)0121
Charcoal % of feed0525
Manure % of feed0525
Composting period, day133316
Temperature uniformity coefficient; difference between ambient and maximum temperature;
electrical conductivity; moisture content and pH
Aeration method (qualitative)0121
Charcoal % of feed0525
Manure % of feed0525
Composting period, day93348
C
Nutrients%, Dry Matter Basis
Dry matter95
Crude protein2
Crude fiber77
Crude fat1
Ash15
Table 2. Some parameters of DSR and composting mass in each barrel on the 50th day of composting period.
Barrel
No.
C/N *Electrical
Conductivity,
dS/m
pHMoisture Content,
% wb
115 ± 0.5 b3.10 ± 0.09 a8.13 ± 0.01 e49 ± 1.73 cd
214 ± 0 c2.78 ± 0.01 c8.20 ± 0.01 d52 ± 0.00 ab
314 ± 0.5 c2.90 ± 0.00 b8.10 ± 0.02 e53 ± 1.00 a
414 ± 0.5 c2.55 ± 0.01 e7.91 ± 0.02 e50 ± 1.00 bc
514 ± 0 c2.67 ± 0.01 d8.32 ± 0.00 c47 ± 0.00 de
615 ± 0 b2.85 ± 0.00 b8.45 ± 0.02 b48 ± 1.73 cd
716 ± 0.5 a2.57 ± 0.01 e8.21 ± 0.02 d49 ± 0.00 cd
815 ± 0 b2.76 ± 0.02 c8.5 ± 0.06 a45 ± 1.73 e
DSR1204.607.75
Recommended of finished compost≤25≤3.5 (adult plants) and
≤2 (seedling)
<830–50
Reference[46][53][23][46]
* At the beginning of the experimental the C/N ratio of composting mass was unified to be 28 in each barrel by adding an assessed amount of urea. The values having same letters are non-statistically significant (p ≤ 0.05) among different treatments.
Table 3. Germination parameters of each tested germination medium.
Germination MediumGerminated SeedsFGP,
%
MGT,
Day
FDG,
Day
LDG,
Day
TSG,
Day
CVG,
GRI,
%/Day
GI,
Mixture of 75% soil and 25% compost from barrel No.142 ± 1.0 f0.425.3537418.668.09237
253 ± 0.0 d0.534.9437420.2211.14321
361± 0.0 a0.614.8527520.6013.39533
458 ± 1.7 b0.584.8938520.4212.47354
534 ± 1.7 g0.345.3547318.686.47192
646 ± 0.0 e0.465.3948418.548.76258
741 ± 1.0 f0.415.2137419.158.08237
842 ± 0.0 f0.425.0238519.908.64251
control55 ± 1.0 c 0.554.8928620.4411.97336
— refers to a dimensionless parameter; Bold refers to GI > the control sample. The values having same letters are non-statistically significant (p ≤ 0.05) among different treatments.
Table 4. Correlation coefficients between germination parameters of mediums and some parameters of compost.
Composting Mass PropertyGermination Medium Parameters
FGPMGTFDGLDGTSGCVGGRIGI
C/N difference between days (1–33)0.922−0.832−0.7550.0950.7540.8410.9390.889
Moisture content0.322−0.085−0.532−0.5810.0560.0930.2990.348
pH average−0.7380.5840.7800.134−0.609−0.594−0.749−0.755
Average of temperature uniformity coefficients−0.8080.4710.421−0.476−0.730−0.482−0.764−0.739
No. of bacteria average0.769−0.790−0.856−0.2710.5770.7920.7910.784
No. of bacteria9th day0.773−0.779−0.843−0.2200.6030.7810.7900.746
17th day0.800−0.862−0.835−0.2020.6090.8640.8320.828
day 500.726−0.735−0.858−0.3540.5180.7370.7460.746
No. of fungi average0.626−0.762−0.877−0.2270.6290.7580.6600.616
No. of fungi9th day0.724−0.743−0.820−0.2510.5590.7440.7420.732
17th day0.553−0.736−0.792−0.1540.6040.7290.5870.469
50th day0.504−0.714−0.919−0.2430.6550.7080.5550.550
No. of actinomycetes average0.534−0.597−0.626−0.4260.2560.5990.5550.533
No. of actinomycetes 9th day0.337−0.452−0.373−0.3550.0780.4520.3580.322
17th day0.712−0.753−0.873−0.2350.6190.7530.7340.758
50th day0.476−0.485−0.554−0.5280.1150.4880.4920.455
Bold values refer to a correlation coefficient ≥±0.80.
Table 5. Correlation coefficients between composting mass parameters in some days and temperature uniformity coefficients in the same days.
Composting Mass PropertyComposting Period
917253350
Moisture content−0.0230.136−0.221−0.5560.227
pH0.187−0.1150.7440.134−0.371
C/N0.958 0.7900.072
Electrical Conductivity−0.405−0.510−0.145−0.450−0.214
No. of bacteria−0.562−0.524−0.170
No. of fungi−0.504−0.304−0.299
No. of actinomycetes−0.112−0.1820.143
Bold values refer to a correlation coefficient >0.700; — refers to not determined.
Table 6. Response model constants of accumulative C/N reduction percentage, difference between maximum and ambient temperature and temperature uniformity coefficient.
FactorsConstants of accumulative C/N reduction percentage response model (Equation (2))
(R2 = 99.7864%)
FactorsConstants of accumulative C/N reduction percentage response model (Equation (2))
(R2 = 99.7864%)
a0−0.10841ACa60.119048
Aa1−1.34859ADa70.30692
Ba2−0.128348BCa80.0238095
Ca3−0.225074BDa90.0390625
Da40.932966CDa100.0167411
ABa50.119048D2a11−0.00610352
FactorsConstants of difference between maximum and ambient temperature response model (Equation (3))
(R2 = 93.956%)
FactorsConstants of difference between maximum and ambient temperature response model (Equation (3))
(R2 = 93.956%)
a0−15.2969CDa100.0327853
Aa1−1.18964D2a11−0.183979
Ba2−0.353411AD2a12−0.00533569
Ca3−0.365753BD2a13−0.00255076
Da43.72459CD2a14−0.000763493
ABa5−0.141319D3a150.00272138
ACa6−0.21681ABCa160.0327142
ADa70.387232ABDa17−0.0126791
BCa8−0.0535223ACDa180.00533698
BDa90.089878BCDa190.00288269
FactorsConstants of temperature uniformity coefficient response model (Equation (3))
(R2 = 92.0892%)
FactorsConstants of temperature uniformity coefficient response model (Equation (3))
(R2 = 92.0892%)
a098.6683CDa10−0.0191819
Aa1−2.64579D2a110.0127506
Ba2−0.0800762AD2a12−0.00314591
Ca3−0.312798BD2a130.00231271
Da4−0.110201CD2a140.000619359
ABa5−0.0710262D3a15−0.000294857
ACa60.300816ABCa16−0.157574
ADa70.00369685ABDa170.0272229
BCa80.227786ACDa180.00788759
BDa9−0.106934BCDa19−0.00434526
Bold refers to significant factors that have p-value less than 0.05, indicating that they are significantly different from zero at the 95% confidence level.
Table 7. Response model constants of electrical conductivity, moisture content and pH.
FactorsConstants of electrical conductivity response model (Equation (3))
(R2 = 95.9006%)
FactorsConstants of electrical conductivity response model (Equation (3))
(R2 = 95.9006%)
a04.17565CDa100.00362734
Aa1−0.199045D2a11−0.00314575
Ba2−0.0220395AD2a12−0.0015918
Ca30.029566BD2a13−0.0000800781
Da4−0.006337CD2a14−0.000193359
ABa50.0782375D3a150.0000801595
ACa60.0551125ABCa16−0.0081
ADa70.0656367ABDa17−0.0019875
BCa8−0.0231425ACDa18−0.0008625
BDa90.00136953BCDa190.0011925
FactorsConstants of moisture content response model (Equation (3))
(R2 = 93.321%)
FactorsConstants of moisture content response model (Equation (3))
(R2 = 93.321%)
a025.7218CDa100.151094
Aa13.9793D2a11−0.435059
Ba2−1.29484AD2a120.0136719
Ca3−1.54836BD2a13−0.00234375
Da47.33096CD2a14−0.00273438
ABa5−0.2125D3a150.00732422
ACa60.31ABCa160.28
ADa7−0.242969ABDa17−0.0375
BCa8−0.0505ACDa18−0.06
BDa90.122187BCDa190.0005
FactorsConstants of pH response model (Equation (3))
(R2 = 75.2678%)
FactorsConstants of pH response model (Equation (3))
(R2 = 75.2678%)
a08.2454CDa10−0.00409922
Aa1−0.18399D2a110.00204224
Ba20.00912773AD2a120.0000878906
Ca30.0550387BD2a130.0000371094
Da40.00136108CD2a140.0000605469
ABa50.105063D3a15−0.000057373
ACa6−0.0126375ABCa16−0.0047
ADa70.000152344ABDa17−0.0043125
BCa8−0.0127425ACDa180.0013875
BDa9−0.00166484BCDa190.0004925
Bold refers to significant factors that have p-value less than 0.05, indicating that they are significantly different from zero at the 95% confidence level.
Table 8. Optimized response according to optimization goal and the combination of factors levels to achieve it.
Optimized ResponseGoalOptimum ValueAeration Method (Quantitative Value)Charcoal % of FeedManure % of FeedComposting Period, Day
YFactor AFactor BFactor CFactor D
accumulative C/N reduction, %Maximize response42.0415533
Difference between maximum and ambient, °CMaximize response12.4815017
Temperature uniformity coefficient, %Maximize response99.290.000106183.79398 × 10−80.0017834223.5619
Electrical conductivity, dS/mMaintain at 3.5 (adult plants)3.500.3634462.682.6023.6287
Maintain at 2 (seedlings)3.0536.15404 × 10−94.980.000129.49
Moisture content,
% wb
Maintain at 5050.631.80708 × 10−106.40211 × 10−90.001827.42
pHMaintain at 88.161.0050.0033.00
Publisher’s Note: MDPI stays neutral with regard to jurisdictional claims in published maps and institutional affiliations.

