1. Introduction
Agriculture is a risky business [
1]. The risk persists in all management decisions of an agricultural system that result from price, yield, and resource uncertainty [
2]. All the activities related to agriculture are exposed to a variety of risks arising from natural hazards, weather variability, and pests and diseases because agricultural production relies heavily on the natural resource base and climate conditions. These risks directly affect the economic returns from agriculture, the livelihood of farmers, and in the long run, the capacity of farmers to invest and innovate [
3]. Severe financial and business risks or their combination can create a catastrophic risk at the farm level. Catastrophic risk can generally be defined as a low probability event leading to major and typically irreparable losses with adverse impact on business outcomes [
4]. Such catastrophic risks can cause serious cash flow problems to the business that may end up bankrupt. In arable farming, severe damage to the crops can be caused by extreme meteorological events such as excessive rainfall, drought, storm, frost, and hail [
5].
Pakistan has an agro-based economy, i.e., it contributes about 21% of the total country’s GDP, and about 44% of the labour force is involved in agricultural businesses [
6]. The major agricultural crops include wheat, sugarcane, cotton, fruits and vegetables. Pakistan is one of the world’s largest rice exporters. It annually exports approximately two million tons of rice which constitute 10% of the world’ trade. Pakistan is also the world’s largest raw cotton producer. The ‘canal’ irrigation system of Pakistan is one of the largest systems in the world to support the agricultural sector [
7]. The majority of farmers in Pakistan are uneducated and lack proper awareness regarding the latest advancements in the field of agriculture. The majority of the farmers are held to the conventional way of agricultural practices, and the diffusion of technology is rather slow. However, the farmers in Pakistan are not resistant to adopting new technologies, but the latest technologies and support is rarely provided to them [
8].
A study conducted by [
9] revealed that farmers in developing countries perceive weather-related risks more than farmers in developed countries. Pakistan is a developing country and is susceptible to disaster risks from a range of hazards such as avalanches, cyclones, storms, tsunamis, droughts, earthquakes, epidemics, floods, landslides, pests and diseases, and river erosion. The frequency of occurrence of floods in Pakistan has increased over the past several years due to rapid climate change and global warming. That is the reason Pakistan has faced consecutive flood events since 2010, indicating that floods are now a regular incidence in the country [
10].
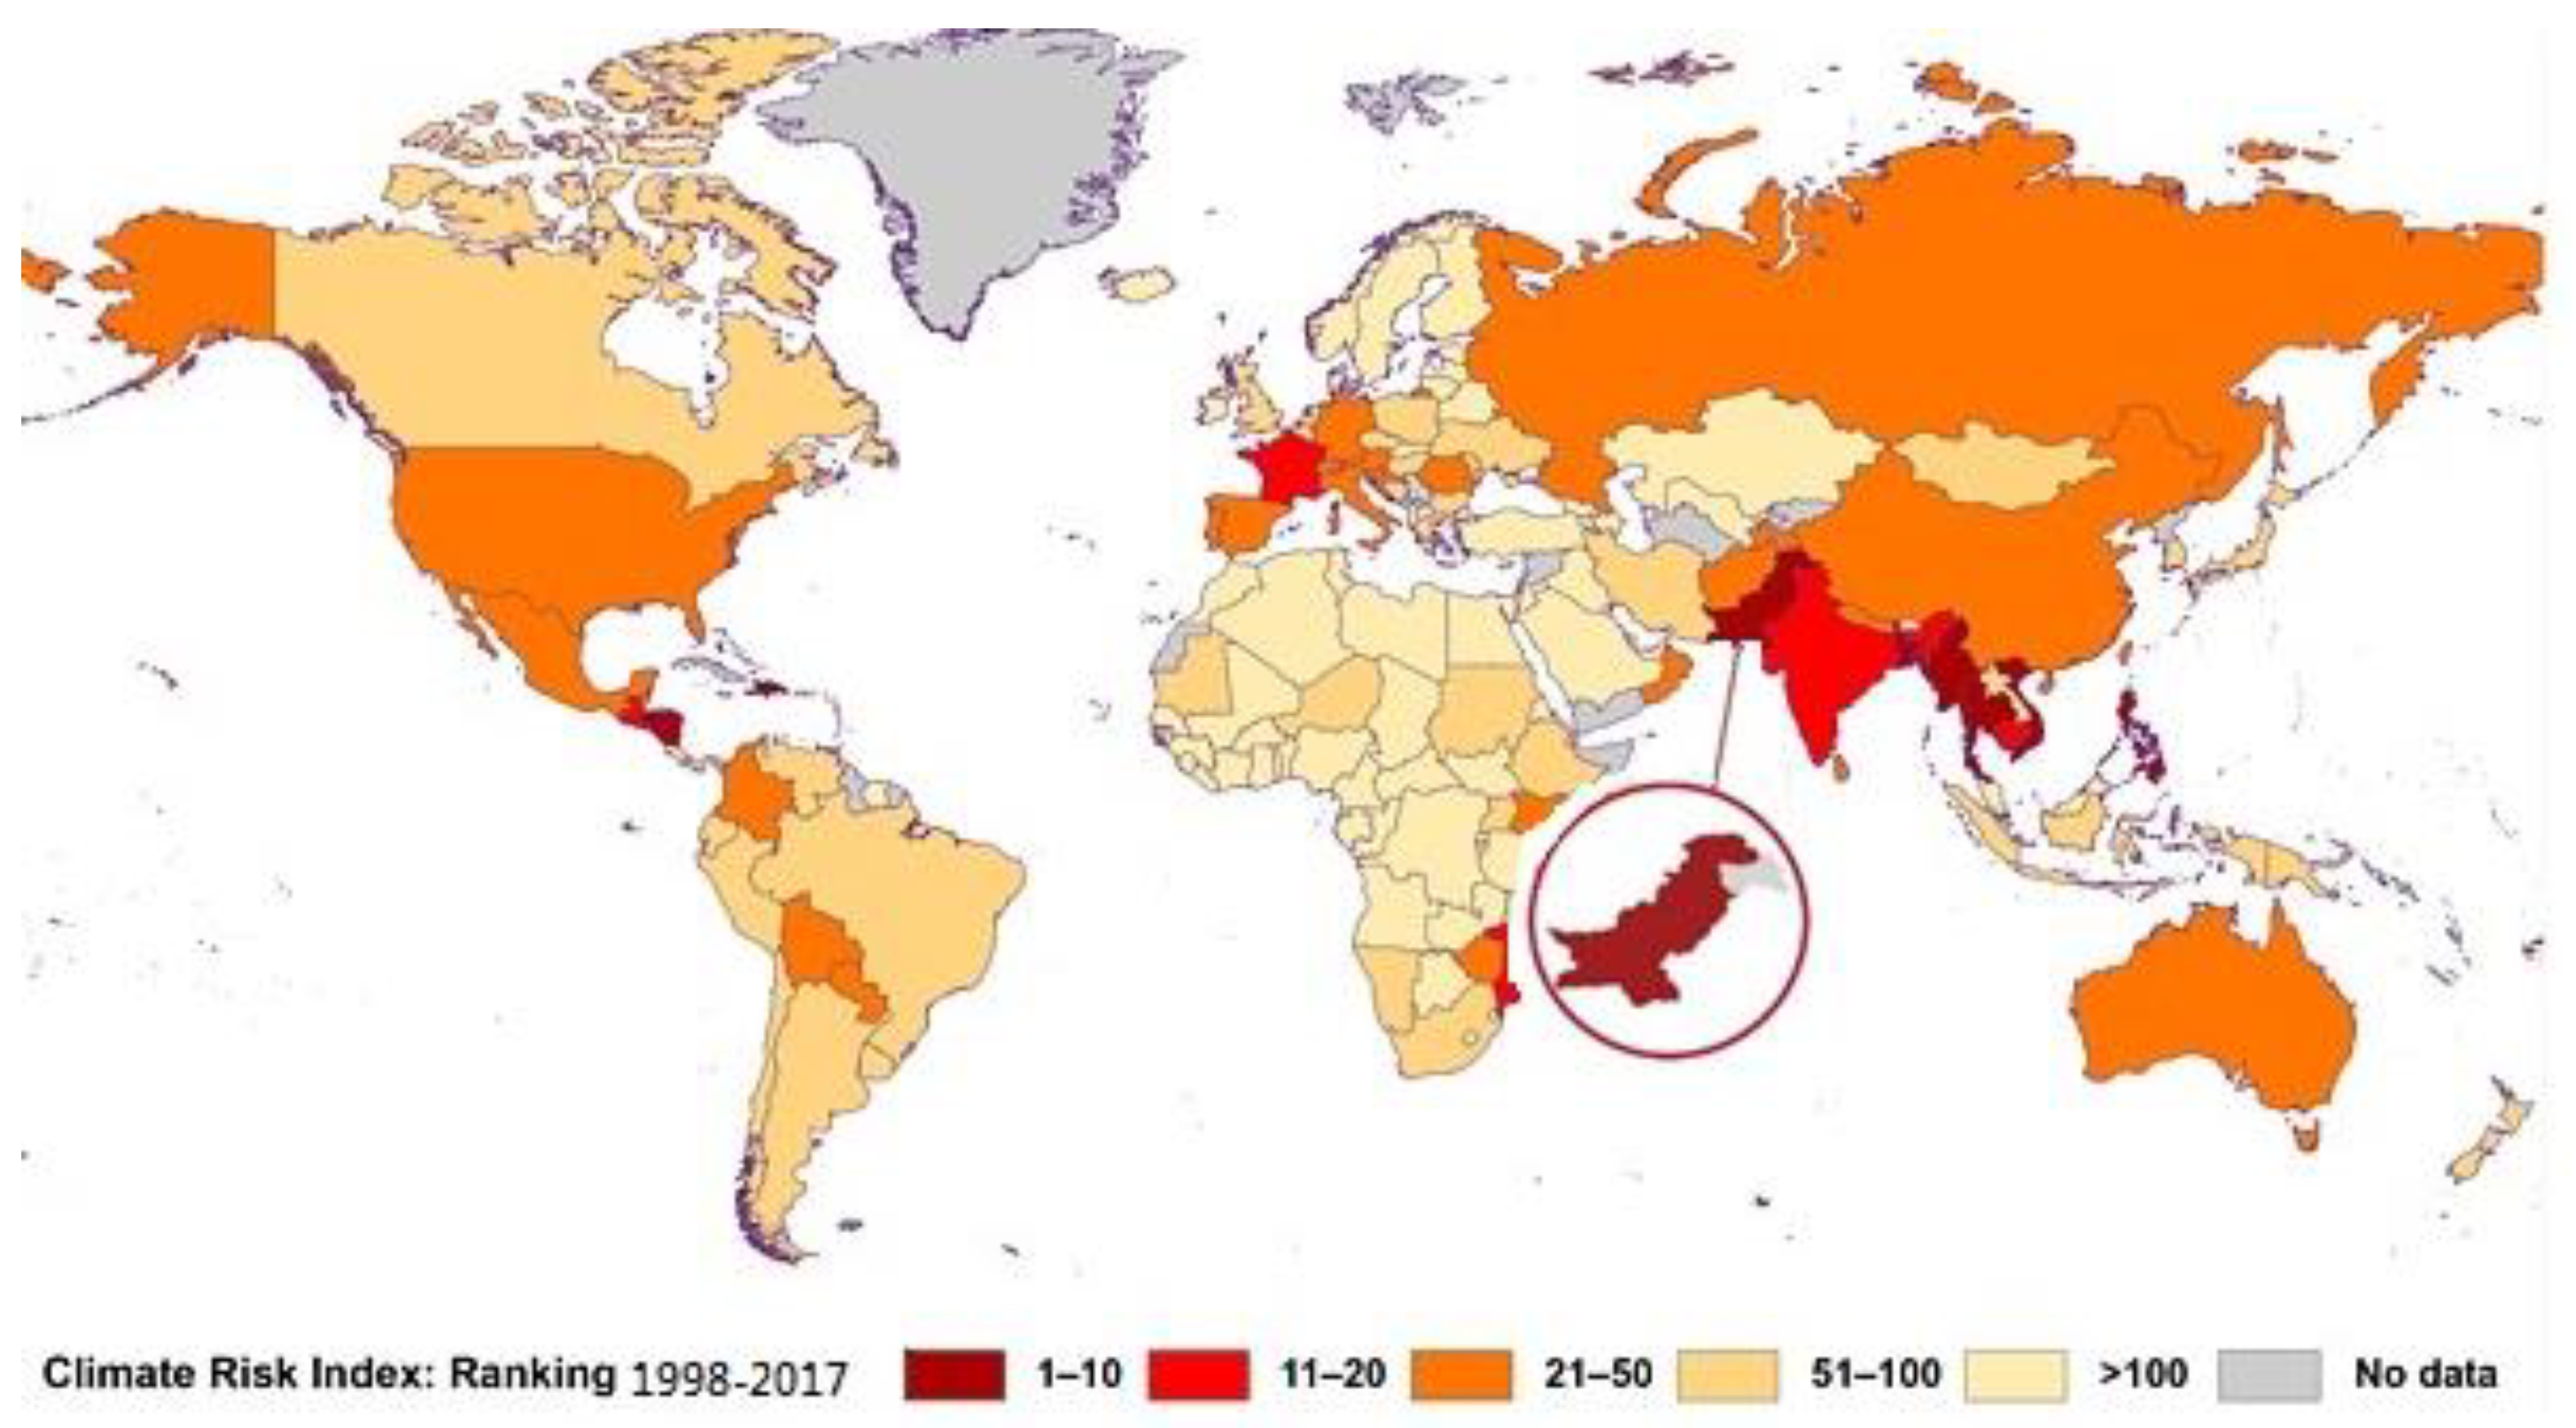
Pakistan has been identified as one of the most vulnerable countries to climate risks and broader hazards in Asia [
1,
11]. It has also been ranked highly in the Climate Vulnerability Index of 2019—ranking 8th among the ten most-affected countries by extreme weather events between 1997 and 2016 [
12], as shown in
Figure 1.
Managing risks by adopting risk management strategies (RMS) to reduce losses is a common practice in the farming community [
1]. The inappropriate adoption of RMS can potentially lead to diminishing savings, selling of assets, and deterioration of livelihood conditions [
13]. To adopt appropriate strategies, farmers need an appropriate approach toward the risks. In different studies, researchers have examined that farmers adopt different RMS to cope with risks. They also analyzed the impact of important variables on the adoption of these RMS. For instance, Ref. [
14] conducted a study and found that Pakistani farmers typically adopt precautionary savings, credit, and diversification for coping with risks. Ref. [
15] found that farmers in Indiana and Iowa use forward contracting, spreading sales, and crop insurance as risk coping tools. Ref. [
16] found that farmers in Ghana, Africa are more likely to adopt on-farm and off-farm diversification to cope with risks. Ref. [
17] examined that farmers in Alabama and Florida, USA, consider diversification, market information, spreading sales, crop insurance, maintaining feed and financial reserves as important risk management strategies. Similarly, Ref. [
18] studied that Dutch farmers adopt commercial and on-farm insurance to protect themselves from risks related to agricultural activities. Ref. [
19] examined factors affecting farmers’ choices to adopt on-farm, off-farm, on-farm agriculture, and on-farm non-agricultural diversification in the German region North Rhine-Westphalia. In the above studies, researchers have analysed factors that affect the adoption of these strategies, including age, education, risk-aversion, risk perception, farm size and off-farm income, farm location, debt to equity ratio etc.
However, in several other studies, researchers have carried out studies in which they found sociodemographic factors that affect farmers’ risk perception and risk attitude. Refs. [
20,
21,
22,
23,
24]. These studies found several sociodemographic factors significantly affect farmers’ risk perception and risk attitude. Risk perception and risk attitude are important determinants of farmers’ behaviour that could have a direct effect on the farmers’ decision, or indirect as a mediated factor between sociodemographic factors and farmers’ decision-making behaviour. Thus, it is important to consider both the approaches in which psychological factors are involved in direct and indirect relation to understanding farmers’ risk behaviour [
25] and the decision they make under risky and uncertain situations [
26].
In this study, we take a methodical approach that entails three methods to assess the relationship between farmers’ psychological factors, sociodemographic factors and the choice to adopt risk management strategies. In the first method, we examine the association between risk perception and risk attitude with the adoption of risk management strategies. In the second method, we examine the direct and indirect impact on socioeconomic factors affecting the adoption of risk management strategies mediated via farmers’ risk perception and risk attitude. In the final method, we examine the impact of socioeconomic factors together with farmers’ psychological factors on the adoption of risk management strategies.
2. Materials and Methods
2.1. Sampling Framework/Methodology
To investigate factors that affect farmers’ choice to adopt risk management strategies, we collect primary data from farmers via face-to-face interviews. For that purpose, data were collected from farmers from four districts of the Khyber-Pakhtunkhwa (KP) province of Pakistan via a multistage sampling technique.
We randomly selected four districts in the first stage. In the second stage, union councils were randomly selected. In the third stage, villages were again randomly selected. A total number of farmer households were identified from each village, and then through Yamane’s formula, a total sample size of farmers was selected, i.e., , that gives us a total of 382 farmers.
A proportional number of farmers were selected from each village using the proportional allocation method, and a total of eight villages were selected.
where:
= Number of Sampled farming households (HH) in each village
= Village index
n = Total Sample Size (farming HH)
N = Total Number of farming HH in the Research Area
= Total Number of farming HH in ith village
The proportional sampling allocation technique used for villages and farming households is given in
Table 1:
For the data collection from sample households, a comprehensive questionnaire was designed. A pilot study was carried out to detect any difficulties, ambiguities or misunderstandings that participants may encounter during the interview. After the pre-test, a refined questionnaire was finalized and then used for interviewing the farmers.
2.2. Assessment of Farmers’ Risk Perception
The risk matrix used to obtain farmers’ risk perception regarding weather-related risks is given in
Figure 2. To obtain scores for the incidence of the weather-related risks, farmers in the study area were asked to reveal the number of years out of the following ten years, do they expect that there will be flood/hail/storm/drought/heavy rains that can affect their income from farming. The number of years was grouped into five categories, i.e., 0–2, 3–4, 5–6, 7–8, and 9–10. The answers of the respondents were circled/ticked in the appropriate box provided in the table. The five categories of 10 years likelihood were given a scale of 5—ranging from a very low likelihood to a very high likelihood, i.e., from 0–2 was given a scale of 1(very low), from 3–4 was given a scale of 2 (low), from 5–6 was scaled 3 (medium), 7–8 was scaled 4 (high), and from 9–10 was scaled 5 (very high). Similarly, the score for severity of each weather-related risk was recorded by asking the respondent to show the severity of each weather-related risk that can affect their farming activities, from a scale 1 (very low) to 5 (very high). The scale from incidence (1–5) and severity (1–5) was combined in a risk matrix and was categorized as low if the matrix score was between 2–5, and considered as high if it was from 6 to 10—as shown in
Figure 1. The risk perception for each calamity is taken as a dummy independent variable with a value 0 if the matrix score is from 1 to 5, i.e., a farmer perceives very low risk, and 1 if the matrix score is from 6–10, i.e., a farmer perceives very high risk.
For instance, two farmers were asked to indicate the incidence of the flood in the coming years and its severity (
Table 2). Farmer ‘1’ mentioned 7–8 years, i.e., scored 4, and for the severity of the flood, he scored ‘5’. Combining these two scores give us a total of 9 scores for farmer ‘1’. From the matrix, 9 is considered a perception with a high threat. Similarly, for farmer ‘2’ total score is 3, which from the matrix is a low-risk perception of the flood. The same procedure is adopted for each farmer for all the weather-related risks, i.e., flood, heavy rain, hail, storm, pest and disease, and drought.
A single variable is obtained from all the risk sources by given a value of 1, if a farmer has at least scored 1 in any of the risk sources individually, i.e., if he perceives at least one risk source as a high threat to their farming activity, and 0 otherwise, i.e., if a farmer does not perceive any of the risk sources as a threat. The variable is indicated by weather-related risks (WRR) in this study. For each risk source, farmer 1 perceives some high risks and his score in WRR is ‘1’ and for farmer 2 do not perceive any risk source as high risk, and his score for WRR is ‘0’. WRR is the explanatory dummy variable with a value of ‘1’ if the farmer perceives at least one risk source as high risk and o otherwise (
Table 3).
2.3. Assessment of Farmers’ Risk Attitude
Similarly, to obtain farmers’ risk attitude, Holt and Laury method [
27] is used, given in
Table 4. In this method, the farmers were asked to choose between the described two gambles, i.e., gamble “A” and gamble “B” provided with different outcomes with their respective probabilities. The farmers who chose from the first four options were categorized in risk-seeking attitude, those who picked option four was put in the risk-neutral category, and those who picked from option 5 to 10 were categorized in risk-averse attitude. As most of the farmers were illiterate in the study area, it was difficult for them to understand the percentages or probabilities. However, the question was demonstrated practically or by drawing in order to have a full understanding of the question and to acquire the answer that best describes their attitude. To check whether they have an understanding of the question or not, in the end, each farmer was asked the last option, which shows a certain outcome of
$2 in gamble “A” and a sure outcome of
$3.85 in gamble “B”. A rational individual will certainly opt for gamble “B. It should also be noted that the payoff amount was described in PKR (Pakistani rupees) to the farmers to avoid confusion and to keep the question as simple as possible. The Holt and Laury method was translated into local language as simple as possible and with the help of a diagram—provided in the
Supplementary Material section. With the help of the diagram and explanation in the local language, I did not encounter any problem with farmers choosing irrational choices in the last option of Holt and Laury, which was used for a rationality check.
2.4. Methods Used in the Study
Chi-Squared Tests
A chi-square test is intended to test how likely it is that the distribution of risk management strategies based on farmers’ risk attitude is purely by chance. Or another way to describe the χ2 test is to test the null hypothesis that there is a significant difference between these variables.
The null and alternative hypotheses we want to test are:
Hypothesis 0 (H0). The farmers’ risk attitude is correlated with the risk management strategies they adopt.
Hypothesis A (HA). Farmers’ risk attitude is not correlated with their choices to adopt risk management strategies.
The chi-square test is used to compare the observed and expected (estimated counts in each cell of the contingency table.
where,
= observed frequencies of
ith row and
jth column
Eij = Expected frequencies of ith row and jth column,
Whereas, Eij =, Ri is row total, Cj is column total, and n is the total sample size. The degree of freedom for the chi-square test would be (. Where ‘r’ and ‘c’ indicates the number of rows and column in the crosstabulation, respectively.
Then for the significance level,
= 0.05, we reject the null hypothesis of correlation when:
Similarly, it is expected that farmers who highly perceive weather-related risks such as flood, hail, storm, heavy rain, and pest and disease as an imminent threat to their farmer activities are most likely to adopt any of the risk management strategies to secure themselves from adverse shocks. In order to investigate whether this relationship between farmers’ risk perception and adoption strategies are actual or just by chance, we will set our null and alternative hypotheses for each risk source individually.
Hypothesis 0 (H0). The farmers’ risk perception of each risk source is not associated with the adoption of risk coping strategies.
Hypothesis A (HA). Farmers’ risk perception of each risk source is associated with the adoption of risk management strategies.
In this case, the degree of freedom for the chi-squared test would be
Then for the significance level,
= 0.05, we reject the null hypothesis of independence when:
2.5. The Strength of Association: The Cramér’s V
If we found from the chis-squared tests that there is an association between farmers’ risk attitude and perception with the adoption of risk management strategies, we can then examine the strength of this association by using Cramér’s V formula. Cramér’s V has a value between ‘0 and 1’ where 0 means no association and 1 means perfect association.
If V < 0.25 = Association is weak; V > 0.75 = strong association; 0.25 < V < 0.75 = moderate association [
28].
∅c = Cramér’s V
χ2 = Chi squared value
N = Total number of observation
k = lesser number of categories of either variable.
2.6. SEM: The Path Analysis
Many research studies have been carried out to identify farmers’ risk perception and attitude on farmers’ behaviour in risky situations. Ref. [
23] used the PLS-SEM approach to identify the impact of risk sources (namely low crop yields, fluctuating input prices, and reduction in agricultural incomes) on farmers’ risk perception. He found that severity and ability to prevent a risk are most important in forming risk perceptions. Ref. [
29] used PLS-SEM to examine how perceptions of risk and risk attitude can influence the intended decision to implement risk management strategies. They also analysed the indirect of socioeconomic characteristics of the farmers on the adoption of risk management strategies. Their study found risk-perception and attitude significantly affect farmers’ choices to adopt risk management strategies. From the indirect determinants they found age of the farmer significantly affect farmers’ risk perception. A similar study conducted by [
30] found that risk management portfolio over the last five years is associated with higher risk perception. Similarly, Ref. [
31] found that risk-aversion has a negative and significant impact on the farmers’ adoption choice of crop insurance in Italy and Poland.
After investigating the association between the farmers’ psychological factors and the adoption of risk management strategies, we will employ the SEM path model based on the previous studies discussed above to further investigate the effects of farmers’ socioeconomic characteristics on their risk perception and risk attitude and on the adoption of a risk management strategies. Furthermore, this study also examines the effect of farmers’ risk perception and attitude on the adoption of a risk management strategy. The conceptual framework is given below in
Figure 3.
Figure 3 shows the effect of socioeconomic characteristics on the adoption of risk management strategies indicated by a solid line. The dashed lines present the effect of socioeconomic and farm characteristics on the farmers’ psychological attributes. The association of the error terms for the risk-aversion and risk perception will also be observed. The construction of such effects via path analysis is based on literature. For instance, Ref. [
20] found that farmers’ characteristics and farm attributes have a significant impact on farmers’ risk perception. Farm size has a positive association with perceived risks [
26]. The level of education has a positive and significant impact on farmers’ risk perception.
Similarly, socioeconomic characteristics and farm attributes also have an influence over farmers’ risk attitudes. Age has a negative impact on farmers’ risk attitudes [
32]. The education level of the farmer has a negative impact on farmers’ risk attitudes [
33]. Ref. [
34] also has a positive impact on farmers’ risk attitudes [
35]. Farm size also has a significant impact on farmers’ risk attitudes [
36]. Ref. [
37] examined the age of farmers has a positive impact on their risk perception.
Thus, we also hypothesise that the control variables also have a significant impact on the farmers’ risk attitude and risk perception of weather-related risks. In addition, we expect a good fit model.
The path analysis is conducted to find how socioeconomic characteristics affect both the adoption of risk management strategies and the farmers’ psychological constructs. The significant impact of socioeconomic characteristics with the risk aversion, risk perception and the adoption decision would imply that these factors are the vital determinants of the farmers’ decision-making behaviour. Based on our path analysis we construct our three hypotheses.
Hypothesis 1 (H1). The socioeconomic characteristics significantly affect farmers’ risk perception and risk attitude.
Hypothesis 2 (H2). The socioeconomic characteristics significantly affect the adoption of risk management strategies.
Hypothesis 3 (H3). The risk perception and risk attitude significantly and positively affect farmers’ choices to adopt risk management strategies.
Hypothesis 4 (H4). There is a significant association between farmers’ risk perception and risk-averse attitude.
The socioeconomic characteristics and farm attributes could affect the farmers’ choices to adopt risk management strategies indirectly via risk perception and risk attitude. In that case, we would analyse the direct and indirect effects of socioeconomic characteristics on the adoption of risk management strategies. Moreover, we would also be interested in analysing the direct impact of farm and socioeconomic characteristics along with risk perception and risk attitude on the probability to adopt risk management strategies. For estimation, we use the probit model discussed in the following section.
2.7. Probit Model Estimation
Different studies have used the sociodemographic factors of the farmer as direct determinants of their decision-making behaviour. These variables are age of the farmer [
16,
17,
18,
19,
20]; farmers’ experience [
38,
39,
40]; education level of the farmer [
34,
40]; farm size include the studies of [
41,
42,
43]; off-farm income [
39,
40,
44]. These studies have found a significant impact on the probability of farmers’ choices. Thus, in our study, we will use these variables together with the risk perception and risk attitude of the farmer.
The dependent variable is categorical, and therefore we use binomial probit estimation.
where
is the commutative distribution function of the standard normal distribution. ‘y’ is the dichotomous dependent variable,
x is a vector of explanatory variables, and
and
are the unknown parameters estimated by the maximum likelihood method.
Equivalently the above equation can also be written as:
For three strategies, we construct three models in the form
In each model, we will also include the endogenous variables as an explanatory variable, i.e., we will examine the impact of one RMS on the adoption of another strategy. It tells us whether the strategies are complements or substitutes to each other—additional information that we would extract from the given data.
We can also estimate the marginal effects in the probit model for a continuous variable as:
is the standard normal density function.
For a binary independent variable ‘’, i.e., ∈ {0, 1}, the marginal effects are calculated by setting other covariates at their mean values and then finding the difference in when ‘’ increases from to . This difference is the marginal effect for the discrete variable.
3. Results and Discussion
Table 5 presents summary statistics of the socioeconomic characteristics of the farmers in the study area.
We can see in the last row of
Table 5 and
Table 6 shows the Cronbach’s alpha ‘
α’ for the composite score of weather-related risks and risk attitude of farmers, respectively. The alpha score of 0.725 for WRR and 0.786 for risk attitudes indicates, as a rule of thumb, that the items used for measuring WRR and risk attitude have acceptable internal consistency [
45,
46]; thus, we can support our findings based on these variables.
Moreover,
Table 4 shows that the majority of the farmers are risk-averse, as around 74% of them are risk-averse, 12% are risk-neutral, and about 14% of them are risk-seekers. The distribution of the risk-aversion, based on the Holt and Laury method
Table 4, is given in
Figure 4. The majority of the farmers in the study area are high-risk averse, followed by moderate risk-averse and slightly risk-averse, respectively.
Table 5 shows that, on average, farmers in the study area have primary level education. The farmers with maximum education level are master’s degree holders, and the minimum level is illiterate. Similarly, farmers in the study area have on average approximately 25 years of farming experience, with a maximum experience is 65 years and a minimum is 30 years.
To cope with risks, farmers have to find ways to protect themselves from the decision taken today without knowing what may happen tomorrow. Risk management strategies are used by the farmers to mitigate the chance of “bad” outcomes occurring [
47]. In the study area, the farmers were asked an open-ended question to identify the risk management strategies adopted to cope with risks.
In the study area, farmers who used credit reserve, diversification and accumulated assets as risk management strategies were assigned the value ‘1’ if a farmer adopts a particular risk management strategy and ‘0’ otherwise.
Summary statistics for the farmers’ choice to adopt risk management strategies are provided in
Table 7. The table shows that the majority of farmers, i.e., around 56%, have adopted diversification as a risk management strategy. Similarly, 43% and 41% of farmers in the study area have adopted credit reserve and accumulated assets, respectively. Crop insurance and futures contracts were the least chosen options among the farmers to mitigate risk. Crop insurance is a formal and government-supported program for farmers to cope with risk, but the farmers in the study area were either unaware of the scheme or not in favour of adopting it as a risk management tool. This is because most of the farmers believed that crop insurance scheme also involved interest rates, which is not followed by farmers due to religious reasons. As not followed by farmers, crop insurance and futures contracts have been removed in the following analysis.
3.1. Results from the Chi-Squared Tests
3.1.1. Association between Farmers’ Risk Attitude and the Adoption Strategies
The Cross-tabulation method is used to quantitatively analyze the relationship between farmers’ risk attitude and their choice to adopt risk management strategies at the farm level to cope with weather-related risks.
Since we computed
= 111.55, [df
= 0.05], which is greater than
= 12.59, we conclude that farmers’ adoption decision is associated with the farmers’ risk attitude behaviour, which implies that it is unlikely to have occurred by chance (
Table 8). The result implies that there is a statistical association between farmers’ risk attitude and their choices to adopt risk management strategies.
The size of the association between farmers’ risk attitude and the adoption of risk management strategies, V value is given as:
3.1.2. Association between Farmers’ Risk Attitude and Their Adoption Decision
The Chi-squared tables, which represents the actual and estimated values of a weather-related risk (WRR) with respect to each risk management strategy, are described in
Table 9,
Table 10 and
Table 11.
Since we computed = 86.37 for diversification, = 28.83 for credit reserve, and = 38.19 for accumulated assets, which are greater than = 3.84, we can conclude that there are significant differences between expected values under the null hypothesis and the observed values. It implies that farmers’ perception of weather-related risks is associated with the farmers’ choice to adopt the three risk management strategies. The results suggest that it is unlikely that the adoption of risk management strategies and farmers’ high perception of the WRR has occurred by chance.
The V values for the association between risk perception of weather-related risks and the adoption of diversification, credit reserve, and accumulated assets are given as:
The association between farmers’ risk attitude and perception with their adoption decisions is moderate. The moderate association is according to our expectations because psychological factors are important determinants of farmers’ decision-making behaviour. The absence of a very strong association may be due to the fact that farmers’ risk adoption decision is not only being affected by risk perception and risk attitude, but there must also be some other variables that could contribute to the magnitude of effect on the adoption decisions. These variables could be the socioeconomic and other farm characteristics of the farmer that may also well contribute to the effect on farmers’ choice to adopt risk management strategies.
In the following section, results from path analysis are provided to examine the effect of socioeconomic characteristics and farm attributes on the adoption of risk management strategies and also on the farmers’ psychological constructs.
3.2. Results from the Path Analysis
The second last row of
Table 12 shows a highly significant correlation between weather-related risks and risk-aversion. Thus, we accept our H4 hypothesis that there is a significant association between WRR and risk-aversion.
From the results obtained in
Table 12, we can test our hypothesis established earlier. Contrary to our expectations, not all socioeconomic characteristics significantly affect the risk perception and risk attitude of the farmer. Our hypothesis 3 was set generically that comprised several farmers’ socioeconomic variables. However, from the analysis we found that farmers’ off-farm income significantly and negatively affects the risk-averse attitude of the farmer. This finding is in line with [
20,
21,
24,
48,
49,
50]. They also found a negative impact of farmers’ off-farm income on risk-averse attitudes. The less willing the farmer willing to take risks, the greater his tendency would be toward obtaining secure income from other sources to keep a financial buffer.
Moreover, our results also show that the education level and experience of farmer have a positive and negative impact, respectively, on the farmer’ risk perception of weather-related risks. The educated farmers may assess the potential threat caused by the natural calamities and may have prepared themselves to cope with these risks. Thus, they are less likely to worry about the risks and, therefore, perceive WRR as less likely. This finding is inconsistent with the studies of [
48,
49] and is in line with the findings of [
20].
The negative impact of farmers’ experience on risk perception is contrary to our expectations and the findings of [
19,
24,
51]. Farmers’ risk perception through experience with historical climate shocks induces them to adopt risk management strategies.
However, the majority of variables have an insignificant impact on farmers’ risk perception and risk attitude. Risk perception and attitude are highly individualistic factors and may be influenced by both farmer-specific and factors other than socioeconomic characteristics such as age, education level, experience in farming, farm size, number of family members, household income, wealth etc.
Some of the farmer-specific factors that affect his risk perception and risk attitude are observable, such as age, education level, experience in farming, farm size, number of family members, household income, wealth etc., whereas other factors are highly-individualistic and may not be directly observable such as cognitive ability, patience, financial strain, depression, perceived economic hardship, receptiveness to advice etc. Other factors that are usually common to the farmers and affect their risk perception and risk attitude include climate, geographic location, social and economic conditions, government policies related to agriculture, form and types of risk management strategies, etc. Therefore, It is not evident to elucidate and quantify the complex relations between farmers’ characteristics and their risk attitude and risk perception [
52].
In the SEM path analysis, we observed the indirect effect of socioeconomic characteristics of the farmer via risk perception and risk attitude on the adoption of risk management strategies. However, we are also interested in examining the direct effect of risk perception and risk attitude along with socioeconomic factors on the adoption of RMS. For that purpose, we use the probit model discussed in the following section.
3.3. Results from Probit Model Estimation
Table 13 shows the marginal effects of the covariates on the probability to adopt each risk management strategy. The results for each strategy are obtained by individual probit model.
3.4. Results Interpretations from Probit Model
The results show that risk perception of weather-related risks and risk aversion significantly and positively affect farmers’ choices to adopt the available risk management strategies, and thus, we accept our H3. We also accept H2 that socioeconomic characteristics significantly affect the adoption of risk management strategies. The table also shows the probability to adopt each risk management strategy by farmers. On average, the probability of adopting diversification is 56% compared to accumulated assets and credit, which are 40% and 36%, respectively.
The positive impact of farmers’ experience on the adoption of credit reserve is consistent with the findings of [
52,
53] and is contrary to the findings of [
14,
42]. It implies that the experienced farmer comprehends better how to utilize available resources effectively and thus, can increase their farm productivity. Increasing farm productivity will reduce the farm leverage and thus, would make the farmer obtain credit in future in case of emergency.
The positive impact of education level on the adoption of credit reserve is in line with our expectations and with the findings of [
14,
36,
38,
49]. The more educated the farmer is, the more he would understand the technicalities associated with the adoption of that strategy and the financial risk involved with it. Therefore, he would be confident in adopting the strategy relative to his uneducated counterpart.
As expected, risk perception and risk-aversion have a positive and significant impact on the adoption of all three risk management strategies, which is consistent with the adoption of almost all the available strategies. This finding is consistent with [
14,
19,
53,
54,
55,
56,
57,
58]. In their studies, they examined the positive impact of farmers’ risk perception and/or risk-averse attitude on the adoption of risk management strategies.
Table 13 also shows the impact of one risk management strategy on the other. The positive and significant impact of diversification on credit (and vice versa) implies that the two strategies are complements. A farmer may need to diversify their income to generate more income to pay off the loan and make themselves available for future credit instantly in case of emergency. In contrast, accumulated assets and diversification have a negative and significant impact on each other which makes them substitutes. Subsistence farmers may allocate their limited resources in the adoption of one strategy over another strategy, and thus, may trade-off between the adoption of diversification and accumulated assets.
From
Table 13, we observed that the marginal effect of the psychological factors, i.e., risk perception and risk-aversion, are relatively greater than the other covariates for each risk management strategy. The impacts are also highly significant, indicating the importance of these factors on the farmers’ behaviour in decision making during uncertainty.
3.5. Value Added-Information
In this study, we also provide the impact of the squares of the covariates on the adoption of risk management strategies for probit model as shown in
Table 14. The inclusion of the quadratic terms indeed provides an explicit view of the impact of the variables when we obtain more units of these variables. It is used to understand the effect of age, education level, farm size, and income changes when the farmer has more units of these variables.
The linearity in the variables that we have assumed in
Table 13, and the researchers in previous studies used, indicates that they change monotonically. However, it is possible that quadratic terms, which allows for non-linearity, may possess a non-linear relation with our target variable. From
Table 14, we observed some of the covariates with their quadratic functions significantly affect the probability to adopt risk management strategies. It implies that the additional units of adding these variables change the slope of that variable by a particular (marginal effects) percentage. For instance, farmers’ experience in
Table 13 indicates that it increases with the increase in farming experience by one unit. However, if we continue to increase units of farming experience, at a maximum point, it will start decreasing—as shown by a negative and significant marginal effect of the quadratic farming experience in
Table 14. The inflecting point can be measured by
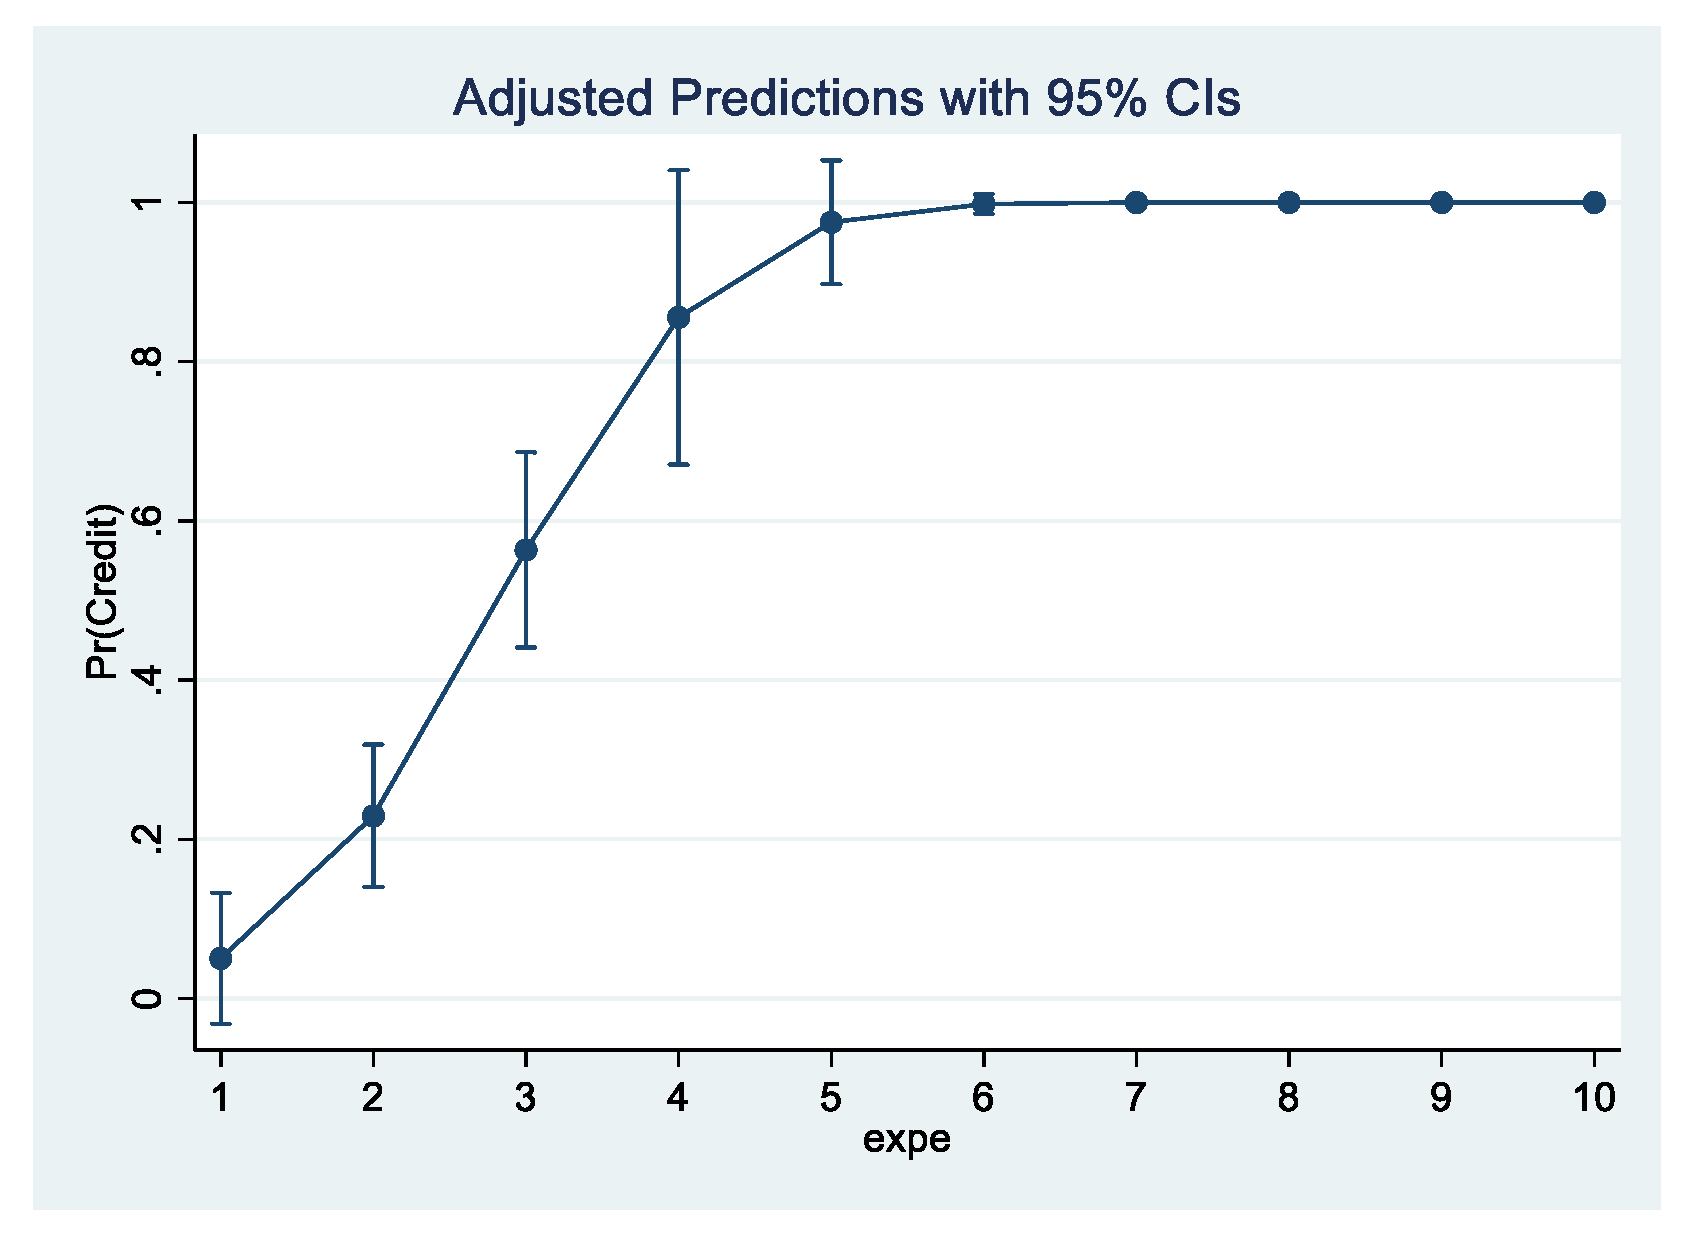
, i.e., we identify the turning point of the curve where it changes the sign. It is interpreted as the probability to adopt credit reserve increases by 90% with an additional unit increase in farming experience. However, the slope decreases by 10% when we continue to increase units of farming experience. This change from increase to decrease occurs at farming experience at 42 years. It can also be seen from the graph given below.
Figure 5,
Figure 6 and
Figure 7 represents the non-linear effect of education level, farming experience, and farm size on the adoption of credit as a risk management strategy.
Similarly, the quadratic impact of education level and farm size on the adoption of credit reserve are significant and show the turning points from increase to decrease in the slop at 8 years and 14 acres, respectively.
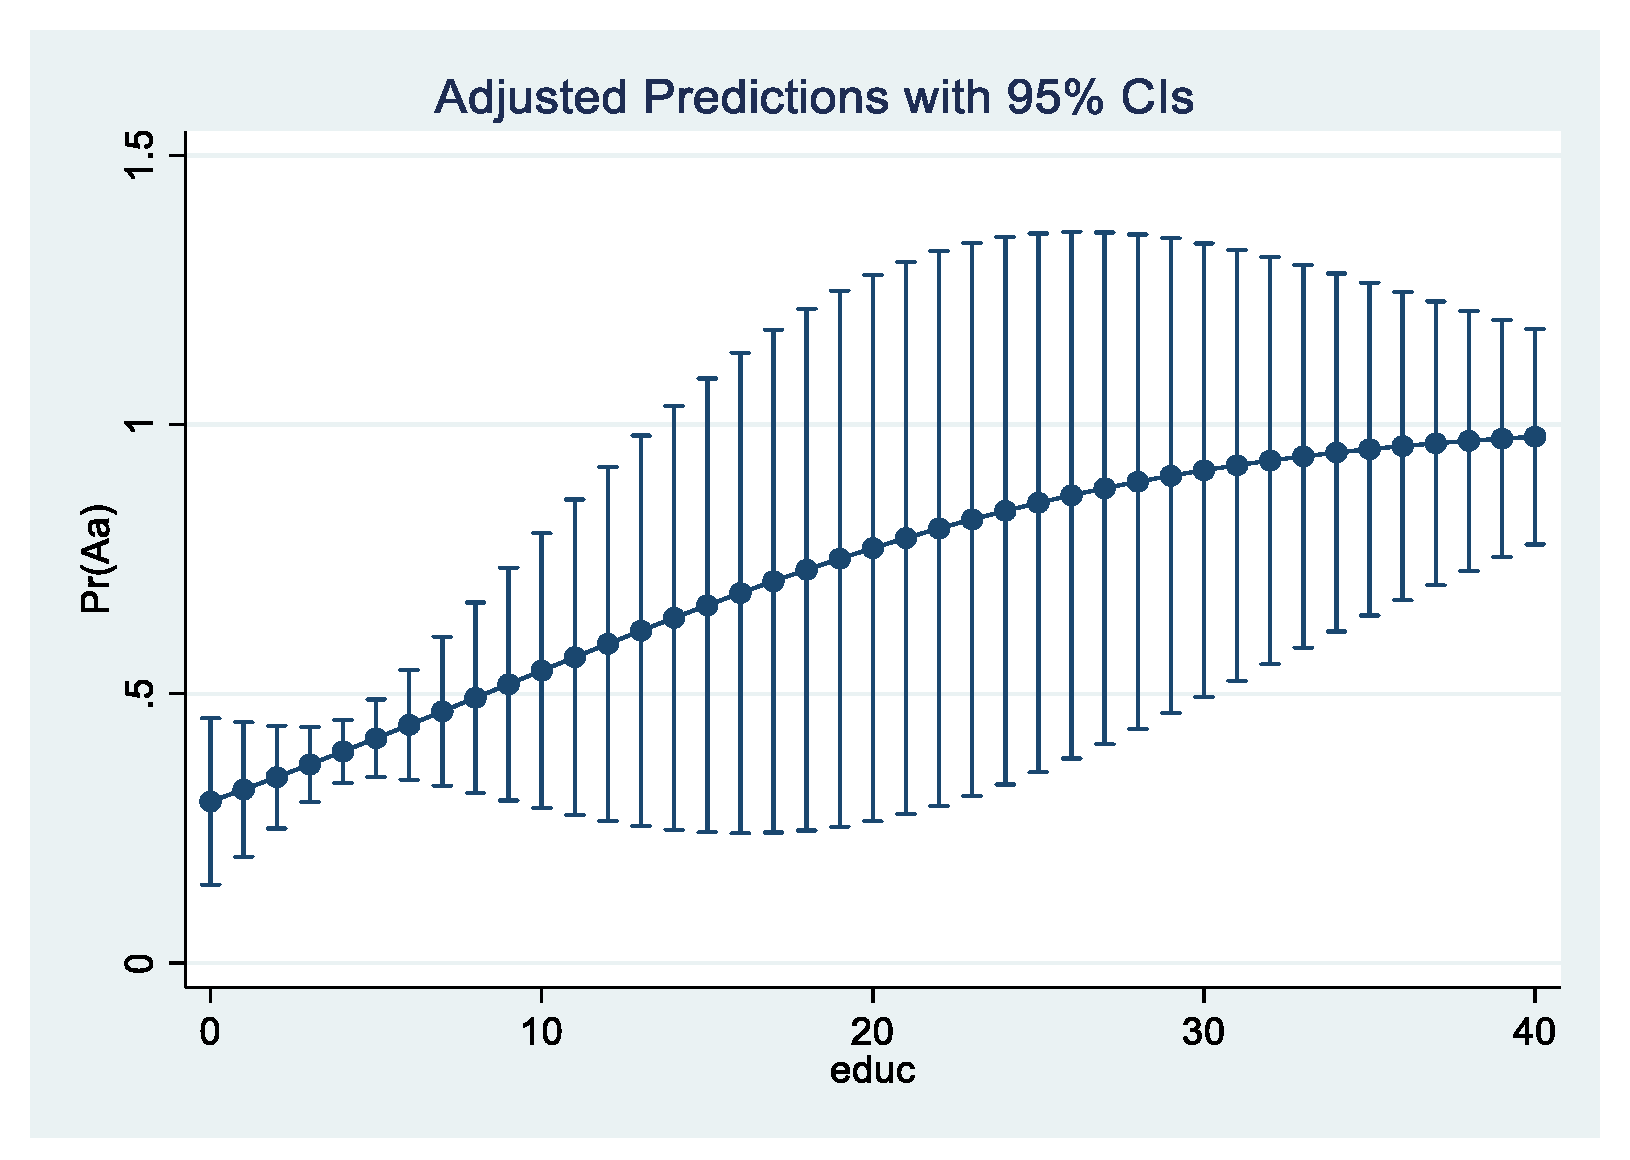
The graphs provided in
Figure 8,
Figure 9 and
Figure 10 represents a significant non-linear impact of education, off-farm income, and farm size on the adoption of accumulated assets as a risk management strategy. The turning points are at approximately 3 years for education, 71 (000 PKR) for off-farm income, and 10 acres of farmland, respectively. This value-added information is useful. For instance, an increase in education shows a negative impact on the adoption of accumulated assets. The reason is that acquiring higher education may induce the farmers to avoid the traditional way of coping risks and be more inclined toward adopting advanced/latest techniques such as crop insurance schemes, future contracts etc.
Similarly, the income of the farm helps increase extra savings up to a level, and by a further increase in the income, the farmer may invest in diversifying their income via different means instead of savings.
Figure 8,
Figure 9 and
Figure 10 represents the non-linear effect of education level, off-farm income, and farm size on the adoption of accumulated assets as a risk management strategy.
4. Discussion
From the summary statistics, in general, we found that the majority of the farmers are risk-averse, followed by risk-seeker. This finding is also consistent with one of the assumptions of the prospect theory, i.e., farmers may become risk-seeker when they face loss. Therefore, farmers may be risk-averse at one point but become risk-seeker in different circumstances, such as losses.
We also present an explicit picture of risk-aversion of the farmers, i.e., the distribution of risk-aversion, which shows that farmers in the study area are mostly highly risk-averse followed by moderate and slight risk-averse. This finding is in line with [
59]. They found Polish farmers are at least a medium or high level of risk aversion. Such information could be useful for stakeholders, such as the providers of crop insurance, to set the premiums based on their risk attitudes.
We used three methods to assess the relationship between farmers’ psychological factors, socioeconomic characteristics, and the adoption of risk management strategies. From the chi2 test, we confirmed the existence of a significant association between farmers’ psychological factors and their choices to adopt risk management strategies. Moreover, from the SEM path analysis, we also found that the unobserved factors of risk perception and risk attitude are significantly high correlated with each other. It implies that several latent or individualistic factors that are unobserved to the researcher affect the farmers’ risk perception in the same way as their risk attitude. This finding, however, is contrary to the findings of [
59], in which they found that farmers’ risk aversion has little relation to the perception. However, the statistical tests of association between risk perception and risk attitude with the adoption of risk management strategies and results from the probit model, i.e., the significant impact of psychological factors on the adoption of risk management strategies, reinforce each other.
In the literature, several studies were carried out to examine the impact of farmers’ socioeconomic and farm characteristics on the farmers’ risk perception and risk attitude [
20,
26,
32,
33,
34,
35,
36]. However, due to highly individualistic and subjective factors, it is not evident to explain and quantify the complex relations between farmers’ characteristics and their risk attitude and risk perception—as indicated by [
51]. Sociodemographic factors may affect risk perception and risk attitude. Still, the results from different studies sometimes contradict each other [
60]. We carried out the SEM technique (path analysis) to examine the direct and indirect effect of socioeconomic characteristics of the farmer on the adoption of risk management strategies. We found a few socioeconomic factors affecting farmers’ risk perception and risk attitude. It was also observed by [
29] that, among others, only the age variable has an impact on the risk attitude of the farmer.
However, the direct effect of socioeconomic characteristics along with psychological factors on the adoption of risk management strategies used in the probit model estimation shows several factors significantly affects the probability to adopt risk management strategies. The low R-squared values obtained for each risk management strategy using the SEM model (
Table 12) relative to the probit model (
Table 13) also depicts a small variation in the dependent variable is explained by the socioeconomic factors. It implies that several embedded latent factors that determine farmers’ psychological factors are yet to be explored. Thus, to examine the impact of factors on farmers’ risk perception and attitude, several latent factors that are highly individualistic should be taken into account. For instance, in a study, Ref. [
61] reveal that besides socioeconomic characteristics of the farmers, several other (latent) factors also influence farmers’ decisions, such as stress and the ability to cope with stress, satisfaction with and optimism about the farming, autonomy, management attitudes, individual’s problem-solving ability, conservative attitudes etc.
From the results, we found that risk perception, risk-averse attitude, education level, farming experience, farm size, and off-farm income has a significant impact on the adoption of risk management strategies. These findings are consistent with [
29,
34,
39,
55,
56,
57,
58]. These factors are found common in most studies and, thus, are considered important determinants of the farmers’ decision-making behaviour in risky situations. Therefore, these factors should be taken into account while assessing farmers’ behaviour. Moreover, from the study, we also observed other important findings. Such as, from the probit model, we found that the impact of farmers’ risk perception and risk-averse attitude have a high marginal effect on the farmers’ probability to adopt RMS as compared to other sociodemographic factors under study.
We also examined the impact of one strategy on the adoption of another strategy which makes the strategy substitute or complements to each other. This information explained in this study has been overlooked in the previous studies. It gives us a clearer idea of how the strategies relate to each other. This information may be useful to understand if we want to know, in particular, if a farmer adopts a strategy, how likely it will affect the adoption of another strategy in which we are interested.
From the results, we found that the probability of adopting diversification is greater than credit and accumulated assets. According to [
62], diversification is a frequently used risk management strategy, and as a risk management strategy, it is an important means of reducing rural vulnerability in developing countries. The probability of adopting credit is relatively low because taking credit, on the one hand, help farmers in coping with risks; on the other hand, it involves risk, i.e., collateral and interest rate. Thus, farmers usually avoid taking credit, particularly when other alternatives are available. The probability to adopt accumulated assets is 40%, second after diversification. The reason may be that it does not involve any risk and is easy to adopt for coping risks.
Moreover, the inclusion of quadratic terms that has been mostly overlooked in the previous studies provided us with value-added information. We found a significant non-linear impact of some of the covariates on the adoption of RMS. The results show that when we increase on a unit of a particular covariate increase/decrease the probability to adopt a RMS. This is based on the assumption of linear association of explanatory and dependent variables and its changes (increases/decreases) monotonically. However, the results we obtained depicts that after an inflection point, the probability of adopting a RMS changes from its initial impact.
5. Conclusions
From the above results and discussion, it can be concluded that farmers in the study area are risk-averse. They are high risk-averse to moderate risk-averse. High-risk perception of weather-related risks and risk-averse attitude of farmers induce them to adopt alternative risk management strategies—which in the study were identified as diversification, accumulated assets, and credit reserve. These strategies were used by the farmers to cope with weather-related risks. The impact of socioeconomic factors impact on risk perception of weather-related risks and risk attitude was not according to our expectations as very few factors were found to have an impact on these psychological factors. However, the socioeconomic factors included in the study except for age, together with risk perception and risk attitude, were found to have a significant impact on the probability to adopt risk management strategies. Therefore, this study suggests considering a direct impact of socioeconomic factors of the farmer along with psychological factors to examine farmers’ behaviour in risky situations. In addition, for the indirect effect of socioeconomic factors on farmers’ behaviour via risk perception and risk attitude, several other unobserved factors need to be identified to explore this relationship more comprehensively.
In addition, as the findings suggest that strategies could be substitutes or complements and, therefore, should be considered by researchers while assessing farmers’ behaviour. This study also proposes the inclusion of the non-linear impact of socioeconomic factors on the adoption of risk management strategies to understand the impact of those covariates in the long run.


