Article

Transgenerational Effect of Drought Stress and Sub-Lethal Doses of Quizalofop-p-ethyl: Decreasing Sensitivity to Herbicide and Biochemical Adjustment in Eragrostis plana

by
Marcus Vinícius Fipke
1,
Anderson da Rosa Feijó
1,
Natália Silva Garcia
1,
Tamara Heck
1,
Vívian Ebeling Viana
1,
Franck Emmanuel Dayan
2,
Dirceu Agostinetto
1,
Fabiane Pinto Lamego
3,
Gustavo Maia Souza
4,
Edinalvo Rabaioli Camargo
1 and
Luis Antonio de Avila
1,*
1
Crop Protection Graduate Program, Federal University of Pelotas, Pelotas 96160, RS, Brazil
2
Agricultural Biology Department, Colorado State University, Fort Collins, CO 80523, USA
3
Embrapa Pecuária Sul, BR 153 Km, Bagé 96401, RS, Brazil
4
Plant Physiology Program, Institute of Biology, Federal University of Pelotas, Pelotas 96160, RS, Brazil
*
Author to whom correspondence should be addressed.
Agriculture 2022, 12(3), 396; https://doi.org/10.3390/agriculture12030396
Submission received: 9 February 2022 / Revised: 2 March 2022 / Accepted: 7 March 2022 / Published: 11 March 2022
(This article belongs to the Special Issue Herbicide Physiology and Environmental Fate)

Abstract

:
(1) Background: Eragrostis plana Ness is a invasive C4 perennial grass in South America and very adaptable to environmental stresses. Our hypothesis is that there is a transgenerational cross-talk between environmental stresses and weed response to herbicides. This study’s objectives were to: (1) evaluate if E. plana primed by drought stress (DRY), a sub-lethal dose of quizalofop-p-ethyl (QPE), or a combination of both drought and herbicide stresses (DRY × QPE), produce a progeny with decreased sensitivity to quizalofop and (2) investigate the potential mechanisms involved in this adaptation; (2) Methods: A population of E. plana was isolatedly submitted to treatments for drought, quizalofop or drought plus quizalofop for two generations. The progenies were analyzed for sensitivity to the herbicide quizalofop and performed biochemical, chromatographic and molecular analyses.; (3) Results: In the G2 generation, the quizalofop-treated CHK population had reduced stomatal conductance and increased hydrogen peroxide and lipid peroxidation. On the other hand, there was no change in stomatal conductance, hydrogen peroxide level, and lipid peroxidation in the quizalofop-treated DRY population. In addition, this population had increased antioxidant enzyme activity and upregulated CYP72A31 and CYP81A12 expression, which was accompanied by reduced quizalofop-p-ethyl concentrations; (4) Conclusions: E. plana demonstrated a capacity for transgenerational adaptation to abiotic stresses, with the population exposed to drought stress (DRY) becoming less sensitive to quizalofop-p-ethyl treatment.

Graphical Abstract

1. Introduction

South African lovegrass (Eragrostis plana Ness) is a perennial C4-grass species native to southern African savannas [1]. It was introduced in Southern Brazil as a forage species and became a rapidly invasive weed species in grassland within a few years after its introduction [2]. It is now present in more than 1,000,000 ha in Brazil’s “Pampa Biome” region [3]. Some attributes of E. plana, such as elevated tillering, high seed production, synthesis of allelopathic compounds, resilience to mechanical cultivation, competitive growth, and tolerance to several stresses, contribute to its invasiveness [4,5,6].
South African lovegrass has broad plasticity, allowing it to adapt quickly to different environments and tolerate a wide range of thermal amplitude, drought, and poor soil [2]. Under field conditions, different environmental and agricultural factors often challenge plants, including stresses from herbicides. Interestingly, remarkable similarities exist between the response mechanisms in plants affected by natural abiotic or herbicide stresses (e.g., common membrane receptors, similar signal transduction response components, production of reactive oxygen species (ROS), and detoxification mechanisms) [7,8]. The main tolerance mechanisms induced by herbicides include antioxidant enzymatic complexes such as superoxide dismutase (SOD), catalase (CAT), and ascorbate peroxidase (APX) enzymes [9,10], as well as a complex of enzymes that metabolize xenobiotics, such as cytochrome P450 monooxygenases (CYP450), glutathione-S-transferase (GST), and glycosyltransferases (GT) [11].
Quizalofop (2-{4-[(6-chloroquinoxalin-2-yl)oxy]phenoxy} propanoate) is a group 1 (acetyl-coenzyme A carboxylase or ACCase; EC 6.4.1.2) inhibitor commonly used in the management of grass weeds [12]. Grasses have a herbicide-sensitive eukaryotic form of ACCase present in both the cytosol and plastids [13]. Inhibition of ACCase enzyme in grasses causes a drastic reduction in phospholipids synthesis, disrupting membrane biosynthesis, especially in meristematic regions [14]. Additionally, ACCase-inhibiting herbicides stimulate moderate ROS production, resulting in cell membranes lipid peroxidation in sensitive plants [10,15].
Plants under abiotic and/or herbicide stress can adapt to the stressors in order to survive. Some changes caused by adaptation to stress can be transferred to future generations, allowing for adaptive transgenerational plasticity in other species [16,17]. For example, Arabidopsis thaliana plants exposed to heat stress in G0 and G1 generations and moderate temperature in the G2 generation exhibited heat-tolerant phenotypes in the G3 generation [18]. Progenies of barley plants subjected to drought had different morphology and were more tolerant to drought than progenies from parents grown under normal conditions [19]. Similarly, the progeny of Lolium rigidum plants treated with sub-lethal doses of diclofop were more tolerant to the herbicide than the parents [20].
Therefore, plants subjected to abiotic and herbicide stresses can develop mechanisms to alleviate or reduce damage caused by stressors and eventually pass this capacity to progenies. Thus, it is possible that abiotic stresses, which can stimulate antioxidant enzyme machinery, may allow E. plana progeny to be more tolerant to ACCase-inhibiting herbicides than its parents. Other resistance mechanisms to herbicides may be interconnected to part of plant stress tolerance [21]. Known mechanisms of resistance to ACCase herbicides usually involves changes in absorption/translocation, metabolism, exclusion, reduction of oxidative stress, and other mechanisms [22,23]. Mechanisms of resistance of Echinochloa crus-galli to quizalofop, for example, are related to the increased activity of GST enzymes and antioxidants [9]. The increased tolerance of Beckmannia syzigachne to quizalofop is related to the increased activity of CYP450 enzymes [24].
This paper tests whether E. plana plants primed by drought stress and/or sub-lethal doses of quizalofop-p-ethyl produce progenies with enhanced tolerance to quizalofop. We are also assessing whether the antioxidant enzyme machinery and the mechanisms of herbicide resistance could be involved in this process.

2. Materials and Methods

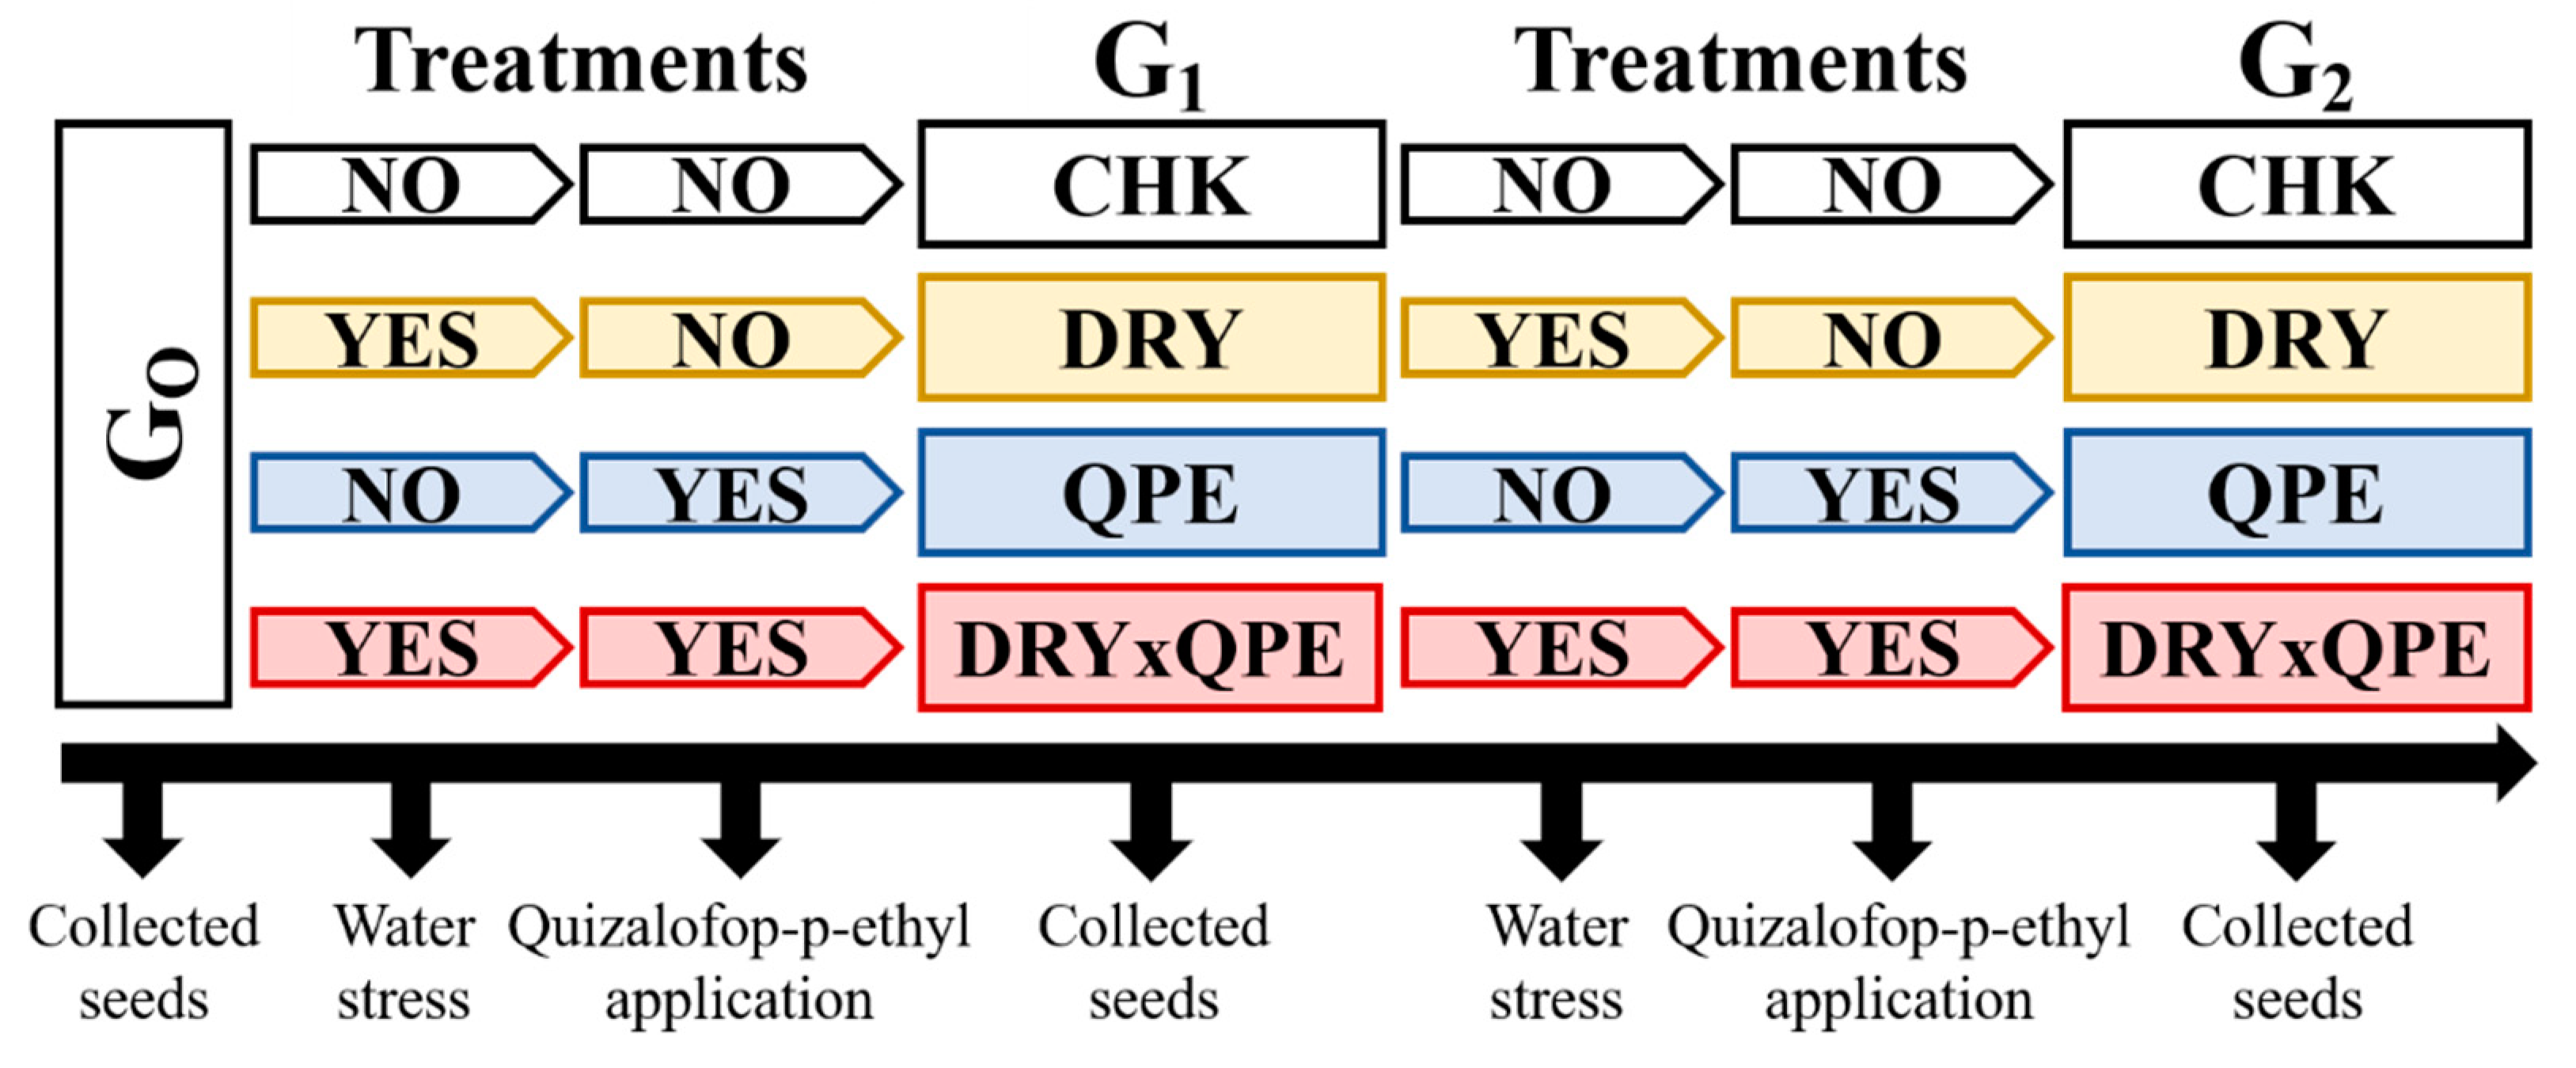
2.1. Plant Material and Establishment of the Populations

Eragrostis plana seeds were collected in an experimental field of Brazilian Agricultural Research Corporation–Embrapa located in Bagé (RS Brazil) and named G0. Populations G1 and G2 were generated under different stress conditions in the Federal University of Pelotas’ greenhouse facility in 2018 and 2019 (Figure 1). Eight plants were used in each treatment group; growth conditions and plant stress period are provided in Supplementary Material (Figures S1 and S2). The G0 population was divided into four groups, with eight plants each; growth conditions and plant stress period are provided in Supplementary Material (Figures S1 and S2). The plants of each group were exposed to the following treatments: Check (CHK-without stress-field capacity); drought treatment (DRY-water deficit until they reached 35% of stomatal conductance relative to unstressed plants); QPE treatment (received 20 g ha−1 of quizalofop-p-ethyl; DRY×QPE (water deficit until they reached 35% of stomatal conductance and after recovery, sprayed with 20 g ha−1 of quizalofop-p-ethyl). The level of drought and dose of quizalofop-p-ethyl chosen were defined in previous experiments (data not shown), aiming only at plant stress. Each experimental unity was isolated in space to avoid outcrossing among plants from other treatments. Plants from each treatment were grown to maturity, and G1 seeds were collected. G1 populations were replanted and exposed to the same treatments to build an G2 generation.

2.2. Dose-Response Curves with Quizalofop

The experiment had a completely randomized design in a factorial arrangement with six replications, with 1 L soil pots (Haplosol) units. The experiment was carried out in a growth chamber (32/28 °C temperature and 12 h photoperiod). Factor A included the different populations G0, G1 (CHK, DRY, QPE, and DRY × QPE), G2 (CHK, DRY, QPE, and DRY × QPE), and factor B consisted of increasing doses of quizalofop-p-ethyl (0, 25, 35, 50, 75, 100, 150, and 200 g a.i. ha−1). When the plants reached an average of eight tillers, the herbicide quizalofop (quizalofop-p-ethyl, IHARA, Targa 50 ECTM) was applied with a CO2 sprayer calibrated to deliver 150 L ha−1 of spraying solution. Plant injury (%) and shoot dry weight (SDW) were evaluated 35 days after application (DAA). The SDW was transformed as the percentage change compared to the plants without herbicide (%) of each population and generation to compare the populations. The experiment was repeated twice.

2.3. Physiological and Biochemical Analyses and Quizalofop-p Concentration of G2 Populations

A second experiment was carried out in a growth chamber (32/28 °C temperature and 12 h photoperiod). The experiment had four replications, and the experimental units consisted of 5 L soil pots. Factor A consisted of populations G2: CHK and DRY (more and less sensitive to quizalofop, respectively); Factor B consisted of doses 0 and 100 g a.i. ha−1 of quizalofop-p-ethyl. For the quizalofop concentration in the plants over time, Factor B was the sample times 24, 48, 96, and 144 h after quizalofop-p-ethyl application (HAA). The quizalofop dose was chosen since it allows studying the physiological state of responses to the herbicide without plants’ death. When the plants reached an average of 10 tillers, the herbicide was applied under the same conditions described above. Leaf samples (fully expanded leaves) were collected at 24, 48, 96, and 144 HAA. Samples were stored in an ultra-freezer (−80 °C). The concentration of quizalofop-p-ethyl and quizalofop-p is described in Section 2.4.1.

Variables Measured

Stomatal conductance: Stomatal conductance was measured with a steady-state porometer (model LI-1600™, Li-Cor Bioscience- Lincoln, NE, USA) at 24, 48, 96, 144, and 336 h after application (HAA). All plants were evaluated, taking measurements in the adaxial leaf face.
H2O2 content and lipid peroxidation measurement: For extraction, leaf tissues (0.25 g) were ground with 0.1% (w/v) trichloroacetic acid (TCA). The homogenate was centrifuged (12,000× g; 4 °C; 20 min), and the supernatant was used to determine H2O2 content [25]. The absorbance was measured at 390 nm and a calibration curve was obtained with H2O2 standard. For lipid peroxidation measurement, the supernatant was mixed with thiobarbituric acid (TBA), which determines malondialdehyde (MDA) content, a lipid peroxidation product. The MDA-TBA complex amount was calculated from the molar extinction coefficient (ε = 155 × 103 M−1 cm−1) [25].
Antioxidant enzymes: Leaves (0.250 g) harvested were ground into powder using 100 mM potassium phosphate buffer (pH 7.8), 0.1 mM ethylenediaminetetraacetic acid (EDTA), 1 mM ascorbic acid (AsA) and 10% (w/w) polyvinyl polypyrrolidone. Then, the homogenate was centrifuged at 12,000× g at 4 °C for 20 min, and the supernatant was used for enzyme activity measurements. The soluble protein content was determined using bovine serum albumin as standard [26].
SOD (EC 1.15.1.1) activity was estimated on nitroblue tetrazolium (NBT) photoreduction inhibition [27] in a reaction medium consisting of enzyme extract, 86.5 mM potassium phosphate buffer (pH 7.8), 14 mM methionine, 0.1 µM EDTA, 5.6 µM NBT, and 0.2 µM riboflavin. One unit of SOD activity was defined as the amount of enzyme that caused 50% inhibition of the reduction of NBT. CAT (EC 1.11.1.6) activity was assayed by measuring the initial hydrogen peroxide disappearance rate [28]. The incubation mixture contained crude enzyme extract, 100 mM potassium phosphate buffer (pH 7.0), and 12.5 mM H2O2. The measurements were recorded at 240 nm, and the enzyme activity was calculated using the molar extinction coefficient (ε = 36 µM−1 cm−1). APX (EC 1.11.1.11) activity [29] was measured using an assay mixture containing crude enzyme extract, 37.5 mM potassium phosphate buffer (pH 7.0), 0.25 mM AsA and 5 mM H2O2. The absorbance was recorded at 290 nm, and the activity of APX was calculated using ε = 2.8 mM−1 cm−1.

2.4. Concentration of Quizalofop and Molecular Analyses in G2 Populations

The third experiment was performed in a growth chamber (temperature 32/28 C and photoperiod of 12 h) in four replicates and consisted of 5 L pots filled with the sieved soil. Factor A consisted of two populations of G2 generation: CHK and DRY (more and less sensitive to quizalofop, respectively), and factor B consisted of doses 0 and 100 g a.i. ha−1 of quizalofop. For quizalofop concentration in the plants over time, the Factor B was the sample times 48, 96, 192, and 336 HAA. The application conditions were the same as for the experiment in Section 2.3. Fully expanded leaves from the upper third were collected for quizalofop-p-ethyl and quizalofop-p concentration analysis at 48, 96, 192, and 336 HAA, for gene expression analysis at 48, 96, and 192 HAA; and were kept in an ultra-freezer (−80 °C).

2.4.1. Quizalofop Quantitation

Quizalofop-p-ethyl and quizalofop-p concentrations were determined using high-performance liquid chromatography (HPLC) coupled to tandem mass spectrometry (MS/MS). First, unabsorbed quizalofop-p-ethyl were removed from the leaf surface at harvest time by immersing the treated leaves in a 10 mL wash solution (acetonitrile and 1% acetic acid) manual shaking for 1 min. For the extraction method [30], samples (1 g) were macerated with a pestle in a mortar containing liquid nitrogen and placed in 50 mL falcon tubes. For extraction, 10 mL acetonitrile (1% acetic acid) was added in tubes with samples and vortexed (1 min). Afterward, 4.0 g MgSO4 and 1.5 g NaCl were added, and tubes were shaken for 60 s, then centrifuged for 10 min at 5000 rpm; then, the supernatant was collected in a new falcon tube.
For cleanup, 4 mL supernatant was collected from falcon tubes, 600 mg MgSO4, 200 mg primary-secondary amine (PSA), and 20 mg graphitized carbon black (GCB) was added and tubes were vortexed for 1 min and centrifuged for 10 min at 5000 rpm. Then, the supernatant was collected and filtered (filter polyvinylidene fluoride (PVDF) 0.22 µm, 13 mm).
The quantitation method was developed using the HPLC-MS/MS system (Q-Exactive Focus, Thermo Scientific™, Waktham, MA, USA) equipped with a mass spectrometer (Quadrupole-Orbitrap™). For the chromatographic method, a column Accucore™ C18 (100 mm × 2.1 mm, Thermo ScientificTM, Waktham, MA, USA) was used, and a mobile phase: (A) 5 mM of ammonium formate-water (1% formic acid) and (B) methanol. The gradient used was 0 min 10% of phase B; 2.0 min 20% of phase B; 4 min 100% of phase B; and 6.6 min 10% of phase B, with a flow of 0.300 mL min−1 a total run time of 9 min. The injection volume used was 10 µL, and the column temperature was 40 °C. Quizalofop was ionized with ESI mode (source of ionization: electrospray); electrospray mode: positive; ionization energy: 20, 40 and 60 eV; capillary temperature: 320 ºC; spray voltage: 4.0 kV; sheath gas flow: 30 L h−1; auxiliary gas flow: 10 L h−1; injection volume: 10 μL, resolution: 70,000; electrospray mode: negative; ionization energy: 20, 40 and 60 eV; capillary temperature: 320 °C; spray voltage: 3.0 kV; sheath gas flow: 40 L h−1; injection volume: 10 μL, resolution: 70,000. Calibration curves were constructed using analytical standards with purity >99% (Sigma-Aldrich, St. Louis, MO, USA). The limit of quantification (LOQ) was estimated as 0.1 µg g−1 for quizalofop-p-ethyl and 0.1 µg g−1 for quizalofop-p. The method limit of detection (LOD) was 0.03 µg g−1 for quizalofop-p-ethyl and 0.03 µg g−1 for quizalofop-p. Values below LOD are considered not determined (N.D.).

2.4.2. Gene Expression

Differential expression of quizalofop-responsive genes:
The genes evaluated (Table 1) were chosen based on the literature. Increased expression of ACCase (EcACCase) is a known TSR mechanism in herbicide resistance [31]. Cytochrome P450 monooxygenases 72A31 (EcCYP72A31) and CYP81A12 (EcCYP81A12) genes were chosen because they are directly involved in metabolizing ACCase and ALS-inhibiting herbicides [32,33,34,35]. Glutathione S-transferase lambda class 2 and 3 (EcGSTL2 and EcGSTL3) genes were chosen because they are associated with the metabolism of several ACCase-inhibiting herbicides [36].
Oligonucleotides for the target genes were obtained based on the Eragrostis curvula genome available in the National Center for Biotechnology Information–NCBI [39] using aligned protein sequences from different grass species using the BlastP tool. Proteins selected for oligonucleotide design showed identity higher than 90% and e-value near 0.0. Oligonucleotides were designed using Primer3Plus software [40]. GenBank IDs of the target genes are EcACCase (TVU39489.1), EcCYP72A31 (TVU35838.1), EcCYP81A12 (TVU44904.1), EcGSTL2 (TVU47476.1), and EcGSTL3 (TVU31922.1). Actin 1 (OsACT1), 18S ribosomal RNA (Os18S), and Elongation factor 1α (OsEF1α) were used as reference genes [37,38].
RNA extraction and cDNA synthesis:
Plant tissues (three biological replicates) were macerated in liquid nitrogen, and the total RNA was extracted using the PureLink™ (Plant RNA Reagent-InvitrogenTM, Carlsbad, CA, USA) following the manufacturer’s instructions. RNA concentration and quality were assessed using NanoVue™ (GE HealthcareTM, Buckinghamshire, UK). The integrity of the RNA samples was measured using a non-denaturing agarose gel electrophoresis and stained with GelRed (Invitrogen™).
For each sample, 1 µg of RNA was treated with DNase I (Invitrogen™), and RNA samples were converted into cDNA using oligo(dT) and the SuperScript™ III First-Strand Synthesis System kit (Invitrogen), according to the manufacturer’s recommendations.
Quantification of gene expression in RT-qPCR:
Quantification of gene expression in RT-qPCR was performed using oligonucleotides for the target and reference genes (Table 1), according to MIQE Guidelines [41]. Amplification efficiency and specificity of each oligonucleotide were determined in validation experiments using four dilutions of cDNA. Oligonucleotides efficiency was between 90 and 110%, and a single peak in the dissociation curve was used to analyze gene expression quantification.
Gene expression experiments were performed on the LightCycler™ 480 Instrument II (RocheTM, Rotkreuz, Switzerland) thermocycler with three biological and three technical replicates. The reactions were performed with cDNA (1 µL) at 1:25 dilution (determined in the validation experiment), UltraPure™ DNase/RNase-Free Distilled Water (11.0 µL) (Invitrogen), ROX Reference Dye (0.25 µL) (Invitrogen), 10X PCR Buffer (2.0 µL), magnesium chloride 50 mM (1.5 µL), Platinum™ Taq DNA Polymerase (0.05 µL) (Invitrogen), dNTPs (0.2 µL), SYBR Green I (3.0 µL) (Invitrogen), and 1.5 µL of each oligonucleotide (forward and reverse) in a reaction of 20 µL in the final volume. The negative control was performed using reactions without cDNA for each oligonucleotide pair. PCR reactions were performed under the following conditions: initial denaturation at 95 °C for 5 min, 45 cycles of 95 °C for 20 s, 60 °C for 15 s, and 72 °C for 20 s in LightCycler™ 480 Multiwell Plates 96 (RocheTM, Rotkreuz, Switzerland) plates.
Gene expression was calculated with the 2^(-delta-deltaCT) method [42], using a baseline expression of the CHK population without quizalofop (0 g ha−1) at each time of collection normalized by the reference genes OsACT1, Os18S, and OsEF1α.

2.5. Statistics Analyses

Data were tested for normality and homogeneity of variance. Visual injury and shoot dry weight data were fitted with a nonlinear hyperbola and log-logistic regression model, according to Equations (1) and (2), respectively:
Y = x/(a + bx)
y = a/[1 + (x/GR50)b]
where, in Equation (1), y is plant injury as a percentage, and “a” the upper asymptotic values of Y; parameter “b” denotes the relative slope, and the parameter “x” is herbicide dose. In Equation (2), “a” is the upper limit of y, “x” is herbicide dose, “GR50” is the x value that reduces 50% of SDW, and “b” is the relative slope. The dose that caused 50% SDW reduction (GR50) and 50% plant injury (ED50) with their corresponding parameters were calculated for each treatment using a hyperbola and log-logistic model (Equations (1) and (2)).
After testing for normality and homogeneity of variance, the stomatal conductance, H2O2 content, lipid peroxidation, antioxidant enzyme activity, quizalofop-p-ethyl, and quizalofop-p concentration were subjected to analysis of variance, calculated confidence intervals (CI; 95%). For plants of the same population with and without herbicide, a t-test was performed. The statistical analysis was conducted using SAS University EditionTM (SAS Institute, Inc.TM, Cary, NC, USA) statistic program.

3. Results and Discussion

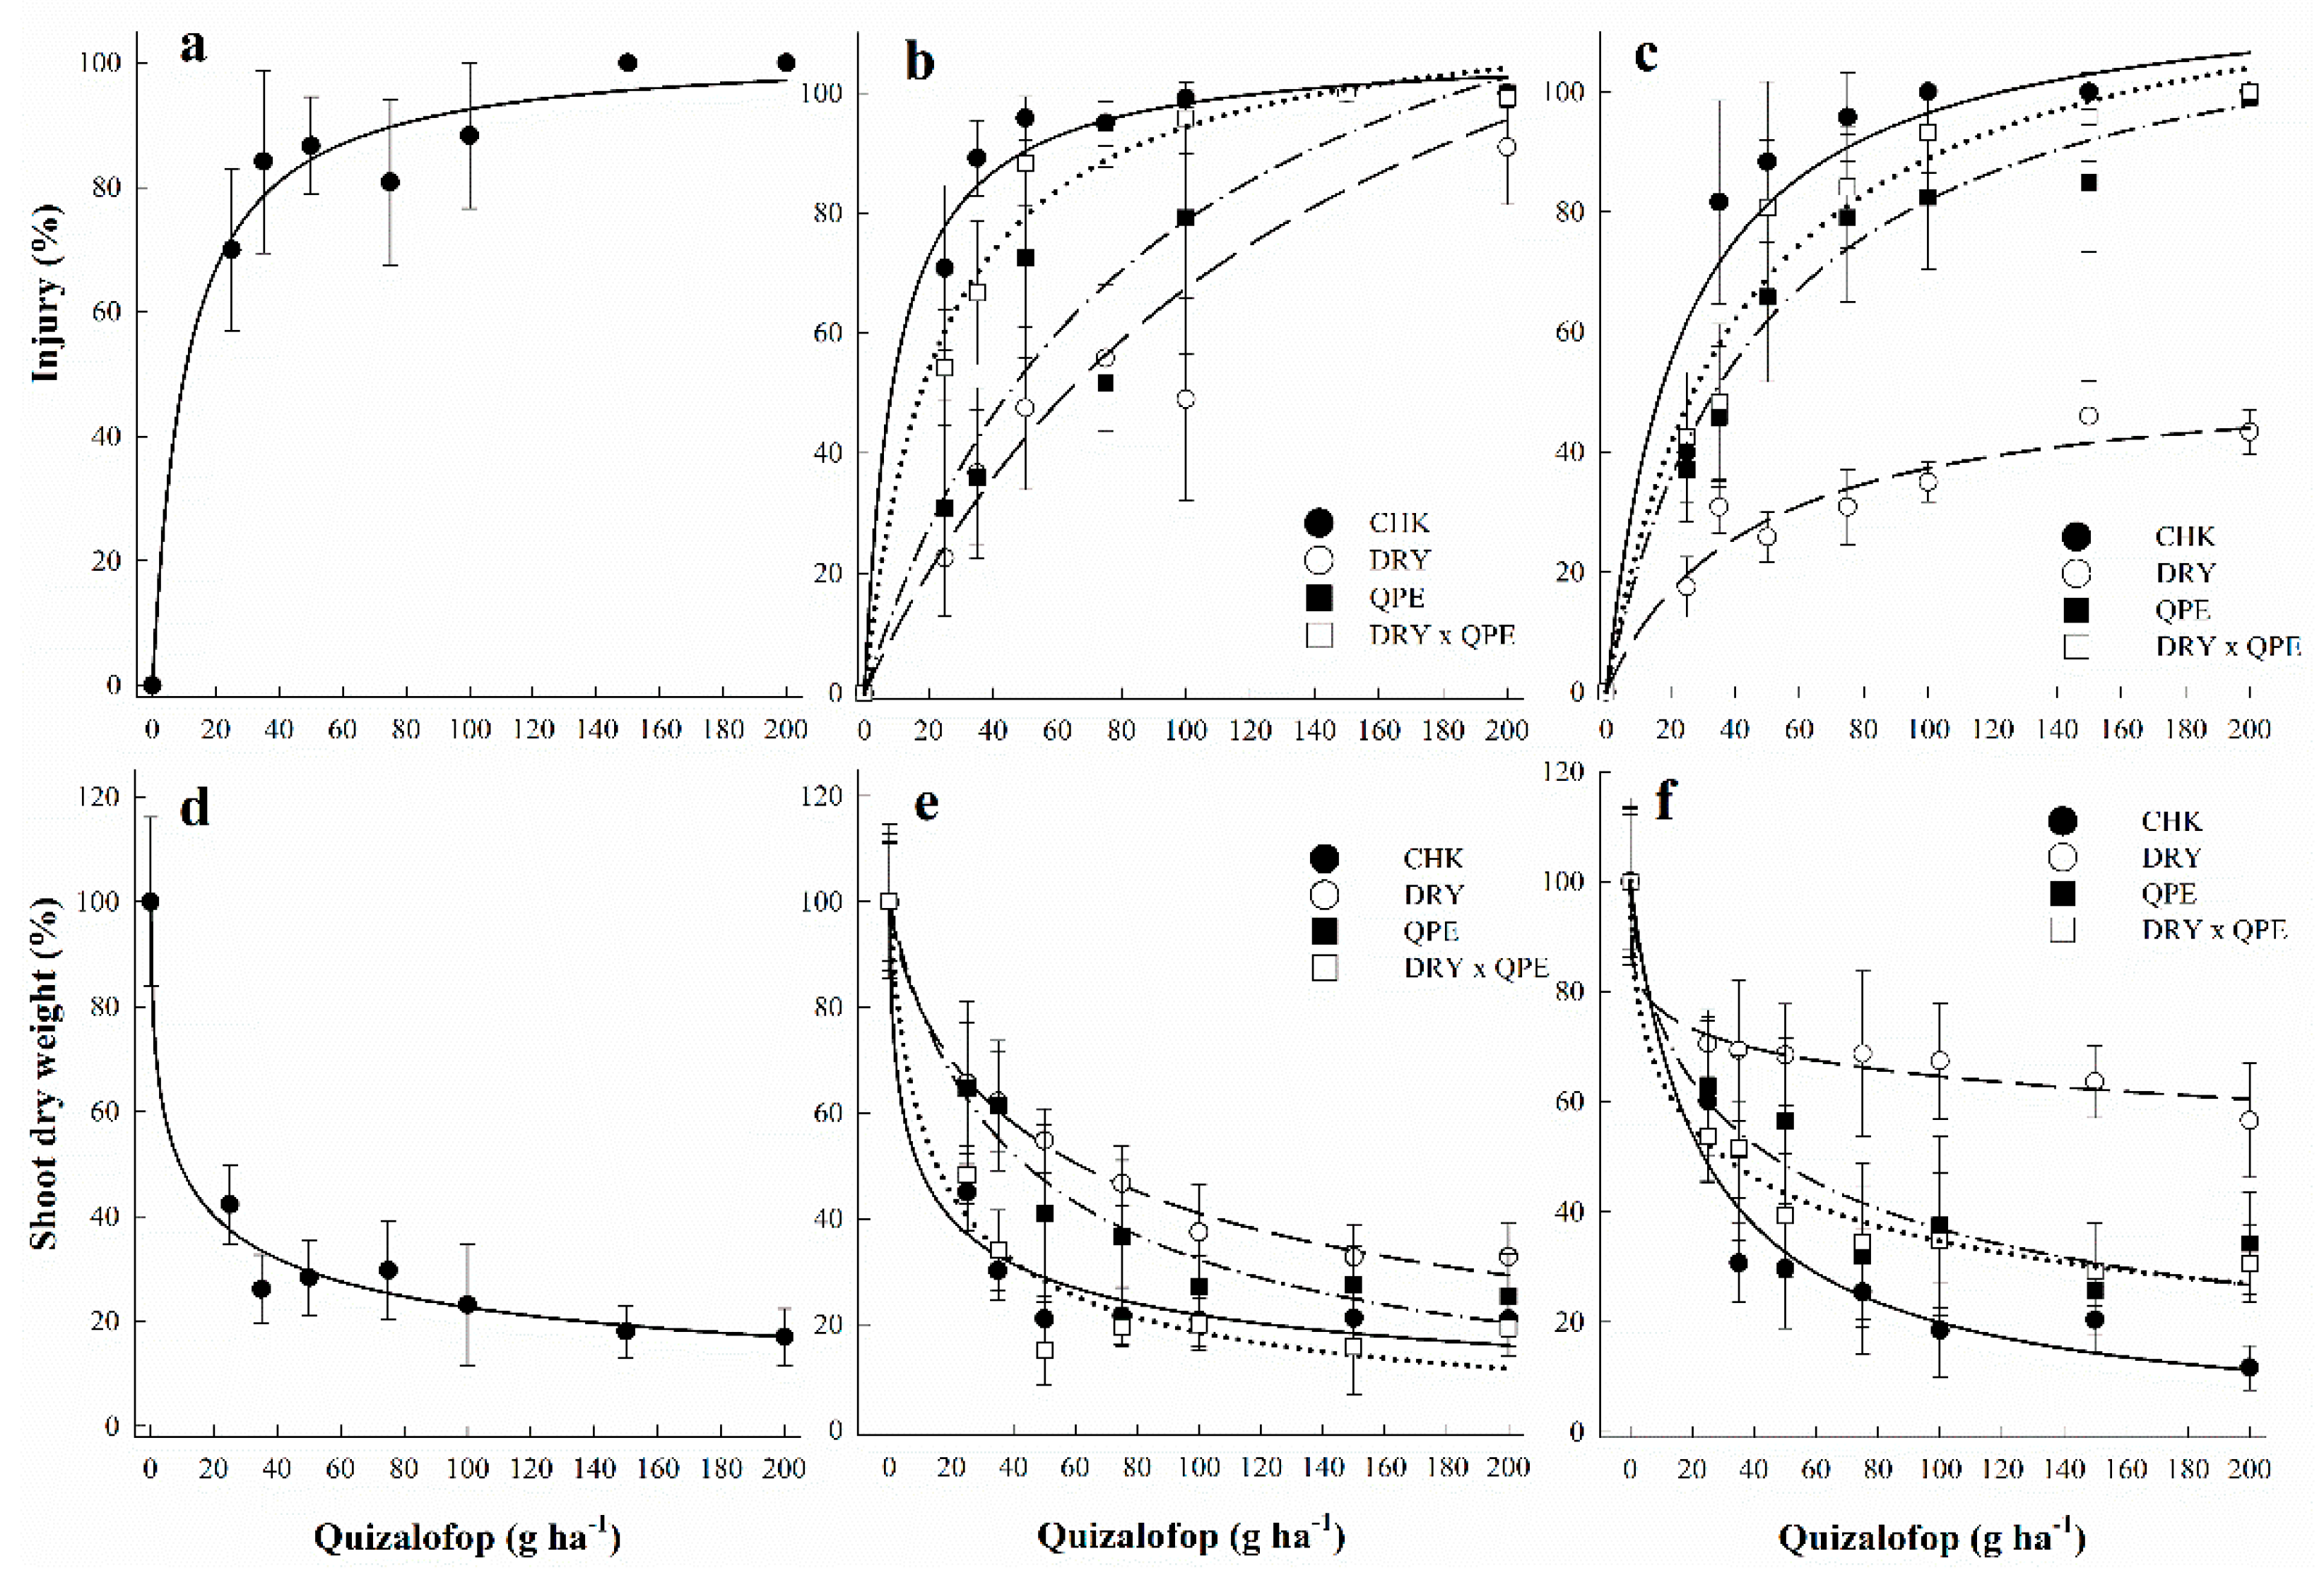
3.1. Dose-Response Curves Assessing Sensitivity to Quizalofop

Quizalofop-p-ethyl injury was dose-dependent in all E. plana generations (Figure 2). The dose of quizalofop-p-ethyl required to cause 50% plant injury (ED50) in E. plana G0 was 10.3 g ha−1 (Table 2). ED50 values in CHK populations were similar, at 10.3, 8.1, and 16.2 g ha−1 for G0, G1, and G2, respectively, confirming that there was no change in sensitivity among G0, G1, and G2 generations that were never challenged by the herbicide or drought stress. Similar results were observed for SDW, with GR50 values of 9.2, 9.4, and 23.5 g ha−1 for the CHK population (G0, G1, and G2, respectively), with no differences for the CI.
The G1 generation of all populations primed with stressors was less sensitive to quizalofop-p-ethyl than the CHK population, with ED50 values 7.70-, 5.62-, and 2.24-fold DRY, QPE, and DRY × QPE, respectively. For GR50, only DRY and QPE G1 populations differed from CHK, with a 6.54- and 4.63-fold increase in tolerance to the herbicide. The priming phenomenon occurs after previous exposure to abiotic and biotic stresses, allowing a series of faster and more efficient responses in a future exposure, making plants more resistant to similar stresses [43].
In the G2 generation, the CHK, compared with the stressed populations, only the DRY had a reduction in sensitivity to quizalofop-p-ethyl; in this population, it was not possible to calculate ED50 or GR50 values because it did not reach 50% injury, demonstrating that this population is less sensitive to quizalofop than the others, with ED50 > 12.34-fold and to GR50 in >8.51-fold. It is important to note that the DRY population received drought treatment only in the previous generations, demonstrating a possible stress memory with herbicide sensitivity. The reduction in sensitivity in the populations that suffered drought stress in previous generations is possible due to stomatal conductance regulation, which reduced absorption and translocation of herbicides, in addition to other effects [44]. Similar to the drought stress, recurrent selection with herbicide sub-lethal doses also can induce reduced sensitivity. Sub-lethal doses of diclofop in Lolium rigidum for two generations increased the tolerance of plants to the herbicide [45]. Recurrent selection with sub-lethal doses of diclofop in L. rigidum during three cycles increased LD50 by 56 times [46]. Resistance mechanisms that are not involved with alteration of the site of action are thought to be involved in this process [45,46]; for these reasons and to understand the decreasing sensitivity of DRY in the G2 generation, an experiment using only the CHK and the DRY populations was carried out trying to observe the effects of quizalofop-p-ethyl on E. plana metabolism.

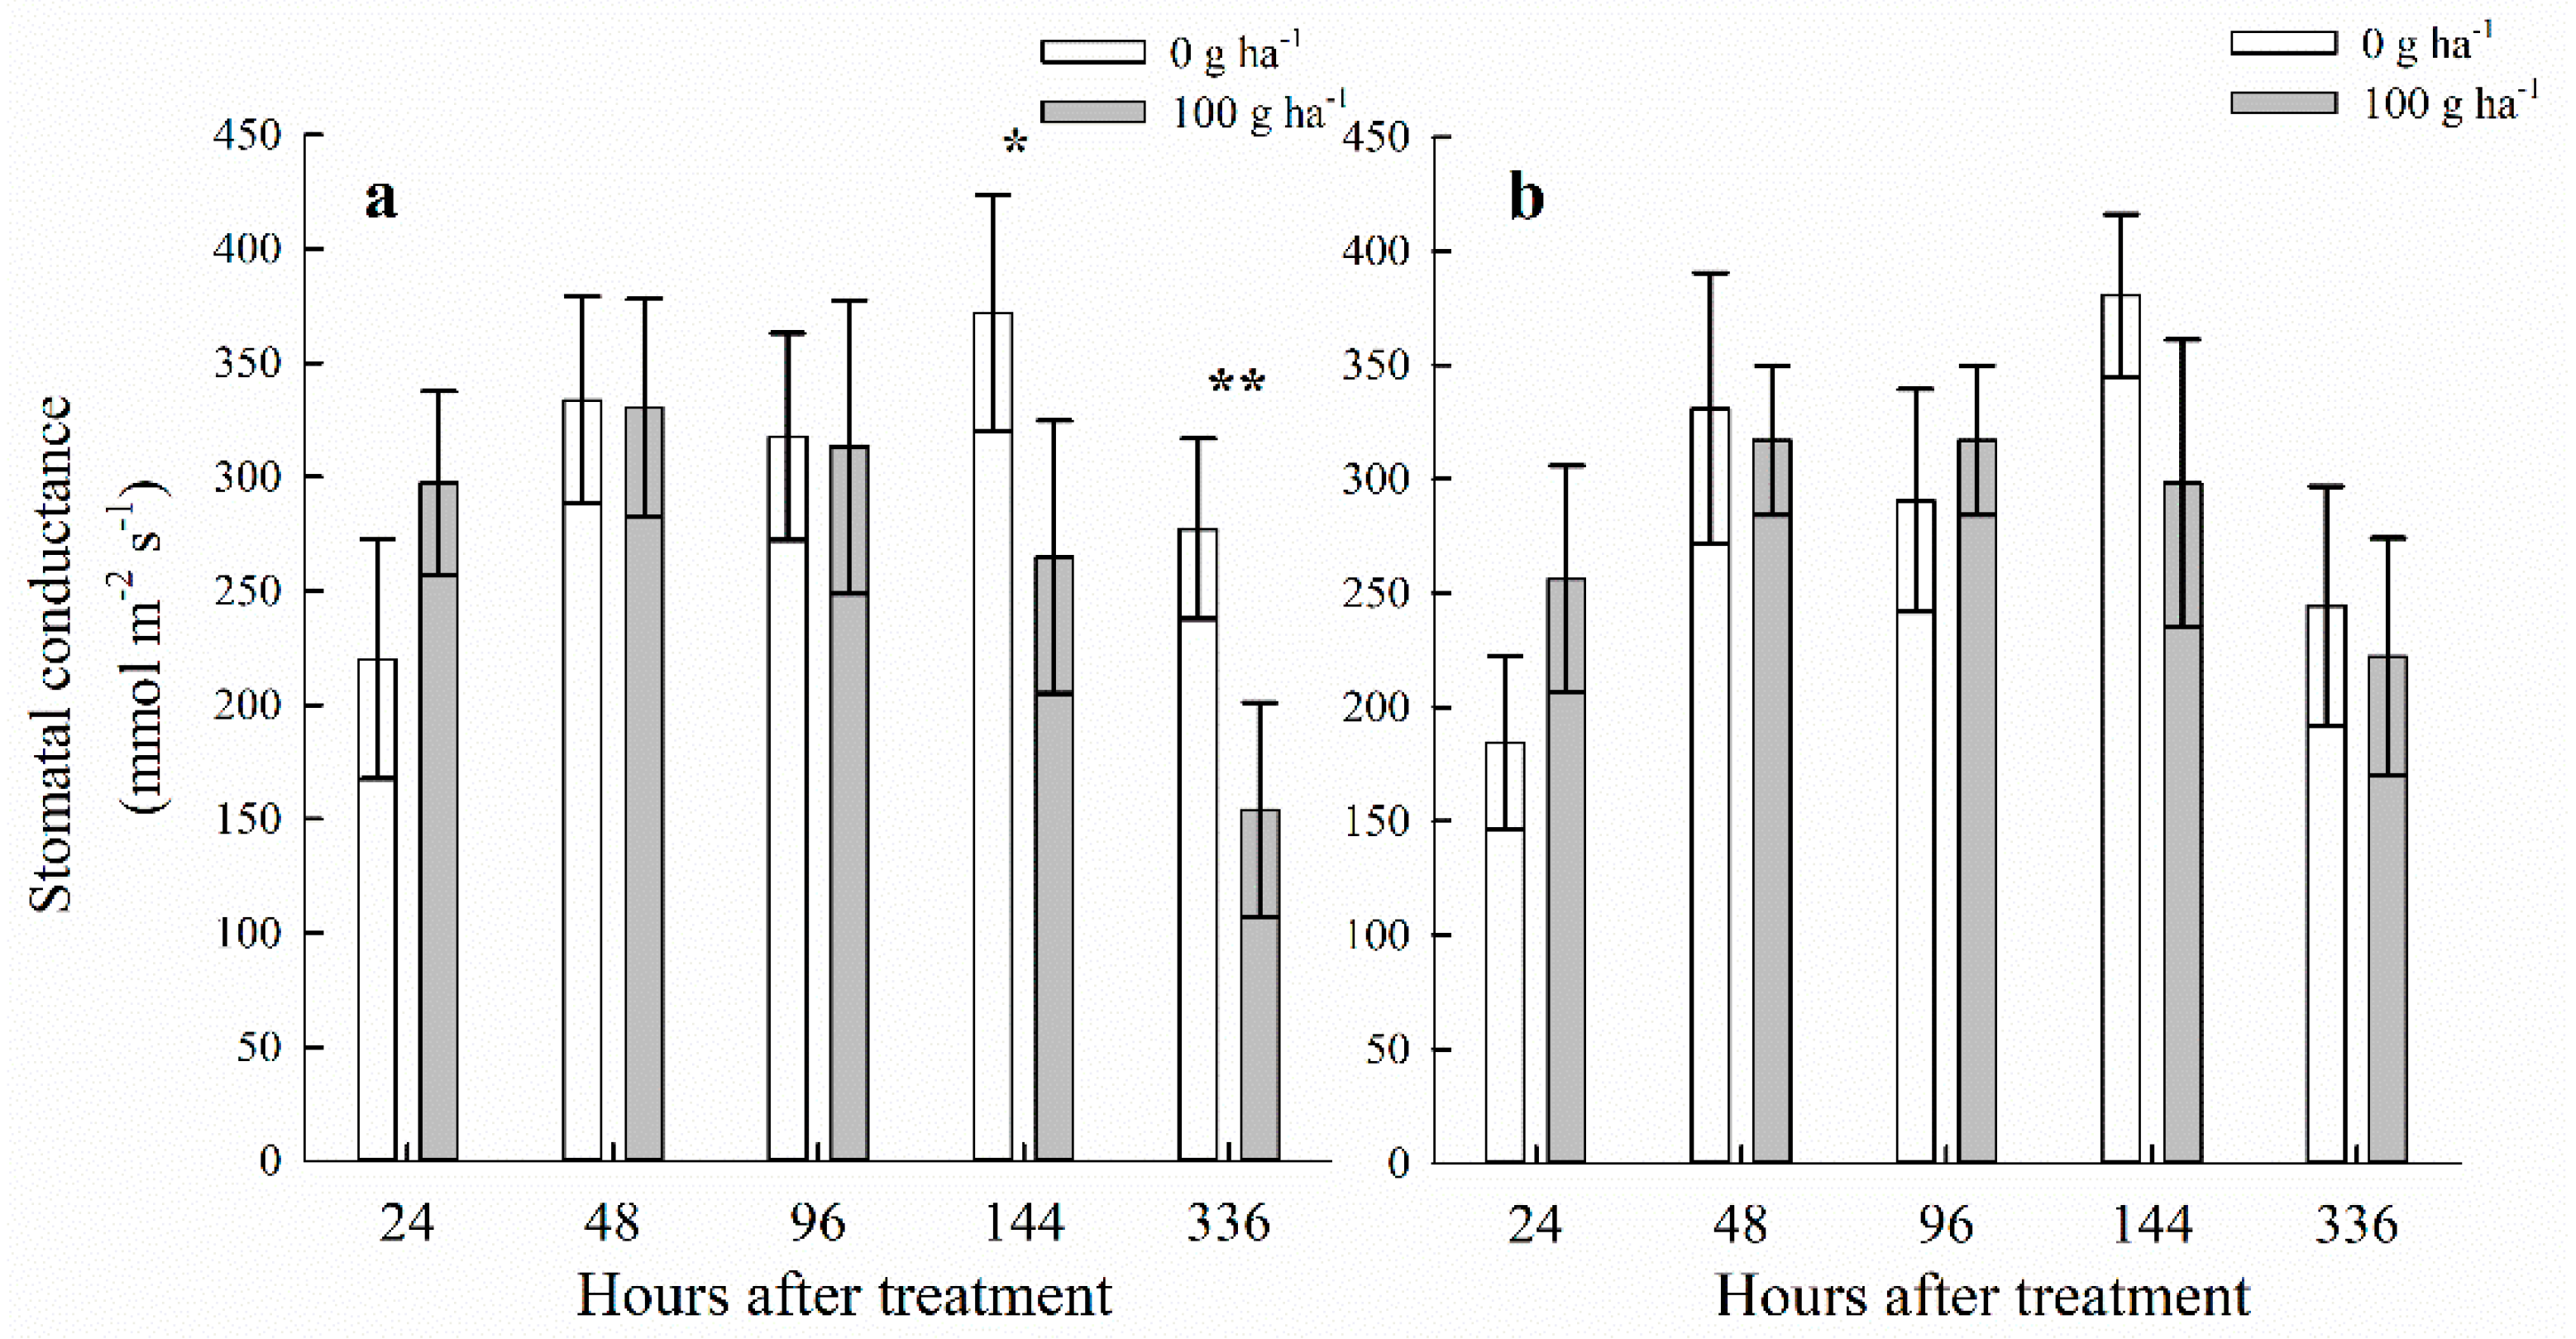
3.2. Stomatal Conductance

Quizalofop-p-ethyl treatment caused a reduction in stomatal conductance only in the CHK population at 144 and 336 HAA (Figure 3a). There was more than 40% reduction in stomatal conductance in CHK plants treated with quizalofop-p-ethyl (quizalofop-treated) at 144 and 336 HAA, compared with untreated CHK. This effect is due to quizalofop stress, revealing the susceptibility of this population to the herbicide. In plants submitted to stressful situations (drought and heat), a rapid stomatal closure occurs to prevent loss of cell turgor and reduce water in the plant [47]. In this sense, stomatal conductance is an important variable to demonstrate the plant’s physiological state [48].

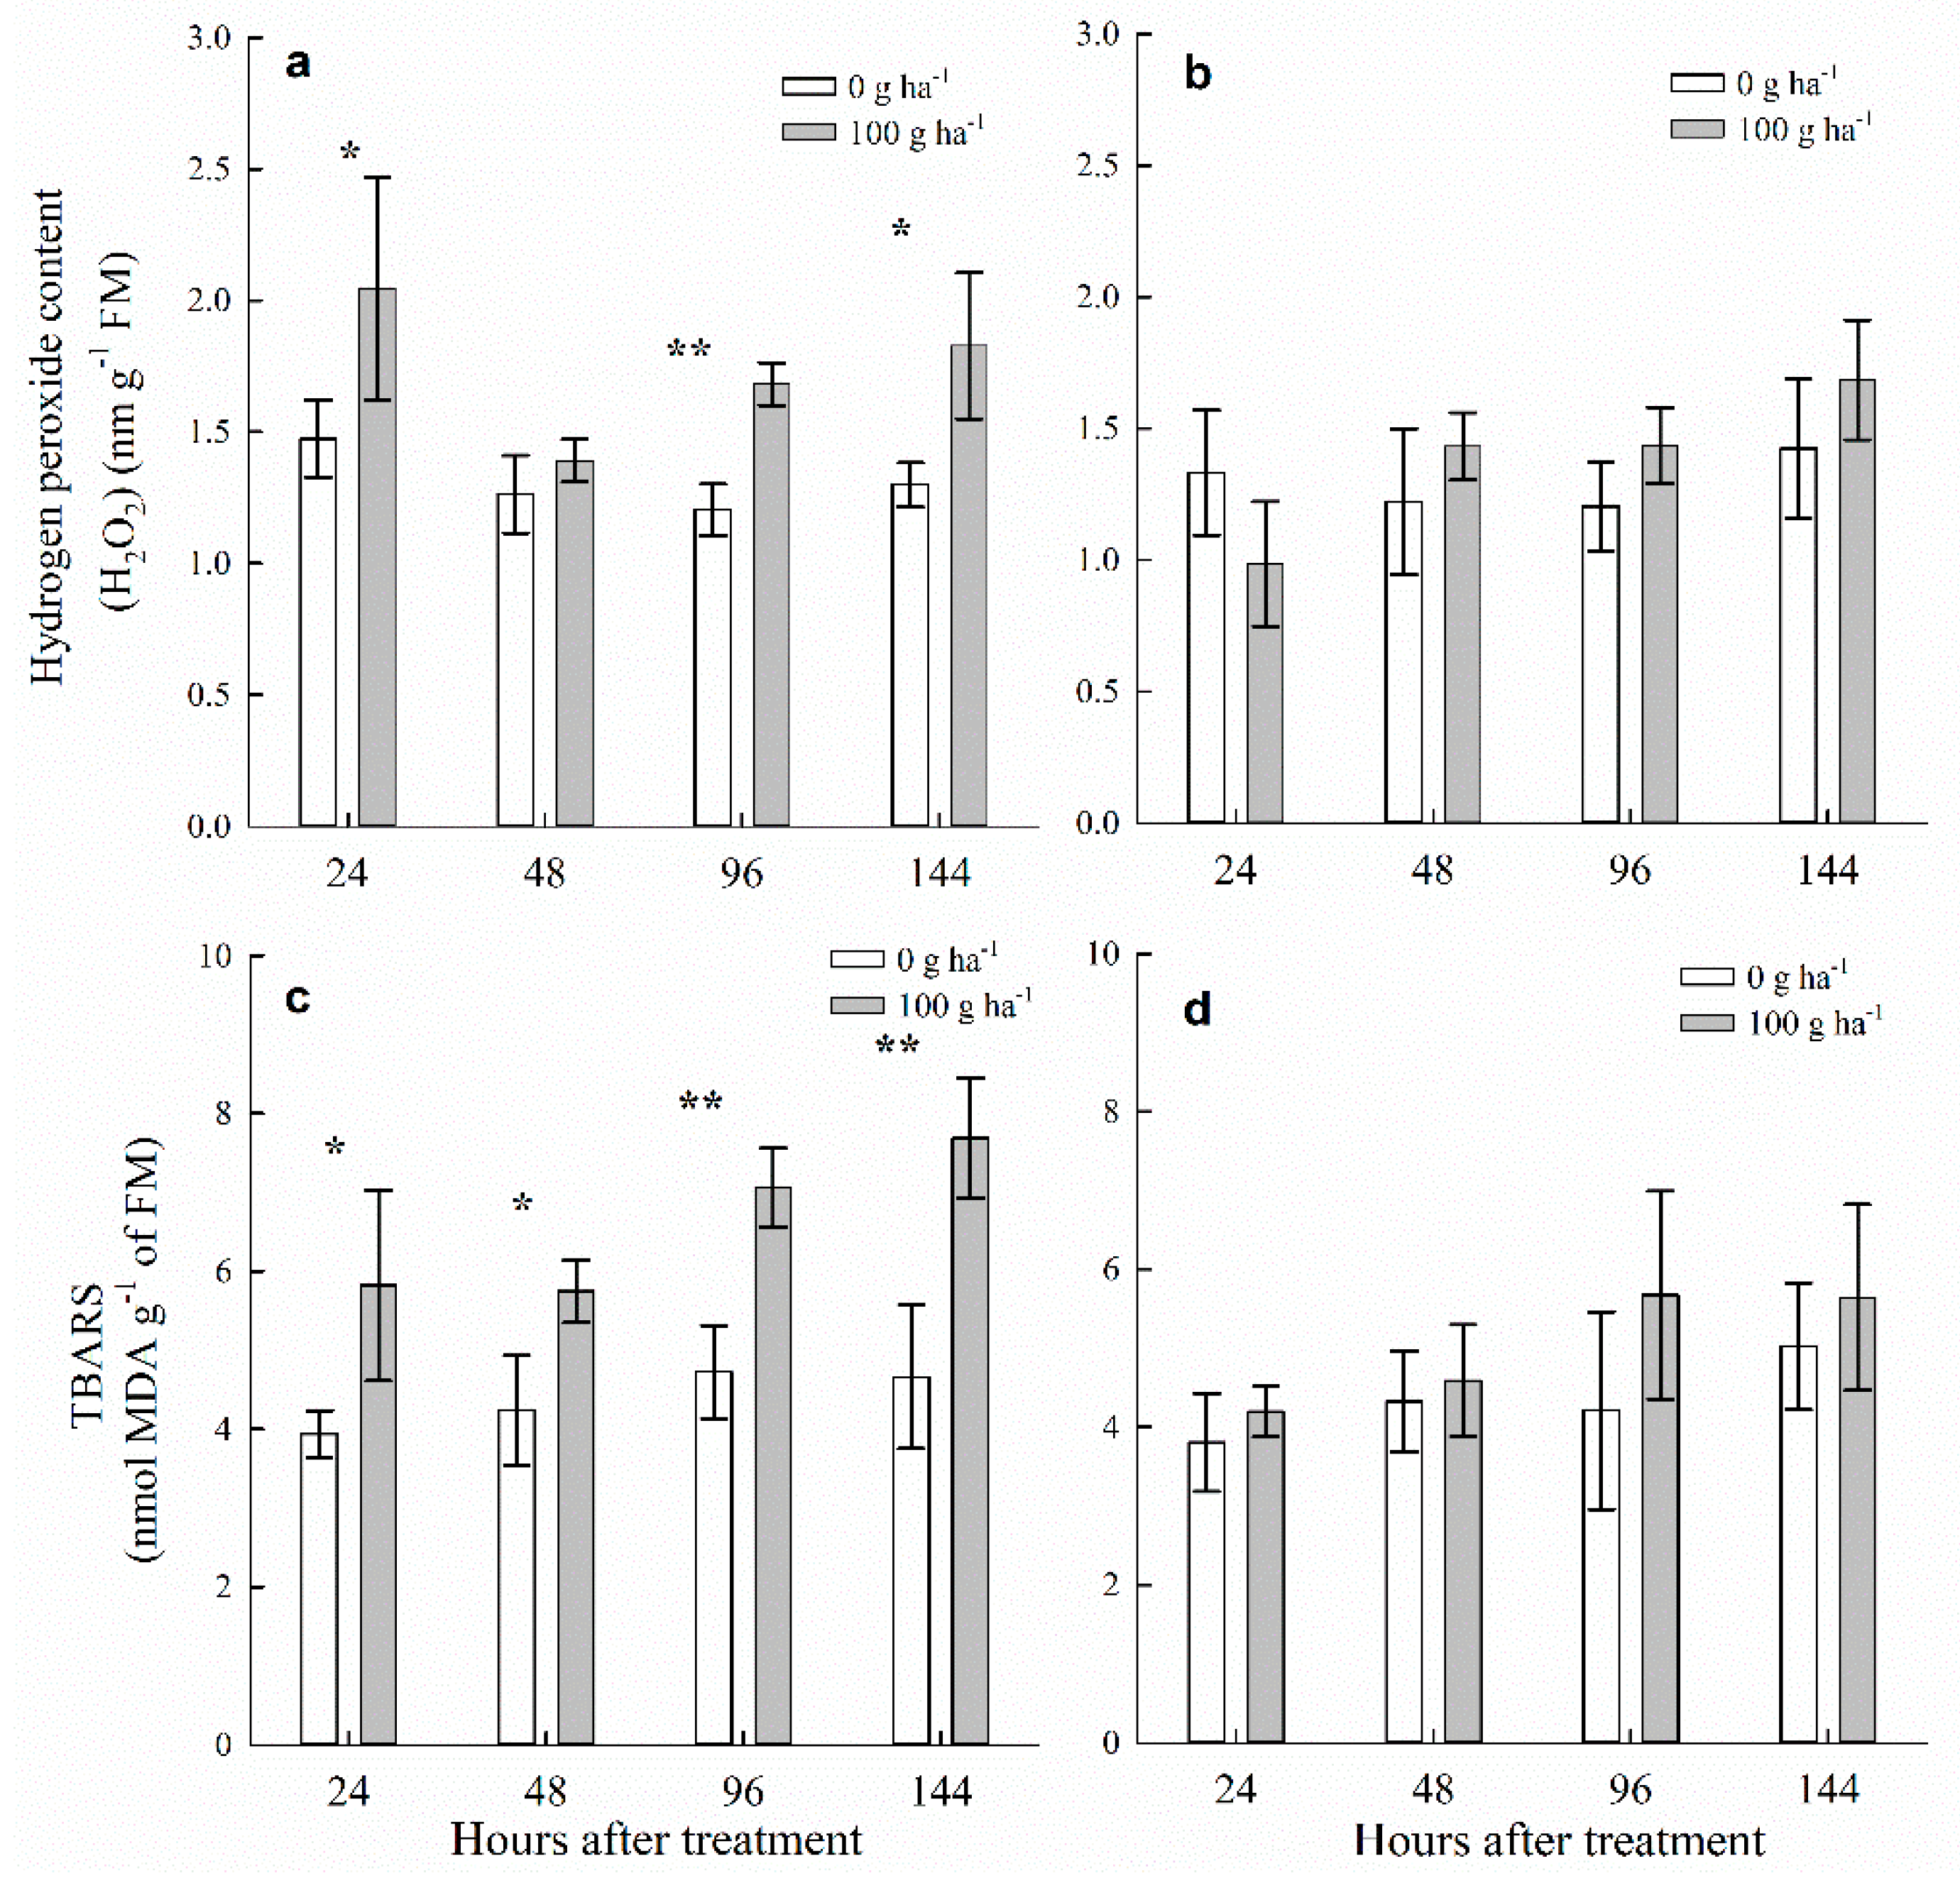
3.3. H2O2 Content and Lipid Peroxidation

H2O2 content increased only in the quizalofop-treated CHK population, at 24, 96, and 144 HAA (Figure 4a). Compared to the untreated control, the increase in H2O2 content in the CHK population was 1.38, 1.39, and 1.41-fold at 24, 96, and 144 HAA. When analyzed lipid peroxidation, the quizalofop-treated CHK population (Figure 4c) increased 48, 36, 50, and 65% (24, 48, 96, and 144 HAA, respectively), compared to the untreated control plants. There was no difference in H2O2 content and lipid peroxidation between quizalofop-treated and untreated DRY population (Figure 4b,d, respectively) variables in any period analyzed.
ACCase inhibitor herbicides cause inhibition of the lipid pathway, which consequently leads to lipid peroxidation [49]. Loss of membrane homeostasis series of processes that cause ROS generation occurs, exponentially increasing oxidative damage [49,50]. Rapid lipid peroxidation was observed at 24 HAA in the CHK population, demonstrating a rapid action of herbicide and explaining this population’s susceptibility to quizalofop. The ACCase inhibition by fluazifop-p-butyl is accompanied by increased chlorophyll fluorescence and ROS production in Acanthospermum hispidum [51]. Corn plants treated with clethodim also produced ROS a few hours after application [15].

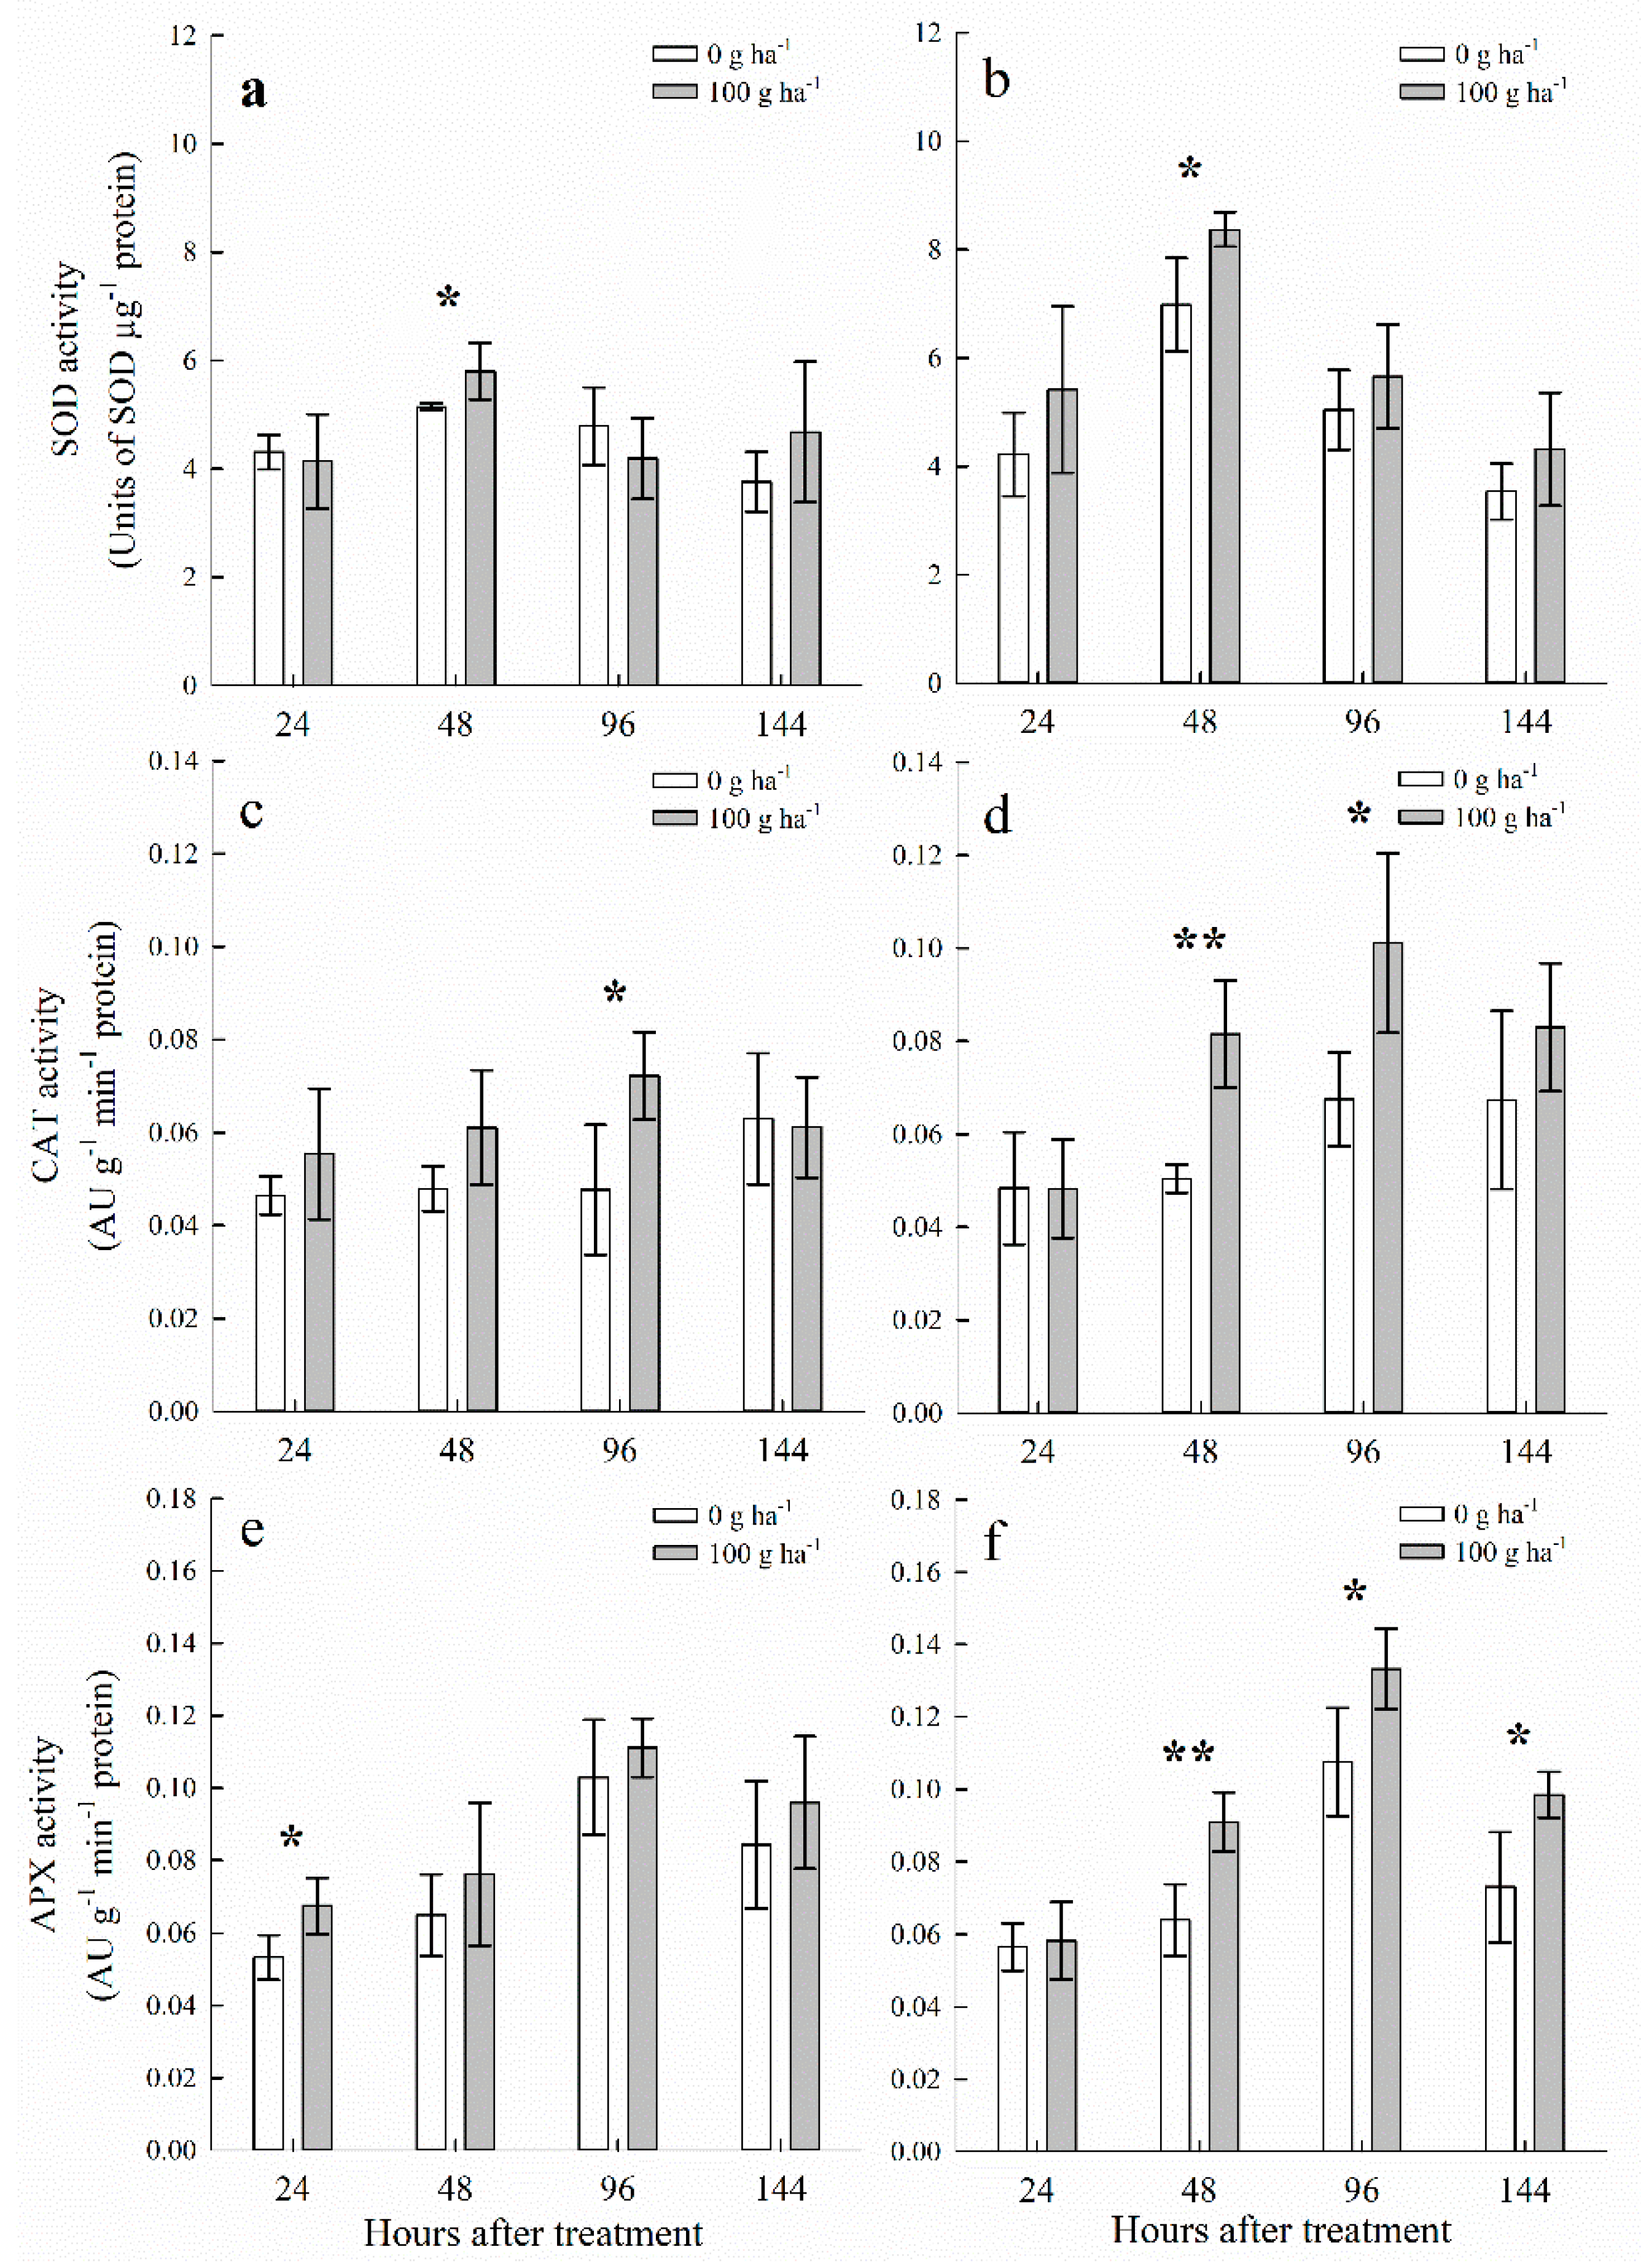
3.4. Antioxidant Enzymes

SOD activity differed only at 48 HAA (Figure 5a,b), in quizalofop-treated CHK and DRY populations, with an increase of 1.13 and 1.20-fold, respectively, compared to the untreated control. SOD is considered the first enzyme in the defense line against oxidative stress, responsible for converting O2 to H2O2 [15,52]. A. hispidum, treated with fluazifop-p-butyl, demonstrated increased SOD activity at 12 and 24 HAA [10]. However, the same species treated with haloxyfop-p-methyl had no differences.
The quizalofop-treated DRY population had an increase in CAT activity (Figure 5d) of 1.62 and 1.50-fold, compared to untreated control at 48 and 96 HAA, respectively. However, in the quizalofop-treated CHK population, only 96 HAA had an increase in CAT activity. CAT activity increased 14% in the untreated DRY population, relative to the untreated CHK population, demonstrating that these stresses in G0 and G1 generations stimulated CAT basal activity, suggesting a memory response from the stress with a transgenerational effect on CAT.
APX activity changed in the quizalofop-treated DRY population (Figure 5e,f), with increases of 1.42, 1.23, and 1.34-fold in the untreated control, at 48, 96, and 144 HAA, respectively. On the other hand, there was no difference in APX activity. Quizalofop-p-ethyl application increased APX activity by 15 and 25% in the CHK and DRY populations, respectively, compared to the untreated CHK population. Quizalofop stimulated CAT and APX activity, especially in the DRY population.
CAT and APX enzymes are responsible for detoxifying H2O2 in water [53]. Both enzymes are known to act by reducing oxidative stress caused by ACCase-inhibiting herbicides. At 12 HAA of fluazifop-p-butyl, an increase in CAT and APX activities in A. hispidum [10] was seen. After applying clethodim in corn, there was an increase in APX activity of up to 174% [15]. Echinochloa crus-galli resistant to quizalofop had increased catalase activity compared to the susceptible biotype [9].

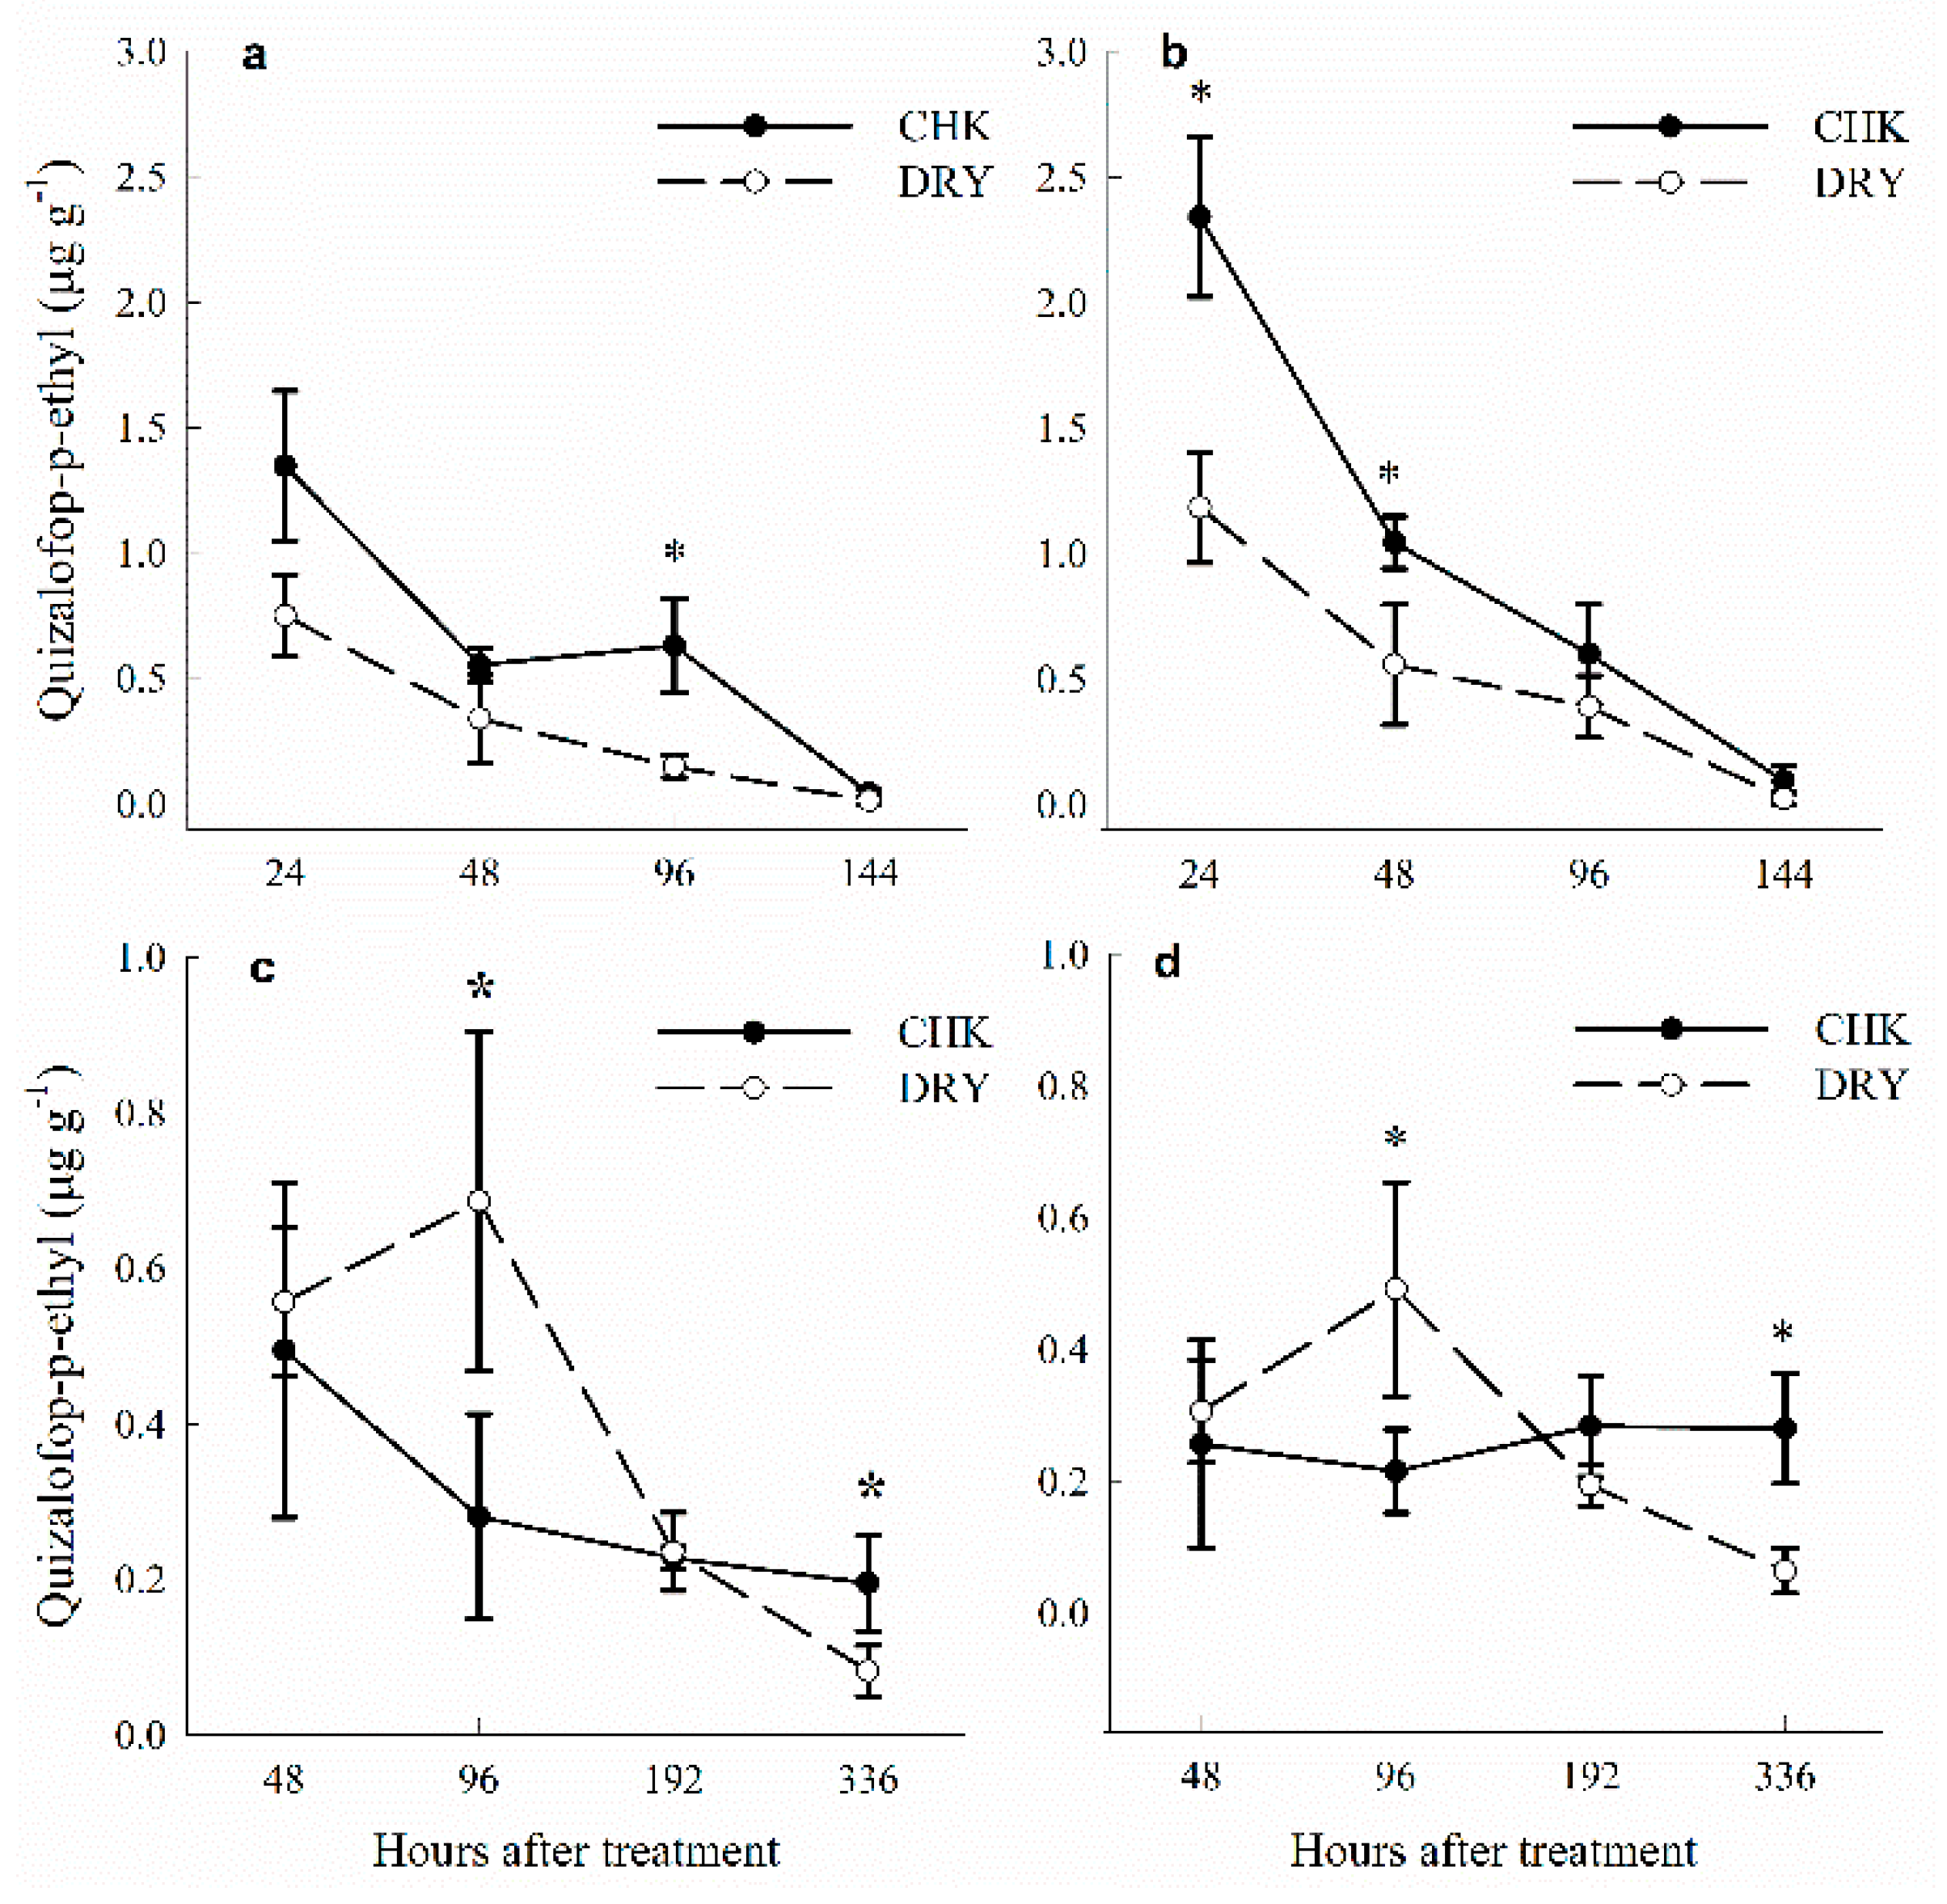
3.5. Quizalofop Concentration

The quizalofop-p-ethyl concentration in leaf surface (unabsorbed) was analyzed four periods after herbicide application (Figure 6 and Table 3). The analysis of variance showed interaction between timing and herbicide treatment. In experiment 1, the concentration of unabsorbed quizalofop-p-ethyl (Figure 6a) was reduced in both populations over time. The pattern of absorbed and unabsorbed quizalofop-p-ethyl was similar (Figure 6b), with a reduction in herbicide concentration over time in both populations. Absorption of quizalofop-p-ethyl was higher in the CHK population at 24 and 48 HAA (2.3 and 1.0 µg g−1, respectively) compared to the DRY population (1.18 and 0.55 µg g−1, respectively). The concentration of the active form of the herbicide (quizalofop-p) increased from 0.20 to 0.79 µg g−1 (24 and 48 HAA, respectively) in the CHK population (Table 3), and it was below the limits of quantification in other sampling times. In the DRY population, the concentration of quizalofop-p was 0.05 µg g−1 at 24 HAA, below the limits of quantification at 48 and 96 HAA, and not detected at 144 HAA.
In experiment 2, there was a contrast in non-absorbed quizalofop-p-ethyl (Figure 6c) at 96 HAA, with a higher concentration of herbicide in the DRY population (0.68 µg g−1) compared to the CHK population (0.28 µg g−1). In absorbed quizalofop-p-ethyl (Figure 6d), the concentration remained practically stable in the CHK population over time (0.49, 0.28, 0.23, 0.19 µg g−1). While in the DRY population compared with the CHK population, there was an increase in the concentration of quizalofop-p-ethyl at 96 HAA (0.49 µg g−1) and a reduction at 336 HAA (0.06 µg g−1). When analyzing the quizalofop-p (Table 3), only the DRY population at 48 HAA was quantified (0.11 µg g−1), with the other sampling times being below the non-detected at 336 HAA. However, in the CHK population, quizalofop-p was below the LOQ in all sampling times.
When analyzing results obtained at 48 HAA, similar concentrations in the DRY population were observed in both experiments, but quizalofop-p was quantified only in the second experiment. However, in the CHK population, quizalofop-p was quantified only in the first experiment, explaining part of the reduction of quizalofop-p-ethyl that was probably metabolized into quizalofop-p. The experiments demonstrate that the quizalofop-p-ethyl metabolization process occurs rapidly up to 48 HAA. Sorghum halepense plants have a 60% reduction in quizalofop-p-ethyl and an increase in quizalofop acid at 12 HAA [54]. At 24 HAA, 55% of quizalofop-p-ethyl was metabolized to quizalofop-p in Elytrigia repens [55]. After application in plants, the herbicide quizalofop-p-ethyl (inactive form) is quickly hydrolyzed to quizalofop acid (active form) [55,56,57].
With [14C]quizalofop in E. repens, an increase in polar metabolites was identified from 24 HAA [55]. In S. halepense, from 8 HAA onwards [14C], quizalofop-conjugates were identified and increased throughout the sampled periods [54]. The DRY population, due to the greater reduction in the concentration of quizalofop-p-ethyl and quizalofop-p, may translocate and/or metabolize more quickly, explaining the lower sensitivity to the herbicide. In the experiments in both populations, we identified the metabolite 2,3-dihydroxyquinoxaline (data not shown, CAS Registry No. 6639-79-8). The compound 2,3-dihydroxyquinoxaline is identified as a metabolite of quizalofop-p cleavage and described as an intermediate before being conjugated [56,58].

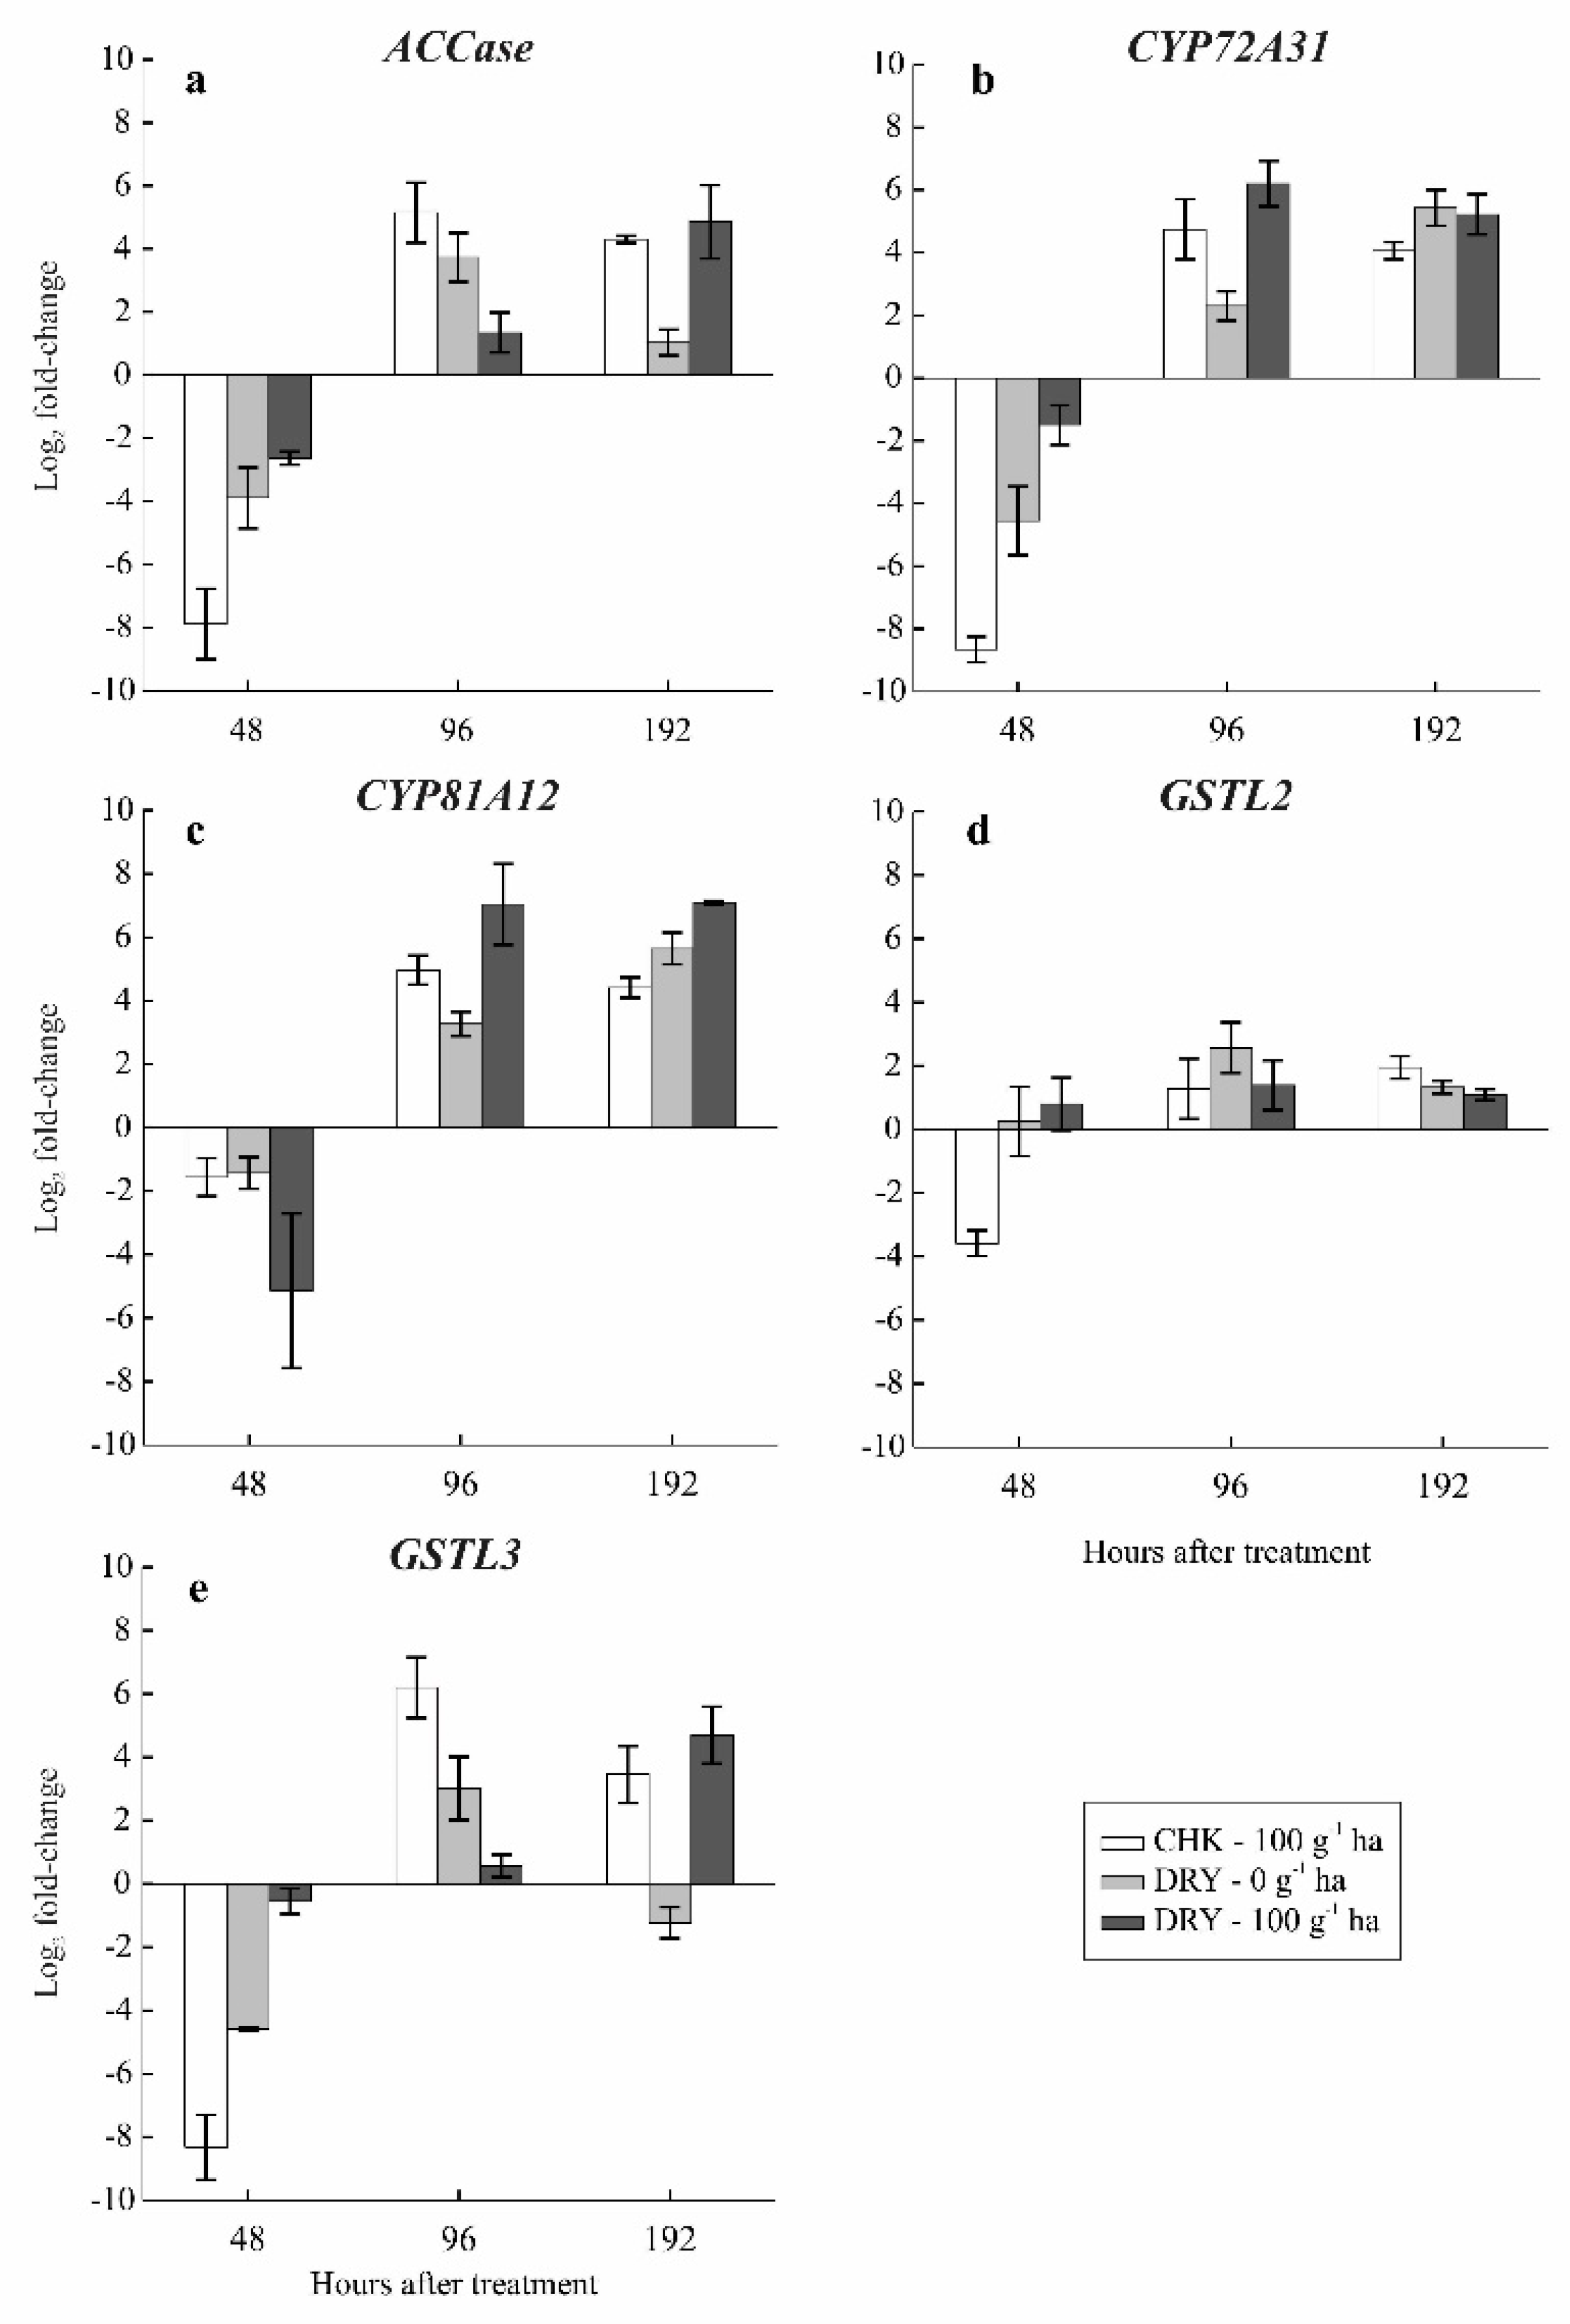
3.6. Gene Expression

The relative expression of ACCase was downregulated in both populations compared to the untreated CHK population at 48 HAA (Figure 7a). Quizalofop-treated CHK population had ACCase upregulation by 5.1 and 4.3-fold at 96 and 192 HAA, respectively. The quizalofop-treated DRY population had increased ACCase transcript accumulation over time, with 1.3 and 4.9-fold at 96 and 192 HAA, respectively. These results demonstrate that when treated with quizalofop-p-ethyl, the DRY population presented a slower response in ACCase expression than the CHK population. ACCase overexpression is one of the known mechanisms in resistance to ACCase- inhibiting herbicides [54].
To understand the effects caused by quizalofop-p-ethyl and quizalofop-p concentrations (Figure 6, Table 3), the expression of metabolizing genes involved in quizalofop detoxification was analyzed. The CYP72A31 gene belongs to the CYP72A subfamily of the P450 enzymes. At 48 HAA, CYP72A31 was downregulated in CHK and DRY treatments relative to CHK without herbicide (Figure 7b). Quizalofop-treated DRY population had a higher relative expression of CYP72A31, of 1.3-fold and 1.2-fold at 96 and 192 HAA, compared to CHK with herbicide.
CYP81A12 gene belongs to the CYP81A subfamily of the P450 enzyme [33]. At 48 HAA, CYP81A12 was downregulated in all populations (Figure 7c). CYP81A12 expression was increased in the quizalofop-treated CHK population by 4.9 and 4.4-fold at 96 and 192 HAA, respectively. The DRY population had the highest CYP81A12 transcript among populations—7.0 and 7.1-fold at 96 and 192 HAA, respectively. Quizalofop-p-ethyl concentration decreased 46 and 436% (192 and 336 HAA, respectively, Figure 6d) in the DRY population, and no quizalofop-p was detected in 336 HAA (Table 3), which can be explained by the upregulation of CYP81A12 from 96 and 192 HAA.
Enzymes of the cytochrome P450 monooxygenase complex are present in microorganisms, animals, and plants and are responsible for catalyzing a wide variety of monooxygenation/hydroxylation reactions [59], including the metabolization of several ACCase-inhibiting herbicides. The use of CYP450 inhibitors reduced the resistance of Beckmannia syzigachne to fenoxaprop-p-ethyl [24]. The subfamily CYP72A has been attributed to the resistance of several weeds to ALS and ACCase herbicides. L. rigidum resistant to diclofop upregulated its CYP72A gene expression, relative to susceptible plants [60]. Overexpression of CYP72A and CYP81A has been associated with the AHFD-3 resistance population of Alopecurus japonicus to fenoxaprop-p-ethyl [32]. The metabolism of herbicides can explain the resistance of Echinochloa phyllopogon to diclofop-methyl, tralkoxydim, and pinoxaden by the enzymes P450 CYP81A12 and CYP81A21 [33].
GSTL2 and GSTL3 genes belong to the superfamily glutathione S-transferases in subclass lambda [61,62]. Relative expression of GSTL2 in the DRY population reveals upregulation in all evaluated periods similar to the untreated DRY population (Figure 7d). In the quizalofop-treated CHK population, a downregulation in GSTL2 expression at 48 HAA was seen, followed by an upregulation of 1.3 and 1.9-fold at 96 and 192 HAA. GSTL2 gene was responsive to quizalofop in the CHK population, while there were no differences between quizalofop-treated and untreated in the DRY population. These results demonstrate that the basal rate of GSTL2 expression in the DRY population is probably higher than in the CHK population.
GSTL3 was downregulated in all populations at 48 HAA (Figure 7e). At 96 and 192 HAA, the quizalofop-treated CHK population had upregulation of GSTL3 in 6.2 and 3.4-fold. In the quizalofop-treated DRY population, GSTL3 was upregulated in 0.6 and 4.7-fold at 96 and 192 HAA, respectively. These results demonstrate that the CHK population increased GSTL3 expression more quickly after the quizalofop-p-ethyl application than the DRY population.
GSTs are ubiquitous enzymes responsible for metabolizing several xenobiotic compounds by conjugating them with reduced tripeptide glutathione (GSH, γ-Glu-Cys-Gly) [62]. Resistance to quizalofop in populations E. crus-galli was partly attributed to the increase in GST activity from 96 HAA, reaching 3-fold, compared to susceptible plants [9]. Polypogon fugax resistant to quizalofop, when applied with GST 4-chloro-7-nitrobenzoxadiazole inhibitor (NBD-Cl), had the resistance reversed [61]. Upregulation of GST2c and GSTL3 genes were identified in the resistant population of P. fugax [61].

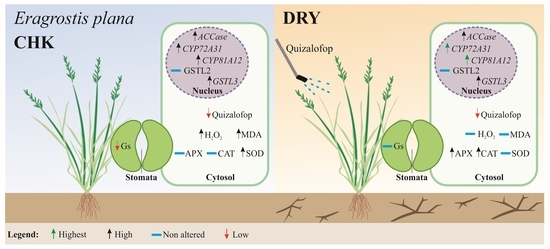
3.7. Mechanisms Involving Reducing Sensitivity Responses to Quizalofop in E. plana

In the dose-response curves experiment, the sensitivity to quizalofop-p-ethyl in all populations of generations G0, G1, and G2 was analyzed; it was found that the DRY population was the least sensitive and the CHK population was the most sensitive. In the next step, the physiological and biochemical effects on G2 generation were analyzed. This study reveals that a quizalofop-treated CHK population reduced stomatal conductance and increased H2O2 concentration and lipid peroxidation. Regarding the less sensitive quizalofop-treated DRY population, there were no changes in stomatal conductance, H2O2, and lipid peroxidation. In antioxidant enzymes, only CAT and APX demonstrated increased activity in the DRY population.
The response to quizalofop in both populations (CHK and DRY) occurs mainly up to 48 HAA. Quizalofop-p-ethyl levels decreased from 24 to 48 HAA in both populations (Figure 6b), in addition to observing low levels of quizalofop-p since 48 HAA (Table 3). In analyzed genes in the CHK population, there was a slight upregulation of ACCase, CYP72A31, CYP81A12, and GSTL3. Regarding DRY’s less sensitive population, there was a reduction in quizalofop-p-ethyl over time, close to zero at 336 HAA. Quizalofop-p concentrations were below the limit of quantification from 48 HAA. In respect to gene expression, there was an upregulation of ACCase and GSTL3 and a greater upregulation of CYP72A31 and CYP81A12. These results suggest quizalofop metabolism in the DRY population, mainly via the cytochrome P450 enzyme.

4. Conclusions

Eragrostis plana demonstrated a capacity for transgenerational memory adaptation to abiotic stresses, allowing decreasing sensitivity to quizalofop. The population primed by drought stress (DRY) in G1 and G2 generations was the least sensitive to quizalofop-p-ethyl.
The mechanism driving reducing in sensitivity is due to the homeostatic adjustment with increased activity of the antioxidant enzymes SOD, CAT, and APX, in conjunction with the upregulation of CYP72A31 and CYP81A12, and increase in quizalofop-p-ethyl metabolism.

Supplementary Materials

The following are available online at https://www.mdpi.com/article/10.3390/agriculture12030396/s1, Figure S1. Relation of maximum, medium and minimum temperature (a) and humidity (b); vapor pressure deficit (VPD) (c), stomatal conductance (d) during drought stress (06/18/17-07/17/17) and injury of quizalofop (e) in generation F0 of Eragrostis plana in green house. CHK (no stress), DRY (drought), QZA (quizalofop-p-ethyl), and DRY × QZA (drought followed by quizalofop-p-ethyl). 2017. Figure S2. Relation of maximum, medium and minimum temperature (a) and humidity (b); vapor pressure deficit (VPD) (c) and stomatal condutance (d) during drought stress (04/06/18-04/18/18); injury of glyphosate (e) in generation F1 of Eragrostis plana in green house. CHK (no stress), DRY (drought), QZA (quizalofop-p-ethyl), and DRY × QZA (drought followed by quizalofop-p-ethyl). 2018.

Author Contributions

Conceptualization and methodology, M.V.F., F.P.L., E.R.C., G.M.S. and L.A.d.A.; performed the experiments, M.V.F., A.d.R.F., N.S.G., T.H. and V.E.V.; analyzed and interpreted data, M.V.F. and V.E.V.; writing—original draft, M.V.F. and V.E.V.; writing—review and editing: M.V.F., V.E.V., F.E.D., D.A., F.P.L., G.M.S., E.R.C. and L.A.d.A. All authors have read and agreed to the published version of the manuscript.

Funding

This research was conducted with the support of CAPES-financing code 001 for Marcus Vinícius Fipke. We are thankful to the following: CNPq for the Research Fellowship of Luis Antonio de Avila/N.Proc. 310830/2019-2 and for the Universal grant 2018-CNPq N.Proc. 426714/2018-0; the research fellowship of Vívian Ebeling Viana by CAPES/PNPD, and FAPERGS (Fundação de Amparo á Pesquisa do Estado do Rio Grande do Sul)-Program for the internationalization of Graduate Programs-FAPERGS/CAPES 06/2018: 19/2551-0000715-9.

Institutional Review Board Statement

Not applicable.

Data Availability Statement

The datasets used and/or analyzed during the current study are available from the corresponding author on reasonable request.

Acknowledgments

The authors wish to thank the Federal University of Pelotas for the staff support.

Conflicts of Interest

The authors declare no conflict of interest in writing this review article.

References

  1. Guido, A.; Hoss, D.; Pillar, V.D. Competitive effects and responses of the invasive grass Eragrostis plana in Río de la Plata grasslands. Austral. Ecol. 2019, 44, 1478–1486. [Google Scholar] [CrossRef]
  2. Medeiros, R.B.; Focht, T. Invasão, prevenção, controle e utilização do capim-annoni-2 (Eragrostis plana Nees) no Rio Grande do Sul, Brasil. Pesqui. Agropecuária Gaúcha 2007, 13, 105–114. [Google Scholar]
  3. Barbosa, F.G.; Pillar, V.D.; Palmer, A.R.; Melo, A.S. Predicting the current distribution and potential spread of the exotic grass Eragrostis plana Nees in South America and identifying a bioclimatic niche shift during invasion. Austral. Ecol. 2013, 38, 260–267. [Google Scholar] [CrossRef]
  4. Bastiani, M.O.; Roma-Burgos, N.; Langaro, A.C.; Salas-Perez, R.A.; Rouse, C.E.; Fipke, M.V.; Lamego, F.P. Ammonium sulfate improves the efficacy of glyphosate on south african lovegrass (Eragrostis plana) under water stress. Weed Sci. 2021, 2507, 1–43. [Google Scholar] [CrossRef]
  5. Carloto, B.W.; Buriol, G.A.; Dornelles, S.H.B.; Trivisiol, V.S.; Peripolli, M.; Escobar, O.S. Morphological and phenological responses of Eragrostis plana Nees and Eragrostis pilosa (L.) P. Beauv. plants subjected to different soil moisture conditions. Planta Daninha 2019, 37, 1–7. [Google Scholar] [CrossRef]
  6. Favaretto, A.; Santos, J.; Carneiro, C.M.; Basso, S.M.S. The first anatomical and histochemical study of tough lovegrass (Eragrostis plana Nees, Poaceae). Afr. J. Agric. Res. 2015, 10, 2940–2947. [Google Scholar] [CrossRef]
  7. Dyer, W.E. Stress-induced evolution of herbicide resistance and related pleiotropic effects. Pest. Manag. Sci. 2018, 74, 1759–1768. [Google Scholar] [CrossRef]
  8. Kleinman, Z.; Ben-Ami, G.; Rubin, B. From sensitivity to resistance—Factors affecting the response of Conyza spp. to glyphosate. Pest. Manag. Sci. 2016, 72, 1681–1688. [Google Scholar] [CrossRef]
  9. Huan, Z.B.; Zhang, H.J.; Zhen, H.O.U.; Zhang, S.Y.; Zhang, Y.; Liu, W.; Bi, Y.; Wang, J. Resistance level and metabolism of barnyard-grass (Echinochloa crusgalli (L.) Beauv.) populations to quizalofop-p-ethyl in heilongjiang province, China. Agric. Sci. China 2011, 10, 1914–1922. [Google Scholar] [CrossRef]
  10. Luo, X.; Liu, Z.; Sunohara, Y.; Matsumoto, H.; Li, P. Involvement of H2O2 in fluazifop-p-butyl-induced cell death in bristly starbur seedlings. Pestic. Biochem. Physiol. 2017, 143, 258–264. [Google Scholar] [CrossRef]
  11. Powles, S.B.; Yu, Q. Evolution in Action: Plants Resistant to Herbicides. Annu. Rev. Plant. Biol. 2010, 61, 317–347. [Google Scholar] [CrossRef] [PubMed] [Green Version]
  12. Huan, Z.; Xu, Z.; Lv, D.; Wang, J. Determination of ACCase sensitivity and gene expression in quizalofop–ethyl resistant and susceptible barnyardgrass (Echinochloa crus-galli) biotypes. Weed Sci. 2013, 61, 537–542. [Google Scholar] [CrossRef]
  13. Dayan, F.E.; Barker, A.; Bough, R.; Ortiz, M.; Takano, H.; Duke, S.O. Herbicide mechanisms of action and resistance. In Comprehensive Biotechnology; Elsevier: Amsterdam, The Netherlands, 2019; Volume 4, pp. 36–48. [Google Scholar]
  14. Takano, H.K.; Ovejero, R.F.L.; Belchior, G.G.; Maymone, G.P.L.; Dayan, F.E. ACCase-inhibiting herbicides: Mechanism of action, resistance evolution and stewardship. Sci. Agric. 2020, 78, 1–11. [Google Scholar] [CrossRef]
  15. Radwan, D.E.M. Salicylic acid induced alleviation of oxidative stress caused by clethodim in maize (Zea mays L.) leaves. Pestic. Biochem. Physiol. 2012, 102, 182–188. [Google Scholar] [CrossRef]
  16. Benedetti, L.; Rangani, G.; Ebeling Viana, V.; Carvalho-Moore, P.; Rabaioli Camargo, E.; de Avila, L.A.; Roma-Burgos, N. Recurrent selection by herbicide sublethal dose and drought stress results in rapid reduction of herbicide sensitivity in junglerice. Agronomy 2020, 10, 1619. [Google Scholar] [CrossRef]
  17. Galloway, L.F. Maternal effects provide phenotypic adaptation to local environmental conditions. New Phytol. 2005, 166, 93–100. [Google Scholar] [CrossRef]
  18. Whittle, C.A.; Otto, S.P.; Johnston, M.O.; Krochko, J.E. Adaptive epigenetic memory of ancestral temperature regime in Arabidopsis thaliana. Botany 2009, 87, 650–657. [Google Scholar] [CrossRef] [Green Version]
  19. Nosalewicz, A.; Siecińska, J.; Śmiech, M.; Nosalewicz, M.; Wiącek, D.; Pecio, A.; Wach, D. Transgenerational effects of temporal drought stress on spring barley morphology and functioning. Environ. Exp. Bot. 2016, 131, 120–127. [Google Scholar] [CrossRef]
  20. Busi, R.; Neve, P.; Powles, S. Evolved polygenic herbicide resistance in Lolium rigidum by low-dose herbicide selection within standing genetic variation. Evol. Appl. 2013, 6, 231–242. [Google Scholar] [CrossRef] [PubMed]
  21. Délye, C. Unravelling the genetic bases of non-target-site-based resistance (NTSR) to herbicides: A major challenge for weed science in the forthcoming decade. Pest. Manag. Sci. 2013, 69, 176–187. [Google Scholar] [CrossRef]
  22. Gaines, T.A.; Duke, S.O.; Morran, S.; Rigon, C.A.G.; Tranel, P.J.; Küpper, A.; Dayan, F.E. Mechanisms of evolved herbicide resistance. J. Biol. Chem. 2020, 295, 10307–10330. [Google Scholar] [CrossRef] [PubMed]
  23. Rigon, C.A.G.; Gaines, T.A.; Küpper, A.; Dayan, F.E. Metabolism-based herbicide resistance, the major threat among the non-target site resistance mechanisms. Outlooks Pest. Manag. 2020, 31, 162–168. [Google Scholar] [CrossRef]
  24. Li, W.; Zhang, L.; Zhao, N.; Guo, W.; Liu, W.; Li, L.; Wang, J. Multiple resistance to accase and ALS-inhibiting herbicides in Beckmannia syzigachne (Steud.) fernald without mutations in the target enzymes. Chil. J. Agric. Res. 2017, 77, 257–265. [Google Scholar] [CrossRef] [Green Version]
  25. Velikova, V.; Yordanov, I.; Edreva, A. Oxidative stress and some antioxidant systems in acid rain-treated bean plants protective role of exogenous polyamines. Plant. Sci. 2000, 151, 59–66. [Google Scholar] [CrossRef]
  26. Bradford, M.M. A rapid and sensitive method for the quantitation of microgram quantities of protein utilizing the principle of protein-dye binding. Anal. Biochem. 1976, 2, 248–254. [Google Scholar] [CrossRef]
  27. Giannopolitis, C.N.; Ries, S.K. Superoxide dismutases: I. occurrence in higher plants. Plant. Physiol. 1977, 59, 309–314. [Google Scholar] [CrossRef]
  28. Havir, E.A.; McHale, N.A. Biochemical and developmental characterization of multiple forms of catalase in Tobacco leaves. Plant. Physiol. 1987, 84, 450–455. [Google Scholar] [CrossRef] [Green Version]
  29. Nakano, Y.; Asada, K. Hydrogen peroxide is scavenged by ascorbate-specific peroxidase in spinach chloroplasts. Plant. Cell Physiol. 1981, 22, 867–880. [Google Scholar] [CrossRef]
  30. Li, L.; Li, W.; Qin, D.; Jiang, S.; Liu, F. Application of graphitized carbon black to the QuEChERS method for pesticide Multiresidue analysis in spinach. J. AOAC Int. 2009, 92, 538–547. [Google Scholar] [CrossRef] [Green Version]
  31. Laforest, M.; Soufiane, B.; Simard, M.J.; Obeid, K.; Page, E.; Nurse, R.E. Acetyl-CoA carboxylase overexpression in herbicide-resistant large crabgrass (Digitaria sanguinalis). Pest. Manag. Sci. 2017, 73, 2227–2235. [Google Scholar] [CrossRef]
  32. Chen, G.; Xu, H.; Zhang, T.; Bai, C.; Dong, L. Fenoxaprop-P-ethyl resistance conferred by cytochrome P450s and target site mutation in Alopecurus japonicus. Pest. Manag. Sci. 2018, 74, 1694–1703. [Google Scholar] [CrossRef] [PubMed]
  33. Iwakami, S.; Kamidate, Y.; Yamaguchi, T.; Ishizaka, M.; Endo, M.; Suda, H.; Nagai, K.; Sunohara, Y.; Toki, S.; Uchino, A.; et al. CYP81A P450s are involved in concomitant cross-resistance to acetolactate synthase and acetyl-CoA carboxylase herbicides in Echinochloa phyllopogon. New Phytol. 2019, 221, 2112–2122. [Google Scholar] [CrossRef] [PubMed]
  34. Iwakami, S.; Endo, M.; Saika, H.; Okuno, J.; Nakamura, N.; Yokoyama, M.; Watanabe, H.; Toki, S.; Uchino, A.; Inamura, T. Cytochrome P450 CYP81A12 and CYP81A21 are associated with resistance to two acetolactate synthase inhibitors in Echinochloa phyllopogon. Plant. Physiol. 2014, 165, 618–629. [Google Scholar] [CrossRef] [PubMed] [Green Version]
  35. Saika, H.; Horita, J.; Taguchi-Shiobara, F.; Nonaka, S.; Nishizawa-Yokoi, A.; Iwakami, S.; Hori, K.; Matsumoto, T.; Tanaka, T.; Itoh, T.; et al. A novel rice cytochrome P450 gene, CYP72A31, confers tolerance to acetolactate synthase-inhibiting herbicides in rice and arabidopsis. Plant. Physiol. 2014, 166, 1232–1240. [Google Scholar] [CrossRef] [PubMed] [Green Version]
  36. Cummins, I.; Wortley, D.J.; Sabbadin, F.; He, Z.; Coxon, C.R.; Straker, H.E.; Sellars, J.D.; Knight, K.; Edwards, L.; Hughes, D.; et al. Key role for a glutathione transferase in multiple-herbicide resistance in grass weeds. Proc. Natl. Acad. Sci. USA 2013, 110, 5812–5817. [Google Scholar] [CrossRef] [PubMed] [Green Version]
  37. Zhou, Y.; Lu, D.; Li, C.; Luo, J.; Zhu, B.F.; Zhu, J.; Shangguan, Y.; Wang, Z.; Sang, T.; Zhou, B.; et al. Genetic control of seed shattering in rice by the APETALA2 transcription factor Shattering Abortion1. Plant. Cell 2012, 24, 1034–1048. [Google Scholar] [CrossRef] [Green Version]
  38. Jain, M.; Nijhawan, A.; Tyagi, A.K.; Khurana, J.P. Validation of housekeeping genes as internal control for studying gene expression in rice by quantitative real-time PCR. Biochem. Biophys. Res. Commun. 2006, 345, 646–651. [Google Scholar] [CrossRef] [PubMed]
  39. NCBI National Center for Biotechnology Information. Available online: www.ncbi.nlm.nih.gov (accessed on 10 January 2020).
  40. Untergasser, A.; Nijveen, H.; Rao, X.; Bisseling, T.; Geurts, R.; Leunissen, J.A.M. Primer3Plus, an enhanced web interface to Primer3. Nucleic Acids Res. 2007, 35, 71–74. [Google Scholar] [CrossRef] [Green Version]
  41. Bustin, S.A.; Benes, V.; Garson, J.A.; Hellemans, J.; Huggett, J.; Kubista, M.; Mueller, R.; Nolan, T.; Pfaffl, M.W.; Shipley, G.L.; et al. The MIQE guidelines: Minimum information for publication of quantitative real-time PCR experiments. Clin. Chem. 2009, 55, 611–622. [Google Scholar] [CrossRef] [Green Version]
  42. Livak, K.J.; Schmittgen, T.D. Analysis of relative gene expression data using real-time quantitative PCR and the 2(-Delta Delta C(T)) Method. Methods 2001, 25, 402–408. [Google Scholar] [CrossRef]
  43. Bruce, T.J.A.; Matthes, M.C.; Napier, J.A.; Pickett, J.A. Stressful “memories” of plants: Evidence and possible mechanisms. Plant. Sci. 2007, 173, 603–608. [Google Scholar] [CrossRef]
  44. Rocha Pereira, M.R.; Sasso, F.; de Souza, G.; Iran Cardoso da Silva, J.; Macedo, A.C.; Martins, D. Influence of soil water potential in the action of herbicides on goosegrass (Eleusine indica (L) Gaertn). Biosci. J. 2015, 31, 107–117. [Google Scholar] [CrossRef] [Green Version]
  45. Manalil, S.; Busi, R.; Renton, M.; Powles, S.B. Rapid evolution of herbicide resistance by low herbicide dosages. Weed Sci. 2011, 59, 210–217. [Google Scholar] [CrossRef]
  46. Neve, P.; Powles, S. Recurrent selection with reduced herbicide rates results in the rapid evolution of herbicide resistance in Lolium rigidum. Theor. Appl. Genet. 2005, 110, 1154–1166. [Google Scholar] [CrossRef]
  47. Ribeiro, R.V.; Machado, R.S.; Machado, E.C.; Machado, D.F.S.P.; Magalhães Filho, J.R.; Landell, M.G.A. Revealing drought-resistance and productive patterns in sugarcane genotypes by evaluating both physiological responses and stalk yield. Exp. Agric. 2013, 49, 212–224. [Google Scholar] [CrossRef]
  48. Nascentes, R.F.; Carbonari, C.A.; Simões, P.S.; Brunelli, M.C.; Velini, E.D.; Duke, S.O. Low doses of glyphosate enhance growth, CO2 assimilation, stomatal conductance and transpiration in sugarcane and eucalyptus. Pest. Manag. Sci. 2018, 74, 1197–1205. [Google Scholar] [CrossRef]
  49. Jang, S.; Marjanovic, J.; Gornicki, P. Resistance to herbicides caused by single amino acid mutations in acetyl-CoA carboxylase in resistant populations of grassy weeds. New Phytol. 2013, 197, 1110–1116. [Google Scholar] [CrossRef]
  50. Banas, A.; Johasson, I.; Stenlid, G.; Stymne, S. Free-radical scavengers and inhibitors of lipoxygenases as antagonists against the herbicides haloxyfop and alloxydim. Swedish J. Agric. Res. 1993, 23, 67–75. [Google Scholar]
  51. Shang, Y.; Yang, C.; Liu, Z.; Song, J.; Li, P.; Li, L.; Zhou, F.; Xin, H.; Wan, F.; Matsumoto, H.; et al. New evidence for primordial action site of fluazifop-p-butyl on Acanthospermum hispidum seedlings: From the effects on chlorophyll fluorescence characteristics and histological observation. Pestic. Biochem. Physiol. 2017, 142, 170–175. [Google Scholar] [CrossRef]
  52. Soares, A.R.; de Ferrarese, M.L.L.; de Siqueira-Soares, R.C.; Marchiosi, R.; Finger-Teixeira, A.; Ferrarese-Filho, O. The allelochemical L-DOPA increases melanin production and reduces reactive oxygen species in soybean roots. J. Chem. Ecol. 2011, 37, 891–898. [Google Scholar] [CrossRef]
  53. Caverzan, A.; Passaia, G.; Rosa, S.B.; Ribeiro, C.W.; Lazzarotto, F.; Margis-Pinheiro, M. Plant responses to stresses: Role of ascorbate peroxidase in the antioxidant protection. Genet. Mol. Biol. 2012, 35, 1011–1019. [Google Scholar] [CrossRef] [PubMed] [Green Version]
  54. Bradley, K.W.; Wu, J.; Hatzios, K.K.; Hagood, E.S. The mechanism of resistance to aryloxyphenoxypropionate and cyclohexanedione herbicides in a johnsongrass biotype. Weed Sci. 2001, 49, 477–484. [Google Scholar] [CrossRef]
  55. Tardif, F.J.; Leroux, G.D. Translocation of glyphosate and quizalofop and metabolism of quizalofop in quackgrass biotypes (Elytrigia repens). Weed Technol. 1991, 5, 525–531. [Google Scholar] [CrossRef]
  56. Koeppe, M.K.; Anderson, J.J.; Shalaby, L.M. Metabolism of [14C]quizalofop-ethyl in soybean and cotton plants. J. Agric. Food Chem. 1990, 38, 1085–1091. [Google Scholar] [CrossRef]
  57. Zhang, X.; Wang, S.; Wang, Y.; Xia, T.; Chen, J.; Cai, X. Differential enantioselectivity of quizalofop ethyl and its acidic metabolite: Direct enantiomeric separation and assessment of multiple toxicological endpoints. J. Hazard. Mater. 2011, 186, 876–882. [Google Scholar] [CrossRef]
  58. López-Ruiz, R.; Romero-González, R.; Martínez Vidal, J.L.; Fernández-Pérez, M.; Garrido Frenich, A. Degradation studies of quizalofop-p and related compounds in soils using liquid chromatography coupled to low and high resolution mass analyzers. Sci. Total Environ. 2017, 607–608, 204–213. [Google Scholar] [CrossRef]
  59. Iwakami, S.; Uchino, A.; Kataoka, Y.; Shibaike, H.; Watanabe, H.; Inamura, T. Cytochrome P450 genes induced by bispyribac-sodium treatment in a multiple-herbicide-resistant biotype of Echinochloa phyllopogon. Pest. Manag. Sci. 2014, 70, 549–558. [Google Scholar] [CrossRef]
  60. Gaines, T.A.; Lorentz, L.; Figge, A.; Herrmann, J.; Maiwald, F.; Ott, M.C.; Han, H.; Busi, R.; Yu, Q.; Powles, S.B.; et al. RNA-Seq transcriptome analysis to identify genes involved in metabolism-based diclofop resistance in Lolium rigidum. Plant. J. 2014, 78, 865–876. [Google Scholar] [CrossRef]
  61. Chen, W.; Wu, L.; Wang, J.; Yu, Q.; Bai, L.; Pan, L. Quizalofop-p-ethyl resistance in Polypogon fugax involves glutathione. Pest. Manag. Sci. 2020, 76, 3800–3805. [Google Scholar] [CrossRef]
  62. Pégeot, H.; Koh, C.S.; Petre, B.; Mathiot, S.; Duplessis, S.; Hecker, A.; Didierjean, C.; Rouhier, N. The poplar Phi class glutathione transferase: Expression, activity and structure of GSTF1. Front. Plant. Sci. 2014, 5, 1–15. [Google Scholar] [CrossRef] [Green Version]
Figure 1. Design of CHK (no stress), DRY (drought), QPE (quizalofop-p-ethyl), and DRY × QPE (drought followed by quizalofop-p-ethyl) populations in two generations (G1 and G2) from this G0 Eragrostis plana plants.
Agriculture 12 00396 g001
Figure 2. Visual injury and shoot dry weight of Eragrostis plana populations from generations G0 (a,d), G1 (b,e), G2 (c,f) at 35 DAA of quizalofop-p-ethyl doses. Populations: no stress (CHK), drought (DRY), quizalofop (QPE), and drought × quizalofop (DRY × QPE). Parameters estimated for the curves are presented in Table 2. Error bars represent a 95% confidence interval. To run the dose-response curves, no stress was applied to the plants.
Agriculture 12 00396 g002
Figure 3. Stomatal conductance (mmol m−2 s−1) of Eragrostis plana populations CHK (a, no stress) and DRY (b, drought) with and without herbicide at 24, 48, 96, 144, and 336 h after application of quizalofop. Error bars represent 95% confidence intervals. * t-test (α = 0.05); ** t-test (α = 0.01).
Agriculture 12 00396 g003
Figure 4. Hydrogen peroxide content (nm g−1 FM; a,b) and thiobarbituric acid-reactive substances (nmol MDA g−1 FM; c,d) at 24, 48, 96 and 144 h of Eragrostis plana populations CHK (a,c, no stress) and DRY (b,d, drought) with and without herbicide hours after application of quizalofop. Error bars represent a 95% confidence interval. * t-test (α = 0.05); ** t-test (α = 0.01).
Agriculture 12 00396 g004
Figure 5. Superoxide dismutase activity (units of SOD µg−1 protein; a,b), catalase activity (units of CAT µg−1 protein; c,d), and ascorbate peroxidase activity (units of APX µg−1 protein; e,f) at 24, 48, 96, and 144 h of Eragrostis plana populations CHK (a,c,e, no stress) and DRY (b,d,f, drought) with and without herbicide hours after application of quizalofop. Error bars represent a 95% confidence interval. * t-test (α = 0.05); ** t-test (α = 0.01).
Agriculture 12 00396 g005
Figure 6. Quizalofop-p-ethyl concentration (µg g−1) unabsorbed (a,c) and absorbed (b,d) of Eragrostis plana populations (CHK–no stress and DRY-drought) at 24, 48, 96, and 144 h (a,b) and 48, 96, 192, and 336 h (c,d) after applying quizalofop. Error bars represent a 95% confidence interval. * t-test (α = 0.05).
Agriculture 12 00396 g006
Figure 7. Relative expression levels in log2 of ACCase (a), CYP72A31 (b), CYP81A12 (c), GSTL2 (d), and GSTL3 (e) gene in leaves of E. plana populations CHK-no stress–with 100 g ha−1 of quizalofop (CHK-no stress-100 g ha−1—black bars), DRY–without herbicide (DRY-drought-0 g ha−1—dark gray bars) and DRY–100 g ha−1 of quizalofop (DRY-drought-100 g ha−1—light gray bars) at 48, 96, and 192 h after application of herbicide. Error bars represent 95% confidence intervals.
Agriculture 12 00396 g007
Table 1. Target and reference genes and primers used to study the gene expression in E. plana.
Target GeneForward (5′-3′)Reverse (5′-3′)Reference
OsACT1CCTTCAACACCCCTGCTATGCAATGCCAGGGAACATAGTG[37]
Os18SCTACGTCCCTGCCCTTTGTACAACACTTCACCGGACCATTCAA[38]
OsEF1αTTTCACTCTTGGTGTGAAGCAGATGACTTCCTTCACGATTTCATCGTAA[37]
EcACCaseTAGAATTGCCGATCAATTTGTAGACTCCACTATGAGTTGAACATTTGCa
EcCYP72A31AACCGACTCAAAACCGTGACCAGAACTGGCACTTCAACCA
EcCYP81A12TCGGTAGTGGTGGAAAGAGCAACGGAGTCTTGACGAGGTG
EcGSTL2TTCCCTCGAGCACAATAACCTGCTTCTTTGCAGCATCATC
EcGSTL3GAGCGAGCTGCTTCTCAAGTAAGGCCTCGTCGATGTACTG
Os: Oryza sativa L.; Ec: Eragrostis curvula. a Oligonucleotides were designed beside on Eragrostis curvule genome.
Table 2. Visual injury and shoot dry weight of Eragrostis plana populations from generations G0, G1, and G2 at 35 DAA of quizalofop-p-ethyl doses. Equation parameters estimates a and b, 50% efficient doses (ED50 or G50) with confidence interval (CI).
aPOPbGencEquation Parameters (SE)dD50e CI 95%
AbR2p
Visual injury
CHKG00.103 (0.027) **0.010 (0.001) **0.84<0.0110.3(6.3–17.5)
CHKG10.090 (0.009) **0.009 (0.002) **0.93<0.018.2(5.3–12.0)
DRYG10.874 (0.143) **0.006 (0.001) **0.76<0.0162.4(36.5–96.8)
QPEG10.593 (0.106) **0.007 (0.009) **0.74<0.0145.6(25.3–73.2)
DRY × QPEG10.200 (0.024) **0.009 (0.003) **0.92<0.0118.2(12.6–22.5)
CHKG20.195 (0.040) **0.008 (0.005) **0.80<0.0116.2(8.8–25.0)
DRYG20.816 (0.131) **0.019 (0.002) **0.80<0.01>200.0(138- > 200)
QPEG20.398 (0.063) **0.008 (0.006) **0.81<0.0133.2(20.8–52.5)
DRY × QPEG20.326 (0.043) **0.008 (0.004) **0.86<0.0127.2(18.4–37.4)
Shoot dry weight
CHKG0101.0 (5.10) **0.51 (0.150) **0.80<0.019.2(0–20.1)
CHKG1100.3 (3.96) **0.541 (0.119) **0.87<0.019.4(1.1–17.7)
DRYG1100.1 (5.38) **0.750 (0.136) **0.75<0.0161.5(37.6–85.3)
QPEG1100.6 (7.30) **0.905 (0.184) *0.66<0.0143.6(24.0–63.0)
DRY × QPEG1100.3 (4.87) **0.790 (0.165) **0.83<0.0112.2(6.0–24.4)
CHKG2100.4 (5.85) **0.967 (0.199) **0.78<0.0123.6(12.6–34.4)
DRYG299.9 (5.80) **0.253 (0.145) ns0.40<0.01>200(>200)
QPEG2100.2 (7.09) **0.684 (0.180) **0.61<0.0145.4(18.7–72.0)
DRY × QPEG2100.1 (6.29) **0.527 (0.152) **0.66<0.0129.9(7.3–52.6)
a POP: Populations of E. plana, CHK (no stress), DRY (drought), QPE (quizalofop-p-ethyl), and DRY × QPE (drought followed by quizalofop-p-ethyl). bGen: generations of Eragrostis plana populations submitted to different stresses. cEquation parameters used, SE: standard error, ns: non-significance, * p < 0.05, ** p < 0.01, R2: Adjusted R-squared, P: model probability. dHerbicide dose required for 50% injury (ED50) or 50% shoot dry weight reduction (GR50), e D50 confidence interval (CI 95%).
Table 3. Quizalofop-p concentration (µg g−1) absorbed by Eragrostis plana populations (CHK and DRY) four times after applying quizalofop-p-ethyl, experiment 2 (24, 48, 96 and 144 h) and experiment 3 (48, 96, 192, and 336 h).
b Collection Times (Hours after Applying)
a POP244896144
CHK0.206 c (0.18)0.794 (0.16) *<LOQ<LOQ
DRY0.050 (0.29)d <LOQ<LOQe N.D.
4896192336
CHK<LOQ<LOQ<LOQ<LOQ
DRY0.116 (0.16)<LOQ<LOQN.D
a POP: Populations of Eragrostis plana, CHK (no stress) and DRY (drought). b Sampling times after applying quizalofop. c Confidence interval (95%). * t-test (α = 0.05). d Limit of quantification (LOQ). e Not determined (N.D.).
Publisher’s Note: MDPI stays neutral with regard to jurisdictional claims in published maps and institutional affiliations.

