Article

The Influence of Country Risks on the International Agricultural Trade Patterns Based on Network Analysis and Panel Data Method

1
School of Economics, Hebei University, Baoding 071000, China
2
Research Center for Resource Utilization and Environmental Protection, Hebei University, Baoding 071000, China
*
Author to whom correspondence should be addressed.
These authors contributed equally to this work.
Agriculture 2022, 12(3), 361; https://doi.org/10.3390/agriculture12030361
Submission received: 15 February 2022 / Revised: 28 February 2022 / Accepted: 1 March 2022 / Published: 3 March 2022
(This article belongs to the Section Agricultural Economics, Policies and Rural Management)

Abstract

:
The pattern of international agricultural trade is undergoing profound changes. The influence of country risks on the international agricultural trade pattern is prominent. In this paper, we comprehensively analyze the international agricultural trade patterns and explore the influence of country risks on them. Specifically, we first construct an international agricultural trade network (IATN) based on complex network theory. Second, we analyze each country’s diversity of import sources and the position of countries in the IATN using the Herfindahl–Hirschman Index (HHI) and network indicators, such as in-degree, out-degree, weighted in-degree, weighted out-degree, and betweenness centrality. Third, this paper explores the influence of different types of country risks, including economic risk and political risk, on international agricultural trade patterns using the panel regression method. The results show that countries played different roles and occupied different positions in the international agricultural trade pattern; notably, the United States occupied a core position, while Japan and Mexico had insufficient diversity in import sources. Moreover, based on the panel regression method, we find that political risks have a positive impact on the agricultural trade pattern, while an unstable economic environment could inhibit the agricultural trade pattern in various countries. This study could provide references for countries to implement agricultural trade policies regarding country risks to ensure stable agricultural trade relations and national food security.

1. Introduction

The complicated international trade relations have been widely studied from a network perspective [1,2]. Agricultural products are one of the most important bulk commodities in international trade. In 2020, the international trade volume of agricultural products reached 6.3 trillion dollars, accounting for about 9.1 percent of international trade. With the globalization of economic development, an increasing number of countries have joined the international agricultural market, forming a complex trading network [3,4]. The position and role of each country in the agricultural trade network are different. For example, the United States exports a large number of agricultural products and has many trading partners due to its large amount of arable land area and technological advantages, while some countries must rely on imports to meet their domestic needs. In this complex agricultural trading network, the factors that determine agricultural trade patterns have attracted the attention of many scholars [5,6,7,8]. The political landscape of the world is unstable and in turmoil, and the economic development of countries was seriously hindered due to financial and economic crises, such as the 2008 financial crisis, the European debt crisis, and COVID-19. Political and economic risks severely impede agricultural production and trade relations among countries, leading to high risks of world food security. Therefore, a better understanding of agricultural trade patterns and the influence of country risks on them can help countries implement agricultural trade policies to ensure stable agricultural trade relations and national food security.
The existing literature on agricultural trade has focused on the following three aspects. Firstly, many scholars studied the agricultural trade patterns of individual countries [9,10,11]. On the one hand, some scholars analyzed the changes in agricultural product trade before and after the occurrence of particular events in specific countries. For example, some researchers proved that, after China joined the WTO and South Korea implemented the FTA, their agricultural trade volume increased significantly [12,13]. On the other hand, some scholars identified the factors that affect a country’s agricultural trade [14,15], such as GDP [16] agricultural policy [17,18], and agricultural factor endowment [19,20].
Secondly, bilateral trade relations in agricultural products and their influencing factors have been examined [21,22,23]. For example, Zheng and Qi [24] found that there existed great potential for more agricultural trade between China and the United States and that positive and effective trade policies could maximize agricultural trade development for the mutual benefit of both countries. Researchers argued that GDP has a positive effect on agricultural trade, while the distance between two countries has a negative effect [25,26,27].
Thirdly, to study the multilateral relation among countries, researchers used the network analysis method and constructed global or regional agricultural trade networks with countries as nodes and trade relations as edges. In the network, the trade volume between countries represents the weight of the edge [4]. On the one hand, based on the network analysis method, the structure and evolution of the international agricultural trade pattern [28] and the position of the country in the network [29] were analyzed [30,31]. The countries were divided into three communities according to the “core–periphery” structure, and international agricultural trade exhibits a diversified and multipolar development trend [32]. Furthermore, researchers confirmed that the US, EU, and ASEAN ranked highly in the centrality and position in the agricultural trade network [33]. On the other hand, scholars have paid more attention to the formation mechanism of agricultural trade, such as agricultural resource endowment, spatial distance, economic scale, degree of trade facilitation, and external factors [34,35,36].
The existing literature has conducted profound analyses of agricultural trade patterns and evolutionary trends by complex network methods, but there are still two aspects that need to be improved. On the one hand, the status of each country in the network can still be further studied. Existing researchers typically used a single network indicator to describe the role of countries, such as the number of import partners (in-degree) and the volume of import trade (weighted in-degree). However, a single complex network indicator cannot comprehensively capture the trade status of a country. For example, country A only has one agricultural import partner named country C, while country B has 50 agricultural import partners, including country C. However, almost all the agricultural products of country B are imported from country C. If country C cuts off trade with countries A and B, the agricultural product supply of both countries A and B will suffer a huge impact no matter how many import partners they have. Thus, it is one-sided to analyze trade import risk or trade diversity by considering only the number of import partners or trade volume of a country. Therefore, in this paper, based on the use of complex network indicators to describe the status and evolution of each country in the agricultural trade network, we combine import partners and import trade volume and use the Herfindahl–Hirschman Index (HHI) to reflect the diversification import sources of countries. On the other hand, existing studies neglected that country risks are inevitable factors when agricultural products are traded between countries. In fact, the trading relationships of agricultural importers and exporters are easily affected by country risks, such as the 2008 financial crisis and the COVID-19 pandemic. Therefore, to comprehensively discuss the impact of country risks on agricultural trade patterns, we choose to study different types of country risk (political risk and economic risk) from those described in the International Country Risk Guide (ICRG) [37].
In this paper, we establish an international agricultural trade network (IATN) from 1996 to 2019. The HHI is used to measure the diversity of import sources, while the number of trading partners, trade volume, intermediary centrality, closeness centrality, and eigenvector centrality are used to explore the patterns of and roles played in agricultural trade. Finally, we combine the HHI and network indicators as dependent variables to explore the impact of country risks on agricultural trade patterns based on the panel regression method. The results show that country risks can significantly affect agricultural trade patterns.
The rest of the paper is arranged as follows. Section 2 introduces the data and methods. Section 3 discusses the empirical results. Section 4 describes the conclusion and policy implications.

2. Materials and Methods

2.1. Data

There has been no clear international definition of agricultural produce until now, and the definition of agricultural products varies greatly between countries. We use “cereals” as a proxy variable for agricultural products because cereals describe the major food crops, including coarse grains, rice, and wheat. Therefore, the agricultural trade data from 1996 to 2019 are obtained from the United Nations Commodity Trade Statistics Database. The data set is comprised of trade flow data from 226 countries. The HS code is 10 and the category is cereals, including wheat, oats, corn, rice sorghum, and other grains.
The country risks data, which include political risk and economic risk, come from the ICRG. Due to limitations on data availability, this paper uses the data from 1996 to 2017. The political risk index has 12 subindices, including government stability, socioeconomic conditions, investment profile, internal conflicts, external conflicts, corruption, political and military affairs, religious tensions, legal order, ethnic tensions, degrees of democracy, degrees of bureaucracy, and economic risks. The economic risk index has 5 subindices, namely per capita GDP, real GDP growth, inflation rate, budget balance as a percentage of GDP, and current account as a percentage of GDP. Therefore, Equations (1) and (2) are used in this paper to calculate the political risk index and the economic risk index. The larger the value of the risk index, the higher the risk of the country.
P o l R i s k i = j = 1 12 ( m a x P o l R i s k j P o l R i s k i j ) ,
E c o R i s k i = j = 1 5 ( m a x E c o R i s k j E c o R i s k i j ) ,
where P o l R i s k i is the subindex of political risk j of country i , m a x P o l R i s k j is the maximum value of the subindex of political risk j , E c o R i s k i is the subindex of economic risk j of country i , and m a x E c o R i s k j is the maximum value of subindex of the economic risk j .
We select exchange rate, GDP, and cultivated land area as control variables. The data from 1996 to 2017 are downloaded from the World Bank database.

2.2. Method

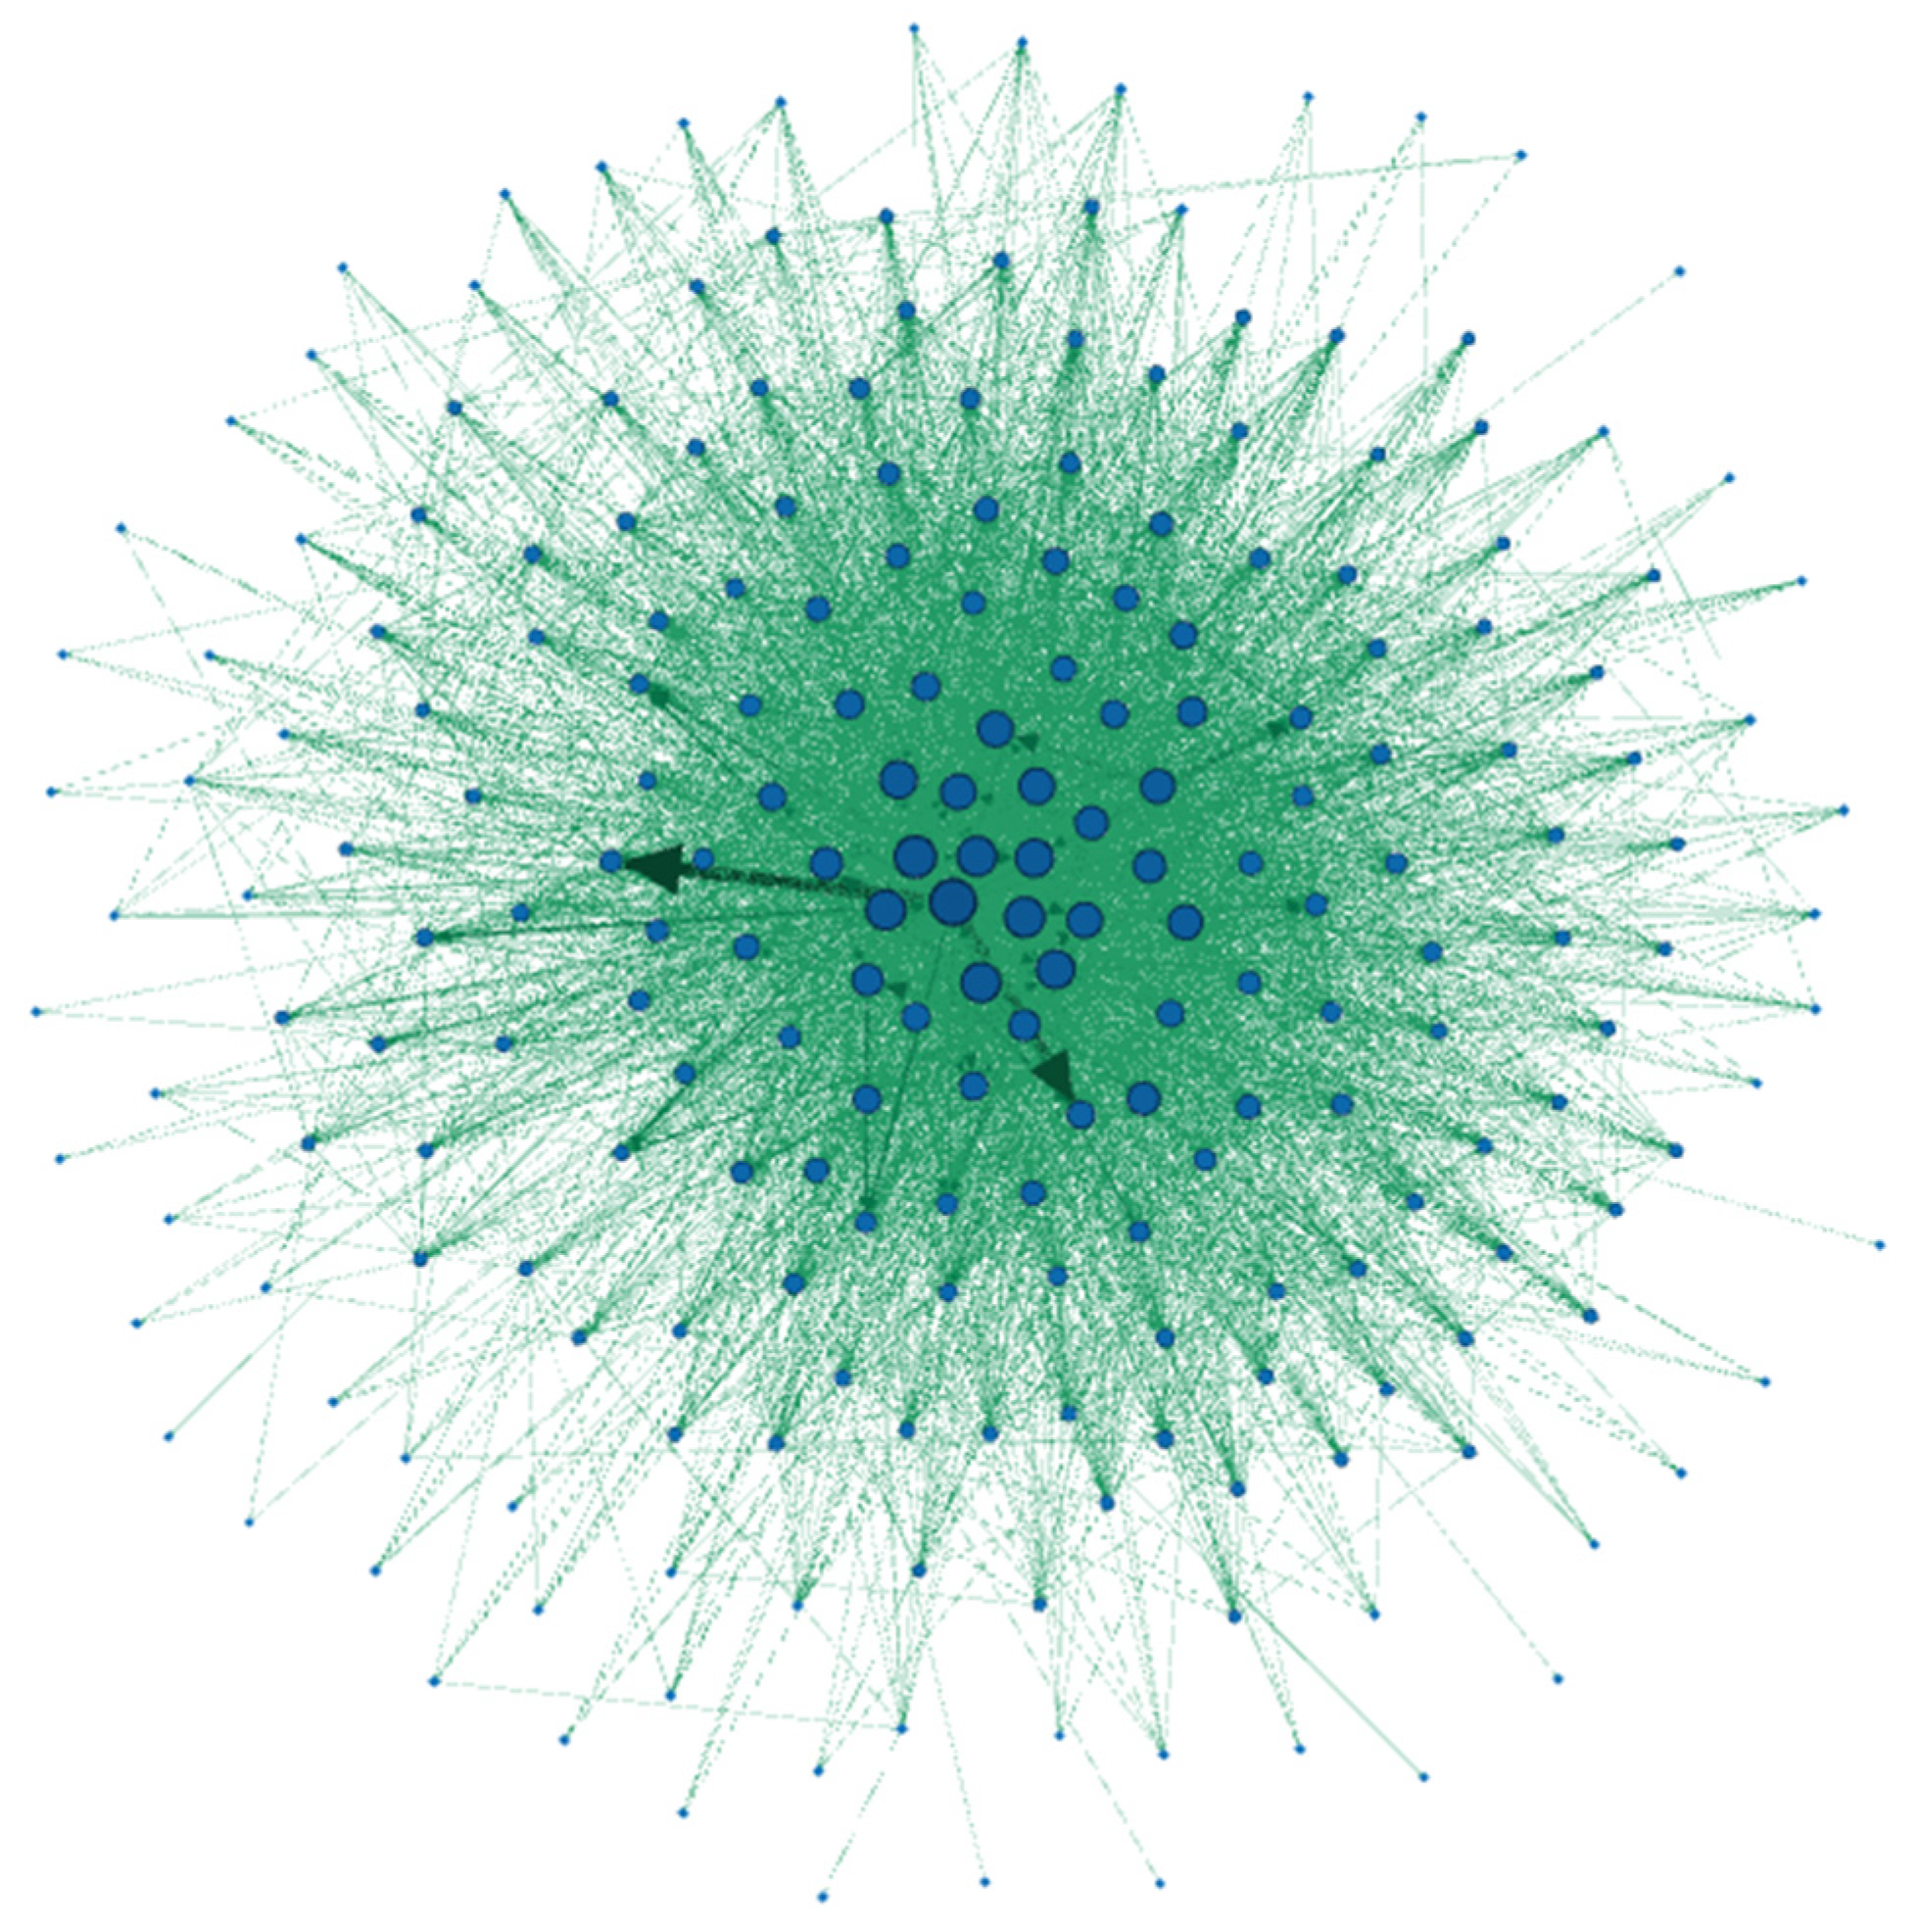
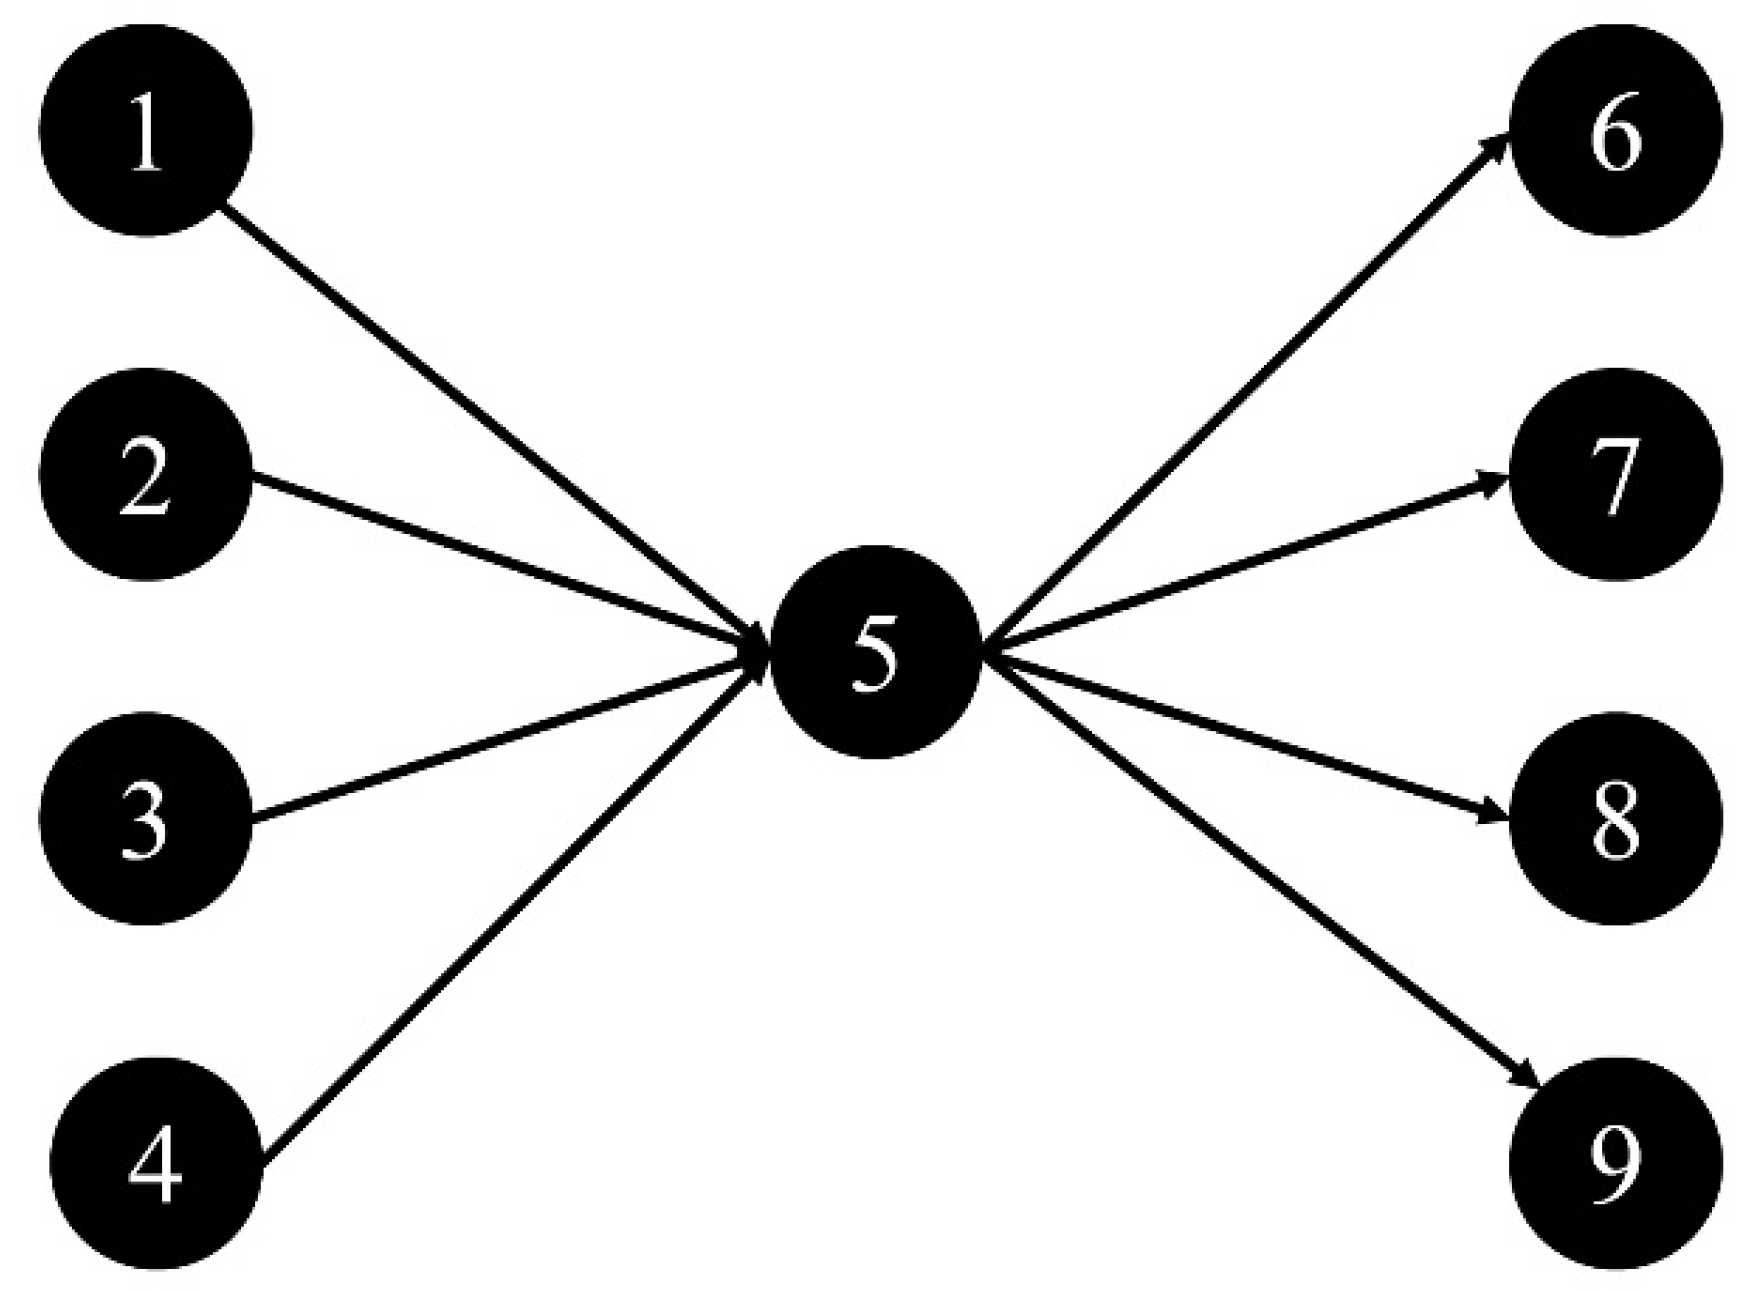
2.2.1. The IATN Model

In this study, we construct an IATN model based on complex network theory. A complex system can be abstractly depicted by a complex network comprised of nodes and edges. In the IATN, nodes represent countries, edges represent trade relations, and the direction of the edges is the trade flows. The weights of the edges denote the volume of agricultural trade. Therefore, IATN is directional and weighted. The IATN of the network matrix is defined by Equation (3):
I A T N = ( V c o u n t r i e s , A t r a d e   f l o w s ) = [ 0 A 1 j a A 1 n a A i 1 a A i j a A i n a A n 1 a A n j a 0 ] ,
where a represents the year. V c o u n t r i e s is the node set, A t r a d e   f l o w s is the edge set, n is the number of countries, and A 1 j a represents the trade volume of agricultural products exported from country i to country j in year a . Figure 1 shows the agricultural trade network in 2019.

2.2.2. Structural Parameters of the IATN

This article uses five structural parameters of the IATN and HHI to measure the trade patterns of different countries.
1.
Number of trading partners in agricultural products:
In the IATN, the degree of a country reflects the number of direct trade connections that the country possesses. The degree is the sum of the in-degree (ID) and the out-degree (OD). Among them, in-degree represents the number of countries from which country i imports and the value of out-degree represents the number of countries to which country i exports. These indicators are calculated as follows:
I D i = j = 1 N a j i ,
O D i = j = 1 N a i j ,
D e g r e e i = I D i + O D i ,
where N is the total number of nodes in the network. When country i imports agricultural products from country j , a j i = 1, which indicates that there is a connection from country i to country j . Otherwise, a i j   = 0.
2.
Trade volumes of agricultural products:
The weighted degree (WD) of country i reflects the total trade volume of the country in the international agricultural trade network. This indicator can also be divided into two sub-indicators, namely weighted in-degree (WI) and weighted out-degree (WO). The weighted degree is the sum of the weighted in-degree and the weighted out-degree. The value of the weighted in-degree of country i represents its total import value from all the other countries, and the value of the weighted out-degree of country i represents its total export volume to all the other countries. The formulas are as follows:
W I i = j = 1 N A i j ,
W D i = j = 1 N A j i ,
W D i = W I i + W D i ,
where A i j represents the total amount of imports from country j to country i , and A j i represents the total amount of exports from country i to country j .
3.
Herfindahl–Hirschman Index (HHI):
We construct the HHI [38] to reflect the diversification of the sources of imported agricultural products of country i , which is defined as H H I i . HHI can describe the dispersion and diversity of import sources of country i in IATN. The HHI of country i is calculated as follows:
H H I i = j = 1 N ( A i j W I i ) 2 ,
where A i j is the trade volume of agricultural products imported by country i from country j , W I i is the weighted import degree of country i , namely the total import volume of agricultural products of country i . The range of HHI is (0,1]. The smaller the HHI is, the more dispersion and diversity present in a country’s trade. When country i has only one source for agricultural trade, the HHI takes the maximum value of 1.
4.
The intermediary capacity of countries in the IATN:
Betweenness centrality (BC) reflects the power of a country as a bridge in the network. BC represents the ratio of the number of shortest paths through the country to the number of all possible paths. We use betweenness centrality [39] to measure the ability of intermediaries, which is defined as B C i .
B C i = j n k n g j k ( i ) g j k , j k i , j < k ,
where i , j , and k represent different countries, g j k is the number of shortest paths between country j and k , and g j k ( i ) is the number of shortest paths between nodes j and k through country i . The larger B C i is, the more prominent the role of country i as a bridge is, and, the more central the network position is, the more this country can control the agricultural trade relations among other countries. As shown in Figure 2, if countries 1, 2, 3, and 4 want to trade agricultural products with countries 6, 7, 8, and 9, they must pass through country 5; thus, country 5 controls the transmission among other countries and has a high intermediary ability.
5.
The closeness centrality of countries in the IATN:
Closeness centrality (CC) measures the sum of the length of the path of a country when establishing contact with other countries, and it reflects the country’s distance from other countries in the network. Moreover, this indicator reflects the resource anti-control ability of the international trade network [37].
C C i = 1 i j d ( i , j ) ,
In Equation (12), d ( i , j ) represents the shortest path length between country i and country j (this path is the partnership generated by agricultural trade). C C i describes the path length when country i establishes agricultural trade relations with other countries. The larger the value, the shorter the path length when country i establishes agricultural trade relations with other countries, and the easier it is to trade within the network.
6.
The eigenvector centrality of countries in the IATN:
Eigenvector centrality (EC) reflects the relationship between a country and other important countries in the network. If a country establishes a relationship with a country that has a central position in the network, then the value of its eigenvector centrality will increase [37].
E C i = 1 λ J N i A i j E C j .
In the above equation, λ is a constant, N i represents the set of nodes that have a relationship with country i , and A i j represents the trade volume from country i to country j . E C j describes the relationship between country i and important countries in the network. The larger the value, the stronger the agricultural trade links with important countries, and the more stable the trade is.

2.3. The Establishment of the Regression Model

This article explores the impact of country risks on agricultural trade patterns, including HHI, degree, weighted degree, betweenness centrality, closeness centrality, and eigenvector centrality. Due to limitations on the availability of data, a panel regression model is established based on 1996–2017 data from 127 countries. The model is as Equation (14).
Y i t = β 1 G D P + β 2 R a t e + β 3 F i e l d + β 4 P o l R i s k + β 5 E c o R i s k + λ i + u i t ,
where t represents the year. The dependent variable, Y i t , refers to the trade network indicators of country i in year t , including degree, weighted degree, HHI, betweenness centrality, closeness centrality, and eigenvector centrality, respectively. The independent variables include political risk and economic risk, and the control variables are GDP, the exchange rate (Rate), and cultivated land area (Field). β 1 , …, β 5 are regression coefficients, λ i is the constant item related to the country, and u i t is the random variable.

3. Results and Discussion

3.1. International Agricultural Trade Pattern

In this study, we construct an IATN from 1996 to 2019. Analyzing the evolution of network topology features will help us understand the patterns in the agricultural trade and the degree of participation of each country in international agricultural trade.

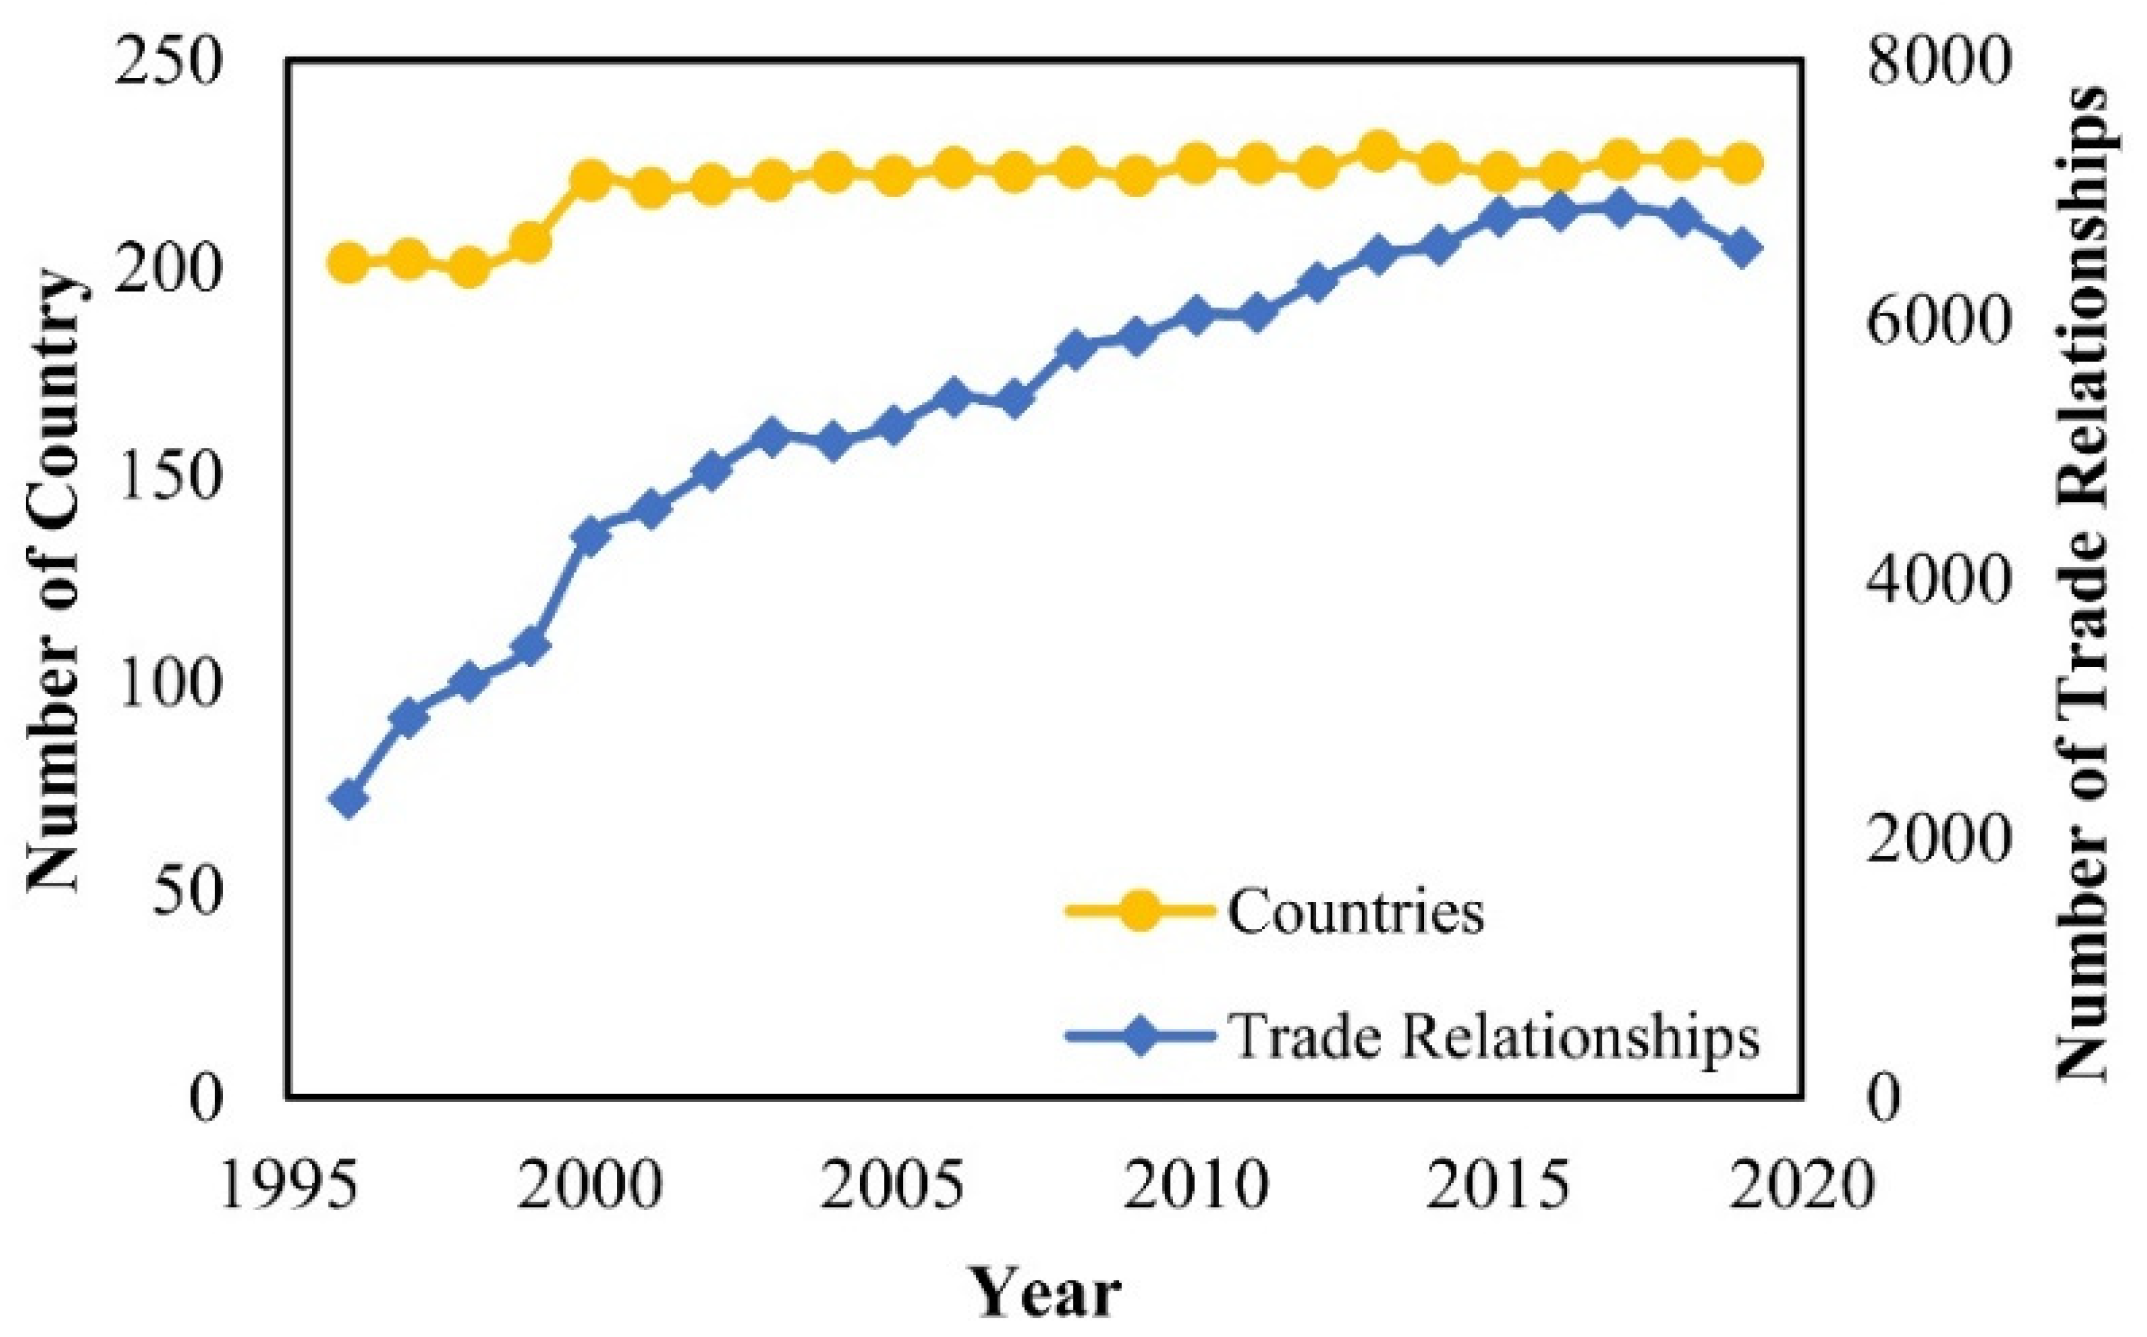
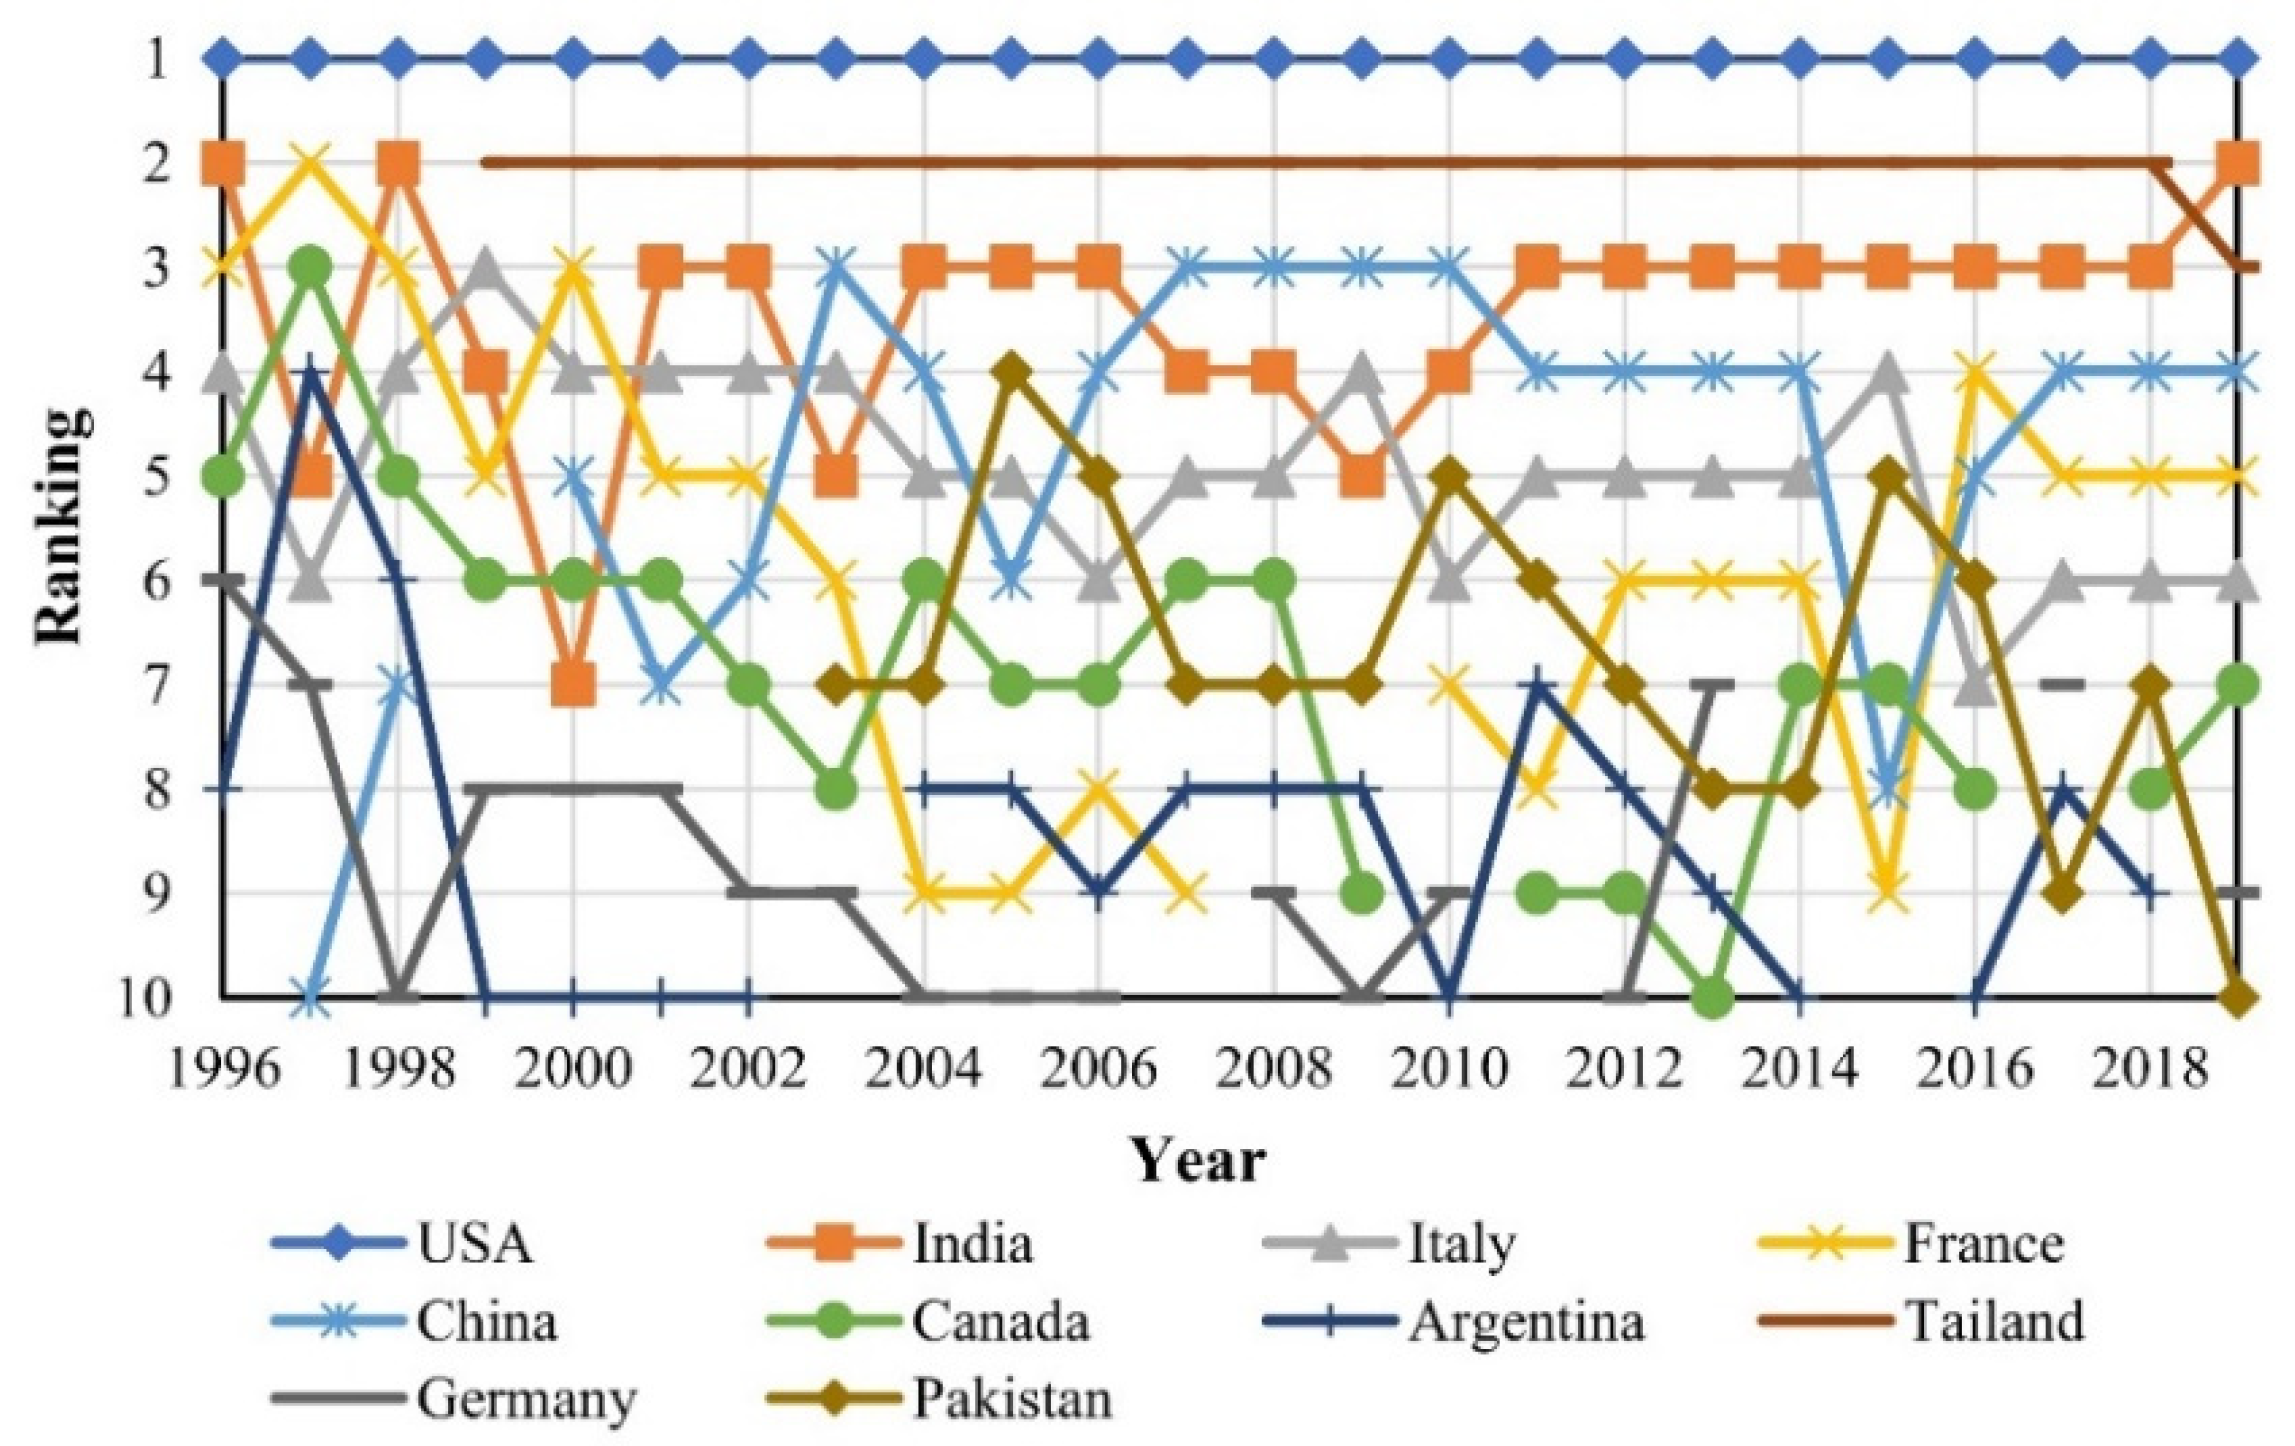
3.1.1. The Number of Trade Partners and Trade Relationships

The evolution of the number of points and edges over time is shown in Figure 3. First, we analyze the number of countries in the IATN. Between 1996 and 2019, 202 to 226 countries were involved in agricultural trade. After 2000, the number of countries stabilized. Second, over this period, the number of trade relations in the IATN sustained an upward trend, with slight fluctuations. After 2016, trade relations gradually stabilized. Thus, while the number of countries remained unchanged, the number of edges continued to increase, which means that, before 2015, international agricultural trade relations gradually became more complex as more countries participated in international agricultural trade and established new partners. However, the international agricultural trade structure was stable and the partnerships among countries did not change significantly.
Figure 3 shows only the overall evolutionary trend of the number of import partners in international agricultural trade and thus cannot reflect the specific situation of each country. Therefore, this paper extracted the top 10 countries in terms of the number of import partners in agricultural trade, as shown in Figure 4. The top 10 countries are mostly from North America and Europe. From 1996 to 1999, Germany had the greatest number of import relationships. However, from 2000 to 2008, the United States topped the list. Between 2009 and 2016, the country with the most import relationships alternated between the Netherlands, the United States, and Germany. Because of its developed food processing industry, France generated demand for a variety of agricultural products and was the country with the greatest number of import partners from 2017 to 2019. Due to the large demand for food and the subsequent import demand for a variety of agricultural products, some countries with rich import partners had the ability to anti-control agricultural resources, such as the United States, Germany, the Netherlands, France, etc., even though their agriculture was relatively developed.
We also identify the 10 countries with the largest number of export partners; the evolution of countries and their rankings are shown in Figure 5. We find an interesting phenomenon in which some countries with many import partners also have a high number of export partners. More specifically, the United States, which ranked first in the number of import partners, also ranked first in the number of export partners during the whole observation period. The United States is the largest agricultural exporter in the world, and its advanced agricultural production, harvesting technology, and a high degree of mechanization sustained its top position in the number of export relationships for a long time. From 1999 to 2018, Thailand occupied second place in the number of export relationships, while China and India also remained in the top five for a sustained period.

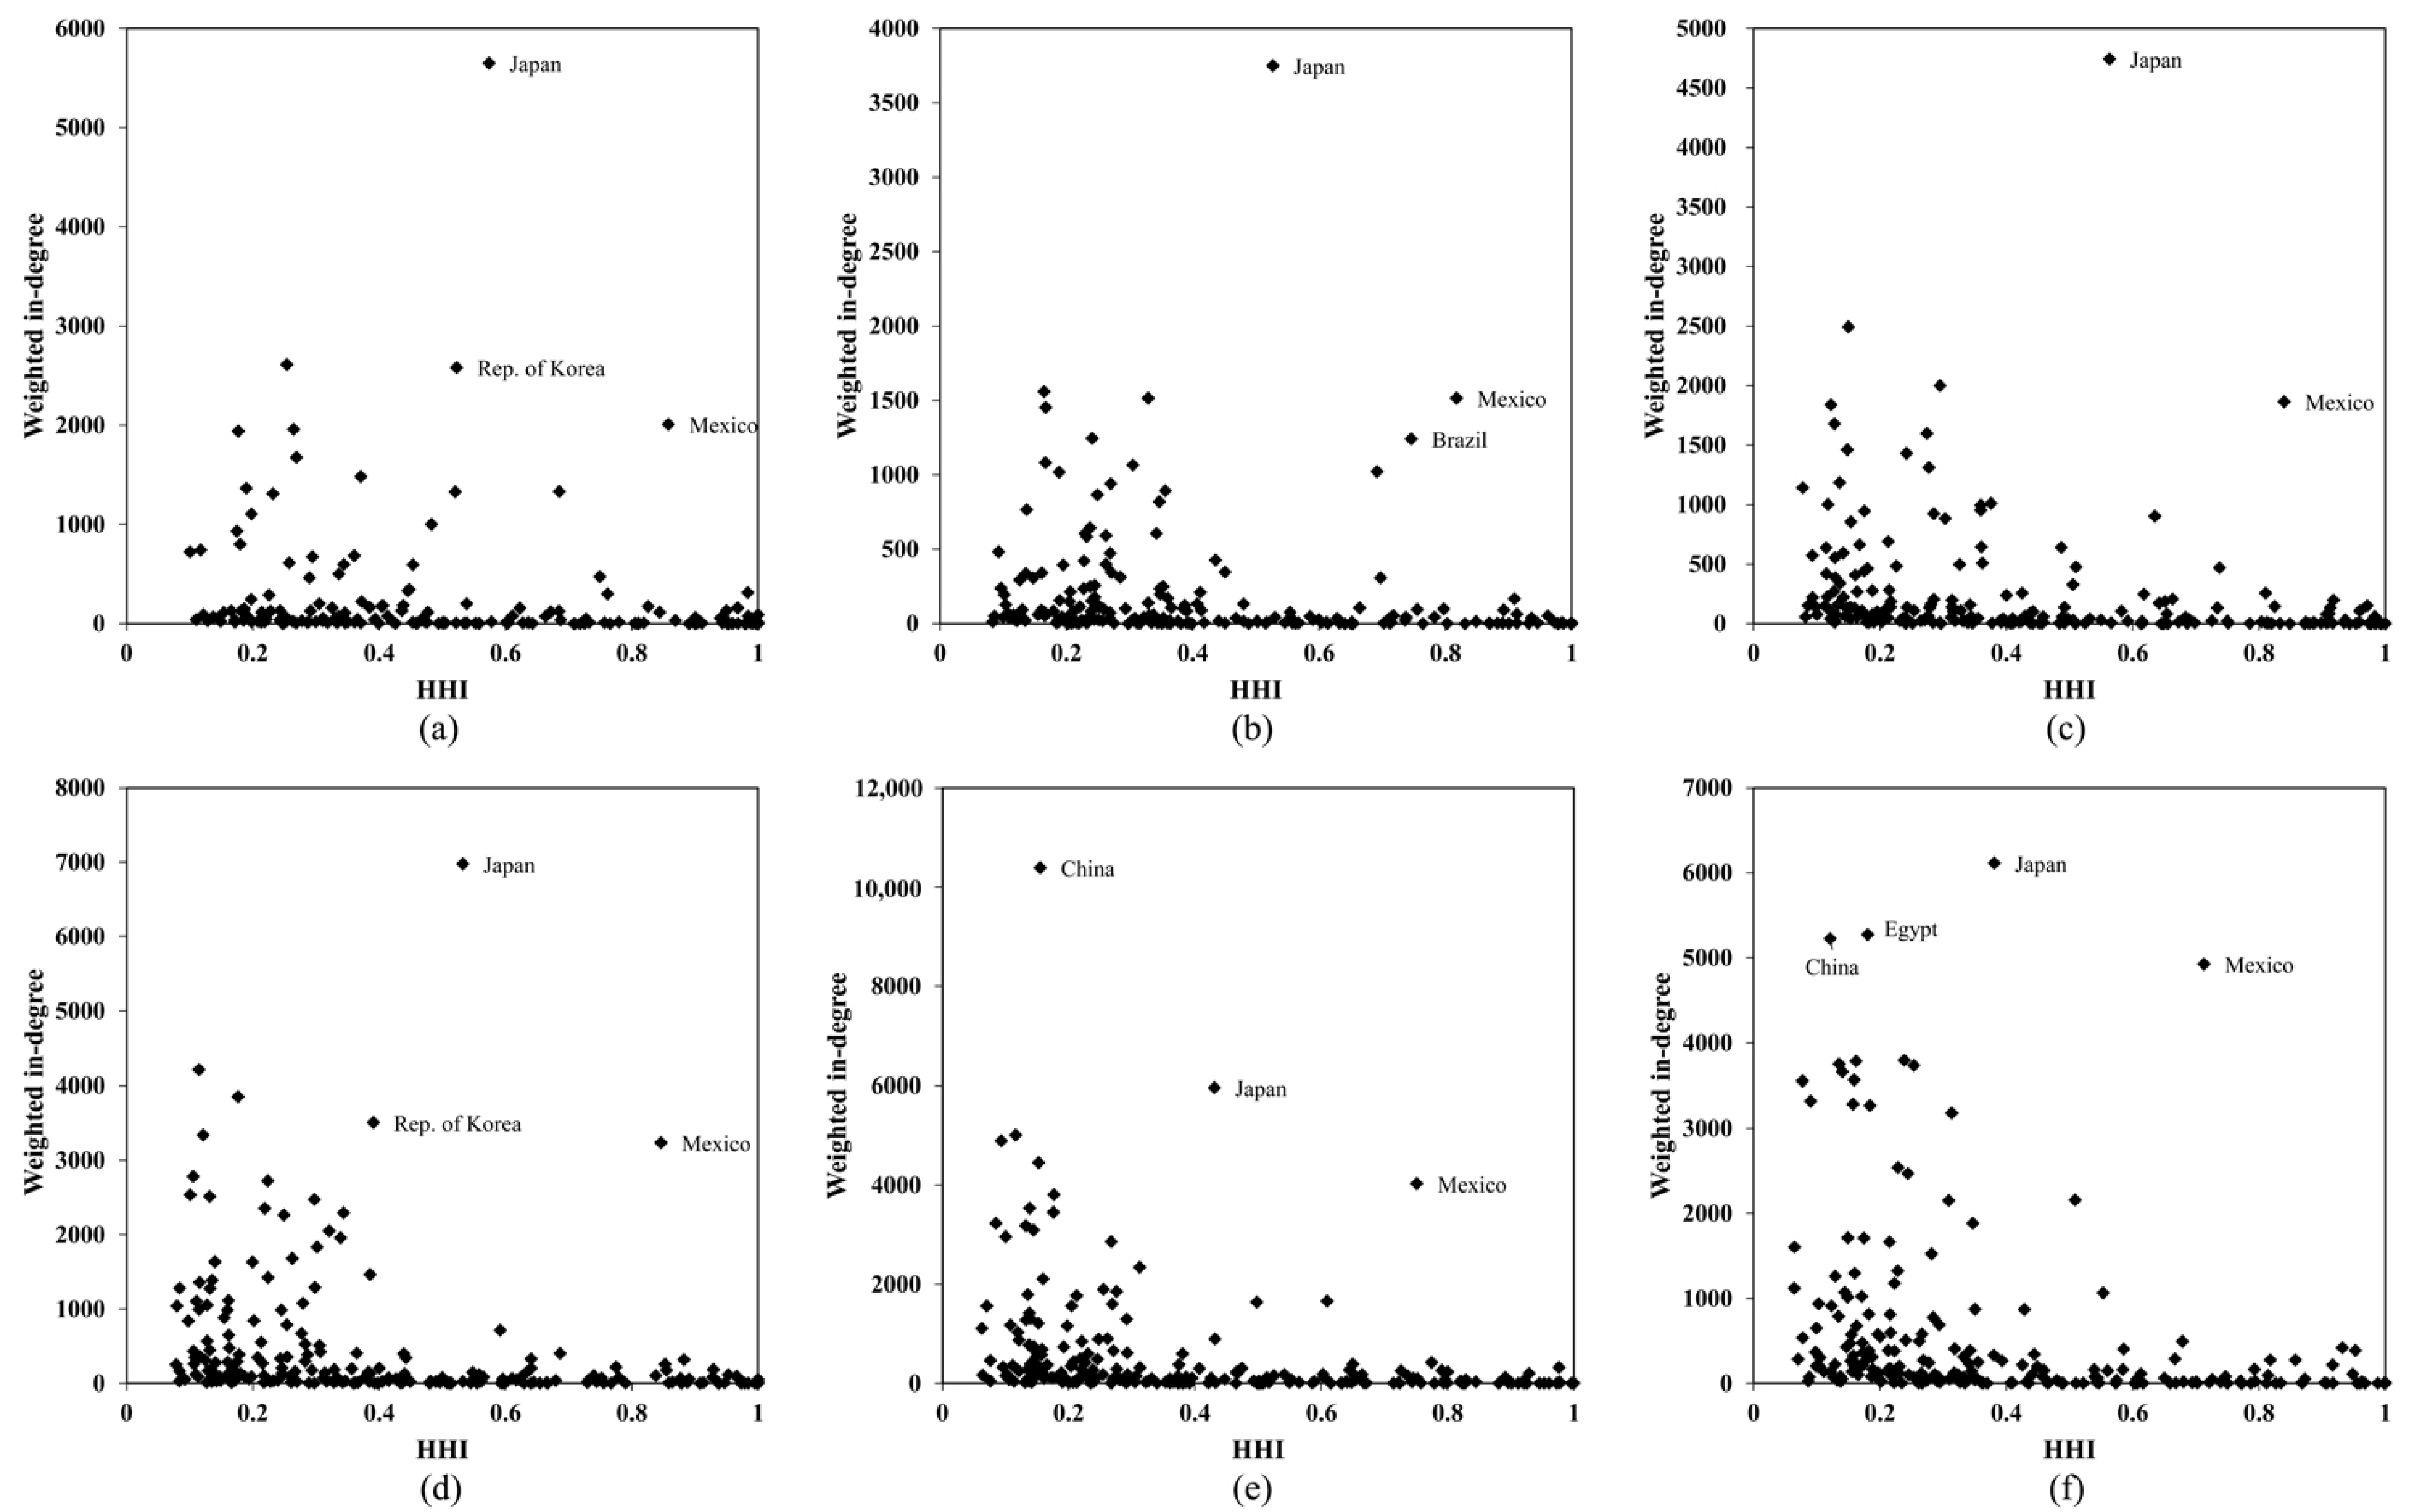
3.1.2. The Diversity of Import Source

HHI is an index that represents the diversity of import sources. When a country imports agricultural products from more countries, its import trade becomes more diversified and, therefore, more stable. As this process occurs, the HHI of the country will decrease. Figure 6 shows the relationship between HHI and import volume for each country. Due to limitations in space, only six years of data (1996, 2000, 2005, 2010, 2015, and 2019) are shown in the scatter plots here. Some countries, such as Japan, Mexico, and South Korea, had large but concentrated import trade volumes. These countries imported a large proportion of their total import volume of trade in agricultural products from one country. For example, Japan and Mexico imported more than 50% of their total imports of agricultural products from the United States. If the United States were to cut import links for some reason, the supply of agricultural products in Japan and Mexico would be severely impacted. Therefore, in light of the risks of shipping and natural disasters, to ensure a stable supply of agricultural products, countries should diversify their import sources instead of importing agricultural products from a single or a few countries.

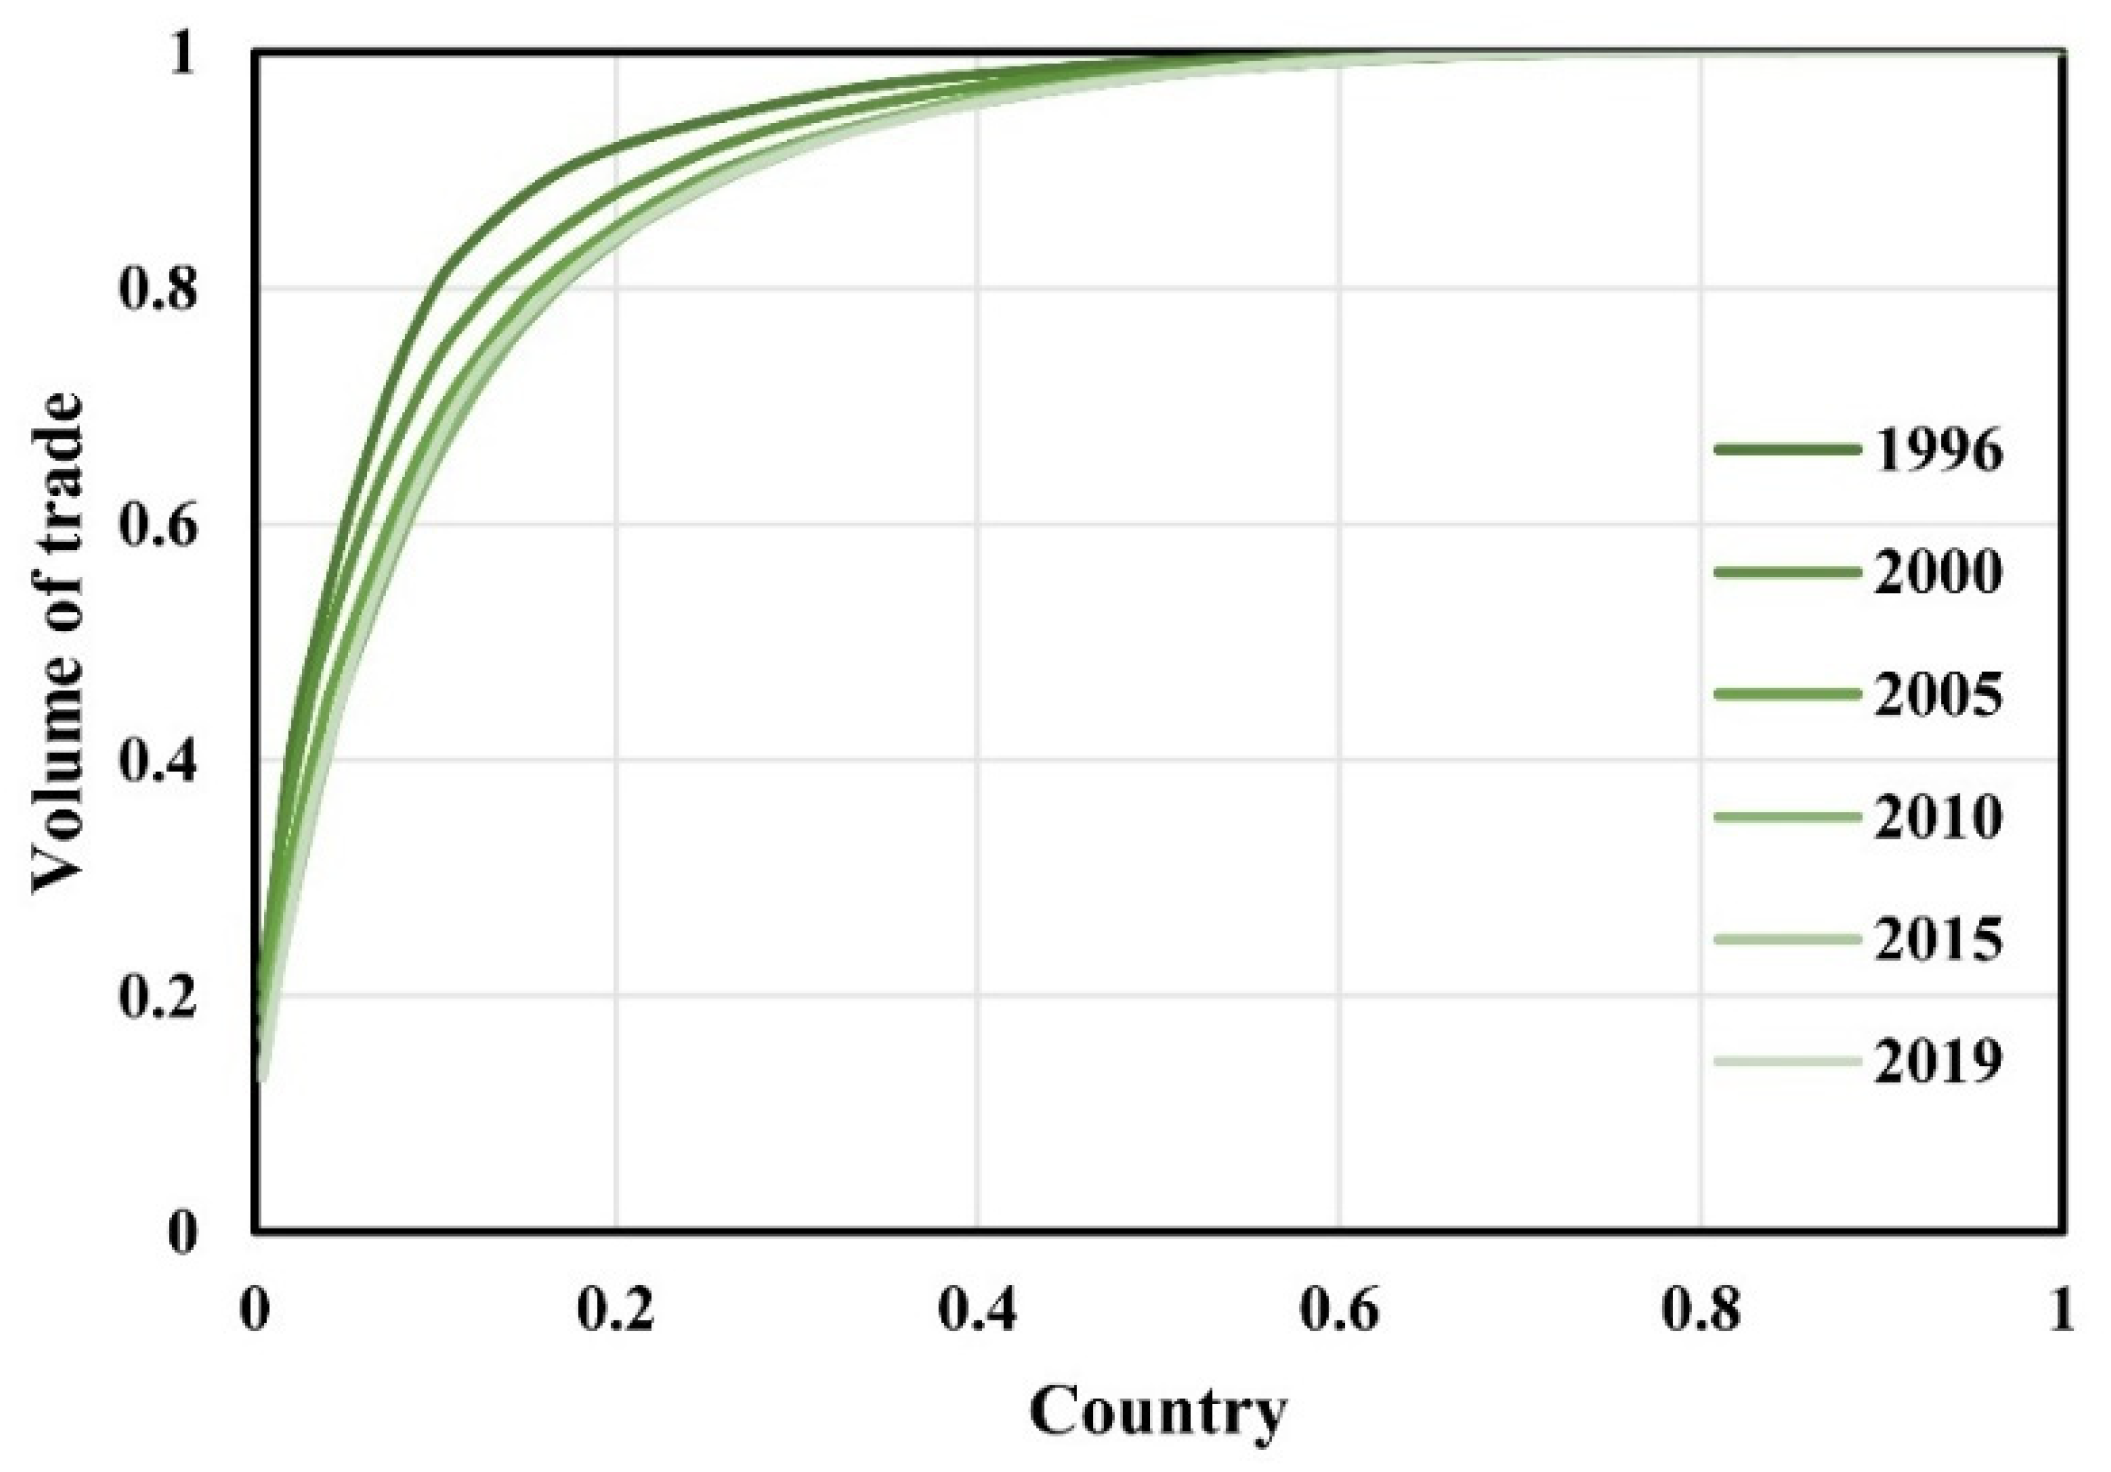
3.1.3. The Trade Volumes among Countries

To clearly display the distribution of the agricultural trade volume of all countries, we select six years of trade data for display, namely 1996, 2000, 2005, 2010, 2015, and 2019. The cumulative distribution of trade volume between countries is shown in Figure 7. First, we should pay attention to the convexity of the curve. When the cumulative proportion of countries is 20%, the trade volume reaches more than 80%, which indicates that most of the trade volume of agricultural products is concentrated in a few countries. Furthermore, we should notice the gap between the curves moving toward the upper left corner. This means that, from 1996 to 2019, the concentration of trade in agriculture gradually declined and then stabilized. The reason may be that, as economies globalize, countries recognize the need to diversify their sources of imports and exports. As production technology matures and the output of agriculture in various countries stabilizes, the concentration of import and export agricultural trade also stabilizes.

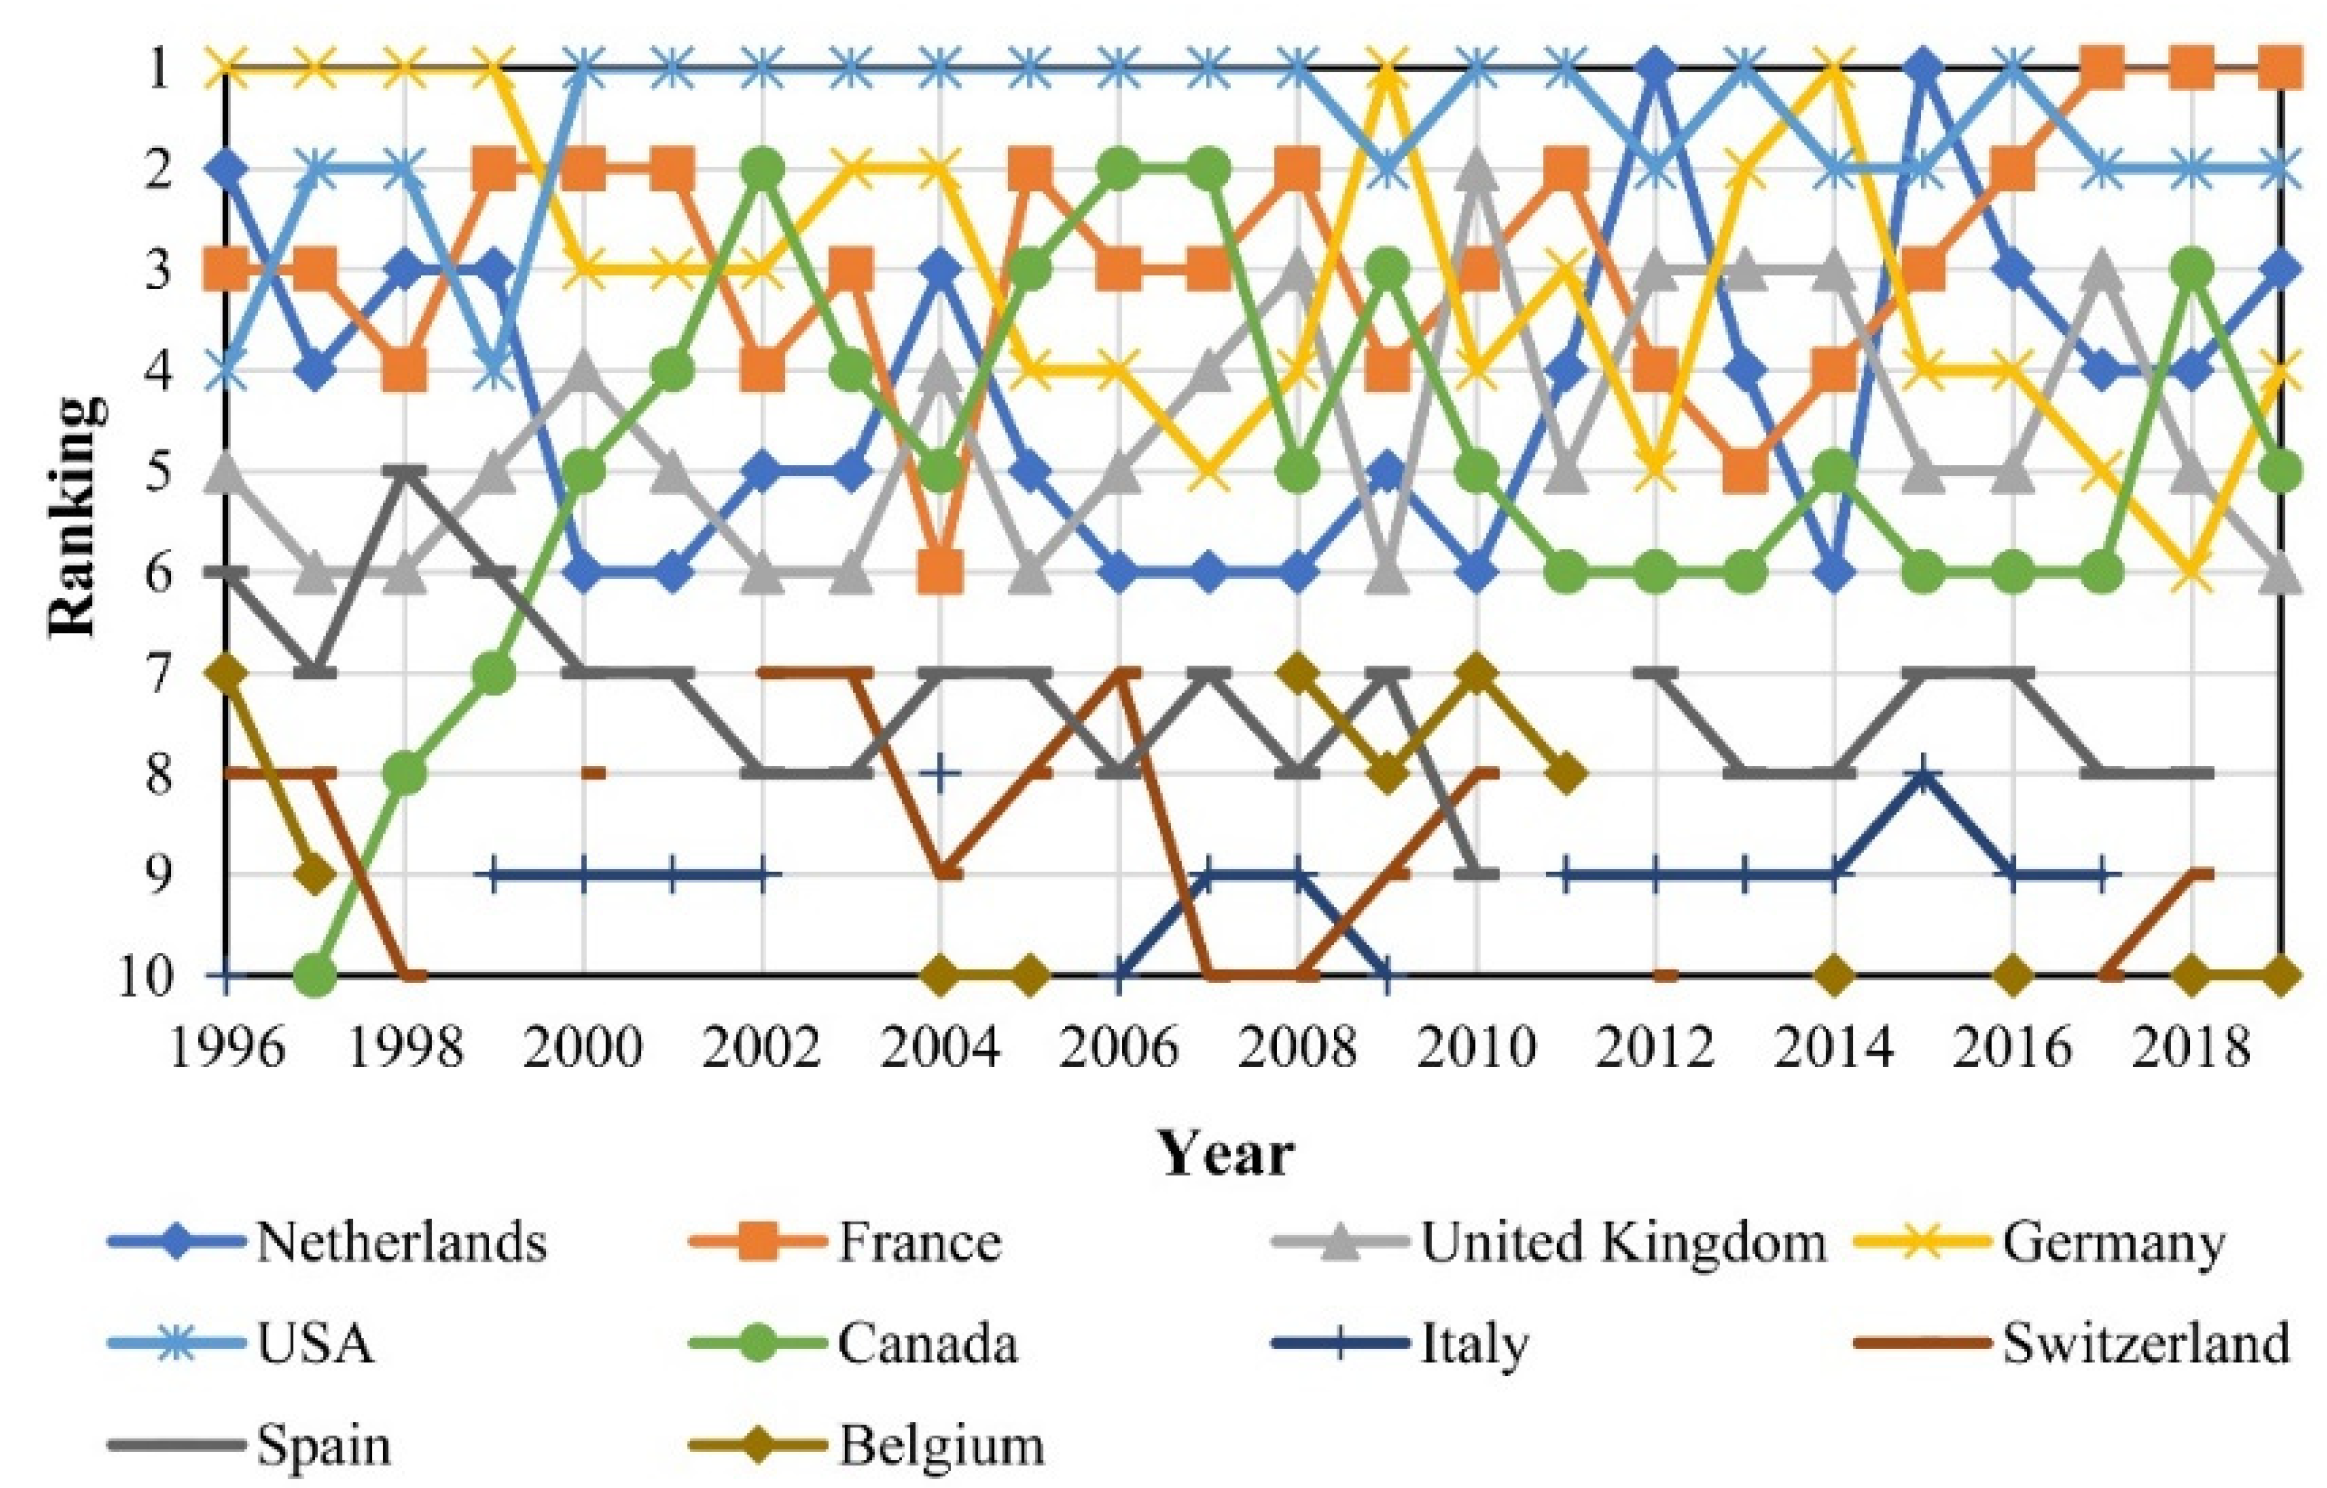
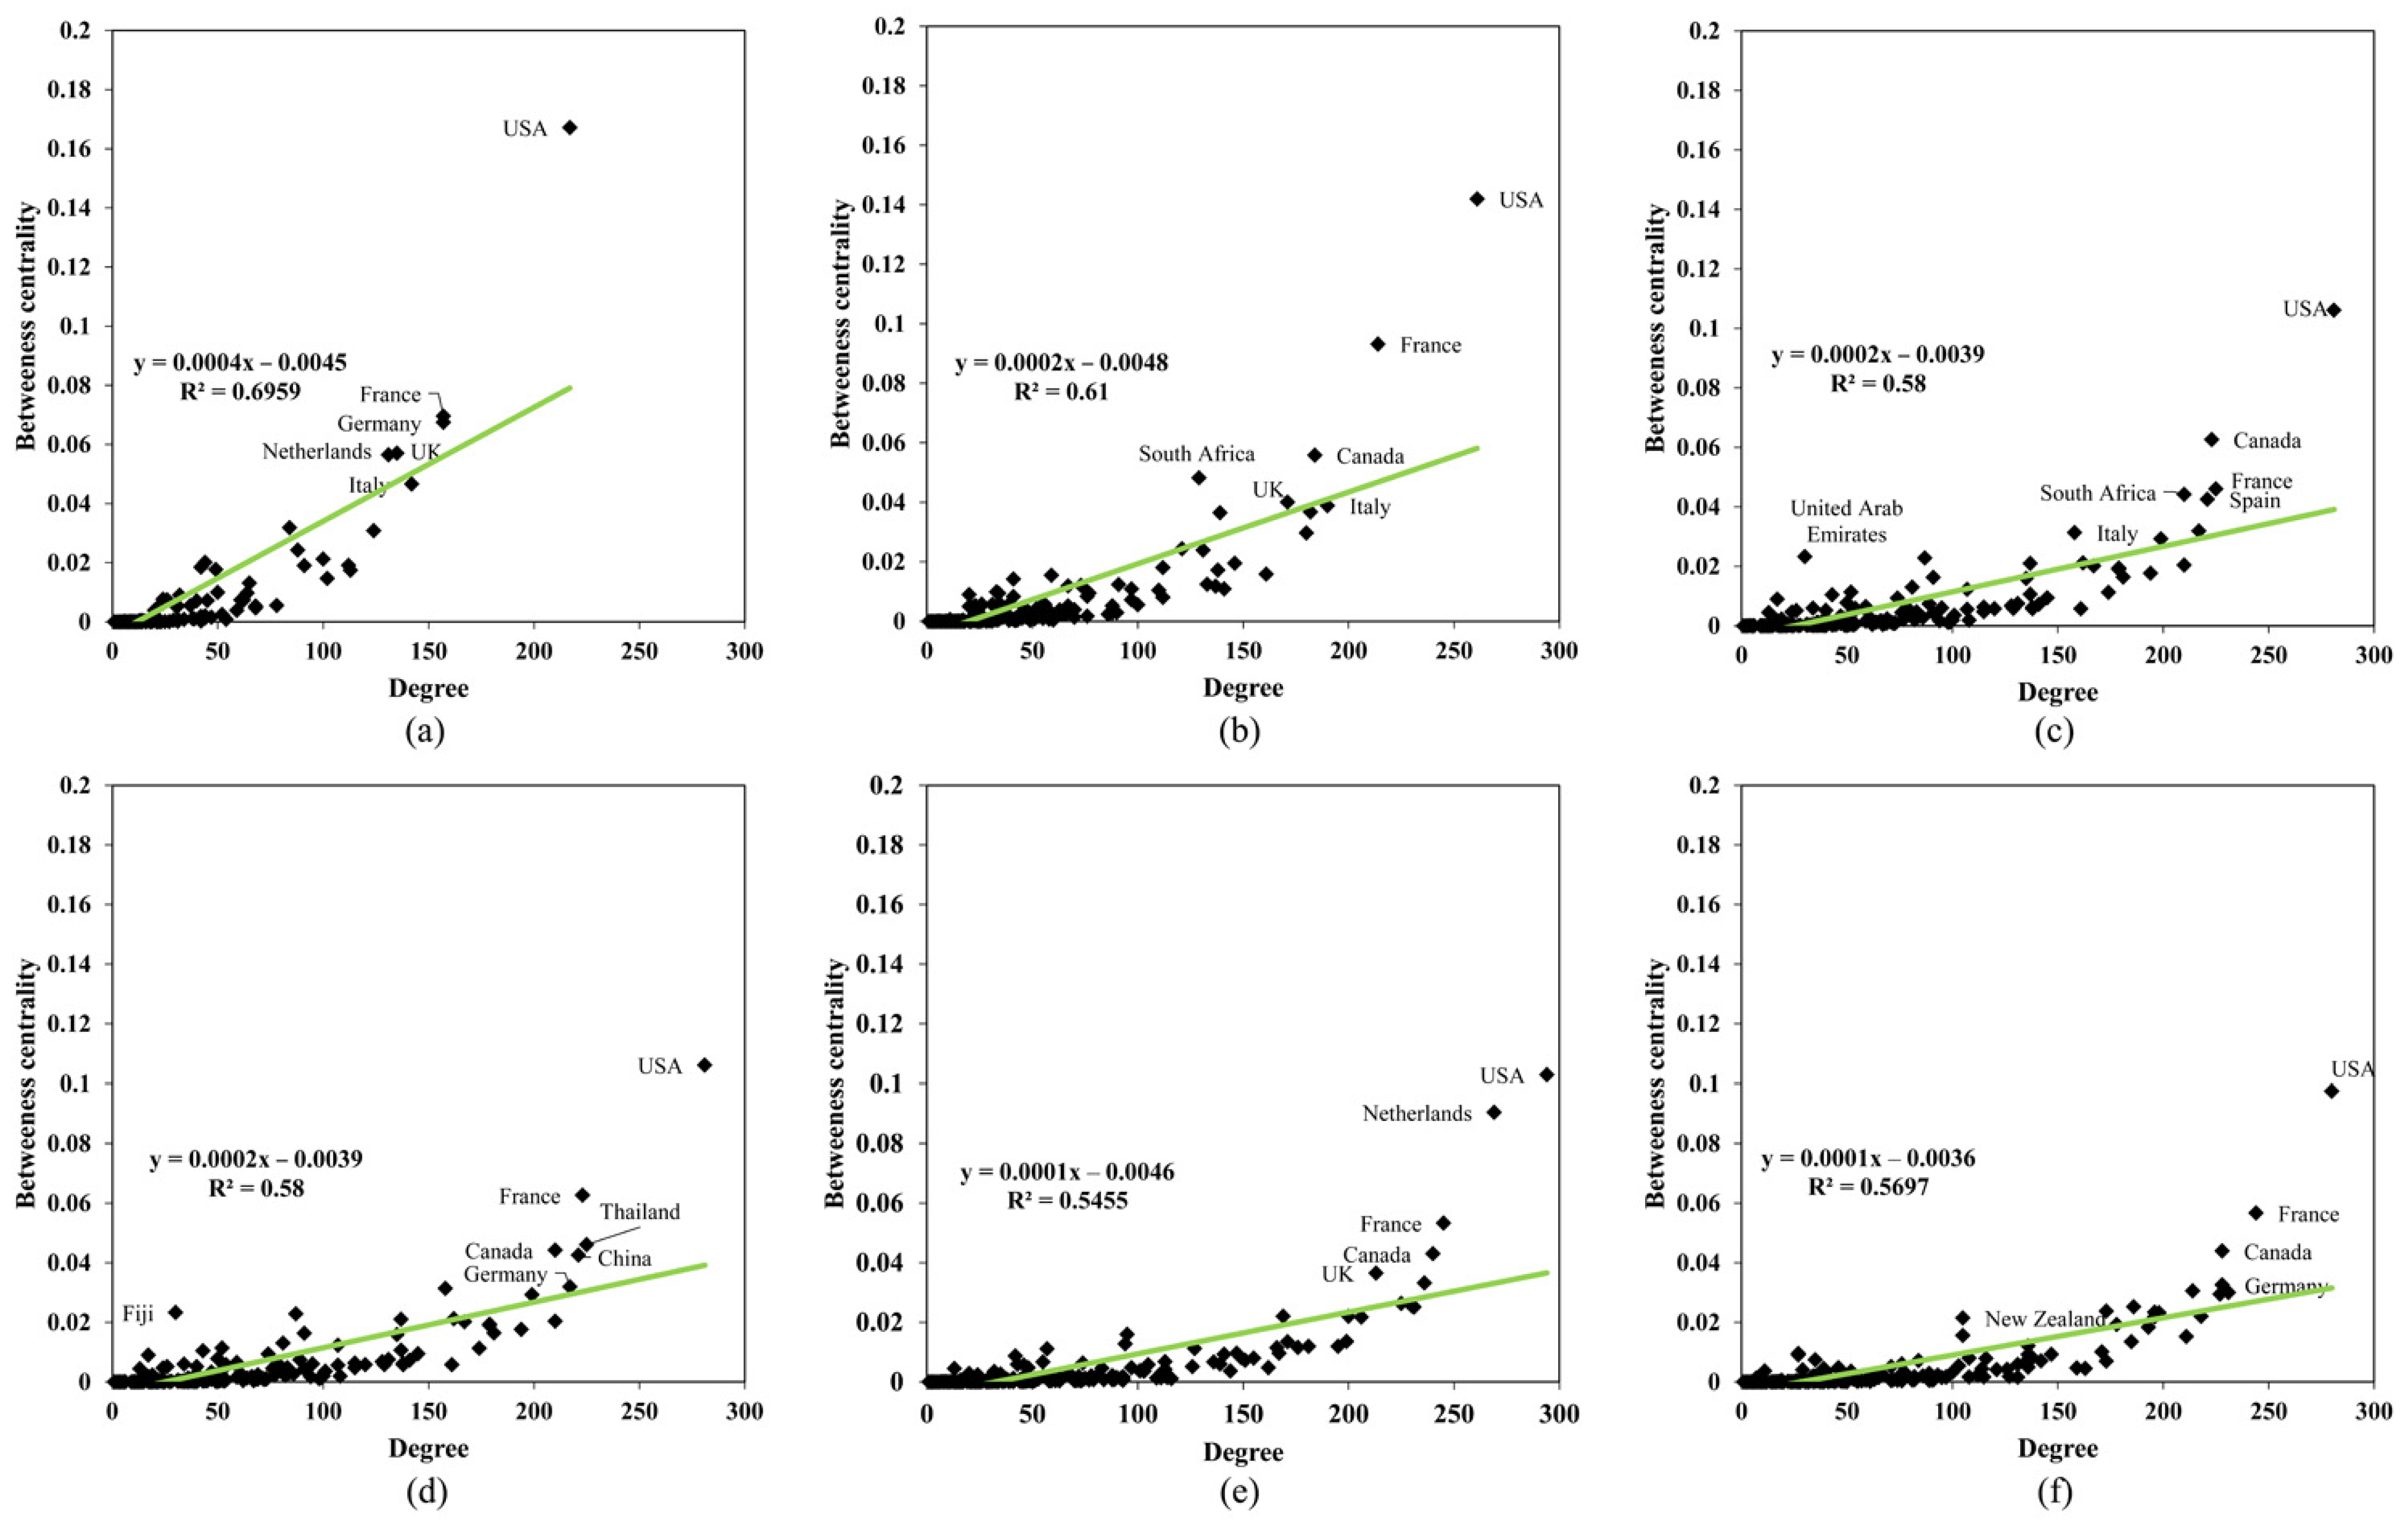
3.1.4. The Role of Countries in IATN

The structure of agricultural trade networks is complex, and the above results describe the basic characteristics of IATN. This section aims to elucidate the position and role of countries in the agricultural trade network, which is helpful information for adopting appropriate policies for agricultural trade and for reducing agricultural trade risks.
In the IATN, the betweenness centrality of a country is directly proportional to the extent to which the country controls the agricultural trade between other countries. Due to limitations in space, Figure 8 shows the scatter diagram of the number of agricultural trade partners (the sum of import and export partners) and betweenness centrality for 1996, 2000, 2005, 2010, 2015, and 2019. According to the fitting regression line, there is a significant positive correlation between the number of agricultural trading partners of a country and its betweenness centrality, and the R-squares of the fitting regression are all above 0.54. That is, the more trade partners there are, the higher the centrality of the intermediary is. This shows that, as the number of links between other countries in the network increases, the intermediary ability of the country to act as a bridge increases, and the ability to control agricultural product transactions between other countries to a certain extent increases. The United States has always had the greatest number of trade partners and the highest betweenness centrality, thereby attaining a greater ability to control agricultural resources in the network via its numerous trade links. Over time, however, the intermediary capacity of the United States has declined. The influence of trade partners on betweenness centrality has also declined, as shown by the slope of the trend line gradually decreasing over the past six years. This means that, as the participation of other countries in agricultural trade rose, the strong core position of the United States in agricultural trade weakened. Although the United States still occupied the core position in the network, many countries drew closer to the core of the network.
We highlight the top five countries by intermediary ability in agricultural trade, as shown in Table A1. The countries at the top of the list, such as the United States, Canada, and France, are developed countries with advanced farming techniques that can produce more than enough agricultural products for domestic consumption and have diversified agricultural demand. For example, the United States imported wheat from other countries and exported a large quantity of corn; meanwhile, Canada had great demand for corn imports and exported barley and wheat.
In the IATN, closeness centrality measures the agricultural trade distance between one country and other countries in the network. The closer a country is to the center of the network, the stronger its influences on information resources and power prestige are with regard to agricultural trade. As seen from Table A2, the United States ranked first for the whole observation period, while other top countries, such as Thailand and India, leveraged their export channels to increase their centrality in the network. The extensive export relationships of these countries greatly shortened the trade path between them and other countries in the network, thus facilitating trade in agricultural products to other countries.
The top five countries by eigenvector centrality are shown in Table A3. Over the period, the top position by eigenvector centrality alternates between Germany, the United States, France, and the Netherlands. This implies that these countries have established stable trade relationships with other countries that have a great influence on the international agricultural market. The top countries in eigenvector centrality have not only many import and export partners but they also established links with each other, which stabilizes their central position in the network. Most international agricultural trade is controlled by a few countries, so other countries can improve their position in the network by establishing stable trade relations with those that have high demand and supply for agricultural products.

3.2. The Impacts of Country Risks on the Agricultural Trade Pattern

Ten regression models are constructed according to Section 2.3 of this paper. The dependent variables are network topological indices obtained from Section 2.2.2, which are HHI, in-degree, out-degree, degree, weighted in-degree, weighted out-degree, weighted degree, betweenness centrality, eigenvector centrality, and closeness centrality, respectively. The independent variables are political risk and economic risk. The control variables are GDP, exchange rate, and cultivated land area. Because of the different data dimensions, we carried out logarithmic processing on weighted in-degree, weighted out-degree, weighted degree, GDP, and cultivated land area to make the data more stable. All the variables are stationary based on the panel unit root test. Therefore, these variables can be used in regression models. According to the results of the Hausman test, the fixed effect model should be selected for each model. Table 1 shows the regression results of national political risks and economic risks to trade patterns. The results show that a country’s agricultural trade could be significantly affected by political and economic risks. A detailed analysis of the results follows.
Political risks have a significant positive impact on importers’ activities in the international agricultural market. High political risk entails unstable political power, poor regulatory quality, and an imperfect legal environment. Therefore, there might be some reasons for the positive relationship between political risk and trade patterns. First, political risk will have a positive impact on import partners and import volume. The instability of the domestic political environment could directly lead to the disruption of agricultural product-related industries. Since agricultural products are one of the necessities of life, when the domestic supply is insufficient to meet domestic demand, agricultural products must be imported to satisfy basic needs. Second, when political conditions are unstable, people may engage in panic-buying to stock up on supplies, which drives up demand. In addition, the negative influence of political risk on the HHI value implies the enhancement of the anti-control ability of agricultural resources. The influence of political risk on the position in the IATN is also positive. When the relationship between imports and exports becomes more complex and the number of imports and exports increases, the intermediary degree of the country will also increase, and the relationship of a given country with important countries in the trade network might grow closer. Thus, the country’s position in the agricultural trade network is enhanced.
The impact of economic risk on the 11 trade indicators is roughly the same. First, it is worth noting that the regression coefficient of economic risk on in-degree is −0.24, indicating that an increase in economic risk has a significantly negative impact on the number of import partners. There might be two reasons for this effect. First, a decline in imports could mean that other countries no longer believe in their ability to pay. At the same time, fluctuations in the exchange rate caused by economic risks also affect exports of agricultural products. Second, economic risk also causes people’s incomes to fluctuate, and a consequent decline in demand for agricultural products leads to a reduction in imports. Economic risks could also decrease demand for agricultural products by impacting economic development. For example, the European debt crisis severely increased economic risks in selected European countries, including Portugal, Greece, and Ireland. After 2009, these countries experienced different degrees of reduction in their import channels and trade volumes in agricultural products. Clearly, the unstable economic environment may also affect the development of the national economy, further reducing the demand for agricultural products. The positive impact of economic risk on the HHI value also indicates a decline in import source diversity due to the reduction in import channels. Furthermore, if the economic risk of a country is high, then reduced import channels will further threaten the domestic supply of agricultural products. According to Table 1, an increase in economic risk may reduce closeness centrality, betweenness centrality, and eigenvector centrality. The weaker the economic foundation is, the more unfavorable it is to the anti-control ability of resources, which will worsen a country’s relationship with important countries in the network. Therefore, countries with higher expected economic risks may not actively participate in international agricultural markets and may lack the capacity to influence markets. As a result, a reduction in closeness centrality makes it more difficult for a country to obtain external resources and allows it to be more easily controlled by other countries. Furthermore, a reduction in trade also weakens a country’s ability to link with other countries as an intermediary. In addition, large suppliers may be reluctant to trade with countries without a stable economic base. In summary, an unstable economic environment is not conducive to increasing the centrality of the state in the network.
According to the results of the control variables, a country’s GDP positively affects the values of in-degree, out-degree, weighted degree, closeness centrality, betweenness centrality, and eigenvector centrality to a certain extent. There is no doubt that the level of economic development improves the trade patterns of importers, which is consistent with the findings of previous studies [19]. However, the exchange rate, which represents fluctuations in the economy, has an unstable influence on trade patterns. A rise in the exchange rate of a country’s currency against the US dollar may increase import trade volumes and import channels of agriculture. However, the exchange rate has no significant impact on exports or the centrality of representing the status of the trade network, which indicates that the exchange rate may not affect the relationship between a country and important countries. An increase in the cultivated land area will have a positive impact on export channels. However, a relative increase in the cultivated land area reduces reliance on imports of agricultural products, and a significant drop in imports will not improve a country’s position in the agricultural trade network.

4. Conclusions and Policy Implications

This paper aimed to explore the impact of country risks on the international agricultural trade pattern. We constructed an IATN model to reveal the patterns in international agricultural trade and used a panel regression model to identify the influence of political and economic risks. The main conclusions and implications are summarized as follows:
(1) By calculating the network parameters of 226 countries from 1996 to 2019 and ranking the countries according to these indicators, we obtained results showing that countries play different roles in international agricultural trade and occupy different positions. In terms of importers, the United States, Germany, the Netherlands, and France occupied a dominant position because of their rich import channels. Moreover, these countries had the ability of resource anti-control. They have established stable trade relations with other countries that have a great influence on the international agricultural market, as shown by their eigenvector centrality values. For exporters, the United States is the most critical country with which to trade because of its influence and trade relationships with many other important countries. Some Asian countries, such as Thailand, India, and China, also had strong control over resources and close trade ties with many countries. In terms of import sources, the import volumes of some countries are quite large and mainly imported from one country. A lack of diversity of import sources could pose a risk to the domestic supply if the ties to the supplier countries were to be cut. Thus, countries should identify their weaknesses and use their strengths to make themselves more indispensable in international agricultural markets. For example, countries lacking in agricultural production should expand their import channels and reduce their dependence on other countries by diversifying their import sources. Countries far from the center of the network can improve their position through trade with important countries.
For the whole network, most of the agricultural trade takes place among a few countries, which means that the concentration of trade is still very high. However, the long-term trend shows that the concentration of agricultural trade is gradually decreasing. The decline in concentration shows that increases in output, owed to progress in agricultural planting technology, have changed the supply patterns of agricultural products, resulting in a lower concentration of agricultural trade.
(2) By analyzing the panel regression model, we find that country risks have a significant impact on trade patterns. Political risk could benefit the agricultural trade pattern, and its rise also promotes an increase in trade channels and promotes the diversity of import sources. It also means that political risk might improve the relations between these countries and other important countries in the trade network, enhance the country’s mediation ability, and improve the country’s position in the network. Increasing import channels is one of the measures to mitigate political risk.
(3) Economic risk is not beneficial to the agricultural trade pattern, and it reduces the country’s resource anti-control ability, causing it to gradually move to the periphery in the agricultural trade network. In general, an unstable economic environment is detrimental to a country’s participation in international agricultural trade markets. Increasing the number of import channels is one response to mitigate the adverse effects of economic risks. To reduce dependence on imported agricultural products, importers should consider the role of economic risks when optimizing trade patterns. Policy-makers should be cautious when promulgating macroeconomic stabilization policies that affect import and export relationships. Instead, countries should start by avoiding economic risks and work to improve their agricultural trade. Exporters should also reduce their dependence on foreign trade by stimulating domestic consumption, which can benefit the national economy.
From a complex network analysis framework, we discussed the influence of country risks on trade patterns and analyzed the positions and roles that countries play in agricultural trade networks. The results obtained are of great significance for adopting active and effective agricultural trade policies. This paper considers only the impact of country risks on the agricultural trade pattern, but, in fact, there are many factors that affect the agricultural trade pattern, such as geopolitics, geographical distance, and trade openness, which will be considered in our future studies. Due to data limitations, this paper does not analyze the effect of the COVID-19 pandemic on agricultural trade patterns. In our future research, we will collect relevant data and continue to explore it.

Author Contributions

Writing—original draft preparation, Q.S. and M.H.; writing—review and editing, Q.S., Z.X. and S.S.; data curation, S.S. and L.C. All authors have read and agreed to the published version of the manuscript.

Funding

This research was funded by the Hebei Statistical Science Research Program, grant number (2021HY19); the Key Projects of Humanities and Social Science of Department of Education in Hebei Province, grant number (ZD201914); the Scientific Research Initiation Project for High-level Talents of Hebei University, grant number (521000981396) and the Bring in Foreign Intelligence Project of Hebei Province in 2022.

Institutional Review Board Statement

Not applicable.

Informed Consent Statement

Not applicable.

Data Availability Statement

The agricultural trade data are obtained from the United Nations Commodity Trade Statistics Database (https://comtrade.un.org/ (accessed on 1 February 2022)). The country risks data, which include political risk and economic risk, come from the International Country Risk Guide (https://www.prsgroup.com/explore-our-products/international-country-risk-guide/ (accessed on 1 February 2022)). Exchange rate, GDP, and cultivated land area are downloaded from the World Bank database (https://data.worldbank.org/ (accessed on 1 February 2022)).

Conflicts of Interest

The authors declare no conflict of interest.

Appendix A

Table A1. The top 5 countries in betweenness centrality.
YearRank
12345
1996USAFranceGermanyUKNetherlands
1997USAFranceGermanyRussiaUK
1998USAFranceItalyUKGermany
1999USAFranceGermanyThailandUK
2000USAFranceCanadaSouth AfricaUK
2001USAFranceCanadaSouth AfricaItaly
2002USAFranceCanadaGermanyThailand
2003USAFranceCanadaGermanyItaly
2004USACanadaFranceSouth AfricaUK
2005USACanadaFranceSouth AfricaSpain
2006USACanadaFrancePakistanPhilippines
2007USACanadaFranceItalyUK
2008USACanadaFranceSouth AfricaItaly
2009USACanadaGermanyThailandFrance
2010USAFranceThailandCanadaChina
2011USAFranceCanadaChinaUK
2012USANetherlandsFranceUKCanada
2013USAUKGermanyFranceIndia
2014USAFranceCanadaNetherlandsGermany
2015USANetherlandsFranceCanadaUK
2016USAFranceCanadaNetherlandsItaly
2017USAFranceCanadaThailandUK
2018USAFranceCanadaUKItaly
2019USAFranceCanadaGermanyNetherlands
Table A2. The top 5 countries in closeness centrality.
YearRank
12345
1996USAIndiaFranceItalyCanada
1997USACanadaIndiaFranceArgentina
1998USAIndiaItalyCanadaFrance
1999USAThailandItalyIndiaFrance
2000USAThailandFranceItalyChina
2001USAThailandIndiaItalyFrance
2002USAThailandIndiaItalyFrance
2003USAThailandChinaItalyIndia
2004USAThailandIndiaItalyChina
2005USAThailandIndiaPakistanChina
2006USAThailandIndiaChinaPakistan
2007USAThailandChinaIndiaItaly
2008USAThailandChinaIndiaItaly
2009USAThailandChinaPNGItaly
2010USAThailandChinaIndiaPakistan
2011USAThailandIndiaChinaItaly
2012USAThailandIndiaChinaItaly
2013USAThailandIndiaChinaItaly
2014USAThailandIndiaChinaItaly
2015USAThailandIndiaItalyPakistan
2016USAThailandIndiaFranceChina
2017USAThailandIndiaChinaFrance
2018USAThailandIndiaChinaItaly
2019USAIndiaThailandChinaFrance
Table A3. The top 5 countries in eigenvector centrality.
YearRank
12345
1996GermanyNetherlandsUKFranceUSA
1997GermanyNetherlandsFranceRussiaUSA
1998GermanyNetherlandsFranceUSAItaly
1999GermanyFranceNetherlandsUKUSA
2000USAFranceGermanyUKNetherlands
2001USAFranceGermanyUKItaly
2002USAGermanyCanadaFranceUK
2003USAGermanyNetherlandsFranceUK
2004USAGermanyUKNetherlandsFrance
2005USAFranceGermanyCanadaUK
2006USACanadaFranceUKGermany
2007USAUKFranceGermanyCanada
2008UKGermanyFranceUSACanada
2009GermanyNetherlandsUKUSAFrance
2010UKUSAGermanyFranceCanada
2011FranceGermanyUKUSANetherlands
2012NetherlandsUKUSAFranceGermany
2013USAGermanyUKNetherlandsFrance
2014GermanyUSAUKNetherlandsFrance
2015NetherlandsGermanyUSAFranceUK
2016USANetherlandsFranceUKGermany
2017FranceUKUSANetherlandsGermany
2018FranceNetherlandsGermanyCanadaUK
2019FranceNetherlandsGermanyUSAUK

References

  1. Sun, Q.R.; Gao, X.Y.; Zhong, W.Q.; Liu, N.R. The stability of the international oil trade network from short-term and long-term perspectives. Physica A 2017, 482, 345–356. [Google Scholar] [CrossRef]
  2. Vidya, C.T.; Prabheesh, K.P. Implications of COVID-19 Pandemic on the Global Trade Networks. Emerg. Mark. Financ. Trade 2020, 56, 2408–2421. [Google Scholar] [CrossRef]
  3. Burkholz, R.; Schweitzer, F. International crop trade networks: The impact of shocks and cascades. Environ. Res. Lett. 2019, 14, 28. [Google Scholar] [CrossRef] [Green Version]
  4. Qiang, W.L.; Niu, S.W.; Wang, X.; Zhang, C.L.; Liu, A.M.; Cheng, S.K. Evolution of the Global Agricultural Trade Network and Policy Implications for China. Sustainability 2020, 12, 192. [Google Scholar] [CrossRef] [Green Version]
  5. Evans, C.L. The economic significance of national border effects. Am. Econ. Rev. 2003, 93, 1291–1312. [Google Scholar] [CrossRef] [Green Version]
  6. Sohn, C.H. Does the gravity model explain South Korea’s trade flows? Jpn. Econ. Rev. 2005, 56, 417–430. [Google Scholar] [CrossRef]
  7. Zolin, M.B.; Uprasen, U. Trade creation and diversion: Effects of EU enlargement on agricultural and food products and selected Asian countries. Asia Eur. J. 2018, 16, 351–373. [Google Scholar] [CrossRef]
  8. Krivko, M.; Smutka, L. Agricultural and Foodstuff Trade between EU28 and Russia: (Non)Uniformity of the Russian Import Ban Impact Distribution. Agriculture 2021, 11, 1259. [Google Scholar] [CrossRef]
  9. Park, J.K. Intraindustry Trade(IIT) of Agricultural Products and Agricultural Development. Korean J. Food Mark. Econ. 2005, 22, 1–17. [Google Scholar]
  10. Singh, S.; Kingra, H.S.; Bhogal, S.; Bhardwaj, S. India’s Foreign Trade of Agricultural Products in Free Market Economy. Indian J. Econ. Dev. 2018, 14, 219–222. [Google Scholar] [CrossRef]
  11. Pawlak, K. Competitiveness of the EU Agri-Food Sector on the US Market: Worth Reviving Transatlantic Trade? Agriculture 2022, 12, 23. [Google Scholar] [CrossRef]
  12. Veeck, G. China’s Exports and Imports of Agricultural Products under the WTO. Eurasian Geogr. Econ. 2008, 49, 569–585. [Google Scholar] [CrossRef]
  13. Ji, S.; Yoo, J. A study on the changes of agricultural import structure according to implementation of FTAs in South Korea. J. Korea Trade 2018, 22, 2–16. [Google Scholar] [CrossRef]
  14. Fernandez-Alvarez, A. Turkish Agricultural Trade in the European Union: Opportunities and Challenges. South Eur. Soc. Polit. 2008, 13, 477–493. [Google Scholar] [CrossRef]
  15. Fleming, D.A.; Abler, D.G.; Goetz, S.J. Agricultural trade and poverty in Chile: A spatial analysis of product tradability. Agric. Econ. 2010, 41, 545–553. [Google Scholar] [CrossRef]
  16. Baek, J.; Koo, W.W. How sensitive is US agricultural trade to the bilateral exchange rate? Evidence from bulk, intermediate, and consumer-oriented products. Agric. Econ. 2011, 42, 387–403. [Google Scholar] [CrossRef]
  17. Huang, Y.R.; Fang, H.; Li, X.M. Evaluation of the promoting effect of trade facilitation of importing countries to agricultural product export of China. Int. J. Elec. Eng. Educ. 2020, 468, 1–21. [Google Scholar] [CrossRef]
  18. Hong, Y.; Zhang, X.Y.; Hu, A.J.; Ma, P. Econometric Analysis of the Israeli Trade Protectionism and the Export Comparative Advantage of the Primary Agricultural Products. Basic Clin. Pharmacol. Toxicol. 2020, 126, 305–306. [Google Scholar]
  19. Liu, H.G.; Tada, M.; Sun, D.S. Changing patterns in comparative advantage for agricultural trade in East Asian countries. China Agric. Econ. Rev. 2009, 1, 227–238. [Google Scholar] [CrossRef]
  20. Kuzmenko, E.; Rumankova, L.; Benesova, I.; Smutka, L. Czech Comparative Advantage in Agricultural Trade with Regard to EU-27: Main Developmental Trends and Peculiarities. Agriculture 2022, 12, 217. [Google Scholar] [CrossRef]
  21. Liu, Y.K.; Bi, R.Q.; Yang, H.X. Sino-Japanese agricultural trade friction and dynamic state. Information 2008, 11, 473–482. [Google Scholar]
  22. Kim, M.; Cho, G.D.; Koo, W.W. Does the exchange rate matter to agricultural bilateral trade between Canada and the US? Can. J. Agric. Econ. Rev. Can. Agroecon. 2004, 52, 127–145. [Google Scholar] [CrossRef]
  23. Hyun, N.k.; Li, T. The Competitiveness of Korea-China-Japan agricultural products and Korea-China FTA Agricultural Trade impacts. J. Agric. Ext. Community Dev. 2018, 25, 71–83. [Google Scholar] [CrossRef]
  24. Zheng, Y.M.; Qi, J.H. Empirical analysis of the structure of Sino-US agricultural trade. China World Econ. 2007, 15, 35–51. [Google Scholar] [CrossRef]
  25. Marin, S.D.A. Determinants of Trade Flows between Colombia and South Korea. Apunt. Cenes 2020, 39, 75–105. [Google Scholar] [CrossRef]
  26. Zhang, F.H. Analysis of the current situation of agricultural trade development between china and ukraine. Agric. Resour. Econ. Int. Sci. E J. 2020, 6, 23–36. [Google Scholar]
  27. Ali, T.; Huang, J.; Xie, W. Bilateral Economic Impacts of China–Pakistan Economic Corridor. Agriculture 2022, 12, 143. [Google Scholar] [CrossRef]
  28. Leem, B.-H.; Won, E.S. Analyzing Core-Periphery Structure among Trade Countries of Agricultural Products. J. Int. Trade Commer. 2020, 16, 121–131. [Google Scholar] [CrossRef]
  29. Liu, C.; Xu, J.; Zhang, H. Competitiveness or Complementarity? A Dynamic Network Analysis of International Agri-Trade along the Belt and Road. Appl. Spat. Anal. Policy 2019, 13, 349–374. [Google Scholar] [CrossRef]
  30. Gutierrez-Moya, E.; Adenso-Diaz, B.; Lozano, S. Analysis and vulnerability of the international wheat trade network. Food Secur. 2021, 13, 113–128. [Google Scholar] [CrossRef]
  31. Esteban, A.L.G. The determinants of world wheat trade, 1963–2010: A gravity equation approach. Hist. Agrar. 2021, 83, 165–190. [Google Scholar] [CrossRef]
  32. Cai, H.B.; Song, Y.Y. The state’s position in international agricultural commodity trade A complex network. China Agric. Econ. Rev. 2016, 8, 430–442. [Google Scholar] [CrossRef]
  33. Hyun, H.B.; Ahn, B.-i. An Analysis of the Change in the Agricultural Trade Network. J. Rural Dev. 2016, 39, 93–128. [Google Scholar]
  34. Jayasinghe, S.; Sarker, R. Effects of regional trade agreements on trade in agrifood products: Evidence from gravity modeling using disaggregated data. Rev. Agric. Econ. 2008, 30, 61–81. [Google Scholar] [CrossRef] [Green Version]
  35. Shan, L.J.; Cui, C.; Wu, L.H. Analysis of potential affecting factors of China′s agricultural trade. J. Food Agric. Environ. 2011, 9, 923–925. [Google Scholar]
  36. Eum, J.Y.; Sheldon, I.; Thompson, S.R. Product Quality in Food and Agricultural Trade: Firm Heterogeneity and the Impact of Trade Costs. J. Agric. Resour. Econ. 2021, 46, 1–19. [Google Scholar] [CrossRef]
  37. Zhang, H.; Wang, Y.; Yang, C.; Guo, Y. The impact of country risk on energy trade patterns based on complex network and panel regression analyses. Energy 2021, 222, 11. [Google Scholar] [CrossRef]
  38. Vivoda, V. LNG import diversification and energy security in Asia. Energy Policy 2019, 129, 967–974. [Google Scholar] [CrossRef]
  39. Boccaletti, S.; Latora, V.; Moreno, Y.; Chavez, M.; Hwang, D.U. Complex networks: Structure and dynamics. Phys. Rep. Rev. Sec. Phys. Lett. 2006, 424, 175–308. [Google Scholar] [CrossRef]
Figure 1. The agricultural trade network in 2019.
Agriculture 12 00361 g001
Figure 2. A sample model of IATN.
Agriculture 12 00361 g002
Figure 3. Evolution of the number of trade partners and trade relations.
Agriculture 12 00361 g003
Figure 4. The top 10 countries in terms of the number of import partners over the years.
Agriculture 12 00361 g004
Figure 5. The top 10 countries in terms of the number of export partners over the years.
Agriculture 12 00361 g005
Figure 6. Scatter plots of HHI and import volume: (a) represents the scatter plot of 1996, (b) represents the scatter plot of 2000, (c) represents the scatter plot of 2005, (d) represents the scatter plot of 2010, (e) represents the scatter plot of 2015, and (f) represents the scatter plot of 2019.
Agriculture 12 00361 g006
Figure 7. Accumulative distribution of the weights.
Agriculture 12 00361 g007
Figure 8. Scatter plots depicting the number of partners versus intermediary centrality (the horizontal axis represents the number of agricultural trade partners of a country, the vertical axis represents the intermediary centrality of a country, and the green line is the fitted regression line). (a) represents the scatter plot of 1996, (b) represents the scatter plot of 2000, (c) represents the scatter plot of 2005, (d) represents the scatter plot of 2010, (e) represents the scatter plot of 2015, and (f) represents the scatter plot of 2019.
Agriculture 12 00361 g008
Table 1. The regression results of the country risks to trade patterns.
IDODDegreeWIWOWDHHIBCCCEC
c−163.95 *** −98.68 ***−262.63 ***−11.66 ***−7.03 *−13.34 ***1.72 ***0.02−0.56 ***−1.06 ***
(15.69719)(25.601)(34.36325)(1.337049)(3.603038)(1.175835)(0.268166)(0.010562)(0.174122)(0.173021)
Polrisk0.2780 ***0.4222 ***0.7002 ***0.0117 ***0.01400.0113 ***−0.0033 ***2.46 × 10⁻⁵ 0.0015 ***0.0017 ***
(0.038231)(0.061248)(0.082212)(0.003199)(0.00861)(0.002813)(0.000642)(0.0000253)(0.000417)(0.000414)
Ecorisk−0.2462 ***−0.3455 ***−0.5916 ***−0.0021−0.0101−0.0060 **0.0029 ***−5.88 × 10⁻⁵ *−0.0023 ***−0.0032 ***
(0.038231)(0.062352)(0.083692)(0.003256)(0.008941)(0.002864)(0.000653)(0.0000257)(0.000424)(0.000421)
GDP9.4043 ***10.3216 ***19.7259 ***1.0063 ***1.1075 ***1.0739 ***−0.0432 ***−0.00010.0455 ***0.0535 ***
(0.27011)(0.44053)(0.591306)(0.023007)(0.061783)(0.020233)(0.004614)(0.000182)(0.002996)(0.002977)
Rate2.02 × 10−9 *1.65 × 10−102.18 × 10−93.6 × 10−10 ***−3.30 × 10−102.9 × 10⁻¹⁰ ***5.15 × 10⁻¹¹ *−1.04 × 10−131.22 × 10−132.18 × 10−11 *
(1.06 × 10−9)(1.74 × 10⁻⁹)(2.33 × 10⁻⁹)(9.07 × 10⁻¹¹)(2.39 × 10⁻¹⁰)(7.98 × 10⁻¹¹)(1.82 × 10⁻¹¹)(7.16 × 10⁻¹³)(1.18 × 10⁻¹¹)(1.17 × 10⁻¹¹)
Field−2.8903 ***−8.9822 ***−11.873 ***0.3859 ***−0.30460.4326 ***−0.0174−0.0005−0.00550.0094
(1.077623)(1.757526)(2.359061)(0.091789)(0.246673)(0.080722)(0.01841)(0.000725)(0.011954)(0.011878)
R-squared0.82780.92370.91700.88610.83280.91900.73470.90510.68180.8443
Notes: the asterisks *, **, and *** denote statistical significance at the 10% level, at the 5% level, and at the 1% level, respectively. This table provides the parameter estimation results from 1996 to 2017. The value in the parentheses indicates standard error.
Publisher’s Note: MDPI stays neutral with regard to jurisdictional claims in published maps and institutional affiliations.

