Article

Field Investigation of the Static Friction Characteristics of High-Yielding Rice during Harvest

Key Laboratory of Modern Agricultural Equipment and Technology, Ministry of Education & Jiangsu Province, Jiangsu University, Zhenjiang 212013, China
*
Author to whom correspondence should be addressed.
Agriculture 2022, 12(3), 327; https://doi.org/10.3390/agriculture12030327
Submission received: 10 January 2022 / Revised: 20 February 2022 / Accepted: 22 February 2022 / Published: 24 February 2022

Abstract

:
Background: Following the popularization of high-yielding rice in China, fast and efficient mechanized harvesting proved challenging. In addition, the physical characteristics of rice grains and stems are substantially affected during harvest by the field environment and harvest time. However, the combine harvester driver is focused on maximizing the outputs and does not consider the adverse effects of these factors during the rice harvest. Methods: We investigated the effects of the harvest time, spatial position, and temperature on the static friction coefficient of rice grains and stems of high-yielding rice using a field experiment. Results: The result difference in the static friction coefficient between the parallel and perpendicular placements of the rice stem on the steel plate was 9%, indicating that the contact configuration had a significant impact. The region, harvest time, and temperature significantly affected the static friction characteristics of the rice grains and stems. The most significant differences were observed in the X-direction. Conclusions: The optimum harvest time was 10:11 a.m.–3:30 p.m. and the optimum temperature was above 16.5 °C. A quantitative analysis of the effects of the harvest time and temperature on the static friction characteristics of rice provides reliable data for machine design optimization and standardization of harvests operations.

1. Introduction

Rice is the staple food source for almost half of the world’s population. Asia accounts for 90% of the world’s rice production and consumption [1,2,3,4]. As the world’s first country to cultivate rice, China has the largest rice yield and unit yield. Rice accounts for approximately 65% of China’s food consumption, meeting the basic survival needs of its population [5,6]. However, due to population growth, social development, and climate change, improving the unit yield of rice has become a key focus of rice production research [7,8,9]. China has always adhered to the strategy of grain storage and the adoption of new agricultural technology to ensure national food security [10,11,12,13]. High-yielding rice was first planted in 1996 and has become increasingly popular. For example, the yield per ha of the “Liangyou 293” and “Nanjing Jinggu” rice varieties has reached 12,636.6 kg [14] and 13,013.8 kg [15], respectively. Furthermore, the unit yield of rice has increased substantially. For example, high-yielding rice cultivation areas covered 2.55 million ha and 8.65 million ha in 2005 and 2013, respectively. They increased to 0.098 billion ha by the end of 2018 due to China’s promotion of high-yielding rice [16,17].
The characteristics of high-yielding rice and ordinary rice are very distinct. For example, the former has a higher unit yield, larger panicles, more grains, denser growth, greener stems, lusher leaves, higher water content, and stronger disease resistance than the latter [18,19,20,21,22]. These characteristics of high-yielding rice significantly impact key processes of traditional rice combine harvesting, including threshing separation, cleaning, and grain transportation. For example, the combine harvester cannot efficiently separate the grains of high-yielding rice during threshing, with difficulties in separating and cleaning high-yielding rice with green stems, lush leaves, and high-water content [23,24,25]. Moreover, static friction is a key physical property of high-yielding rice. Particle motion occurs during the threshing separation, cleaning, and grain transportation [26,27], resulting in complex friction. The characteristics of the material’s static friction are closely related to particle motion. Therefore, research on the static friction characteristics of high-yielding rice is necessary for choosing appropriate harvesting techniques, technical parameters, and optimizing the design of combine harvesters [28].
Friction is a highly complex characteristic and depends on the friction location, surface micromorphology, contact state, material, environment, time, and other factors. The material is the most important factor affecting friction [29,30]. Compared to pure industrial materials, the frictional characteristics of biomaterials are strongly affected by time and space; they are highly variable. Rice grains and stems are biomaterials; the static friction between these components and the surface of the harvester’s steel plate are substantially affected by the field environment and the harvest time [31]. However, the operators of combine harvesters often ignore the adverse effects of the field environment and harvest time to maximize outputs, resulting in blockages of the combine harvester and increases in losses and the crushing rate. These problems have adverse effects on machine usage and reduce the quality of the rice harvest.
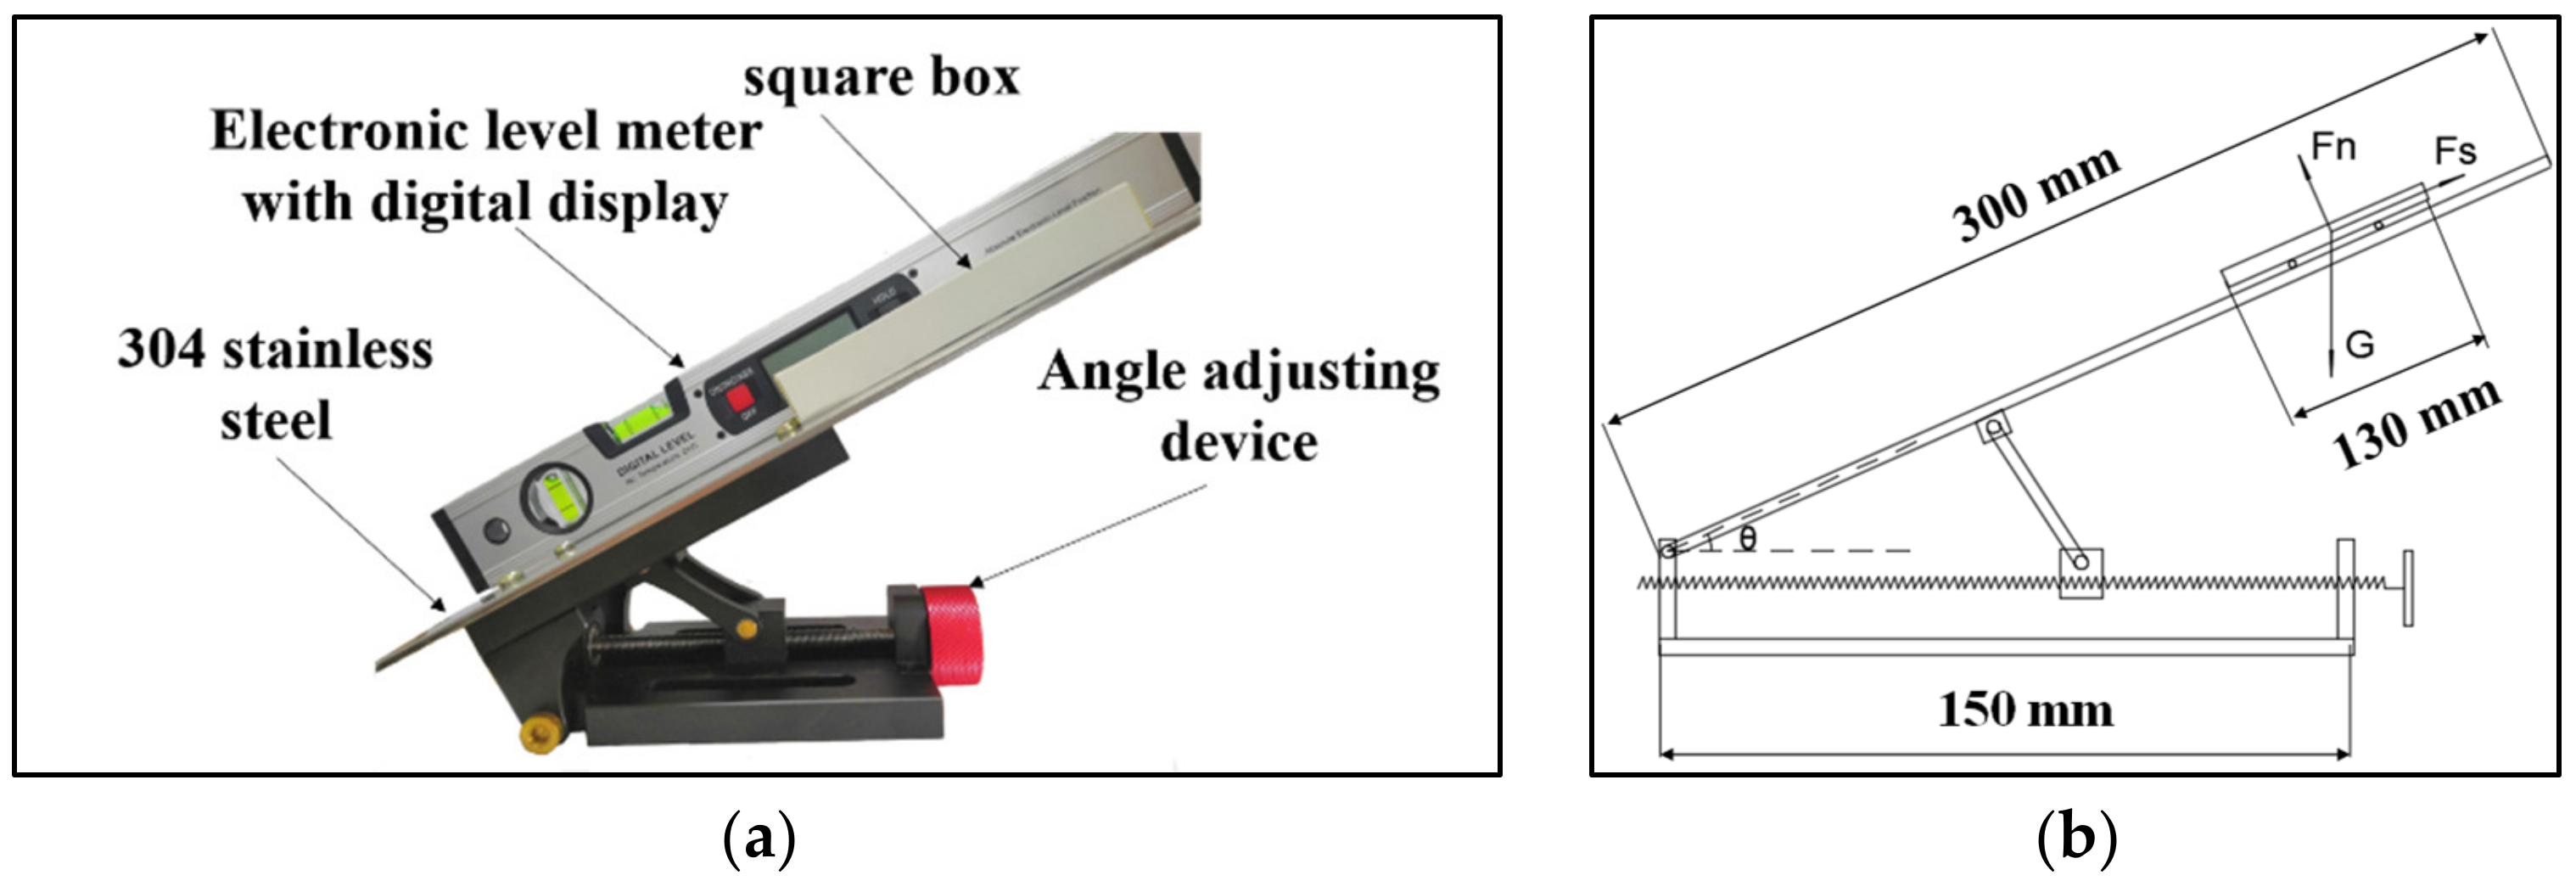
Knowledge of the static friction characteristics is crucial for harvesting and machine design optimization. Several studies have attempted to determine the static friction and related parameters of rice to provide information for the design of rice production machinery [32,33,34]. Bhattacharya investigated the physical characteristics of rice, revealing that the friction coefficient of rice increased with an increase in humidity [35]. Yuan et al. observed that the harvest season and rice varieties affected the physical characteristics of rice, including friction [36]. Yu measured the friction characteristics and other parameters of Indica rice with different water contents and concluded that the static friction (and other parameters) of this rice variety was related to changes in the moisture content [37]. Zhang et al. studied the friction of rice and other crops on a galvanized surface and proposed an empirical model of friction and relative displacement based on experimental data [38]. Kayode et al. tested the friction and other characteristics of rice and other crops with different moisture contents [39]. Kumar et al. analyzed the changes in friction and other characteristics of the rice variety “Gurjari” and its processed products during tablet pressing [40]. Previous studies have determined the static friction and other characteristic parameters of rice in the laboratory and investigated the effects of different factors on the friction characteristics of rice. This information is crucial for rice harvesting and processing. However, most studies that measured friction and other characteristics did not focus on high-yielding rice and did not compare laboratory data with field measurements during the rice harvest. Laboratory data may contain errors and lags in measuring friction and other parameters. In addition, combine harvester designers and operators are more concerned with friction characteristics in the field because this information provides reliable references for the design and optimization of rice production machinery. Field research on static friction and other characteristics of high-yielding rice varieties is limited, although it is required for the optimal design of combine harvesters and the development of standards in agricultural operations.
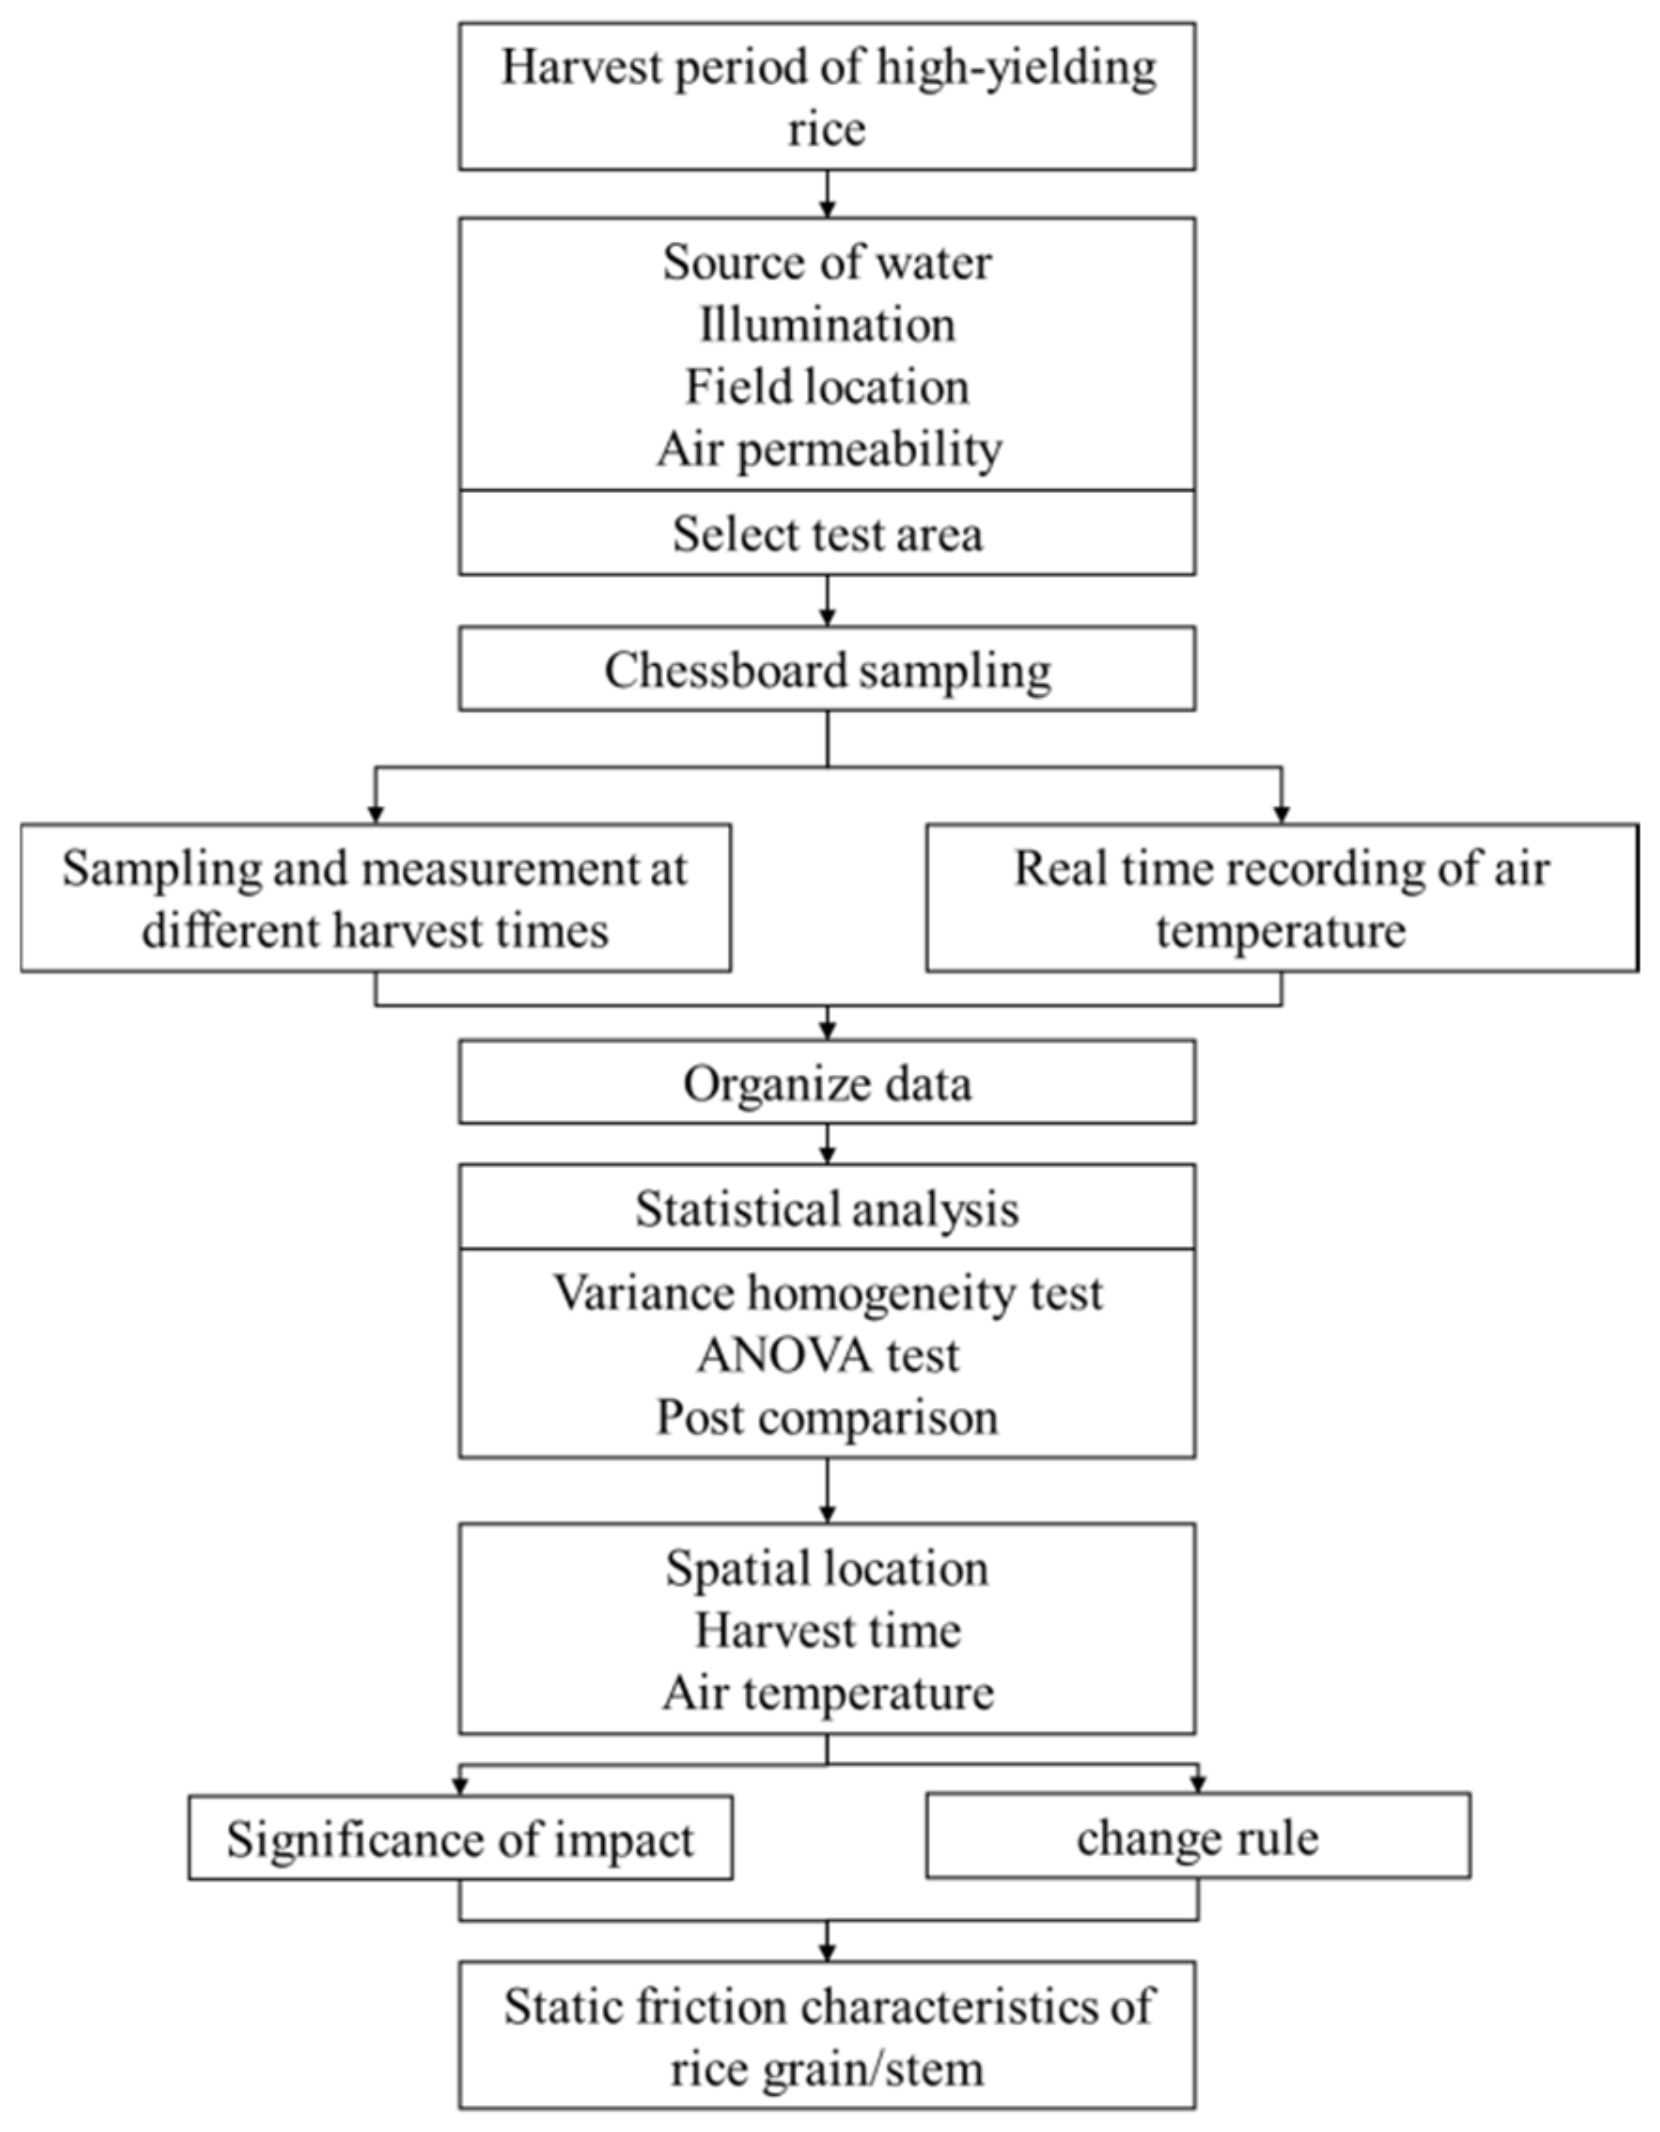
Therefore, we conduct an experimental study on the static friction characteristics of grains and stems of high-yielding rice during the harvest. We statistically analyze the effect and significance of the spatial location, harvest time, and external temperature on the static friction characteristics of rice grains and stems. The results provide a basis for parameter selection, design optimization of high-yielding rice combine harvesters, and quantitative data to standardized combine harvesting. Our work provides new insights in combine harvesting operations of high-yielding rice for researchers, designers, and farmworkers.

2. Materials and Methods

2.1. Test Location and Materials

The high-yielding rice variety “Nanjing Jinggu” developed by the Suzhou crop variety test base (an experimental station that conducts safety tests of new rice and wheat varieties) in Jiangsu, China, was investigated in this study. It has an approximate yield of 10,690.6 kg/ha (Figure 1). The experimental field was located on the left side of the cultivated area. Canals containing water were located on the left, top, and bottom of the field (Figure 1a). A photo of the field in Figure 1b,c shows the water in the canals and the rice field. As shown in Figure 1a, the rice planted on the right side of the experimental site was farther away from the water source; thus, less water was absorbed by the plants. The rice on the south side of the field received sunlight first and experienced a longer sunshine duration than the rice on the north side. Both sides of the experimental field were well ventilated, which is required for growing rice. Sunny conditions and temperatures between 16 °C and 23 °C were dominant during testing.
The experimental field was well-maintained and differed from the surrounding environment. Chessboard sampling was used to measure the water content and other parameters of rice (Figure 1a). According to the distance to the water source and ventilation characteristics, the field was divided into three equidistant columns, marked as x1, x2, and x3 from left to right. According to the received sunlight, the field was equally divided into six rows from north to south, marked as y1, y2, y3, y4, y5, and y6. There were 18 sampling points at the intersections between the row and column lines. The differences between the surrounding environments and the experimental field can affect the harvest time, static friction characteristics, and other parameters of the sampling point. We selected three harvesting times (8:20 a.m.–12:00 p.m., 1:00 p.m.–4:00 p.m. and 5:00 p.m.–6:30 p.m.) for sampling and measurements to determine the differences in the static friction characteristics of the rice grains and stems for different locations and harvest times.

2.2. Test Methods

2.2.1. Measurement of Static Friction Coefficient

We measured the static friction coefficient of the rice grains and stems between 8:20 a.m. and 6:30 p.m. on 12 November 2020 (Table 1).
As the contact point between the rice and the working parts of the combine changes during harvesting, the sampling of the rice grains and stems was performed using two approaches (Figure 2). As shown in Figure 2a,b, the stem was placed parallel or perpendicular to the movement direction. The cut rice stems had a length and diameter of 60 mm and 4 mm, respectively. As shown in Figure 2c,d, four rice grains (with a length and thickness of 7.2 mm and 2.5 mm, respectively) were randomly selected and placed in different positions inside the square box (Figure 2c,d). The awn of the rice grains pointed away from or into the movement direction.
Figure 3 presents the measurement process of the static friction coefficients of the rice grains and stems. The measuring device (Figure 3a) was placed horizontally on the canal (Figure 3c) and the electronic level meter with a digital display (magnetic suction type) was placed on the surface of the stainless-steel plate at horizontal coordinates relative to the plate. The square box with grains or stems was placed on the right side of the plate surface and the angle adjusting device was slowly rotated to tilt the stainless-steel plate. When the square box (with grains or stems) started to rotate, the rotation angle was recorded [41,42]. The static friction coefficients of the rice grains and stems with different configurations were measured once. Figure 3b shows the principle of the stress analysis between the rice grains/stems and the stainless-steel plate surface. According to the parallelogram law of forces, the component of the gravity on the x-axis was balanced with the friction resistance. The static friction coefficient between the rice grains/stem and the steel plate surface can be calculated using Equations (1) and (2):
F s cos θ = F n sin θ F s = f F n
which can be simplified to:
f = tan θ
where G is the gravity of the square box and the rice (N); Fn is the supporting force of the square box and the rice (N); Fs is the friction between the rice and the steel plate (N); f is the static friction coefficient; and θ is the angle between the stainless-steel plate and the ground (deg). Figure 3c depicts the static friction coefficient measurements of rice in the field. Note that the experimental site was located north of the test field, close to the canal. At this location, the rice grain and leaf surfaces are typically wetter in the evening. Thus, the square box and rice grains/stems exhibited a downward movement on the surface of the 304 steel plate only when the steel plate was tilted at larger angles (approximately 19°–22°).

2.2.2. Measurement Data Statistics

We analyzed the static friction coefficients of the rice grains and stems obtained at different spatial positions, harvest times, and temperatures. We use the data of column X1 in the morning, column X2 in the afternoon, and column X3 in the evening as examples due to space constraints (Table 2). The static friction coefficient is the average value of two measurements.
The static friction coefficients of the rice grains and stems are determined for different contact configurations. We display 12 groups of data as an example in Table 3. The static friction coefficient is the average value of two measurements.
The data were statistically analyzed using SPSS 26.0 to determine the influence of the variables (harvest time, temperature, spatial position, and contact configuration), on the static friction coefficient of the rice grains and stems. We performed a variance homogeneity test, ANOVA test, analysis of variance (ANOVA), post hoc tests, and other operations to ascertain the significance levels.
The flowchart of the analysis process is shown in Figure 4.

3. Results

3.1. Effects of Spatial Location on Static Friction Coefficient of Rice

The average static friction coefficients of the rice grains and stems in the three measurement periods are shown in Figure 5. The average static friction coefficient of the rice grains is the highest (0.37) and the lowest (0.21) in the morning, the highest (0.25) and the lowest (0.21) in the afternoon, and the highest (0.42) and the lowest (0.30) in the evening. The average static friction coefficient of the rice stems is the highest (0.39) and the lowest (0.31) in the morning, the highest (0.35) and the lowest (0.31) in the afternoon, and the highest (0.39) and the lowest (0.32) in the evening. These results show that the average static friction coefficients of the rice grains and stems differ for different measurement periods.
Due to the field distribution test under different periods being too cumbersome, it is not conducive to statistical analysis. The average static friction coefficients of the rice grains/stems averaged over the three measurement periods are shown in Figure 6. The average static friction coefficient of the rice grains is the highest (0.32) and the lowest (0.25) in Figure 6a. The average static friction coefficient of the rice stems is the highest (0.37) and the lowest (0.33) in Figure 6b.
ANOVA was conducted on the data shown in Figure 6, using a significance level of 0.05. The data were normally distributed. The ANVOA results are listed in Table 4.
The p-value of the average static friction coefficient of the rice grains and stems for factor X is 0.000 (Table 5), indicating that X has a significant effect on the static friction coefficient of the rice grains and stems. The p-values are 0.861 and 0.955 for factor Y (Table 5), indicating that Y has a negligible effect on the static friction coefficient of the rice grains and stems. As shown in Table 5, the influence of X on the average static friction coefficient of rice grains is calculated, and the difference in the coefficient is obtained between X1 and X3 and X2 and X3. According to Figure 6, the average static friction coefficients of the rice grains in X1, X2, and X3 are 0.26, 0.27, and 0.30, respectively. The difference between X1 and X3, X2, and X3 is 15% and 11%, respectively. The influence of X on the average static friction coefficient of the rice stems is calculated, and the difference in the coefficient is obtained between X1 and X2, X1 and X3, and X2 and X3. The average static friction coefficients of the rice stems in X1, X2, and X3 are 0.33, 0.34, and 0.36, respectively. The ANOVA results indicate that the spatial position has a significant impact on the static friction coefficients of the rice grains and stems. This effect is more pronounced in the X- direction, indicating that the distance from the water source significantly affects the static friction coefficients of the rice grains and stems.

3.2. Effect of Rice Grain and Stem Placement on the Static Friction Coefficient

When the combine harvester harvests the rice, particle movement occurs during the separation, cleaning, and transportation, accompanied by complex friction. The contact configuration of the material and the component affect the macro friction characteristics of the material. The static friction coefficient of the rice grains and stems is shown in Figure 7. As shown in Figure 7, the static friction coefficient of the rice grains whose awn points away from the moving direction is higher than that of the rice grain whose awn points into the moving direction in different measurement periods. Although the static friction coefficient of rice grain suddenly surged at X3 (Y1 → Y6) in the morning, this is due to the measurement at X3 (Y1 → Y6) is the earliest in the morning, and the water content on the grain surface is high, the friction resistance of the grain is large. The static friction coefficient is higher for the rice stems placed parallel to the moving direction than the rice stems placed perpendicular to the moving direction in all measurement periods. As shown in Figure 7, the static friction coefficients are similar for the different placements. The static friction coefficients have large differences for different placements of the rice stems. Further statistical analysis is required to verify whether the placement of the rice grains and stems affects the static friction coefficient.
The measurement results were averaged for the whole day. The p-value of the variance homogeneity test is greater than 0.05, and the data are normally distributed. The ANOVA results are listed in Table 6. The p-value of the rice grains is 0.122, indicating that the contact configuration of the rice grains does not significantly affect the static friction coefficient. The p-value of the rice stems is 0.000, demonstrating that the contact configuration of the rice stems has a significant effect on the static friction coefficient. The average static friction coefficients of the rice stem for the parallel and perpendicular placements are 0.36 and 0.33, respectively, with a difference of 9%.

3.3. Effects of the Harvest Time and Temperature on the Static Friction Coefficients of Rice Grains and Stems

The ANOVA results of the effects of harvest time and temperature on the average static friction coefficients of rice grains and stems are shown in Table 7. The p-values of the harvest time and temperature are 0.00, indicating that these two factors significantly affect the average static friction coefficients of rice grains and stems. The Tamhane and Bonferroni post hoc tests indicate significant differences in the static friction coefficients of rice grains between the morning and evening and between the afternoon and evening. There are also significant differences in the static friction coefficient of rice stems between the morning and afternoon and between afternoon and evening. There are significant differences in the average static friction coefficients of rice grains between 19 °C and 21 °C, between 15 °C and 21 °C, and between 18 °C and 21 °C. There are significant differences in the average static friction coefficients of rice stems between 15 °C and 20 °C, between 15 °C and 21 °C, between 16 °C and 21 °C, between 17 °C and 21 °C, between 18 °C and 20 °C, between 18 °C and 21 °C, and between 19 °C and 21 °C.
As shown in Figure 8, the average static friction coefficient of the rice grains and stems initially decreases, then fluctuates in a small range, followed by a sharp increase from morning to evening. The average static friction coefficient of the rice grains and stems shows a downward trend with the temperature. However, there are two static friction coefficients with different values at the same temperature, which is caused by differences in the solar light intensity and air moisture content at different harvest times. Therefore, it is necessary to consider the effects of the harvester characteristics on the static friction coefficient of rice. The combine harvester works continuously for a long time to maximize the output, and the adverse effects of the field environment and harvest time are rarely considered. Areas with small and stable changes in the static friction coefficient for different harvesting times and temperatures are selected. The red grid in Figure 8 (10:11 a.m.–3:30 p.m., 16.5–21 °C) represents the optimum harvesting conditions. At this time, the static friction coefficients of the rice grains and stems range from 0.23 to 0.24 and from 0.33 to 0.34, respectively.

4. Discussion

The 
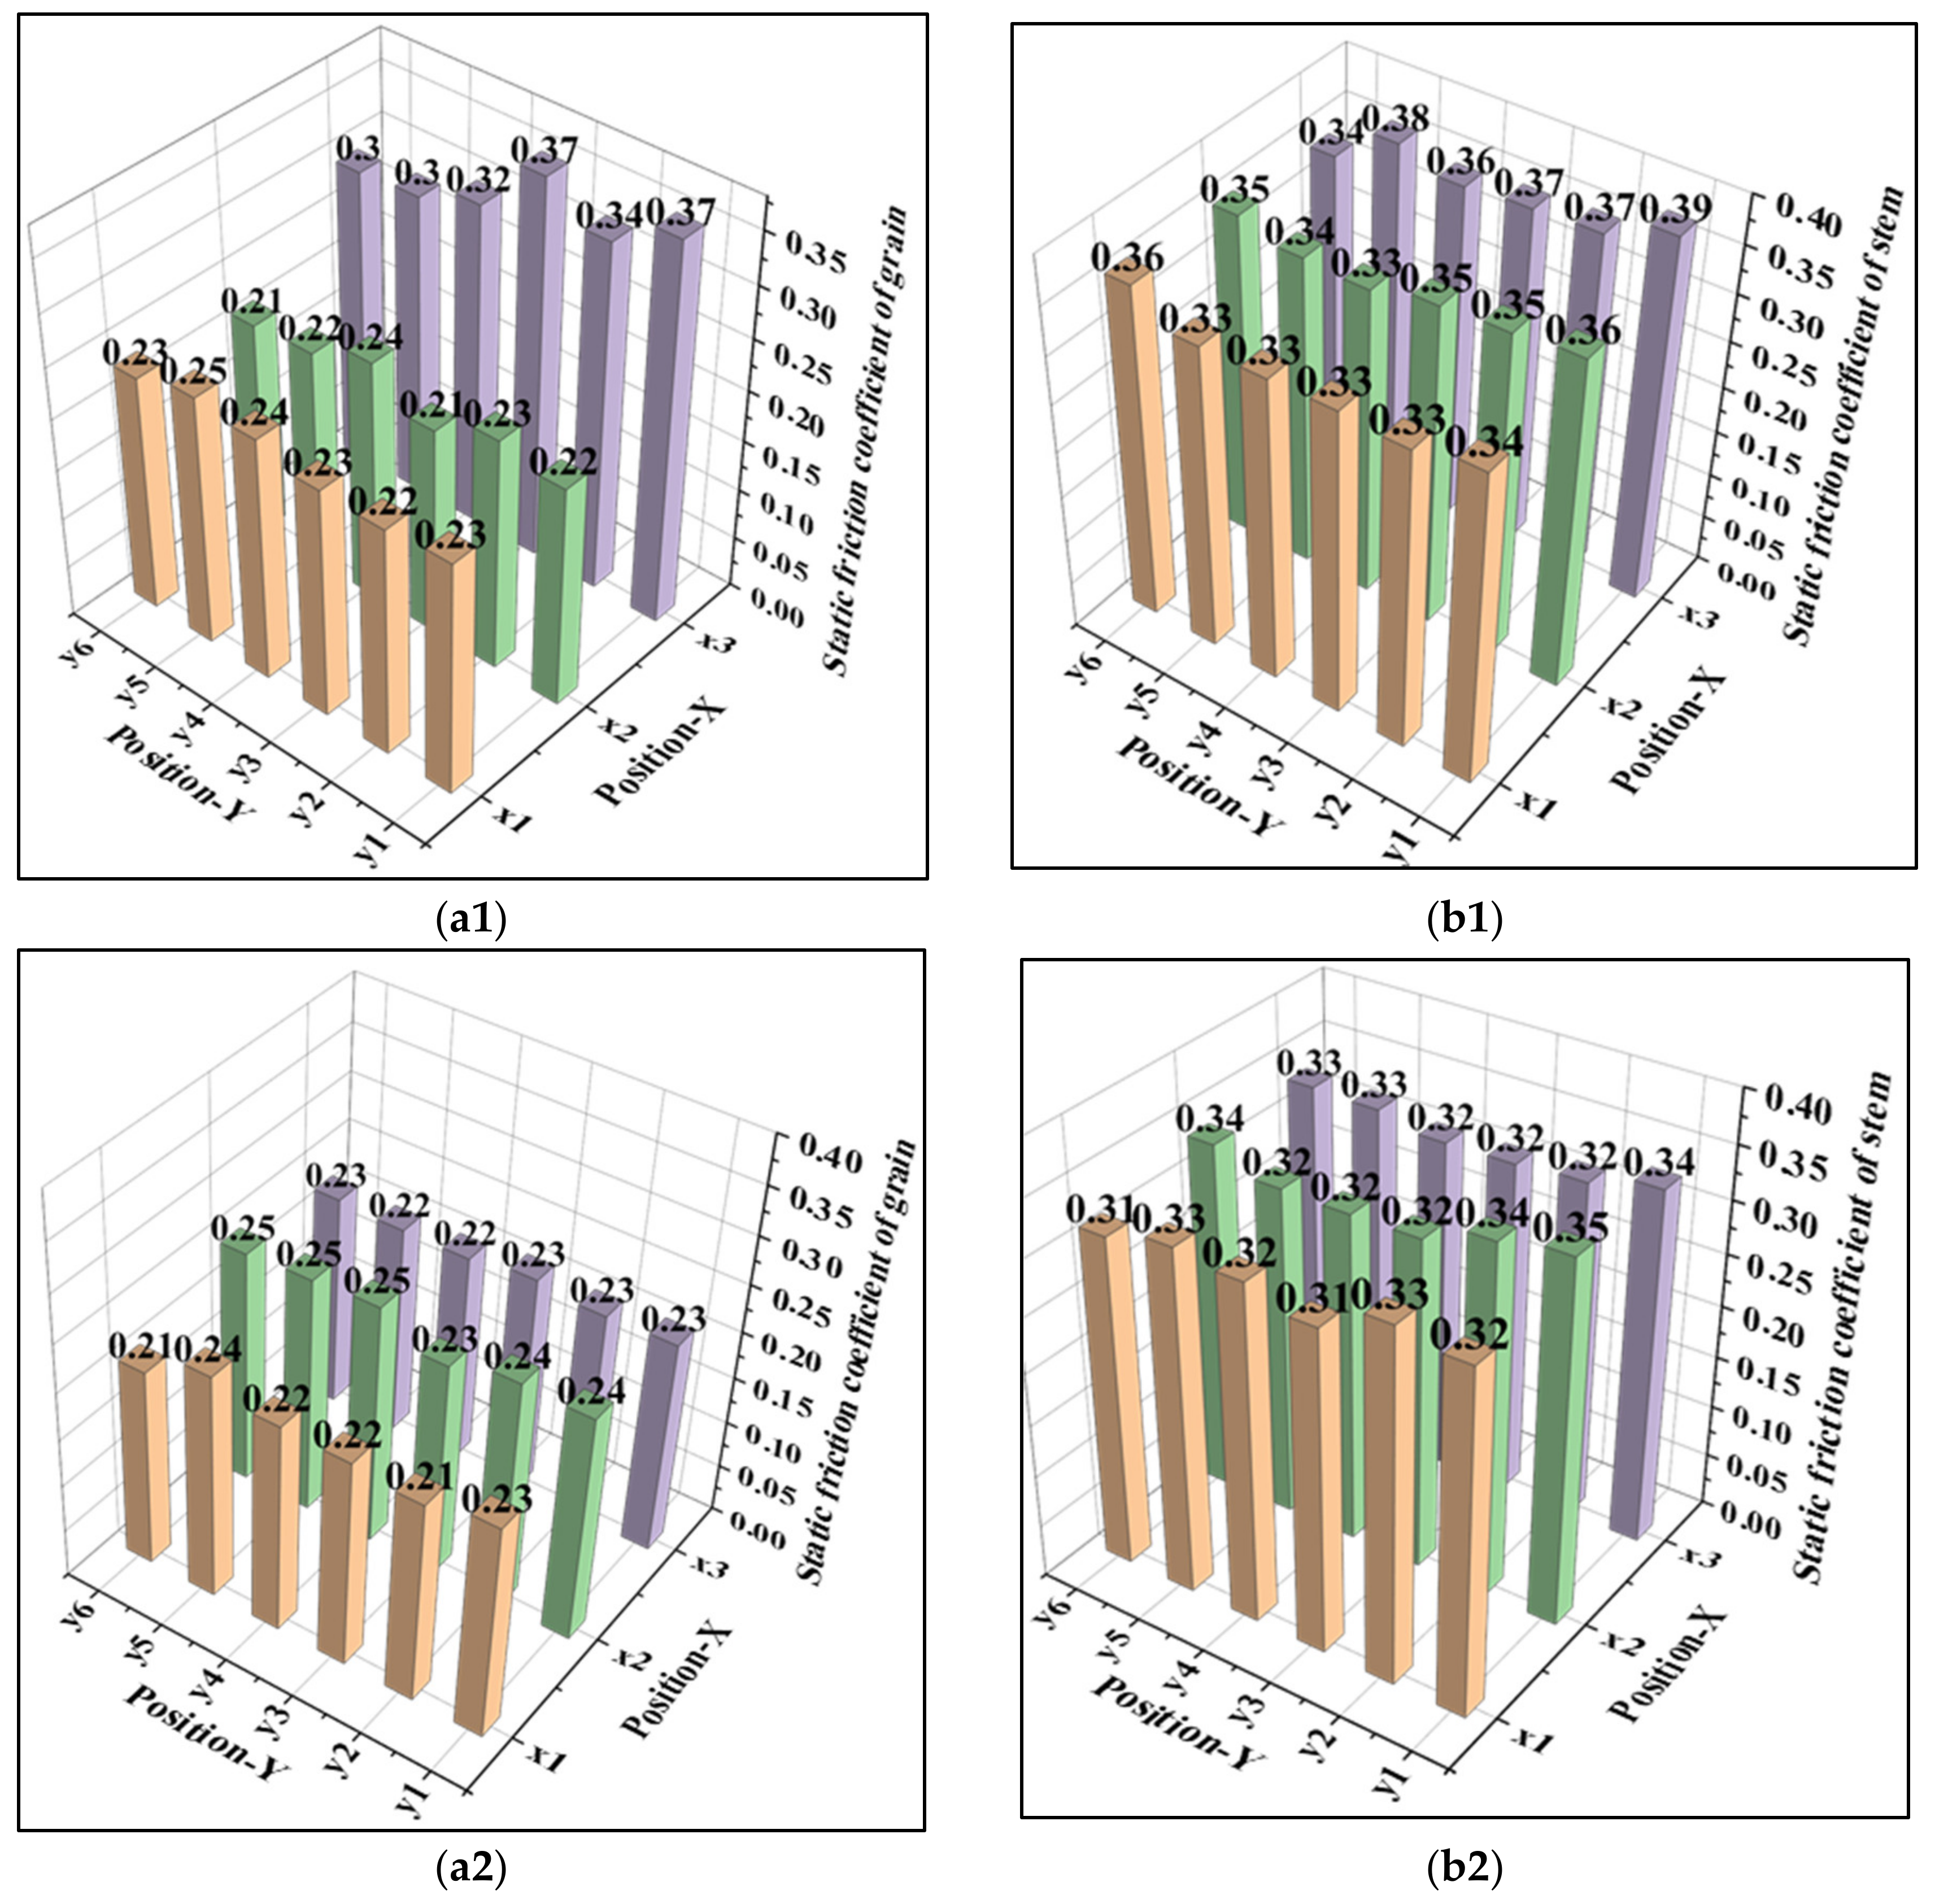
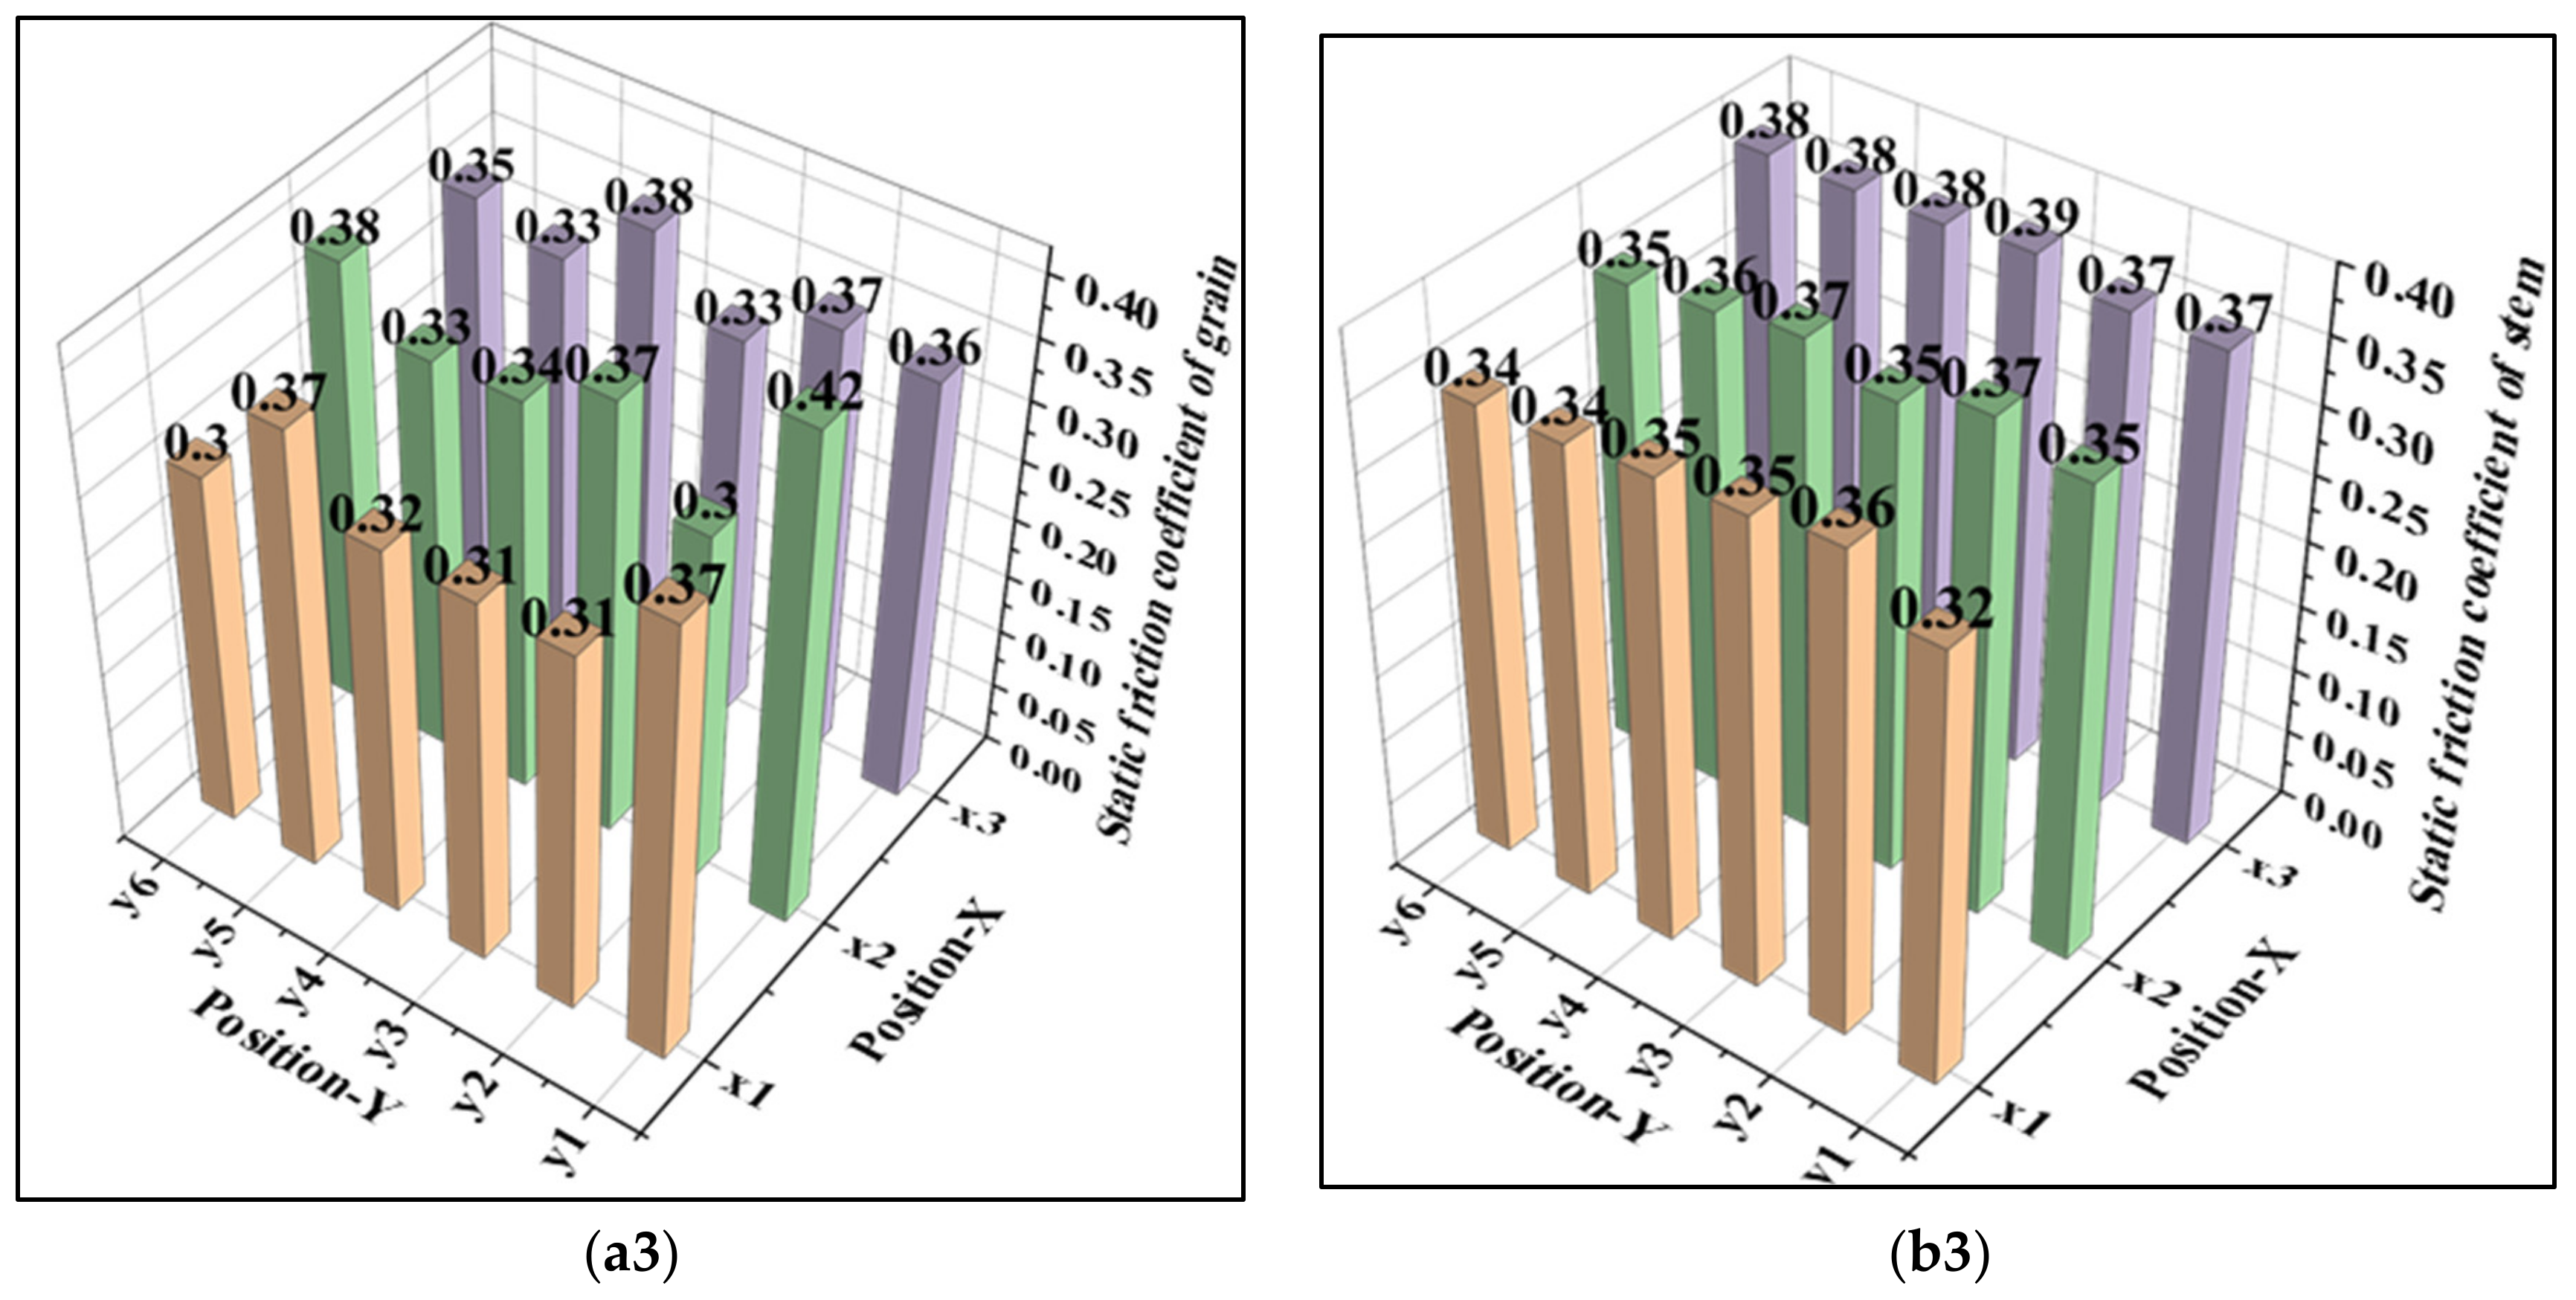
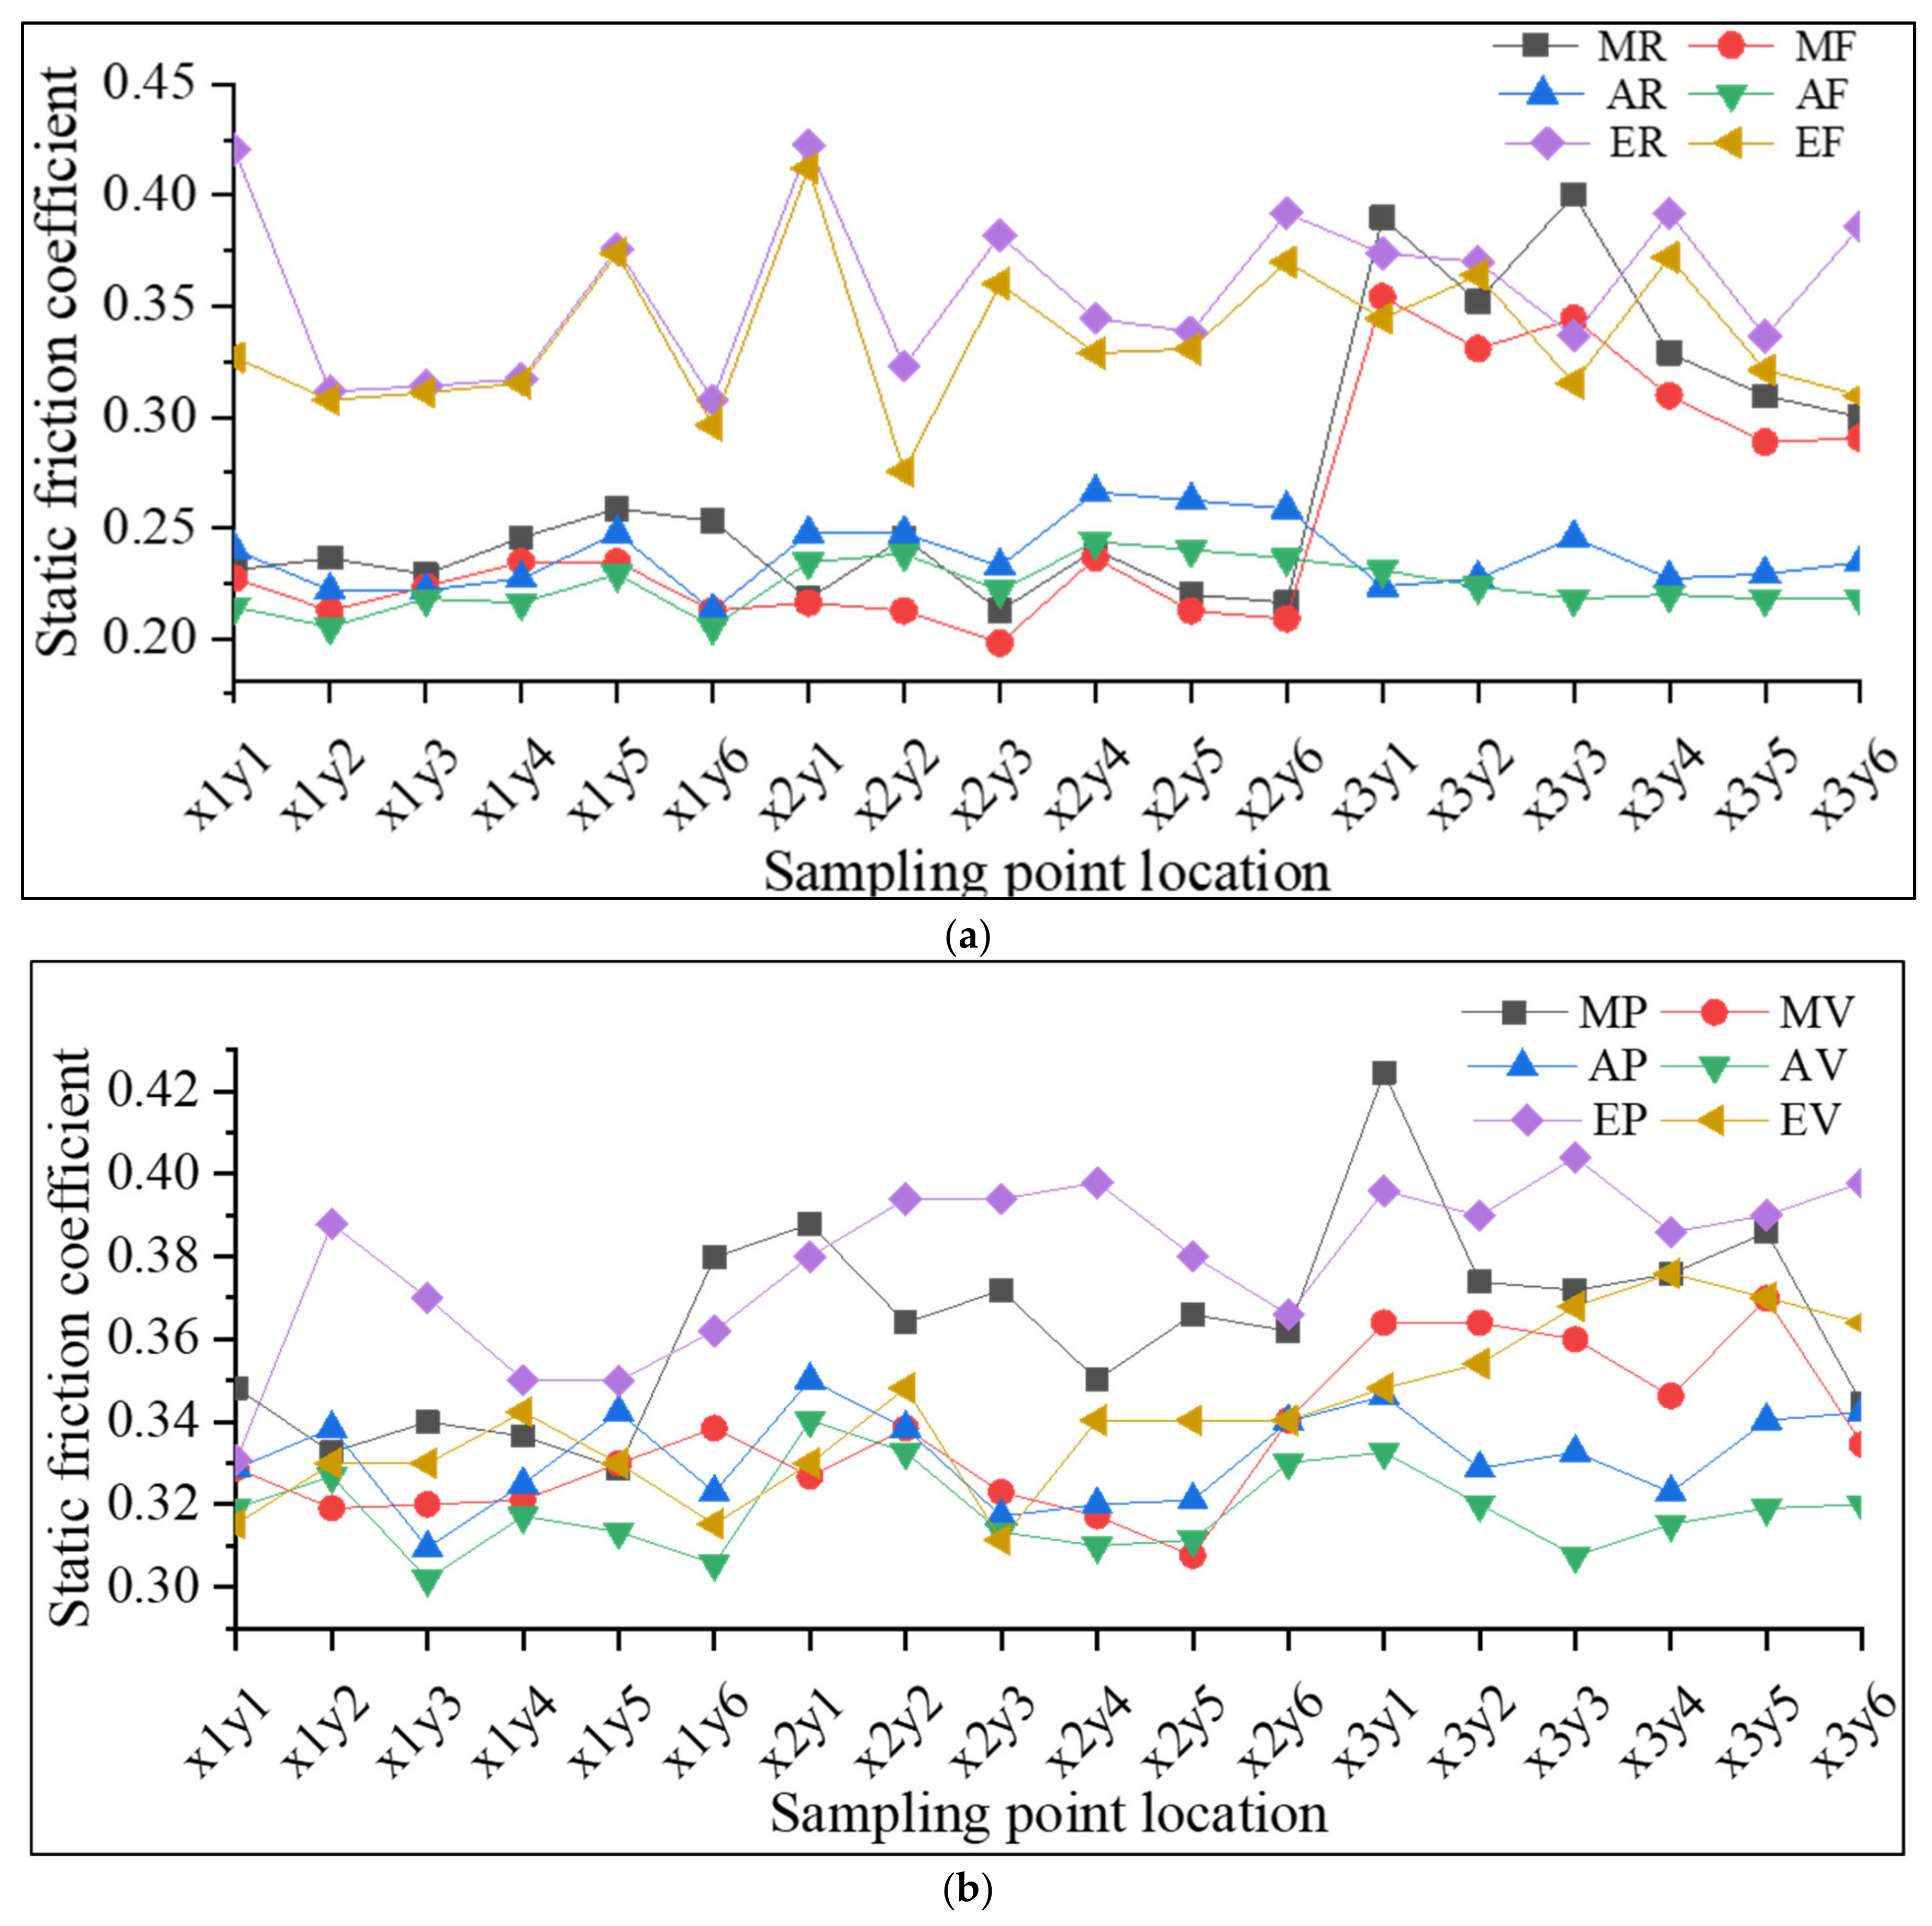
p-values of the static friction coefficients of the grains and stems of the high-yielding rice variety “Nanjing Jinggu” are smaller than 0.05 in the X-direction and larger than 0.05 in the Y-direction of the experimental field (Table 4), indicating that there are significant differences in the coefficients in the X-direction (
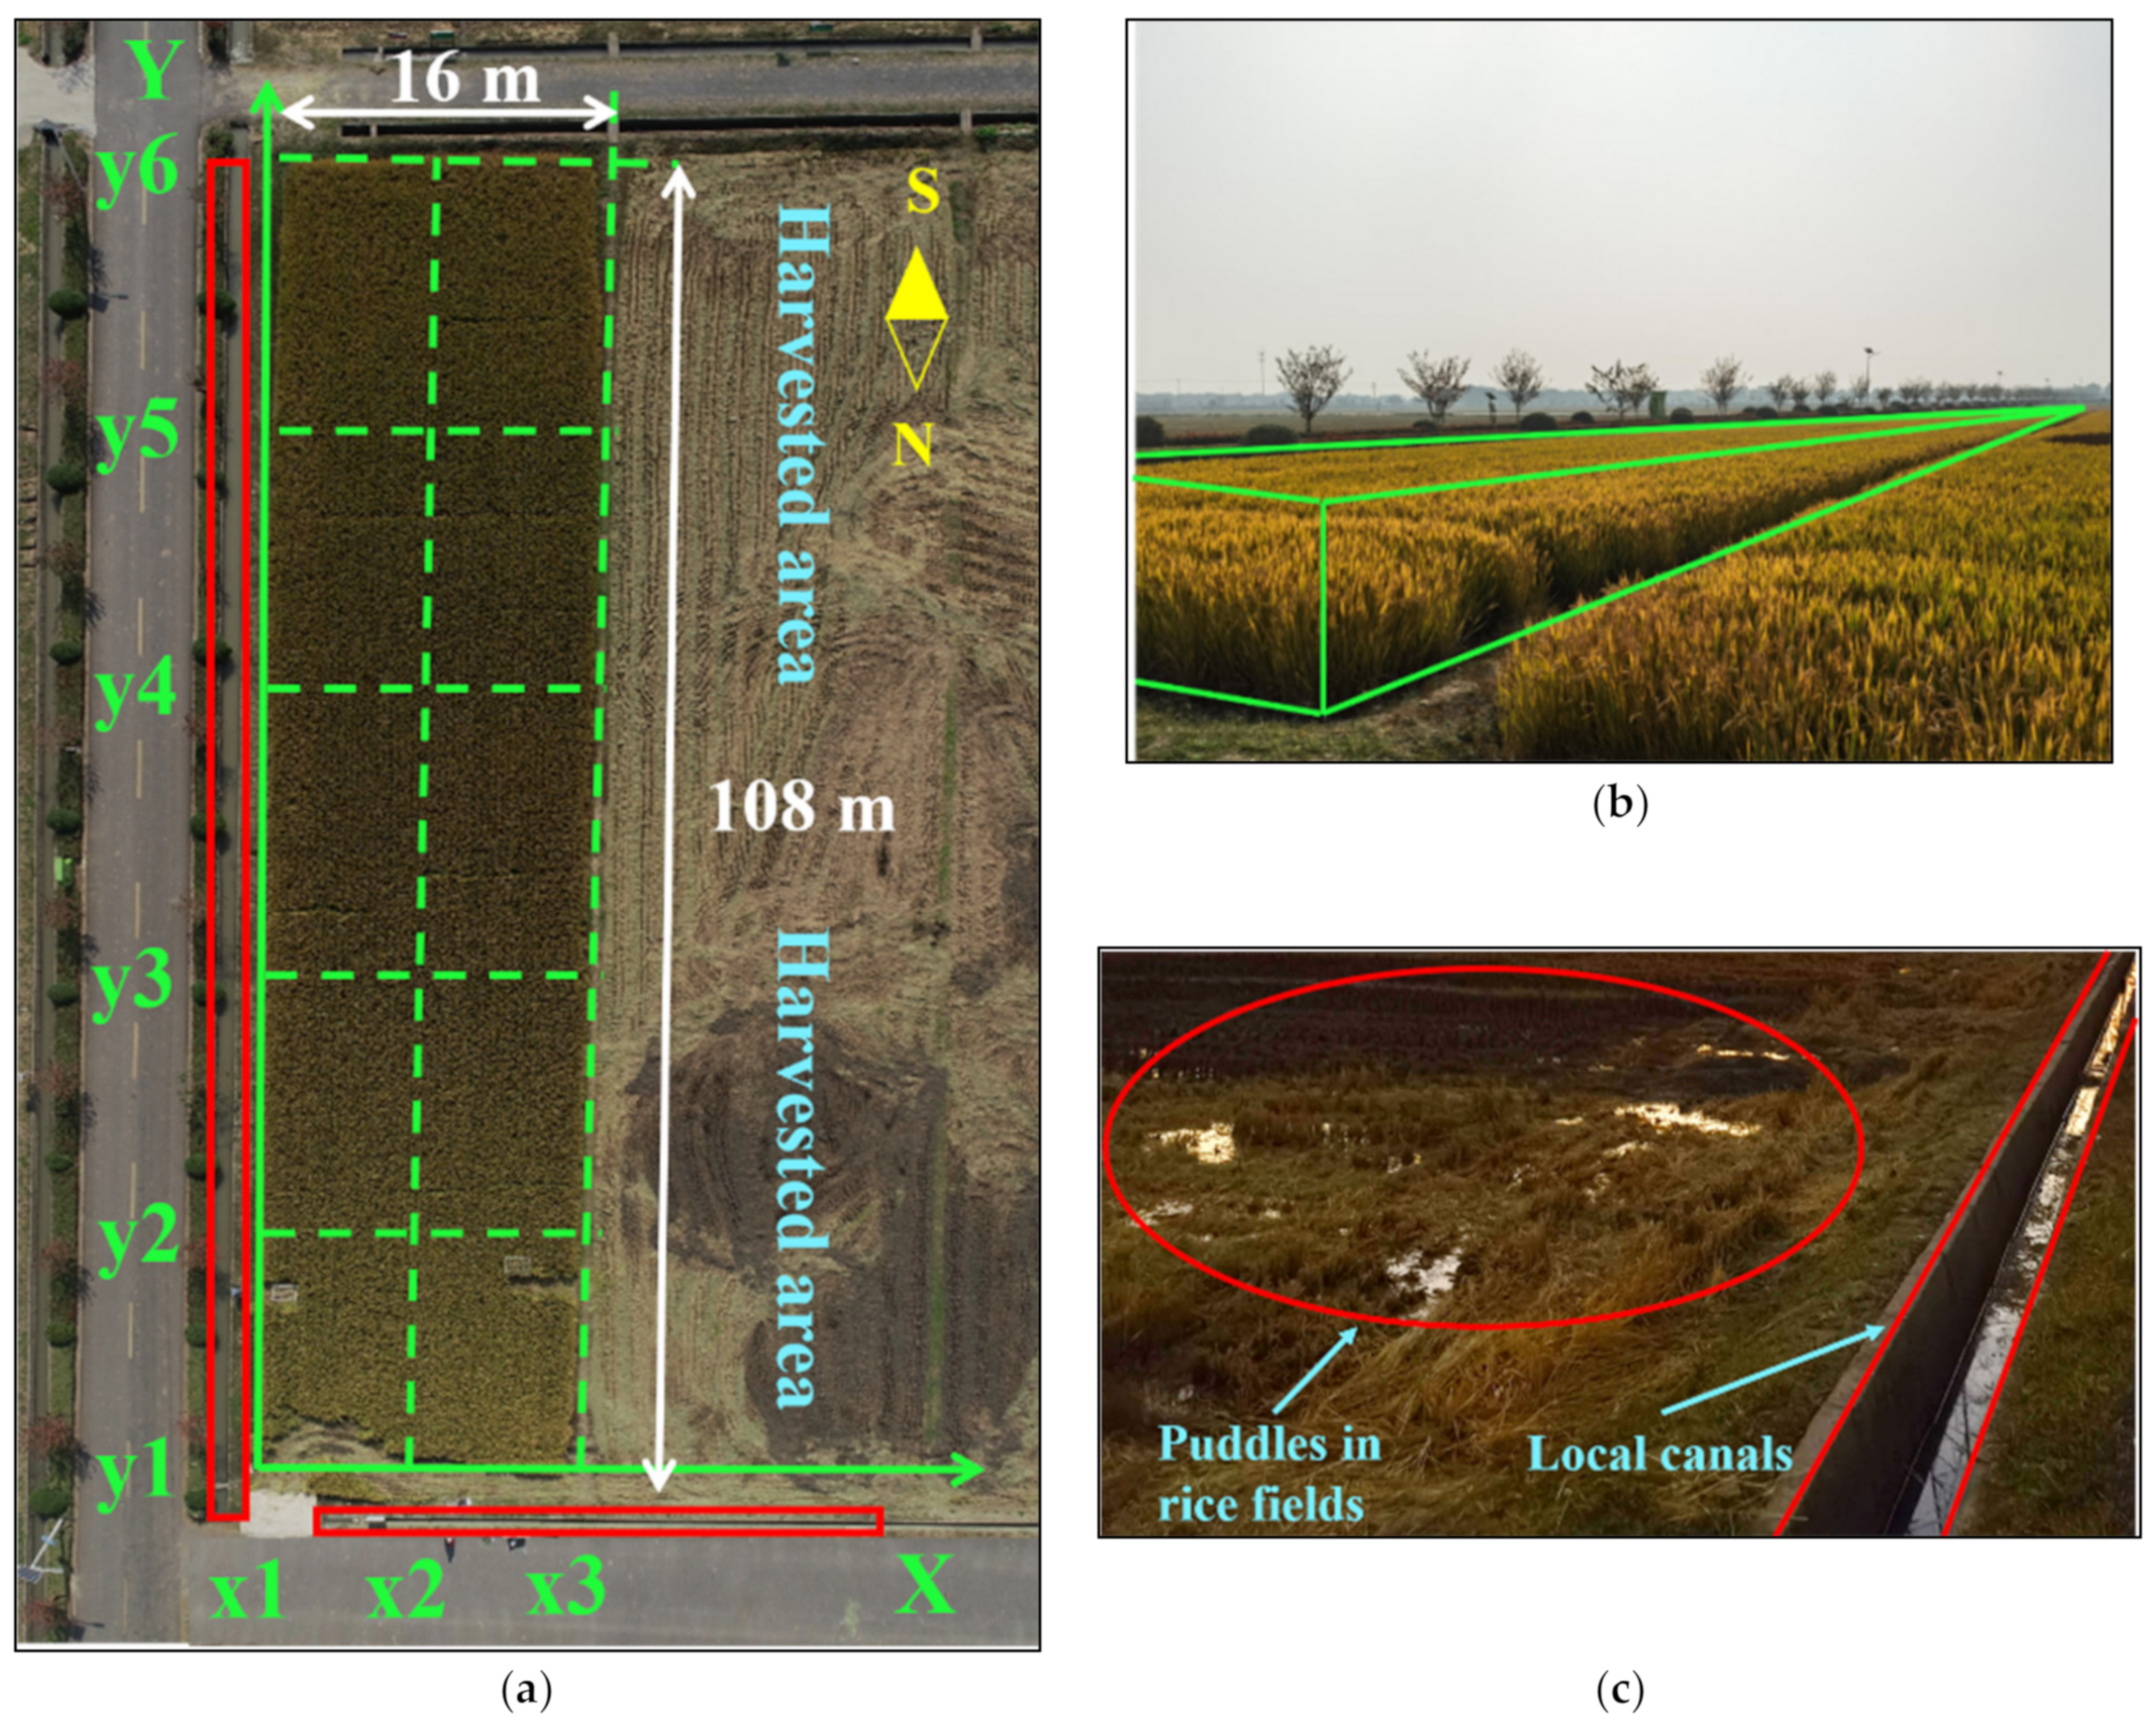
Table 5) and no significant differences in the Y-direction. Multiple canals are located around the test field, and the distance between the rice plants and the water source is different in the X-direction. Thus, the distance from the water source affects the static friction characteristics of rice grains and stems.
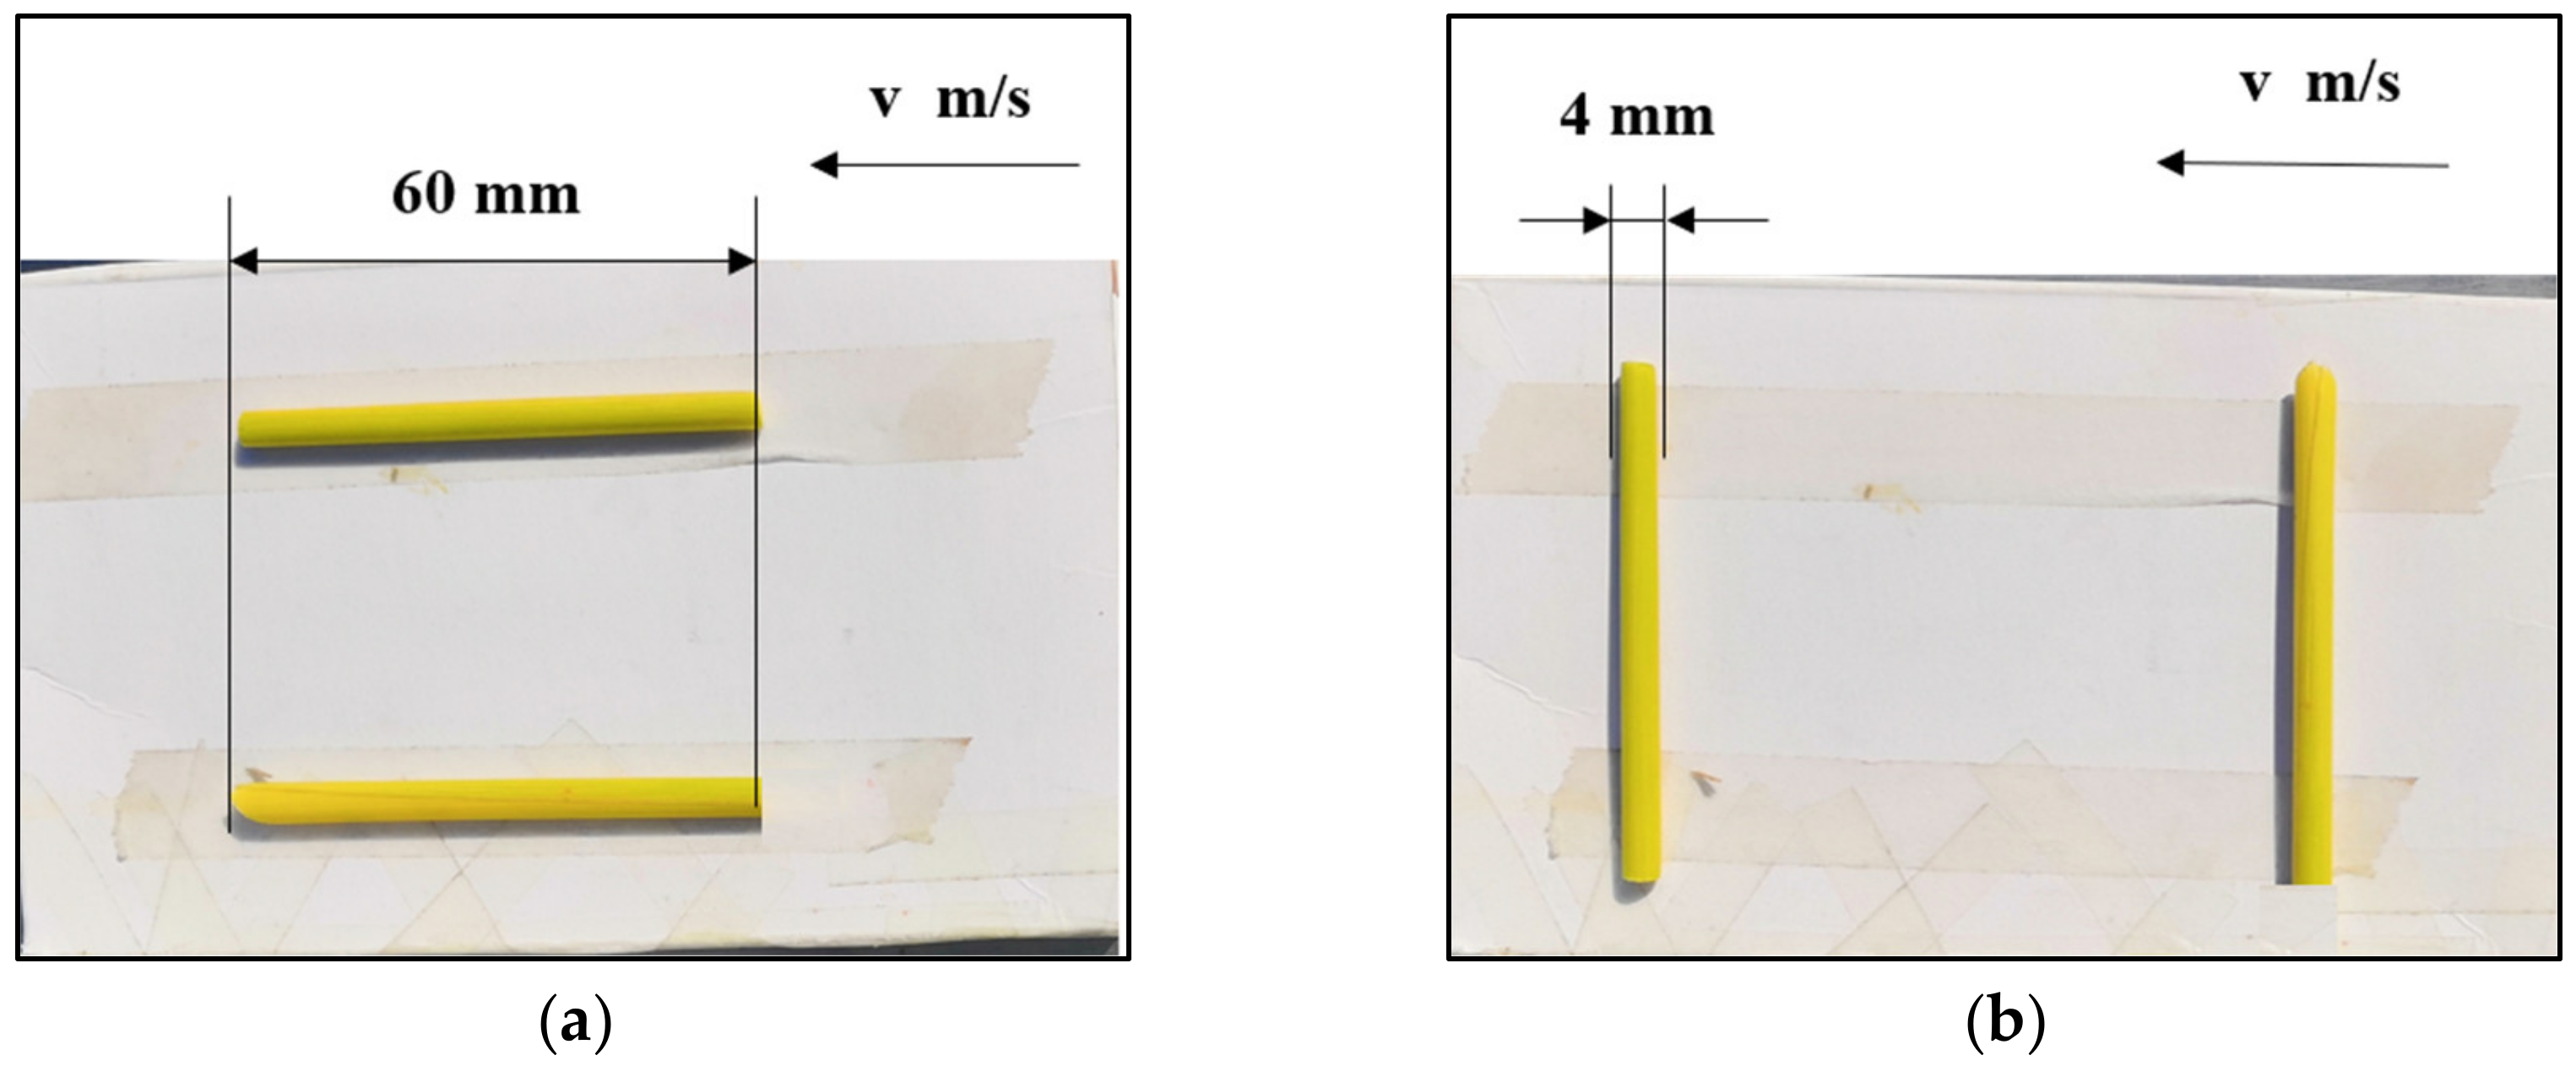
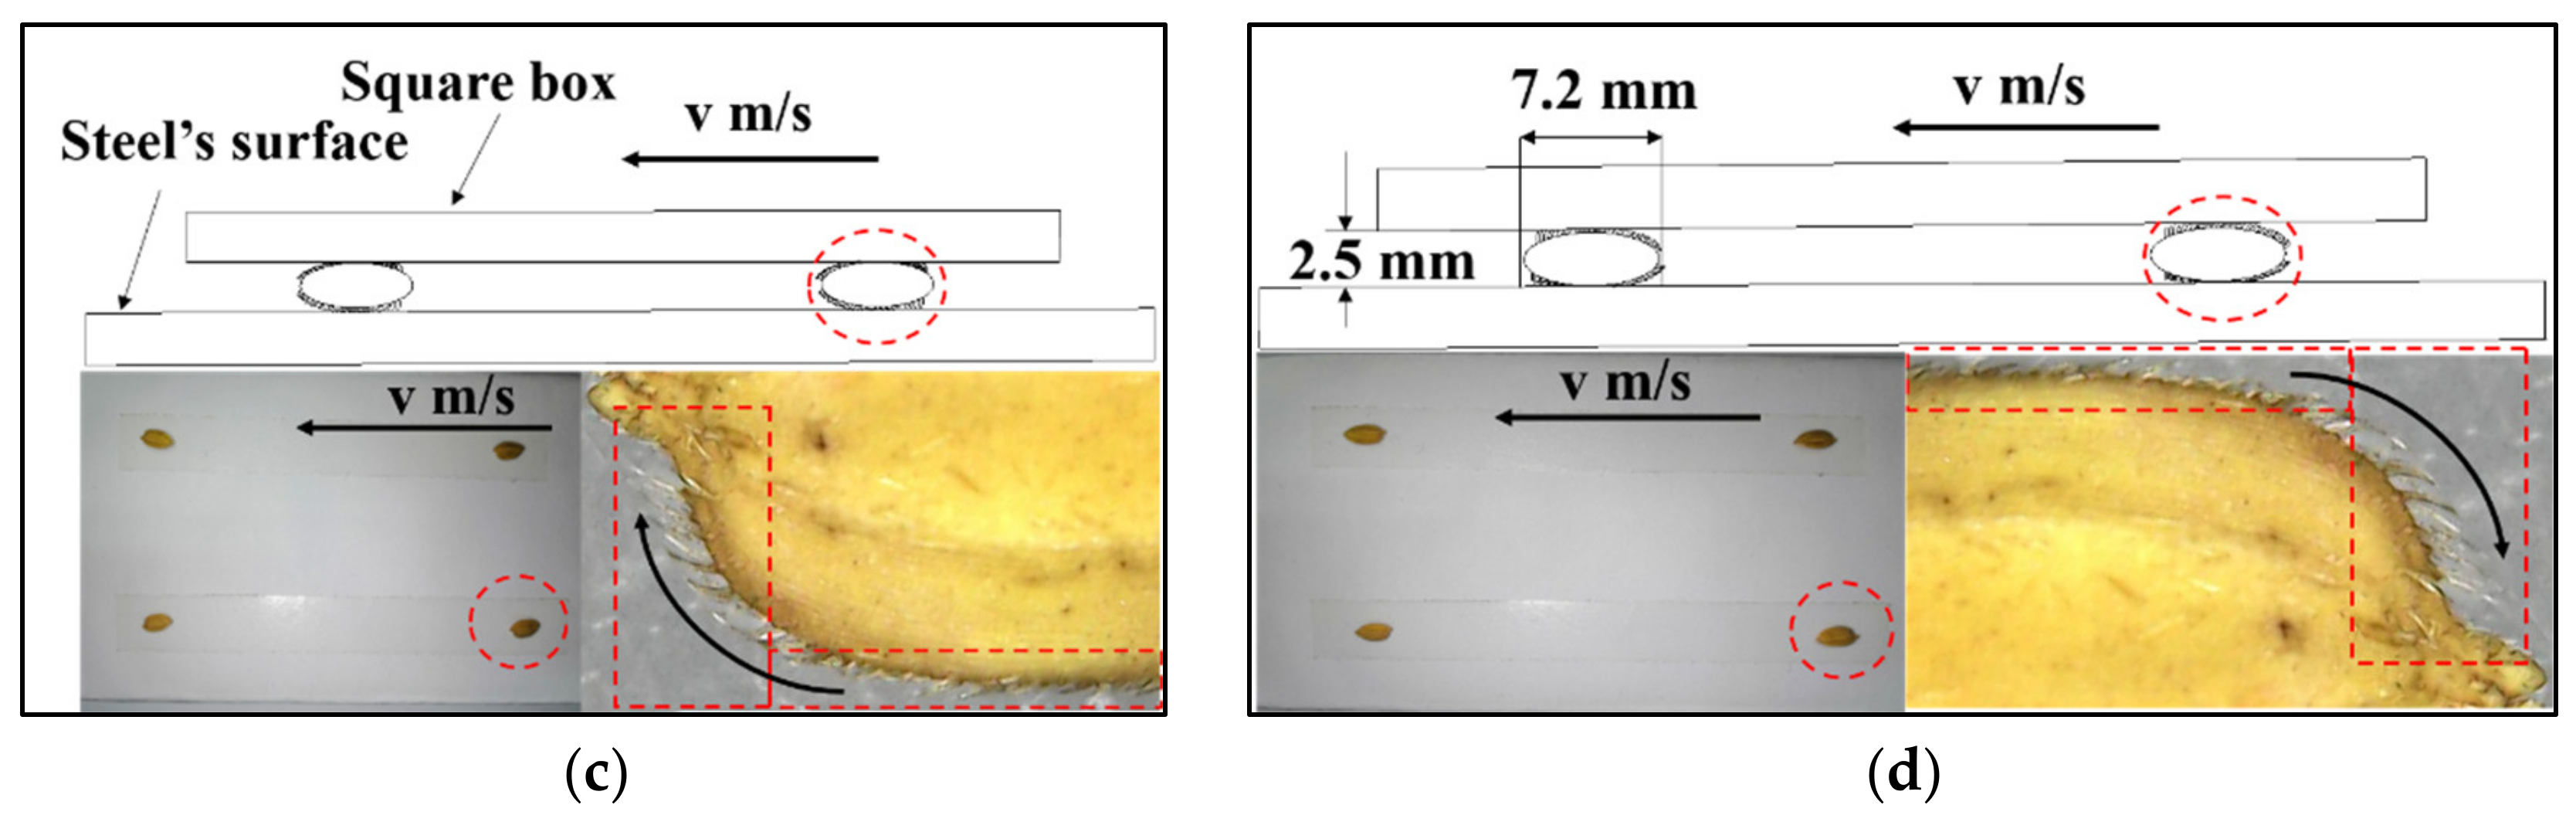
The static friction characteristics of rice are crucial for harvesting and machine design optimization. Particle motion occurs during the separation, cleaning, and transportation of the grains. The motion and location of the material particles differ in the working components of the harvester, resulting in complex friction. The p-values of the friction coefficients between the steel plate and the rice grains and stems were 0.122 and 0.000, respectively (Table 6). The contact configurations of the rice grains had no significant effect on the static friction coefficients, whereas those of the rice stems significantly affected the static friction coefficients. The difference in the static friction coefficient of the rice stems for different contact configurations was 9%. This result shows that the contact characteristics between the rice stems and the working parts of the combine significantly influence the static friction characteristics.
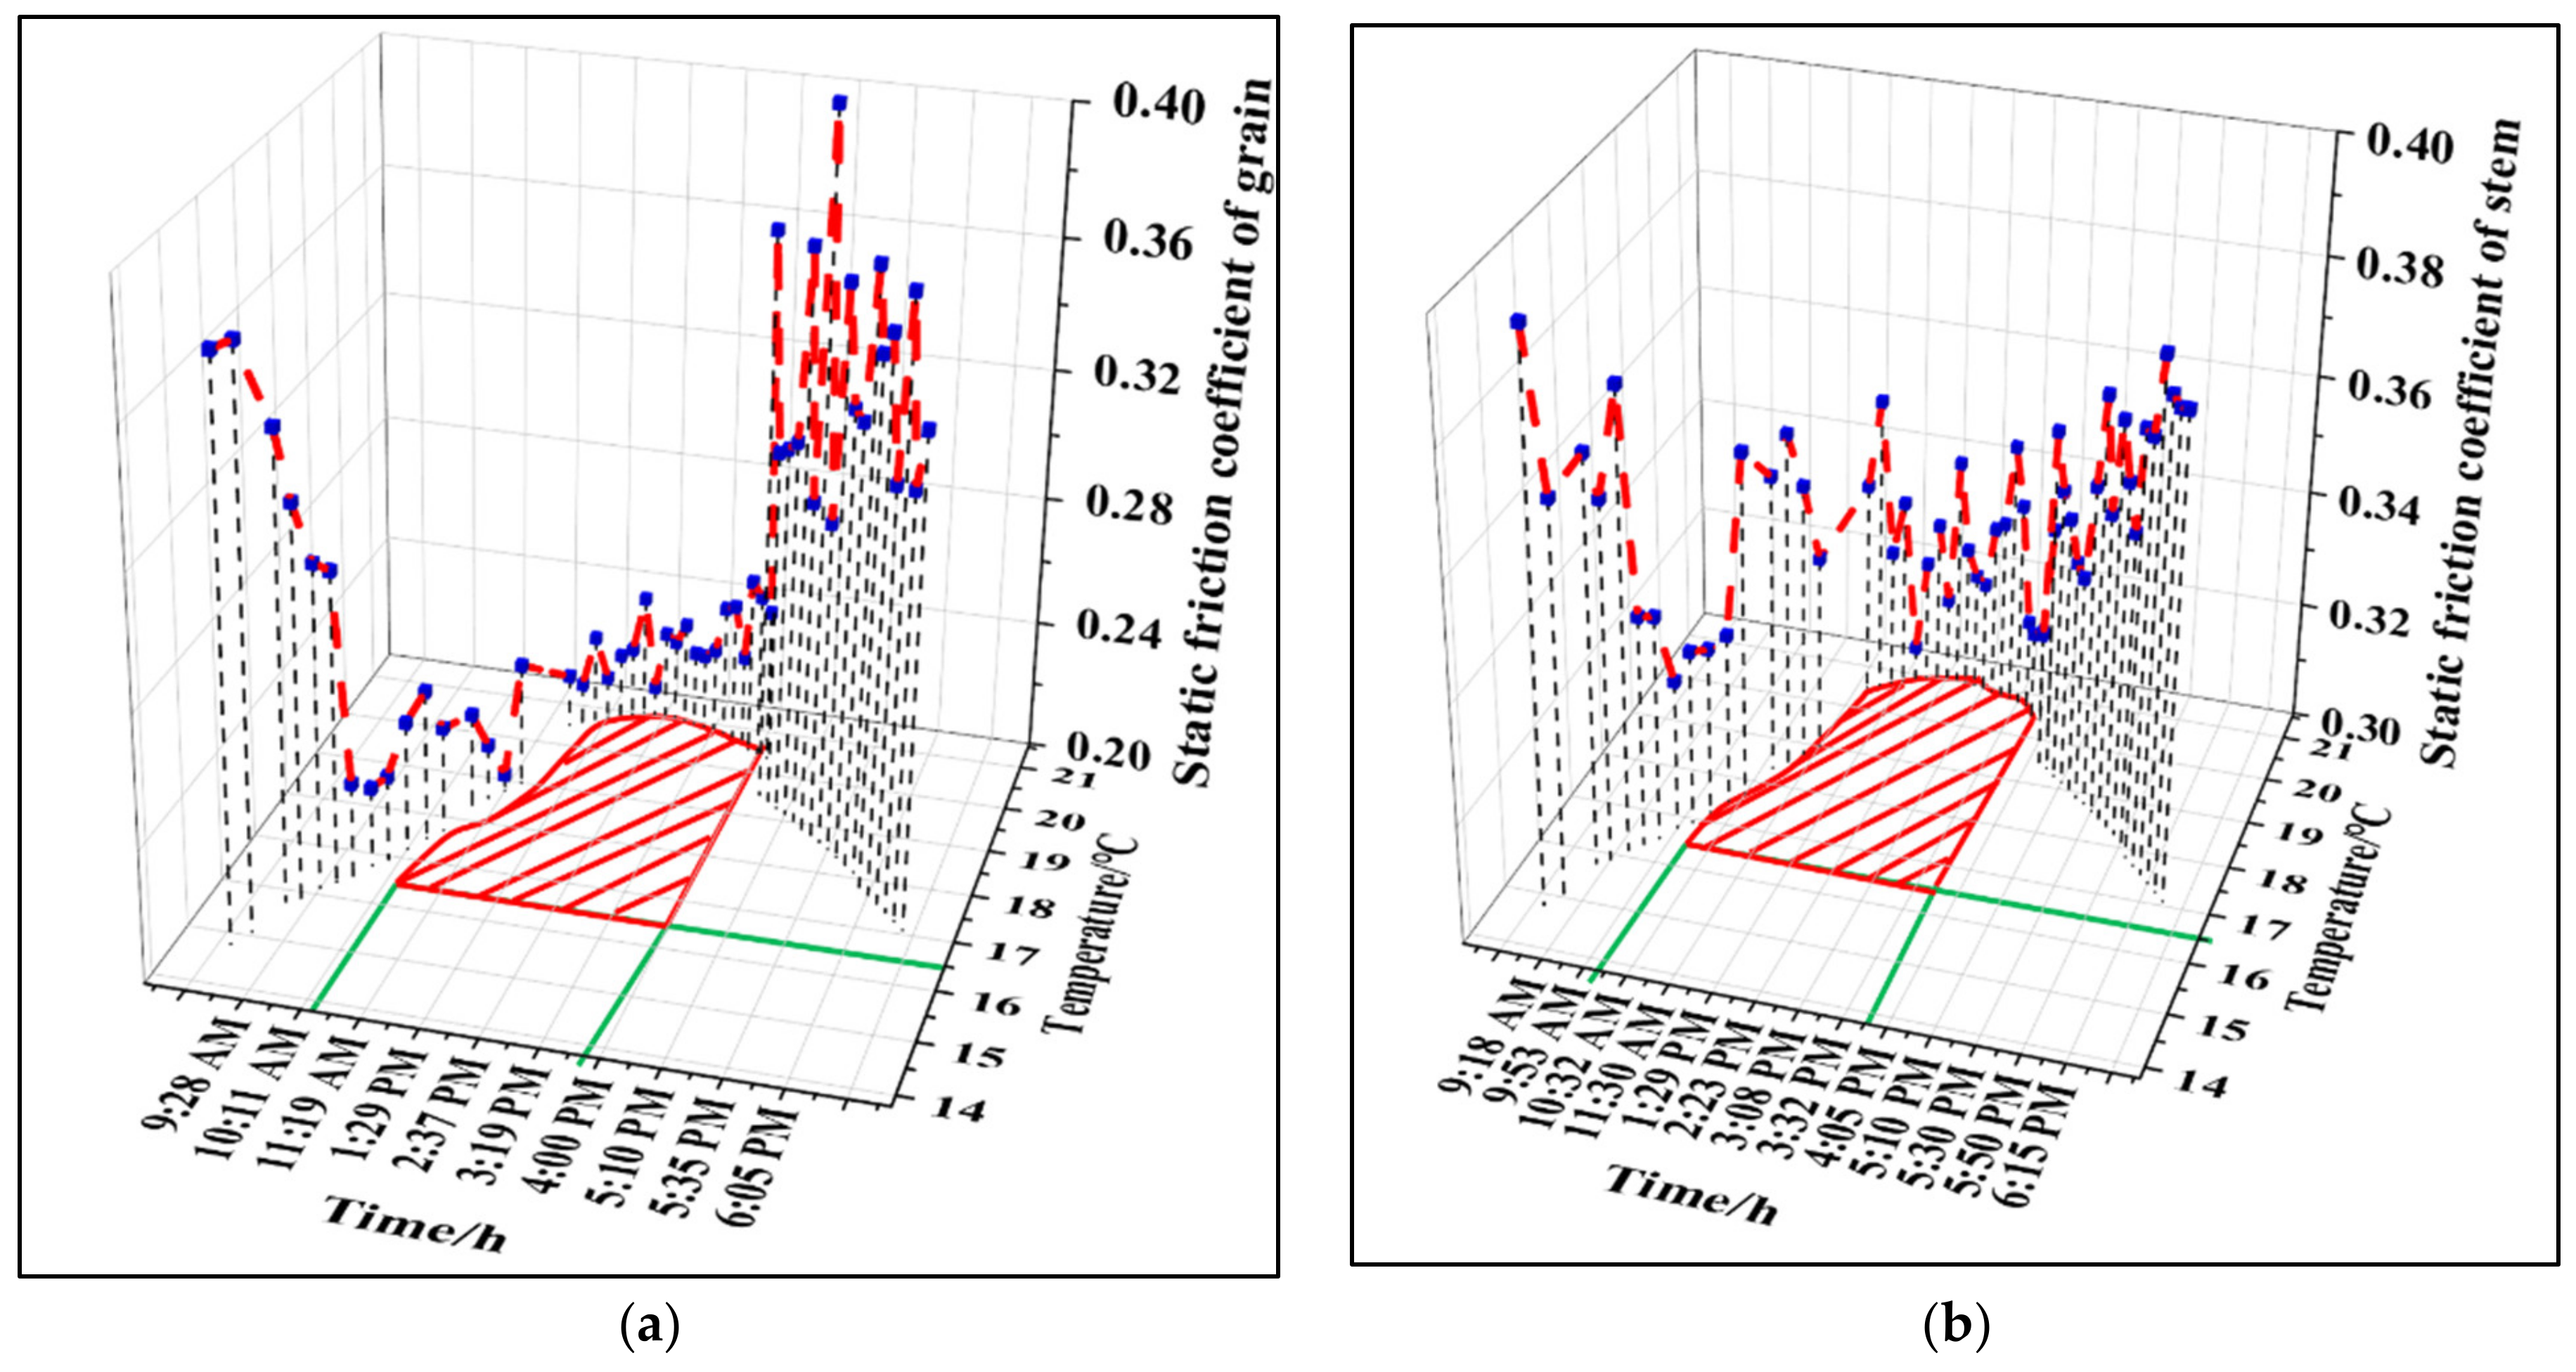
The p-values of the rice grains and stems for different measurement times and temperatures are all 0.000 (Table 7), indicating significant effects of these factors on the static friction coefficient of rice grains and stems. The combine harvester works continuously for a long time to maximize economic benefits, while the adverse effects of the harvest time, temperature, and other factors on the rice harvest are not considered. The static friction coefficients of rice grains and stems show a negligible impact on the harvesting operation and do not affect the smooth flow of materials in the combine. The optimum harvesting period is 10:11 a.m.–3:30 p.m. and the optimum temperature range is 16.5–21 °C (Figure 8). The quantitative results obtained in this study can be utilized to improve the design of combine harvester and to optimize farm operations.

5. Conclusions

This study analyzed the effects of the spatial configurations of rice grains and stems, harvest time, and temperature on the static friction characteristics of rice grains and stems of high-yielding rice. Significant differences were observed in the average static friction coefficients of rice grains and stems in the X-direction of the experimental field, indicating that the spatial location affected the static friction characteristics of rice grains and stems and the harvest quality of high-yielding rice.
The contact configuration between the rice grains and the steel plate surface had no significant effect on the static friction characteristics. In contrast, the contact configuration between the rice stems and the steel plate significantly affected the static friction characteristics. Therefore, the flow of materials in the combine is affected.
The harvest time and temperature had significant influences on the static friction characteristics of rice grains and stems. The static friction coefficient of rice grains and stems decreased sharply, then stabilized, and sharply increased during the harvest period (from morning to evening). The coefficient decreased with a decrease in the temperature. The optimum harvest conditions were 10:11 a.m.–3:30 p.m. with a temperature above 16.5 °C. Quantifying the effect of the temperature and harvest time on the static friction characteristics of rice provides data support to standardize the harvesting operation and information for the design and optimization of high-yielding rice combine harvesters. The data can also guide research and be used to train combine harvester and farm operators.
In a future study, we will analyze the effects of various factors on the static friction characteristics using a larger test site, a larger sample size, and a longer measurement period. In addition, this study still has some limitations. The high-yielding rice is limited to a single variety, and the research object is relatively simple. Due to the strong regionality of rice planting, there are some differences in its physical characteristics, so the research region is relatively limited.

Author Contributions

Conceptualization, Funding acquisition, Methodology, Writing—Original Draft, Z.M.; Data curation, Formal analysis, Investigation, Y.Z.; Supervision, Writing—review & editing, S.C.; Formal analysis, Resources, S.N.T.; Writing—review & editing, Y.L.; Writing—review & editing, L.X.; Writing—review & editing, M.S.; Writing—review & editing, Q.Z. All authors have read and agreed to the published version of the manuscript.

Funding

This work was supported financially by National Natural Science Foundation of China [51975256], Jiangsu Modern Agricultural Machinery Equipment and Technology Demonstration and Promotion Project [NJ2021-07], a project funded by the Priority Academic Program of the Development of Jiangsu Higher Education Institutions [PAPD].

Institutional Review Board Statement

Not applicable.

Informed Consent Statement

Not applicable.

Data Availability Statement

Not applicable.

Conflicts of Interest

Not applicable.

References

  1. Van, N.N.; Ferrero, A. Meeting the challenges of global rice production. Paddy Water Environ. 2006, 4, 1–9. [Google Scholar]
  2. Muthayya, S.; Sugimoto, J.D.; Montgomery, S.; Maberly, G.F. An overview of global rice production, supply, trade, and consumption. Ann. N. Y. Acad. Sci. 2014, 1324, 7–14. [Google Scholar] [CrossRef]
  3. Zhu, D.; Cheng, S.H.; Zhang, Y.P.; Lin, X.Q.; Chen, H. Analysis of status and constraints of rice production in the world. Sci. Agric. Sin. 2010, 43, 474–479. [Google Scholar]
  4. Bandumula, N. Rice production in Asia: Key to global food security. Proc. Natl. Acad. Sci. India Sect. B 2018, 88, 1323–1328. [Google Scholar] [CrossRef]
  5. Coats, B. Global rice production. In Rice Origin, History, Technology and Production, 1st ed.; Smith, C.W., Dilday, R.H., Eds.; John Wiley & Sons, Inc.: Hoboken, NJ, USA, 2003; pp. 247–470. [Google Scholar]
  6. Nie, L.X.; Peng, S.B. Rice production in China. In Rice Production Worldwide, 1st ed.; Chauhan, B.S., Jabran, K., Mahajan, G., Eds.; Springer: Cham, Switzerland, 2017; pp. 33–52. [Google Scholar]
  7. Watanabe, M.; Sumita, Y.; Azechi, I.; Ito, K.; Noda, K. The Value Chain of Locally Grown Japonica Rice in Mwea, Kenya. Agriculture 2021, 11, 974. [Google Scholar] [CrossRef]
  8. Dawe, D.; Pandey, S.; Nelson, A. Emerging Trends and Spatial Patterns of Rice Production. Rice in the global economy: Strategic Research and Policy Issues for Food Security; International Rice Research Institute: Los Banos, Philippines, 2010. [Google Scholar]
  9. Papademetriou, M.K. Rice Production in the Asia-Pacific Region: Issues and Perspectives, Bridging the rice yield gap in the Asia-Pacific region, Bangkok, Thailand, 1999.10.5; Papademetriou, M.K., Dent, F.J., Herath, E.M., Eds.; FAO Regional Office for Asia and the Pacific: Bangkok, Thailand, 2000. [Google Scholar]
  10. Peng, S.; Tang, Q.; Zou, Y. Current status and challenges of rice production in China. Plant Prod. Sci. 2009, 12, 3–8. [Google Scholar] [CrossRef] [Green Version]
  11. Yu, G.P. Analysis of the Strategic Position of Rice in China’s Food Security. Master’s Thesis, Chinese Academy of Agricultural Sciences, Beijing, China, 2009. (In Chinese). [Google Scholar]
  12. Liang, J.; Lv, X.T.; Feng, Y.P.; Wan, K.J.; Tang, S.; He, J. Development Status and Suggestions of Super Rice in China. China Rice 2020, 26, 1–4. (In Chinese) [Google Scholar]
  13. Zhu, L.H. Some critical considerations on rice high-yielding breeding in China. J. Nanjing Agric. Univ. 2007, 30, 129–135. (In Chinese) [Google Scholar] [CrossRef]
  14. Super Hybrid Rice “Liang You 293” Integration and Extension of High Yield and High Efficiency Production Technology. Available online: https://kns.cnki.net/kcms/detail/detail.aspx?FileName=SNAD000001478128&DbName=SNAD2013 (accessed on 13 February 2022). (In Chinese).
  15. Zhu, Z.; Zhang, Y.D.; Chen, T.; Zhao, Q.Y.; Feng, K.H.; Zhou, L.H.; Yao, Z.; Zhao, L.; Zhao, C.F.; Liang, W.H. Breeding and application of a new japonica rice cultivar “Nanjing Jinggu” with good eating quality. Jiangsu Agric. Sci. 2020, 48, 79–82. (In Chinese) [Google Scholar]
  16. The total extension and application area of super rice in China is 9000 billion square meters. Fujian Sci. Technol. Rice Wheat. 2018, 36, 60. (In Chinese)
  17. Trial planting and extension of China’s “Green Super Rice” in 18 Asian and African countries. Agric. Sci. Technol. Inf. 2020, 1, 9. (In Chinese)
  18. Piveta, L.B.; Roma-Burgos, N.; Noldin, J.A.; Viana, V.E.; Oliveira, C.D.; Lamego, F.P.; Avila, L.A.D. Molecular and physiological responses of rice and weedy rice to heat and drought stress. Agriculture 2021, 11, 9. [Google Scholar] [CrossRef]
  19. Liu, Q.; Chen, S.; Zhou, L.; Tao, Y.; Tian, J.; Xing, Z.; Wei, H.; Zhang, H. Characteristics of Population Quality and Rice Quality of Semi-Waxy japonica Rice Varieties with Different Grain Yields. Agriculture 2022, 12, 1–15. [Google Scholar] [CrossRef]
  20. Peng, Y.L.; Hu, Y.G.; Qian, Q.; Ren, D.Y. Progress and prospect of breeding utilization of green revolution gene SD1 in rice. Agriculture 2021, 11, 611. [Google Scholar] [CrossRef]
  21. Meng, T.Y.; Chen, X.; Zhang, X.B.; Ge, J.L.; Zhou, G.S.; Dai, Q.G.; Wei, H.H. Grain-Filling Characteristics in Extra-Large Pan-icle Type of Early-Maturing japonica/indica Hybrids. Agriculture 2021, 11, 1165. [Google Scholar] [CrossRef]
  22. Meng, T.Y.; Ge, J.L.; Zhang, X.B.; Chen, X.; Zhou, G.S.; Wei, H.H. Improvements in plant morphology facilitating progressive yield increases of japonica inbred rice since the 1980s in East China. Agriculture 2021, 11, 834. [Google Scholar] [CrossRef]
  23. Wang, Z.M. Study on distribution spectrum of grain connection force and differential-speed threshing device for combine harvester. J. Zhejiang Univ. (Agric. Life Sci.) 2017, 43, 120–127. [Google Scholar]
  24. Liang, Z.W.; Li, Y.M.; De Baerdemaeker, J.; Xu, L.Z.; Saeys, W. Development and testing of a multi-duct cleaning device for tangential-longitudinal flow rice combine harvesters. Biosyst. Eng. 2019, 182, 95–106. [Google Scholar] [CrossRef]
  25. Tang, Z.; Li, Y.M.; Xu, L.Z. Design and optimization for length of longitudinal-flow threshing cylinder of combine harvester. Trans. Chin. Soc. Agric. Eng. 2014, 30, 28–34. [Google Scholar]
  26. Xu, L.; Li, Y.; Chai, X.; Wang, G.; Li, B. Numerical simulation of gas–solid two-phase flow to predict the cleaning performance of rice combine harvesters. Biosyst. Eng. 2020, 190, 11–24. [Google Scholar] [CrossRef]
  27. Ma, Z.; Han, M.; Li, Y.; Gao, H.; Ma, K. Motion of cereal particles on variable-amplitude sieve as determined by high-speed image analysis. Comput. Electron. Agric. 2020, 174, 105465. [Google Scholar] [CrossRef]
  28. Shi, G.K.; Li, J.B.; Ding, L.P.; Zhang, Z.Y.; Ding, H.Z.; Li, N.; Kan, Z. Calibration and Tests for the Discrete Element Simulation Parameters of Fallen Jujube Fruit. Agriculture 2022, 12, 38. [Google Scholar] [CrossRef]
  29. Rahnejat, H.; Gohar, R. Fundamentals of Tribology, 3rd ed.; World Scientific Publishing Company: Singapore, 2018. [Google Scholar]
  30. Zhang, S.W.; Fu, J.; Zhang, R.Y.; Zhang, Y.; Yuan, H.F. Experimental Study on the Mechanical Properties of Friction, Collision and Compression of Tiger Nut Tubers. Agriculture 2022, 12, 65. [Google Scholar] [CrossRef]
  31. Zhou, Y.P.; Su, H.T. Study on the Influencing Factors of High Yield of Rice in China. Mod. Agric. Res. 2020, 26, 130–131. (In Chinese) [Google Scholar]
  32. Ghadge, P.N.; Prasad, K. Some physical properties of rice kernels: Variety PR-106. J. Food Process. Technol. 2012, 3, 1–5. [Google Scholar] [CrossRef] [Green Version]
  33. Jouki, M.; Khazaei, N. Some physical properties of rice seed (Oryza sativa). Res. J. Appl. Sci. Eng. Technol. 2012, 4, 1846–1849. [Google Scholar]
  34. Li, H.C.; Gao, F.; Li, Y.M.; Yan, J.C. Determination of Rice Grain Physical Properties. J. Agric Mech. Res. 2014, 36, 23–27. (In Chinese) [Google Scholar]
  35. Bhattacharya, K.R. Rice Quality: A Guide to Rice Properties and Analysis, 2nd ed.; Woodhead Publishing: Philadelphia, PA, USA, 2011; pp. 26–60. [Google Scholar]
  36. Yuan, J.B.; Wu, C.Y.; Li, H.; Qi, X.D.; Xiao, X.X.; Shi, X.X. Determination and Analysis of Two Kinds of Threshed Rice Physi-cal Properties in South China. J. Agric. Mech. Res. 2018, 40, 154–159. (In Chinese) [Google Scholar]
  37. Yu, H.M. The Experimental Measurement of Physical Characteristics for Special Grains. Master’s Thesis, Nanjing Agricultural University, Nanjing, China, 2006. (In Chinese). [Google Scholar]
  38. Zhang, Q.; Puri, V.M.; Manbeck, H.B. An empirical model for friction force versus relative displacement between maize, rice and soybeans on galvanized steel. J. Agric. Eng. Res. 1991, 49, 59–71. [Google Scholar] [CrossRef]
  39. Kayode, S.E.; Olorunfemi, B.J.; Soyoye, B.O. Determination of engineering properties of some Nigerian local grain crops. Int. J. Agric. Biosyst. Eng. 2018, 3, 10–18. [Google Scholar]
  40. Kumar, S.; Haq, R.; Prasad, K. Studies on physico-chemical, functional, pasting and morphological characteristics of developed extra thin flaked rice. J. Saudi Soc. Agric. Sci. 2018, 17, 259–267. [Google Scholar] [CrossRef] [Green Version]
  41. Tang, H.; Xu, C.S.; Jiang, Y.M.; Wang, J.W.; Wang, Z.H.; Tian, L.Q. Evaluation of Physical Characteristics of Typical Maize Seeds in a Cold Area of North China Based on Principal Component Analysis. Processes 2021, 9, 1167. [Google Scholar] [CrossRef]
  42. Zhou, X.W. The Physical and Mechanical Properties Research of Corn Grain. Master’s Thesis, Northeast Agricultural University, Harbin, China, 2015. (In Chinese). [Google Scholar]
Figure 1. The experimental field: (a) Aerial view; the red lines denote the canals, and the points intersected by the green dotted lines represent the sampling points; (b) detailed view of the field; the area within green lines is the test field; (c) detailed view, showing the water in the canal and field.
Agriculture 12 00327 g001
Figure 2. Sampling procedure for measuring the friction coefficient: (a) the stem is placed parallel to the movement direction; (b) the stem is placed perpendicular to the movement direction; (c) the awn points away from the movement direction; (d) the awn points in the movement direction.
Agriculture 12 00327 g002aAgriculture 12 00327 g002b
Figure 3. Measurement process of the friction coefficient: (a) angle measuring device; (b) measuring principle; (c) measurement site.
Agriculture 12 00327 g003aAgriculture 12 00327 g003b
Figure 4. Flow-chart of determining the static friction coefficients of the field high-yielding rice.
Agriculture 12 00327 g004
Figure 5. Average static friction coefficients of rice grains and stems in different measurement periods: (a1) and (b1) morning; (a2) and (b2) afternoon; (a3) and (b3) evening.
Agriculture 12 00327 g005aAgriculture 12 00327 g005b
Figure 6. Average static friction coefficients of rice grains and stems averaged over the three measurement periods: (a) rice grain; (b) rice stem.
Agriculture 12 00327 g006
Figure 7. The static friction coefficient of the rice grains and stems for different contact configurations and in different measurement periods: (a) the awn points away from/in the movement direction; (b) the stem is placed parallel/perpendicular to the movement direction. MR, MF, AR, AF, ER, and EF; MP, MV, AP, AV, EP, and EV represent the combination of different periods (morning (M),/afternoon (A)/, and evening (E) and the awn directions regarding the movement directions (forward (F) and reverse (R) or the stem placement parallel (P) and perpendicular (V)).
Agriculture 12 00327 g007
Figure 8. Average static friction coefficients of the rice grains and stems for different measurement periods (harvest time) and temperatures: (a) rice grain; (b) rice stem.
Agriculture 12 00327 g008
Table 1. Schedule for the friction coefficient measurements.
Measurement PeriodMeasuring Time/hSampling Point
Morning8:20 a.m.–9:35 a.m.x3 (y1→y6)
9:42 a.m.–10:32 a.m.x1 (y1 → y6)
11:00 a.m.–12:00 p.m.x2 (y1 → y6)
Afternoon1:20 p.m.–2:23 p.m.x1 (y1 → y6)
2:37 p.m.–3:19 p.m.x3 (y1 → y6)
3:24 p.m.–4:05 p.m.x2 (y1 → y6)
Evening5:00 p.m.–5:27 p.m.x1 (y1 → y6)
5:32 p.m.–5:57 p.m.x2 (y1 → y6)
6:00 p.m.–6:30 p.m.x3 (y1 → y6)
Table 2. Static friction coefficients of the rice grains and stems at different sampling points, harvest times, and air temperatures.
Harvest TimeAir Temperature/°CSpatial Position XSpatial Position YStatic Friction Coefficient of Rice GrainStatic Friction Coefficient of Rice Stem
115110.370.39
115120.370.37
116130.340.37
116140.320.36
116150.300.38
116160.300.34
221210.230.34
221220.230.32
221230.230.32
221240.220.32
221250.220.33
221260.230.33
318310.360.37
318320.370.37
318330.330.39
317340.380.38
317350.330.38
317360.350.38
The harvest time is referred to as morning, afternoon, and evening (1, 2, and 3), the air temperature is an integer, x1–x3 is referred to as 1–3, and y1–y6 is referred to as 1–6.
Table 3. Static friction coefficients of the rice grains and stems at all sampling points for different contact configurations.
Rice Grain Contact PostureStatic Friction Coefficient of Rice GrainRice Stem Contact PostureStatic Friction Coefficient of Rice Stem
10.3910.42
10.4010.37
10.3510.37
10.3310.38
10.3110.39
10.3010.34
20.3520.36
20.3420.36
20.3320.36
20.3120.35
20.2920.37
20.2920.33
The awn pointing away from or in the movement direction is represented by 1 and 2, respectively. The rice stem placed parallel or perpendicular to the moving direction is represented by 1 and 2, respectively.
Table 4. ANOVA results of the static friction coefficients of rice grains and stems.
PositionCategorySquare SumFree DegreeMean SquareFp
XStatic friction coefficient of rice grain0.00620.00314.1010.000
Static friction coefficient of rice stem0.00220.00125.1730.000
YStatic friction coefficient of rice grain0.00150.0000.3670.861
Static friction coefficient of rice stem0.00050.0000.2040.955
Table 5. Results of post hoc tests of the static friction coefficients of rice grains and stems.
SourceProjectXiXjDifference in Mean
(Xi–Xj)
Standard Errorp95% Confidence Interval
Lower LimitUpper Limit
BonferroniRice grainX1X2−0.014400.00810.540−0.03320.0104
X3−0.041560.00810.000−0.0635−0.0198
X2X10.011400.00810.540−0.01040.0332
X3−0.030250.00810.006−0.0521−0.0084
X3X1−0.041660.00810.0000.01980.0635
X2−0.030250.00810.0060.00840.0521
Rice stemX1X2−0.011520.003520.015−0.0210−0.0020
X3−0.024960.003520.000−0.0344−0.0155
X2X10.011520.003520.0150.00200.0210
X3−0.013430.003520.005−0.0299−0.0039
X3X10.024960.003520.0000.01550.0344
X20.013430.003520.0050.00390.0229
Table 6. ANOVA results for testing the effects of different configurations of the rice grains and stems on the static friction coefficient.
CategorySquare SumFree DegreeMean SquareFp
Rice grain0.00910.0092.4350.122
Rice stem0.01810.01831.5400.000
Table 7. ANOVA results of the effects of harvest time and temperature on the average static friction coefficients of rice grains and stems.
FactorDependent VariableSquare SumFree DegreeMean SquareFp
Harvest timeGrain static friction coefficient0.12920.06544.2350.000
Stem static friction coefficient0.01220.00623.2640.000
TemperatureGrain static friction coefficient0.08760.0155.9370.000
Stem static friction coefficient0.01460.0029.6130.000
Publisher’s Note: MDPI stays neutral with regard to jurisdictional claims in published maps and institutional affiliations.

