Article

Comparison of Methods to Select Candidates for High-Density Genotyping; Practical Observations in a Cattle Breeding Program

1
Davies Livestock Research Centre, School of Animal and Veterinary Sciences, University of Adelaide, Roseworthy, SA 5371, Australia
2
Robinson Research Institute, Adelaide Medical School, University of Adelaide, North Adelaide, SA 5006, Australia
3
3D Genetics Pty LTD, 939 Pukawidgi Rd, Bukkulla, NSW 2360, Australia
4
Popplewell Genetics, 33 Tom Schmidt Court, Mount Samson, QLD 4520, Australia
*
Author to whom correspondence should be addressed.
Agriculture 2022, 12(2), 276; https://doi.org/10.3390/agriculture12020276
Submission received: 19 January 2022 / Revised: 7 February 2022 / Accepted: 10 February 2022 / Published: 15 February 2022
(This article belongs to the Special Issue Application of Genetics and Genomics in Livestock Production)

Abstract

:
Imputation can be used to obtain a large number of high-density genotypes at the cost of procuring low-density panels. Accurate imputation requires a well-formed reference population of high-density genotypes to enable statistical inference. Five methods were compared using commercial Wagyu genotype data to identify individuals to produce a “well-formed” reference population. Two methods utilised a relationship matrix (MCG and MCA), two of which utilised a haplotype block library (AHAP2 and IWS), and the last selected high influential sires with greater than 10 progeny (PROG). The efficacy of the methods was assessed based on the total proportion of genetic variance accounted for and the number of haplotypes captured, as well as practical considerations in implementing these methods. Concordance was high between the MCG and MCA and between AHAP2 and IWS but was low between these groupings. PROG-selected animals were most similar to MCA. MCG accounted for the greatest proportion of genetic variance in the population (35%, while the other methods accounted for approximately 30%) and the greatest number of unique haplotypes when a frequency threshold was applied. MCG was also relatively simple to implement, although modifications need to be made to account for DNA availability when running over a whole population. Of the methods compared, MCG is the recommended starting point for an ongoing sequencing project.

1. Introduction

Genomic selection [1] has been rapidly adopted by many breeding sectors following its successful introduction to the dairy industry. This is due to realised gains in prediction accuracy of genomic estimated breeding values that have increased the response to selection for key economic traits as greater proportions of genetic variation are explained and generation intervals are decreased [2,3,4].
In genomic selection, a sufficiently dense single nucleotide polymorphism (SNP) panel that covers the entire genome is utilised with the expectation that all quantitative trait loci (QTL) are in linkage disequilibrium with at least one SNP. This allows the prediction of QTL effects across the population over generations. For traits with few underlying QTL, lower density SNP panels may be sufficient to capture these effects, assuming close proximity of at least one SNP. However, where there are many underlying QTL, denser SNP panels may be required [2]. This is often the requirement for many traits in cattle breeding, such as fertility, where no QTL of major effect has been found, unlike milk fat percentage in Dairy [5]. Denser SNP panels have been shown to increase breeding value accuracy [6,7]. If there are many QTL of minor effect contributing to variation in a desired trait, a large number of phenotypic records will be required to achieve reasonable estimation accuracies relative to trait heritability [8].
With the size of the reference population clearly having an impact on the accuracy of genomic prediction in the target population, there is a clear need to identify cost-effective methods to procure more phenotypes. One solution would be to capitalise on the large numbers of phenotypes available in commercial herds using genotyping to replace often incomplete/missing pedigree data. However, this solution would be accompanied by high genotyping costs, which usually only nucleus herds have means for.
In 2010, the Illumina BovineHD chip became available with 777,962 SNPs, and now whole-genome sequencing is the new frontier [9,10]. However, the high price of sequencing and HD chips is a barrier to their application across large numbers of animals. Imputation can add value here. By investing in a good reference population of dense genotypes, imputation can then utilise cheaper, less dense SNP panels, which reduces the overall cost of genotyping while capitalising on high-density results. Given this, the key question is which animals should be densely genotyped to form the best reference set for imputation of sparsely genotyped animals? An ideal approach would be to select founder animals of the population, but the availability of this option is limited depending on population age (are the founders still alive/have DNA stored, i.e., semen). A second approach would be to select influential animals with large numbers of effective progeny. However, this may bias certain high-performing family groups by selecting relatives from a few family lines.
This work details the results and observations of an actual field trial to select candidates that represent the Australian Wagyu population for whole-genome sequencing to facilitate imputation to sequence for BLUP prediction. Four methods have been compared to just selecting highly influential sires herein that were expected to achieve high imputation accuracy to higher density/sequence arrays [11,12]. Strategies were compared that fall under two categories; (1) strategies that utilise relationship matrix data already available in routine BLUP and GBLUP analyses, and (2) Strategies that take a more bioinformatics approach based on population haplotype frequency. Measures of how efficiently animals were selected and similarities between animals selected are discussed as well as practical implications.

2. Materials and Methods

In total, five methods were trialed and compared to identify candidates for whole-genome sequencing in an Australian Wagyu population. Assuming a sequencing budget of $100,000 and sequencing per animal costing $1000, 100 animals were selected from each method. The first two methods are denoted the MCA and MCG method, respectively [11]. Candidates are selected for whole-genome sequencing through these methods by minimising the genetic variation of the target population relative to the selected candidates, improving imputation accuracy. The MCA method utilises (Wrights) numerator relationship matrix (A) such that;
A11* = A11A12A22−1A21
where the 1 subscript denotes the set of target animals and 2 subscript denotes the set of animals selected to be sequenced. The diagonal elements of A11* are the residual variances that are expected to remain if sequence data were to be obtained from the selected individuals and used to predict/impute genotypes of the target set. Animals were selected using an iterative process which is described in full by [11]. Briefly, all animals start in the target set. The aim is to minimise trace (A11*), each animal is tested to see who reduces trace (A11*) the most, resulting in selected candidate i. After selecting animal i, the entire relationship matrix is made conditional on the genotype of that animal, then the process starts again, looking for the next animal that most reduces trace (A11*) until the desired number of candidates are selected. An Australian Full-Blood Wagyu pedigree comprised of 10,549 individuals with a depth of up to 9 generations from the current generation was utilised to construct A through the R package pedigreemm [13]. For the animals in the pedigree that were genotyped (see below), the average number of great-grandparents recorded in the pedigree was 7.3 with a median value of 8, indicating a high level of pedigree completeness.
The second method utilises a genomic relationship matrix (G) in place of A, denoted the MCG method. Utilising genotype information on 5334 individuals genotyped with 30 K GGP-LD (Neogen: GeneSeek Operations) or Bovine VersaSNP 50 K (Weatherbys Scientific) chips, G was constructed as per VanRaden’s first method [14]. Animals that were genotyped on the 50 K platform were imputed to 30 K using the 11,484 SNPs that overlapped between the chips. This decision was made due to the significantly larger reference population available on the 30 K chip (4940 vs. 394). Fimpute 2.2 [15] was used to perform the imputation. After, SNPs were kept that had a minor allele frequency greater than or equal to 0.05, retaining 21,094 SNPs for GRM construction. All genotyped animals were present in the pedigree resulting in an overlap of 5334 animals between the numerator (A) and genomic (G) relationship matrices.
The third and fourth methods were described by [12] and referred to as AHAP2 ([12] modified the AHAP method presented by [16]) and the inverse weight selection method (IWS). Both methods require the construction of a haplotype “block” library. This library was constructed utilising the 5334 post imputation genotypes to construct G, using FindHap v3 (http://aipl.arsusda.gov/software/findhap/; accessed on 21 May 2020). Program settings included 4 iterations at 3 haplotype block widths (50, 75 and 100 SNPs). Only the 100 SNP wide blocks were retained for analysis. Haplotype blocks, which by definition are non-overlapping, were assigned a unique ID and their frequency in the dataset was calculated. It was assumed that haplotype frequencies in this population are reflective of the Australian Wagyu industry. In total, 339,824 unique haplotypes were identified with a mean haplotype frequency of 0.07% and a minimum and maximum haplotype frequency of 0.005 and 0.28%, respectively.
The distribution of haplotype frequencies on the log scale (Figure 1) clearly indicated a skewed distribution towards lower frequencies. Due to exponential increases in haplotype counts at lower frequencies, haplotypes with a frequency lower than 0.1% were excluded from consideration. This brought the total number of haplotypes under consideration for sampling down to 20,854 of which 588 had a haplotype frequency ≤5% (Common), 3666 had a frequency ≥1% but <5% (Uncommon) and 16,600 had a haplotype frequency ≥0.1% but <1% (Rare). A haplotype frequency threshold of 0.1% was chosen to allow for 1 in 1000 error in genotype calls.
Both the AHAP2 and IWS methods were designed to maximise the haplotype coverage from the population while minimising the redundancy of haplotype sampling. Both methods choose candidates to maximise the number of haplotypes sampled per dollar invested in sequencing, achieved through a weighting system, however, two separate approaches are used to achieve this.
The AHAP2 method, which is an iterative modification on the AHAP method described by [16], utilises the following equation;
Sample   weight = i = 1 N H A P f i       if   i = homozygous .
The frequency of the haplotype in the population is defined by f i as determined by FindHap, and NHAP is the total number of haplotypes under consideration. Only haplotypes that are homozygous within a potential candidate are counted towards the weighting for selection. All individuals in the imputed genotype set were considered as potential candidates. After calculating the weight for all individuals, the individual with the highest weighting is selected as the sequencing priority. Once a candidate is chosen, all homozygous haplotypes that this candidate contained are removed from consideration for all remaining samples. Sample weights are then recalculated and the next sequencing candidate is selected until the desired number of candidates (n = 100) are sampled.
In reverse to the AHAP2 method, the IWS method preferentially selects candidates that carry rare frequency haplotypes. Ref. [12] developed an inverted parabolic function that calculated sequencing priority (weighting) under the following equation;
Sample   weight = i = 1 N H A P f i 2 2 f i + 1       if   i = homozygous .
As f i approaches 0, the haplotypes score approaches 1, increasing the weighting. More frequent haplotypes give an increasingly smaller weighting to the sample.
The final method is a more traditional approach that selects animals based on influence in pedigree. This was to assess a previous attempt to genotype animals that “describe” the population. Previously, 166 Full-Blood Wagyu animals were genotyped on the Illumina 770 K platform. These animals were selected as influential due to having greater than 10 progeny nationwide (PROG), with effective progeny numbers of 1 to 437, mean = 47, in the pedigreed population described herein. One hundred of the 166 animals were randomly chosen for comparison against the other methods were appropriate.

3. Results

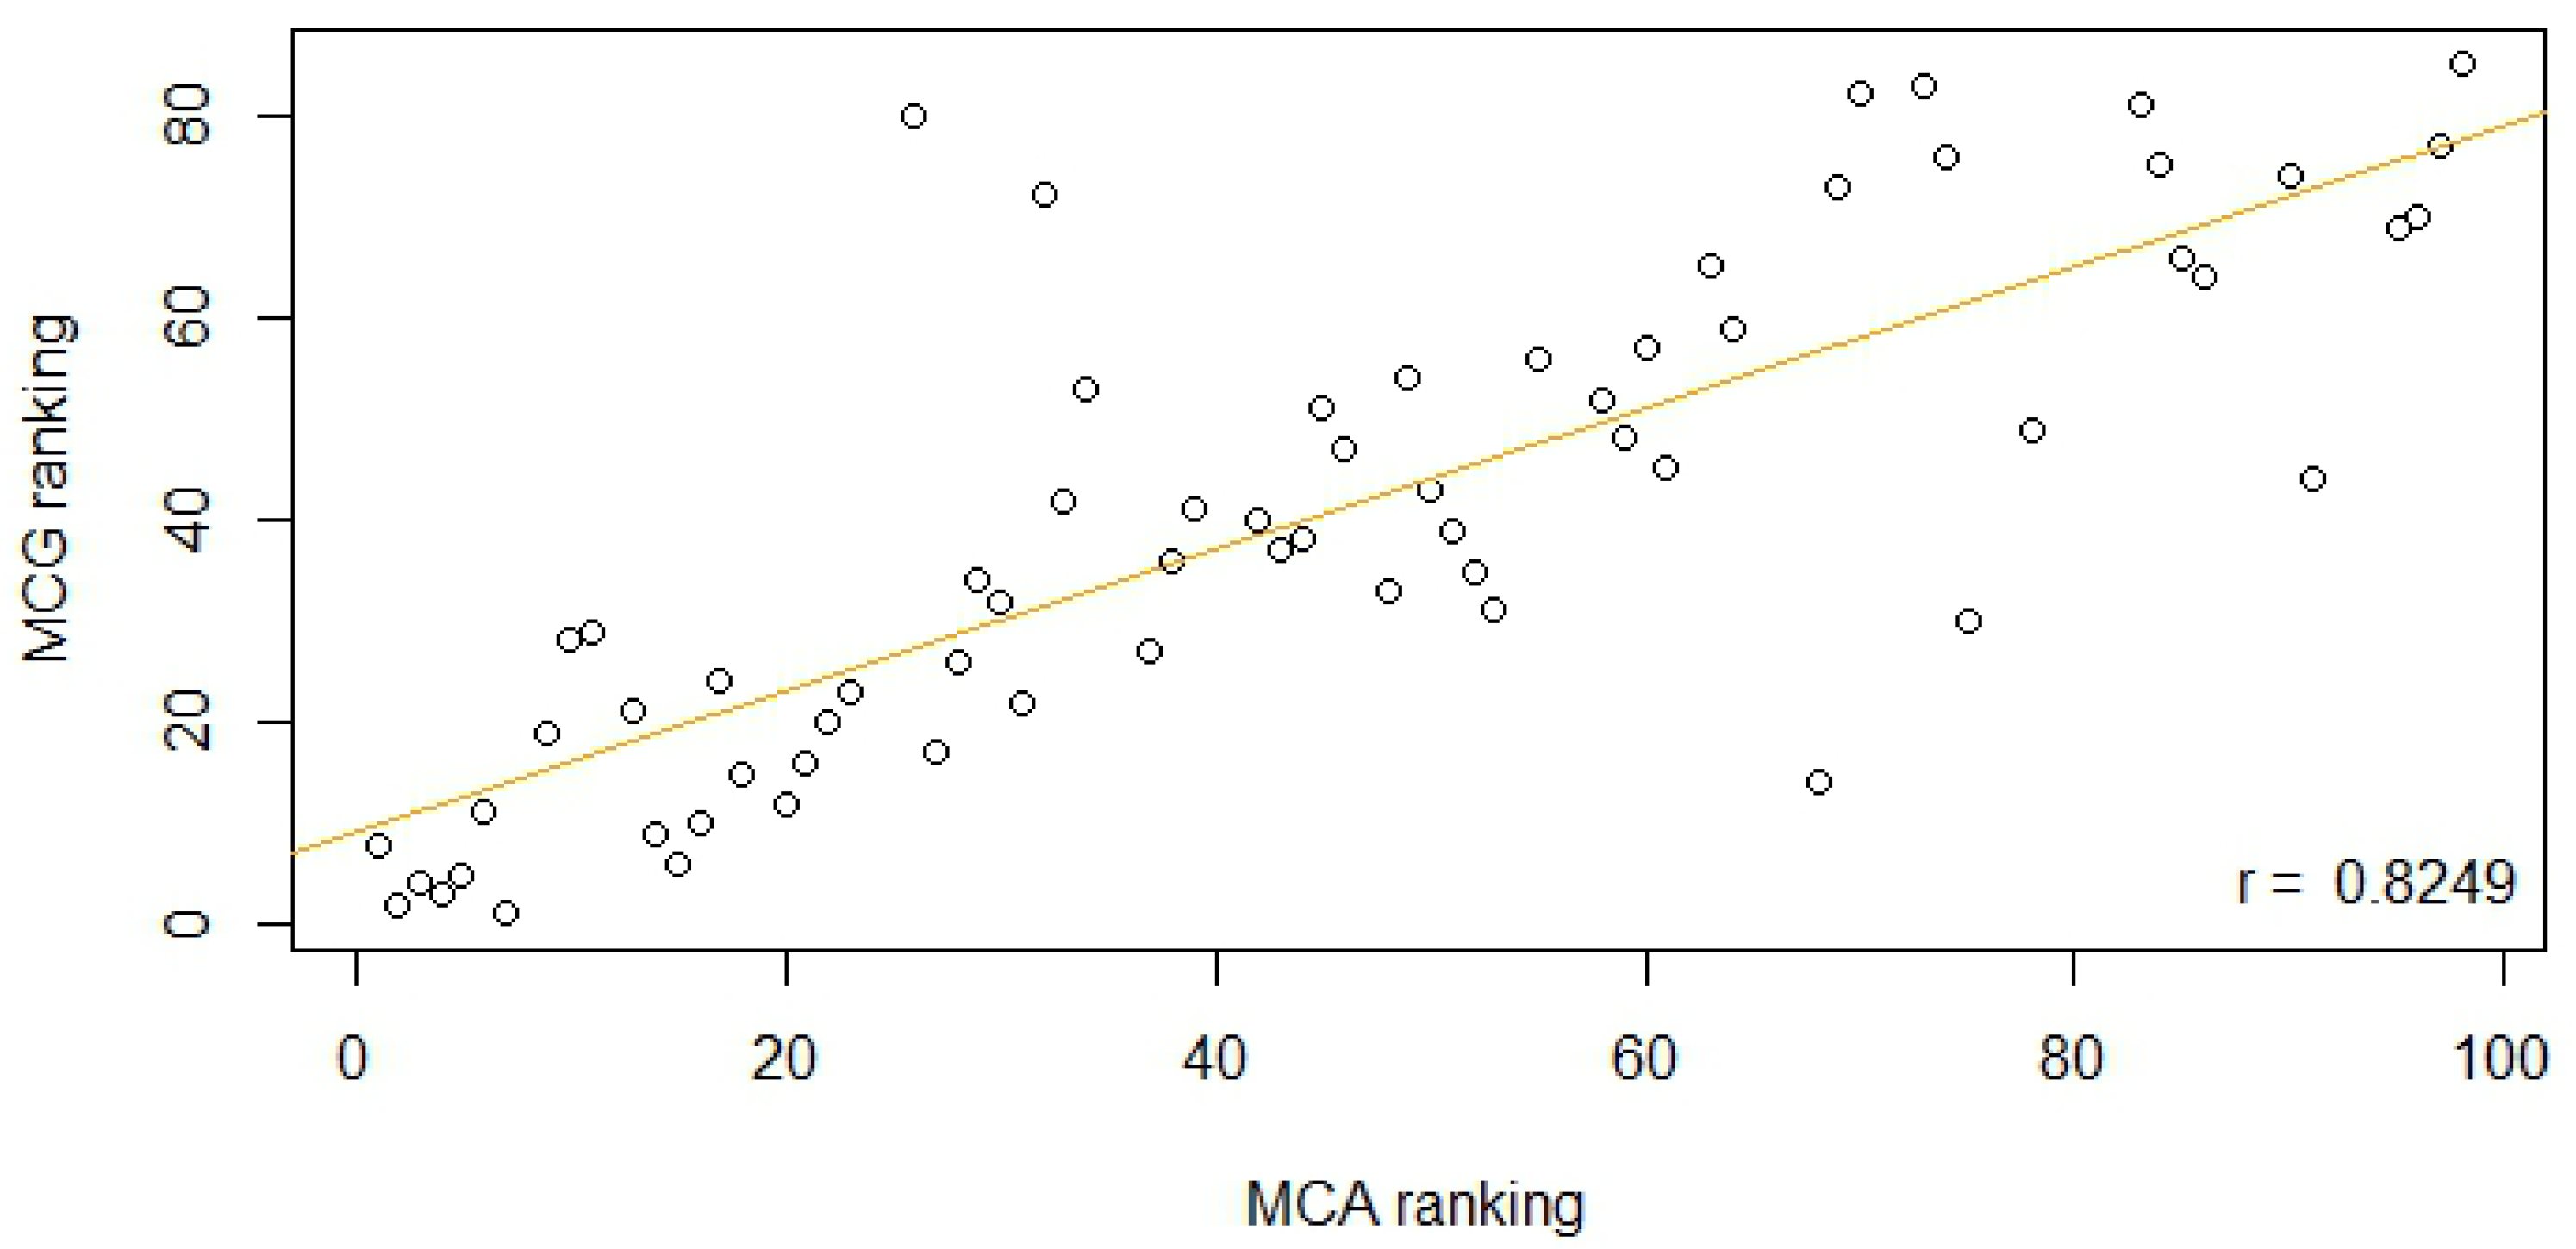
3.1. Overlap between Chosen Candidates

The MCA and MCG methods had a high degree of similarity between them, with MCA selecting 70/100 individuals (Table 1) that were selected by MCG. A strong positive rank correlation of 0.82 (Figure 2) demonstrates high-rank concordance between the animals selected in common between the two methods. As MCA contains animals that are not available in MCG, a modified version of the MCA method was run (data not shown) where only the 5334 genotyped animals could be chosen but still relative to the whole pedigreed population, i.e., genotyped animals were selected based on their relationship to all animals in the pedigree. This produced similar results, with 73 animals being selected in common between MCA modified and MCG.
There was little overlap between the relationship matrices’ methods and the haplotype methods AHAP2 and IWS (Table 1). For example, the specific animals themselves selected by IWS are all progeny or grand-progeny of those selected by MCG and/or MCA. There was a moderate similarity between animals selected by IWS and AHAP2. Differences are due to different emphasis weights on rare versus common haplotypes. It is important to reiterate that all methods used the same starting population of 5334 genotyped animals where appropriate (i.e., MCA utilised a much bigger pedigreed population). Additionally, all genotyped animals were in the pedigree.
The animals selected by these four methods were then compared to the full list of 166 animals genotyped on 770 K due to being identified as influential sires (PROG). The MCA and MCG methods are most similar, in regards to animals selected, to this influential sire methodology, with an overlap of 80 and 78 animals, respectively (Table 1). As expected, this resulted in a lower overlap with IWS and AHAP2 methods.

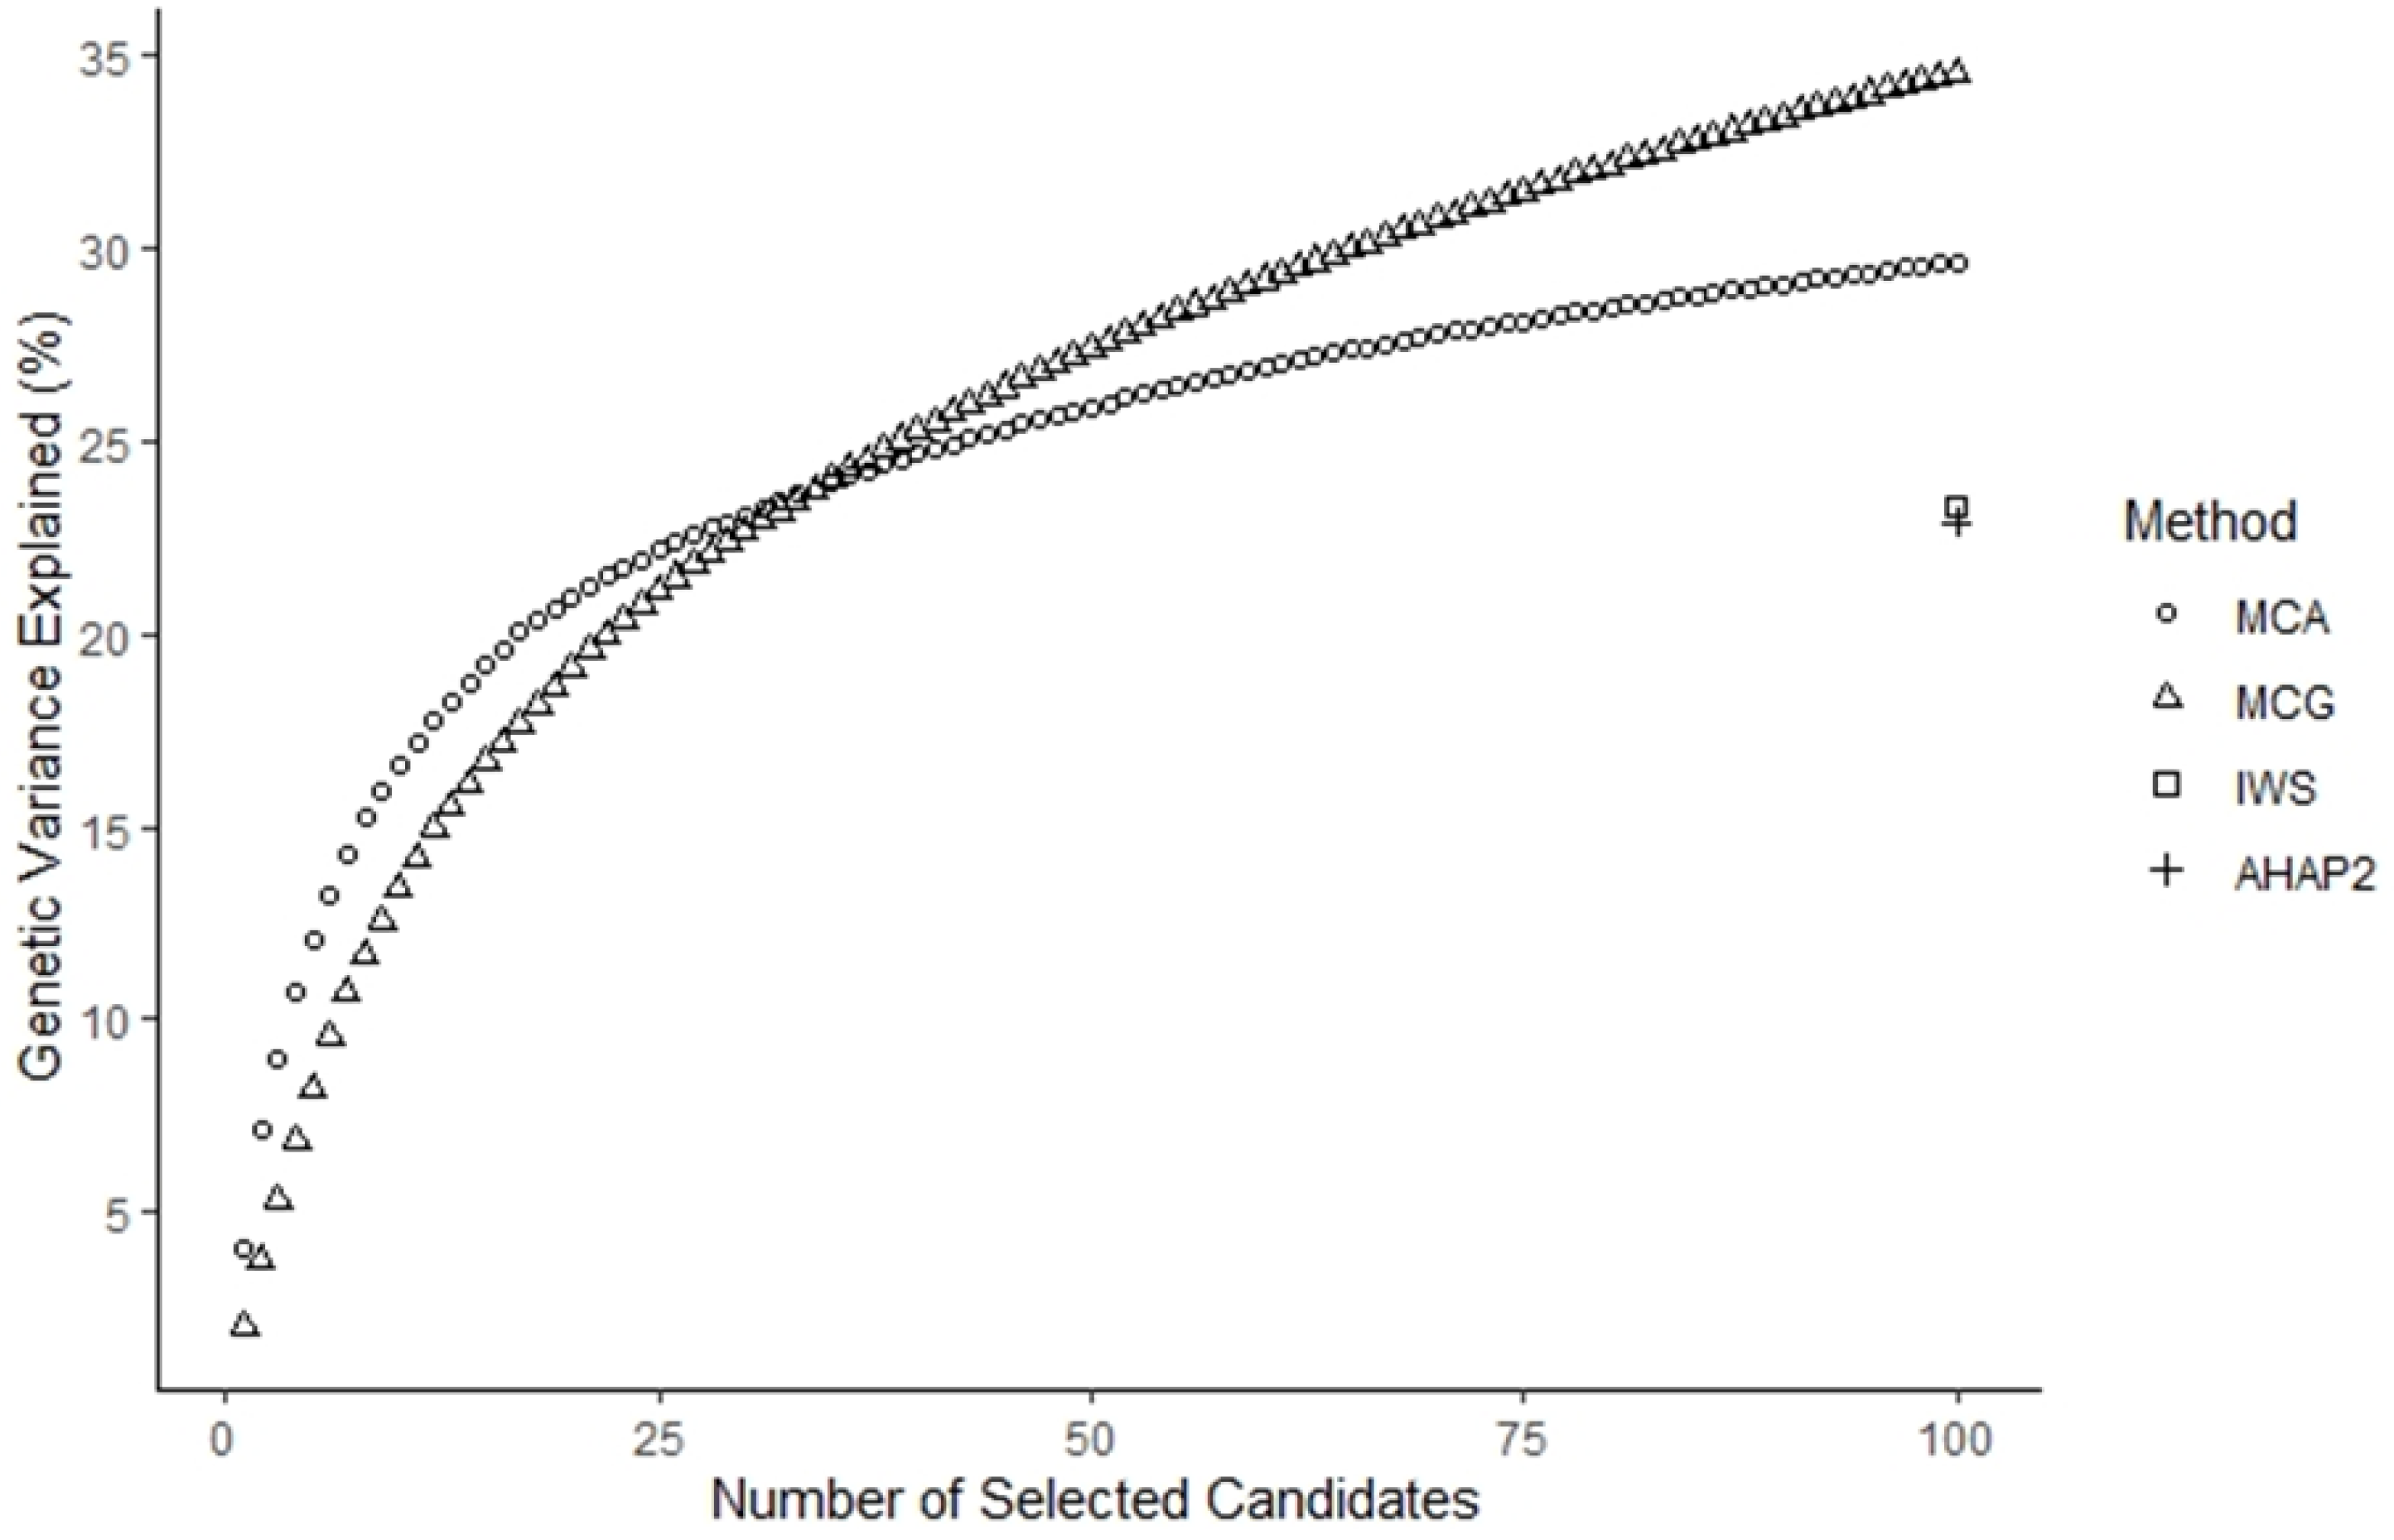
3.2. Percentage of Genetic Variance Explained

The MCG method accounted for more genetic variance (34.6%) when 100 animals were selected compared to 30% when the MCA method was used. The first 20 selected candidates accounted for 19 and 21% of the genetic variance for the MCG and MCA method, respectively, with each additional animal thereafter contributing less information (Figure 3). Where the number of selected candidates was low, MCA outperformed the MCG method until approximately 30 candidates where MCG became superior. IWS was superior to AHAP2, accounting for 23.3% of the genetic variance compared to 22.9% when selecting 100 candidates, although both methods accounted for significantly less genetic variance compared to methods utilising a relationship matrix. For PROG, the mean percentage of genetic variance accounted for when randomly sampling 100 of the most influential sires for 5 replicates was 29.6% (SD = 0.40, data not shown), equivalent to the MCA method. MCA modified, where only genotyped animals are available for selection relative to the whole pedigree, account for 29.3% of the genetic variance, giving very similar results to MCA.

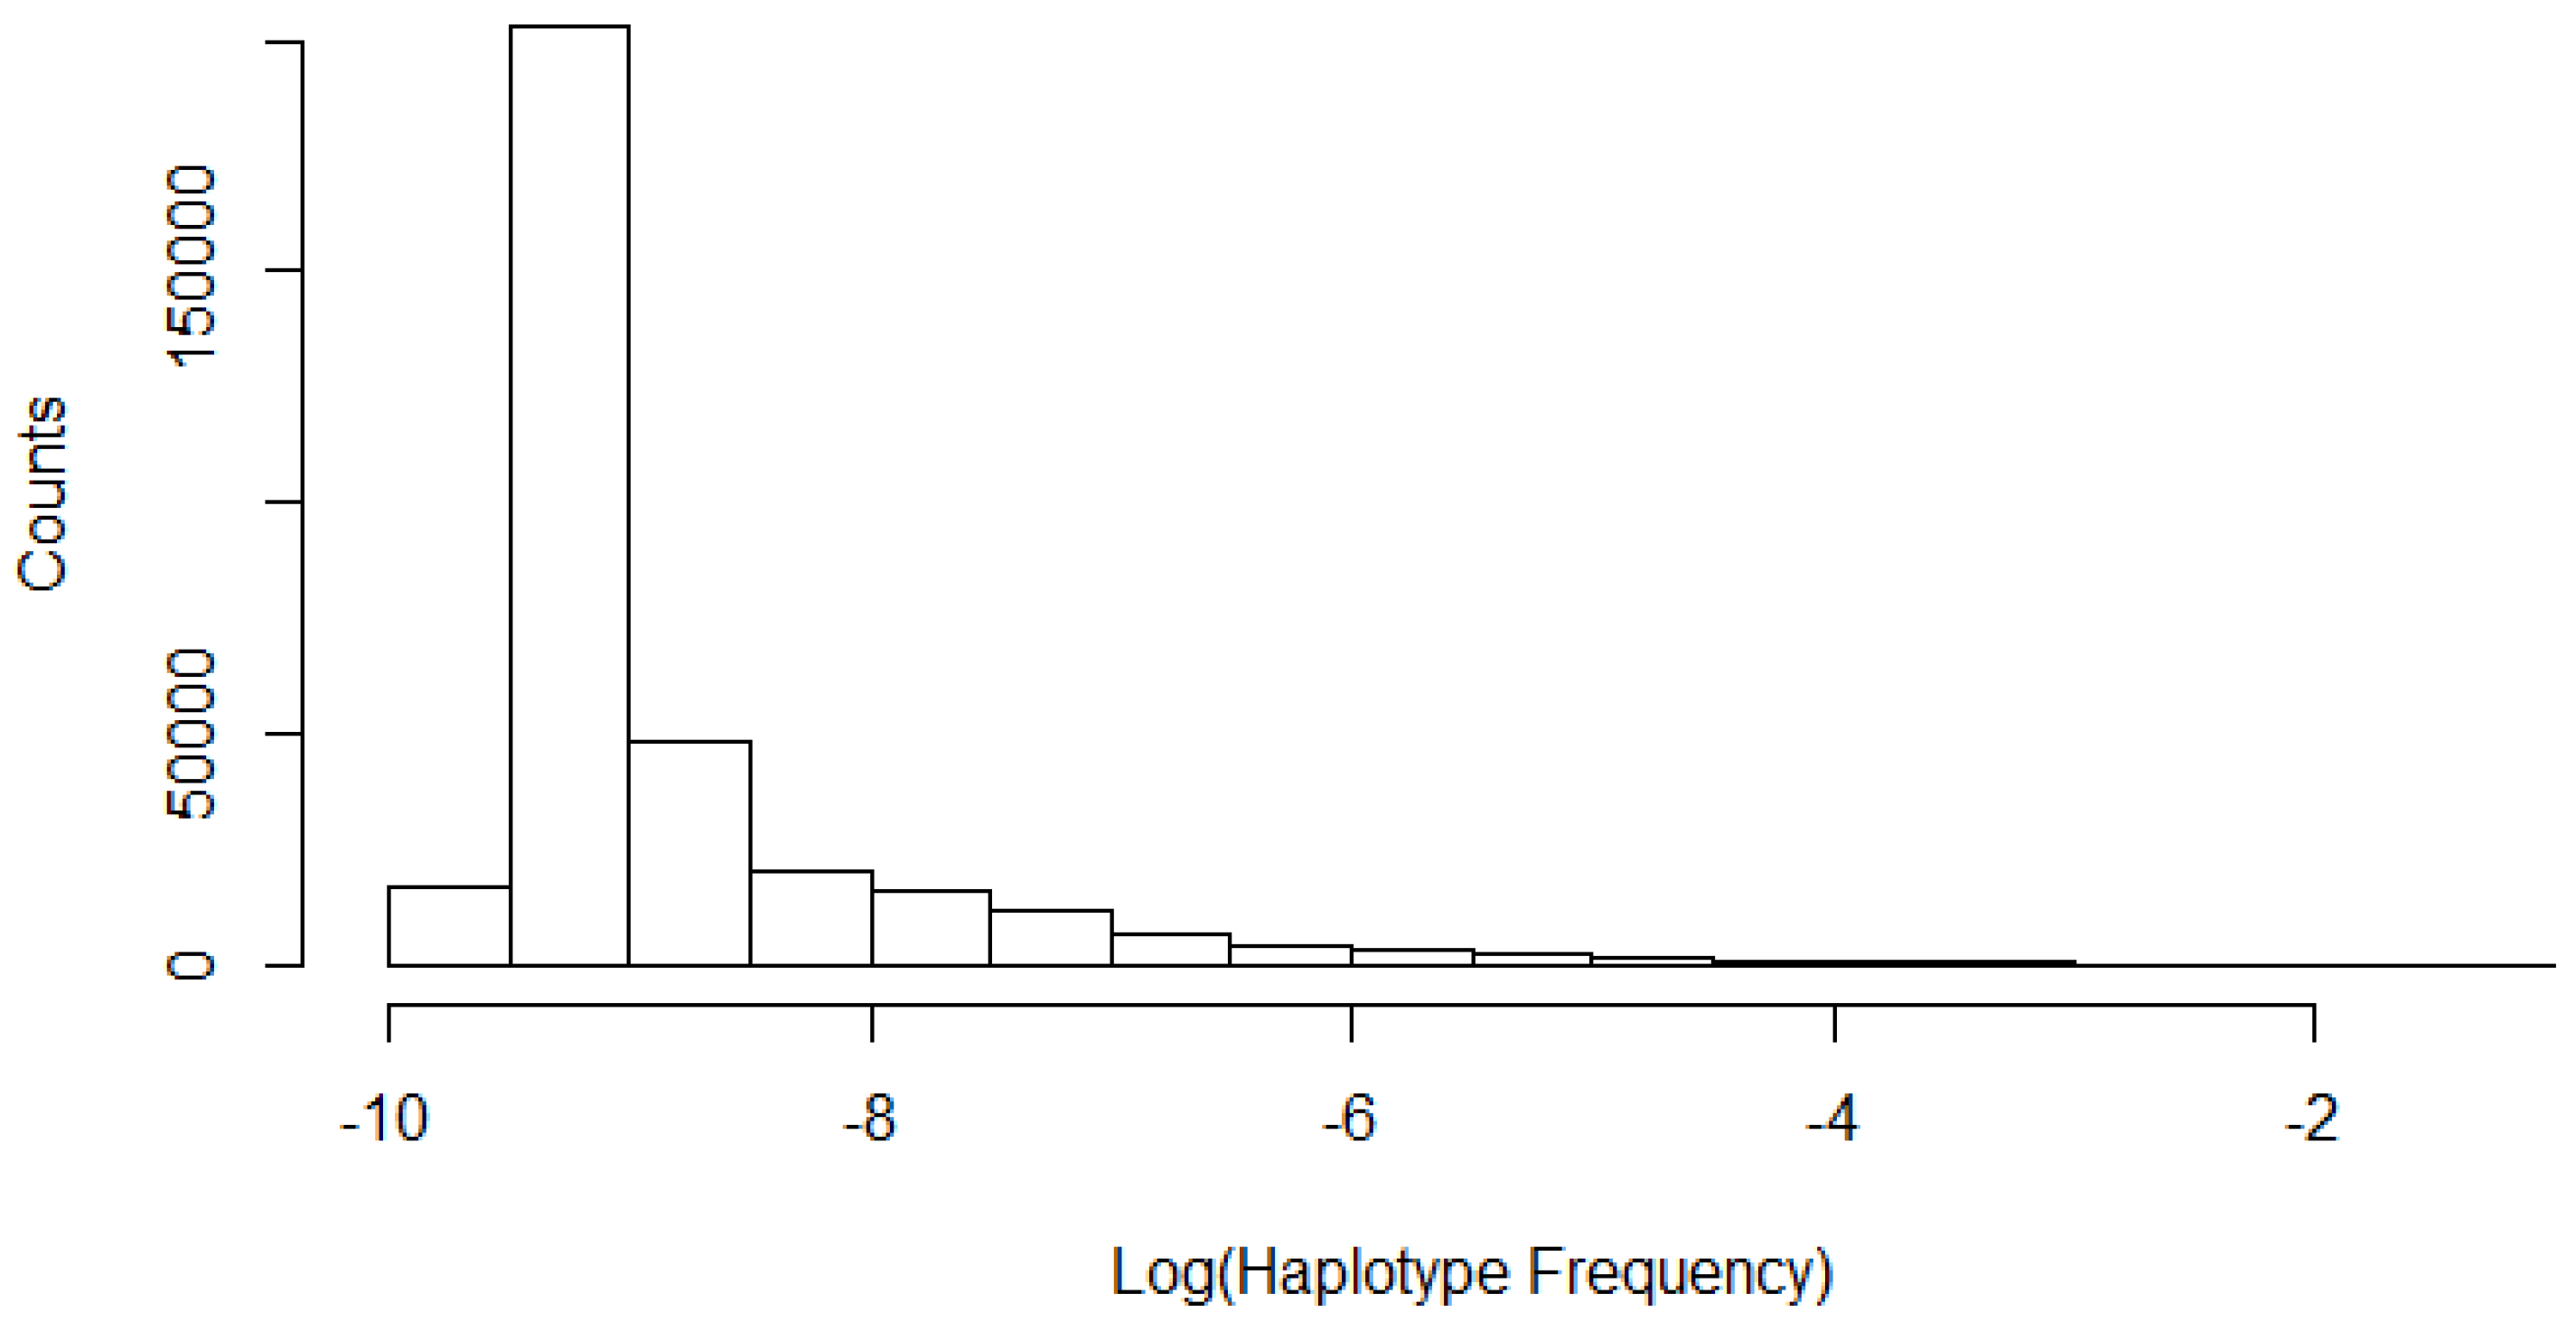
3.3. Number of Unique Haplotypes Accounted for

Haplotype blocks were categorised into common, uncommon and rare classifications based on frequency in the population. The number of haplotypes accounted for within each group was then assessed for three methods (Table 2). All methods were able to account for the 588 unique common haplotypes in the population and a similar number of uncommon haplotypes; approximately 3500 haplotypes out of the 3666 in the population. The three methods begin to clearly separate where rare haplotypes are considered. MCG accounted for 8175 rare haplotypes followed by IWS and AHAP2 with 6492 and 5137, respectively. This resulted in MCG accounting for the highest total number of haplotypes (12,320) compared to IWS and AHAP2.

4. Discussion

4.1. Comparison of Relationship Matrix Methods

The methods which utilised a relationship matrix, MCA and MCG, had very high concordance between them in regard to specific candidates selected (Table 1). The rank correlation reported of 0.82 (Figure 2) is a stronger relationship than previously reported [11]. One explanation is that Wagyu are known to already have a very small effective population size; 43.4 in Australia [17], with only a small number of animals serving as the founder population for Australia’s herd today. Given this, the MCG and MCA method are more likely to select identical candidates than the population in the original study, which was a Norwegian pig population pedigree with simulated genotype data [11].
MCA performed better where the number of selected candidates was low (Figure 3). This is likely due to the MCA method having access to the full pedigree of 10,549 individuals with a depth of up to 9 generations, whereas only 5334 of these animals were available for selection under MCG. There are some population structure implications in the data behind this. The pedigree includes deeper information on original “imported” founder animals in the population and a larger number of descendants, whereas MCG only includes genotypes on these founders and a subset of their descendants. The additional depth and breadth of pedigree appears advantageous to better inform selection decisions of early selected candidates. MCG appeared robust as the genomic relationships were able to compensate for the lack of pedigree depth after a certain number of selected candidates due to more detailed relationship information regarding Mendelian sampling. When only the genotyped animals could be selected as candidates (MCA modified), it performed extremely similarly to MCA on a whole. This supports the conclusion that the pedigree used in constructing A is not adding any information above and beyond what G captures. MCG also demonstrates a steady increase in genetic variance accounted for as the number of candidates approaches 100 whereas MCA begins to level off. This can again be attributed to more variation being able to be discerned through genomic relationships, which can better describe animals, particularly where relationships would be traditionally low (zero) in A and between full-sibs. MCG is also advantageous to MCA in that it can be run without concern for completeness of pedigree, assuming individuals in the population under consideration can be genotyped.

4.2. Comparison of Haplotype Block Methods

The methods which utilised 100 SNP wide haplotype blocks, IWS and AHAP2, had moderate concordance between the animals selected with 61/100 animals in common. In contrast, concordance between these methods and candidates selected by MCA and MCG was poor (Table 1). An analysis of the pedigree reveals the specific animals themselves selected by IWS, in particular, are all progeny or grand-progeny of those selected by MCG/MCA. This makes sense as only homozygous haplotypes are considered in the calculation of the weighting. Influential haplotypes being targeted (those accounted for by MCA/MCG) must be passed on across generations through paternal and maternal lines to be selected by IWS, and to a lesser degree, the AHAP2 method.
While MCG accounted for the greatest number of haplotypes with a frequency of 0.1% or greater (12,320, Table 2), it did not account for the greatest number of haplotypes overall when counting haplotypes below this frequency. Candidates selected using the cut-off restrictions were compared to the unrestricted raw data to get a view of the incidental rare haplotypes that were sampled in passing. IWS, AHAP2 and MCG accounted for an additional 9842, 7221 and 2631 haplotypes respectively below a frequency of 0.1% resulting in grand-totals of 20,429, 16,470 and 14,951 haplotypes sampled out of 339,824 respectively. Given this metric, IWS was the best where total number of haplotypes are concerned. Results from [12] are consistent with those above, with IWS demonstrating it accounted for the greatest number of haplotypes while selecting the least number of candidates compared to AHAP2. Additionally, given a set number of candidates, IWS accounted for more haplotypes than AHAP2, which is a more comparable metric to the study herein.
A study on simulated dairy data performed by [18] demonstrated similar findings to the study herein, with IWS accounting for a greater proportion of unique haplotypes (when all incidental haplotypes are included) than a method analogous to MCG. In addition, the overlap of selected candidates was very low between these methods across varying selection densities (50 to 1200 individuals). However, IWS did not outperform MCG in terms of genetic variance accounted for (Figure 3). Initial thoughts in this study were that the more haplotypes accounted for, the greater the degree of genetic variance explained, but Figure 3 demonstrates that is clearly not the case. There could be a couple of explanations for this.
The IWS method is intentionally selecting animals that are more distantly related to others by preferentially selecting rare haplotypes. Animals that are homozygous for a rare haplotype had to receive one copy from each of the paternal and maternal lines, which to occur suggests the paternal and maternal lines were already likely related, i.e., IWS selects animals from the ends of different family branches rather than the bulk of the whole family tree. Additionally, given the haplotype blocks used aren’t representative of “actual” haplotypes segregating in the population, they are merely chunks of SNPs in 100 SNP wide blocks; selection of individuals where these true haplotypes are essentially broken up could explain a loss in genetic variance accounted for. In contrast, the GRM utilises all SNPs and it can capture the similarity of true haplotypes between individuals in its estimation of relationships. Implementing the IWS and AHAP2 methods utilising a true haplotype library warrants further investigation.
Another point for consideration is that, while it could be expected that more haplotypes in the reference would yield higher imputation accuracies, IWS preferentially selected haplotypes with a low frequency. Ref. [19] demonstrated using initial data from the 1000 bulls genome project that the accuracy of imputed calls was high for SNPs with a MAF > 0.1 while it decreased rapidly for rarer variant sites. Ref. [18] demonstrated this nicely, showing imputation accuracy of specific variants increases with MAF bin. Additionally, [18] showed that reference populations selected by IWS were more effective at achieving high imputation accuracies for low MAF SNPs than other methods compared, but this advantage lessened with increasing reference population size.
As high-density genotyping and sequencing costs decrease, it would be more feasible to target lower frequency haplotypes by sequencing additional candidates to improve their accuracy of imputation. Methods, such as those proposed by [20,21] that allocate sequencing resources to specific haplotypes rather than individuals, would be suitable for this purpose, in fact, they propose an adjustment to IWS to allow for this. The benefit of the method proposed by [21] is that it assembles high-coverage sequence data through the accumulation of low coverage information over genome segments that are shared with many other individuals. This prevents these “census” haplotypes from being “over-sequenced” so that sequencing resources can then be allocated towards key-rare variants, for example. This method has been shown to achieve high imputation accuracies through hybrid peeling in deep pedigreed populations [22].

4.3. Practical Considerations

While the haplotype block methods appeared promising, their performance was inferior to relationship matrix-based methods given the metrics measured herein. One-hundred animals selected under MCG accounted for the most genetic variance and accounted for the greatest number of haplotypes (above a frequency of 0.1%). One key assumption was made here; both the MCA and MCG methods assumed that all potential candidates had DNA readily available. This is not always the case in a commercial pedigree. Both methods could easily be modified to account for DNA availability, i.e., the animal is still alive or has blood/semen/hair in storage. The animal that is selected, within an iteration, is logically that which reduces the residual genetic variance of the target population, i.e., Diag(A11*), the most. Multiplying each candidate’s impact on the residual by a vector of 0 (no DNA available) or 1 (DNA available) ensures only candidates with DNA are chosen. This also prevents bias when selecting sequence candidates to form the reference if you were just to remove animals with no DNA from the analysis altogether. MCA clearly outperformed MCG where the number of samples selected was low and this could reflect a scenario where the sequencing budget is low. A strong depth of pedigree proved advantageous to the GRM, where the number of selected candidates is low. To capitalise on the depth of pedigree while utilising the detail of genomic relationships, an H matrix could be constructed, as is done for single-step GBLUP [23,24] with parameters set around DNA availability. Similar modifications could be made to the haplotype methods to account for DNA availability, though it is more likely that only potential candidates are included when running these methods. An important consideration is that MCA assumes a relatively high pedigree completeness to be effective. Naturally, animals not included in the pedigree cannot their genetic contribution to the population identified. Where pedigree is widely incomplete, the MCG method would be best using genomic relationships to replace those estimated from pedigree.
The relationship matrix methods also have one key advantage over haplotype methods when being applied within a breeding program. That is, they utilise data that is routinely constructed within a genetic evaluation program and are therefore simple and relatively quick to implement. This is compared to constructing haplotype libraries where cut-off decisions around haplotype inclusion must be made. This decision can impact the final animals that are selected for HD genotyping or sequencing. For example, the cut-off used for IWS by [12] was 4%, whereas it was 0.1% herein. In addition, the examples provided in this discussion assume selection within one population of animals and do not deeply discuss implications of across breed or crossbred populations.
The common method of selecting highly influential sires (PROG) performed equally as well as the MCA method and is clearly still a useful, cheap and easy method to select animals for high density genotyping. However, clear pitfalls of the method are that highly influential bulls tend to have highly influential sons and so on. While not explicitly outlined herein, immediate family links (siblings, progeny) do exist between the 166 influential animals, and this is only partially captured in Table 1 due to a lack of complete overlap between the methods. It is, therefore, necessary to adjust for kinship, genetic contribution, etc. Whether this is done ad hoc or using more scientific methods as in [11], this added complexity detracts from its usefulness, especially as the other four methods compared herein actively remove this laborious activity.

5. Conclusions

Selection using the MCG is highly recommended as a starting point for an ongoing sequencing project. Then the best method depends on the use case for the future set of sequences. If the aim is to select sequence candidates to allow for the overall imputation of the population, then it is better to select animals carrying common haplotypes in the first instance. If the resulting sequences from the selected animals are to be used for variant discovery or annotation of deleterious variants, animals carrying novel information should be selected.

Author Contributions

Conceptualisation, R.A.M., G.P., J.G. and W.S.P.; methodology, R.A.M., G.P. and R.T.; software, R.A.M. and R.T.; validation, R.A.M.; formal analysis, R.A.M.; investigation, R.A.M.; resources, W.S.P.; data curation, R.T.; writing—original draft preparation, R.A.M.; writing—review and editing, R.A.M., M.L.H., H.O. and W.S.P.; visualisation, R.A.M.; supervision, M.L.H., H.O. and W.S.P.; project administration, W.S.P.; funding acquisition, R.A.M. and W.S.P. All authors have read and agreed to the published version of the manuscript work reported.

Funding

R.A.M. was supported by scholarships from the Australian Government Research Training Program Scholarship and 3D Genetics.

Institutional Review Board Statement

Not Applicable.

Informed Consent Statement

Not Applicable.

Data Availability Statement

Restrictions apply to the availability of these data. Data were obtained from 3D Genetics Pty Ltd. and are available with the permission of J.G.

Conflicts of Interest

The authors declare no conflict of interest.

References

  1. Meuwissen, T.H.E.; Hayes, B.J.; Goddard, M.E. Prediction of total genetic value using genome-wide dense marker maps. Genetics 2001, 157, 1819–1829. [Google Scholar] [CrossRef]
  2. Hayes, B.J.; Bowman, P.J.; Chamberlain, A.; Goddard, M. Invited review: Genomic selection in dairy cattle: Progress and challenges. J. Dairy Sci. 2009, 92, 433–443. [Google Scholar] [CrossRef] [Green Version]
  3. García-Ruiz, A.; Cole, J.B.; VanRaden, P.M.; Wiggans, G.R.; Ruiz-López, F.J.; Van Tassell, C.P. Changes in genetic selection differentials and generation intervals in US Holstein dairy cattle as a result of genomic selection. Proc. Natl. Acad. Sci. USA 2016, 113, E3995–E4004. [Google Scholar] [CrossRef] [PubMed] [Green Version]
  4. Lee, Y.M.; Dang, C.G.; Alam, M.Z.; Kim, Y.S.; Cho, K.H.; Park, K.D.; Kim, J.J. The effectiveness of genomic selection for milk production traits of Holstein dairy cattle. Asian-Australas. J. Anim. Sci. 2020, 33, 382–389. [Google Scholar] [CrossRef] [PubMed] [Green Version]
  5. Grisart, B.; Coppieters, W.; Farnir, F.; Karim, L.; Ford, C.; Berzi, P.; Cambisano, N.; Mni, M.; Reid, S.; Simon, P. Positional candidate cloning of a QTL in dairy cattle: Identification of a missense mutation in the bovine DGAT1 gene with major effect on milk yield and composition. Genome Res. 2002, 12, 222–231. [Google Scholar] [CrossRef] [PubMed] [Green Version]
  6. Khatkar, M.S.; Moser, G.; Hayes, B.J.; Raadsma, H.W. Strategies and utility of imputed SNP genotypes for genomic analysis in dairy cattle. BMC Genom. 2012, 13, 538. [Google Scholar] [CrossRef] [PubMed] [Green Version]
  7. Ogawa, S.; Matsuda, H.; Taniguchi, Y.; Watanabe, T.; Kitamura, Y.; Tabuchi, I.; Sugimoto, Y.; Iwaisaki, H. Genomic prediction for carcass traits in Japanese Black cattle using single nucleotide polymorphism markers of different densities. Anim. Prod. Sci. 2017, 57, 1631–1636. [Google Scholar] [CrossRef]
  8. Goddard, M. Genomic selection: Prediction of accuracy and maximisation of long term response. Genetica 2009, 136, 245–257. [Google Scholar] [CrossRef]
  9. Georges, M. Towards sequence-based genomic selection of cattle. Nat. Genet. 2009, 46, 807. [Google Scholar] [CrossRef] [PubMed]
  10. VanRaden, P.M.; Tooker, M.E.; O’connell, J.R.; Cole, J.B.; Bickhart, D.M. Selecting sequence variants to improve genomic predictions for dairy cattle. Genet. Sel. Evol. 2017, 49, 32. [Google Scholar] [CrossRef] [Green Version]
  11. Yu, X.; Woolliams, J.A.; Meuwissen, T.H. Prioritizing animals for dense genotyping in order to impute missing genotypes of sparsely genotyped animals. Genet. Sel. Evol. 2014, 46, 46. [Google Scholar] [CrossRef] [PubMed] [Green Version]
  12. Bickhart, D.; Hutchison, J.; Null, D.; VanRaden, P.; Cole, J. Reducing animal sequencing redundancy by preferentially selecting animals with low-frequency haplotypes. J. Dairy Sci. 2016, 99, 5526–5534. [Google Scholar] [CrossRef] [PubMed]
  13. Bates, D.; Vazquez, A.I. Pedigreemm: Pedigree-Based Mixed-Effects Models. R Package Version 0.0-3. Available online: https://CRAN.R-project.org/package=pedigreemm (accessed on 2 March 2021).
  14. VanRaden, P.M. Efficient methods to compute genomic predictions. J. Dairy Sci. 2008, 91, 4414–4423. [Google Scholar] [CrossRef] [Green Version]
  15. Sargolzaei, M.; Chesnais, J.; Schenkel, F. FImpute-An efficient imputation algorithm for dairy cattle populations. J. Dairy Sci. 2011, 94, 421. [Google Scholar]
  16. Druet, T.; Macleod, I.; Hayes, B. Toward genomic prediction from whole-genome sequence data: Impact of sequencing design on genotype imputation and accuracy of predictions. Heredity 2014, 112, 39–47. [Google Scholar] [CrossRef] [PubMed] [Green Version]
  17. Zhang, Y.D.; Banks, R. Genetic diversity and trends of Australian Japanese Black cattle. Proc. Assoc. Adv. Anim. Breed. Genet. 2021, 24, 451–454. [Google Scholar]
  18. Butty, A.M.; Sargolzaei, M.; Miglior, F.; Stothard, P.; Schenkel, F.S.; Gredler-Grandl, B.; Baes, C.F. Optimizing selection of the reference population for genotype imputation from array to sequence variants. Front. Genet. 2019, 10, 510. [Google Scholar] [CrossRef]
  19. Daetwyler, H.D.; Capitan, A.; Pausch, H.; Stothard, P.; Van Binsbergen, R.; Brøndum, R.F.; Liao, X.; Djari, A.; Rodriguez, S.C.; Grohs, C. Whole-genome sequencing of 234 bulls facilitates mapping of monogenic and complex traits in cattle. Nat. Genet. 2014, 46, 858. [Google Scholar] [CrossRef]
  20. Gonen, S.; Ros-Freixedes, R.; Battagin, M.; Gorjanc, G.; Hickey, J.M. A method for the allocation of sequencing resources in genotyped livestock populations. Genet. Sel. Evol. 2017, 49, 47. [Google Scholar] [CrossRef] [Green Version]
  21. Ros-Freixedes, R.; Gonen, S.; Gorjanc, G.; Hickey, J.M. A method for allocating low-coverage sequencing resources by targeting haplotypes rather than individuals. Genet. Sel. Evol. 2017, 49, 78. [Google Scholar] [CrossRef] [Green Version]
  22. Ros-Freixedes, R.; Whalen, A.; Gorjanc, G.; Mileham, A.J.; Hickey, J.M. Evaluation of sequencing strategies for whole-genome imputation with hybrid peeling. Genet. Sel. Evol. 2020, 52, 18. [Google Scholar] [CrossRef] [PubMed] [Green Version]
  23. Legarra, A.; Aguilar, I.; Misztal, I. A relationship matrix including full pedigree and genomic information. J. Dairy Sci. 2009, 92, 4656–4663. [Google Scholar] [CrossRef] [PubMed] [Green Version]
  24. Christensen, O.F.; Lund, M.S. Genomic prediction when some animals are not genotyped. Genet. Sel. Evol. 2010, 42, 2. [Google Scholar] [CrossRef] [PubMed] [Green Version]
Figure 1. Distribution of haplotype block frequency (log scale) of 339,824 blocks, 100 SNPs in width, estimated from a population of 5334 genotyped Australian Wagyu.
Agriculture 12 00276 g001
Figure 2. A plot of ranks of candidates selected for whole-genome sequencing using the MCA or MCG methods, respectively.
Agriculture 12 00276 g002
Figure 3. Diagonal values of A* representing the percentage of genetic variance explained for each additional selected candidate for whole-genome sequencing using the MCG method (top) or MCA method (bottom). The IWS and AHAP2 methods are presented as singular dots where 100 animals have been sampled.
Agriculture 12 00276 g003
Table 1. The degree of overlap, i.e., the number of animals selected in common, between the MCA, MCG, IWS, AHAP2, and PROG A methods. The number of animals sampled by each method is displayed on the diagonal.
MCAMCGIWSAHAP2PROG
MCA100
MCG70100
IWS57100
AHAP22461100
PROG807874
A PROG in this instance refers to the full list of 166 Full-Blood Wagyu animals genotyped on the Illumina 770 K platform and the overlap between these 166 animals and selected candidates from other methods.
Table 2. Number of unique haplotypes accounted for when 100 animals are selected as whole-genome sequencing candidates using varying methods that utilise a relationship matrix (MCA/MCG) or haplotype library (IWS/AHAP2), respectively.
MethodCommonUncommonRareTotal
≥5%1%–<5%0.1%–<1%
MCA A----
MCG5883557817512,320
IWS5883507649210,587
AHAP2588352451379249
Max # B588366616,60020,854
A As not all MCA selected animals were genotyped, the number of unique haplotypes accounted for cannot be estimated. B Max # denotes the maximum number of haplotypes in each category that can be sampled.
Publisher’s Note: MDPI stays neutral with regard to jurisdictional claims in published maps and institutional affiliations.

