Article

Impact of Market Participation on Household Food Security among Smallholder Irrigators in KwaZulu-Natal, South Africa

School of Agricultural, Earth, and Environmental Sciences, University of KwaZulu-Natal, Pietermaritzburg 3201, South Africa
*
Author to whom correspondence should be addressed.
Agriculture 2022, 12(2), 261; https://doi.org/10.3390/agriculture12020261
Submission received: 1 November 2021 / Revised: 9 December 2021 / Accepted: 10 December 2021 / Published: 11 February 2022
(This article belongs to the Section Agricultural Economics, Policies and Rural Management)

Abstract

:
Food insecurity is a global challenge. The reduction of hunger is a Sustainable Development Goals (SDG) target widely seen as a measure for evaluating the progress of the well-being of rural people. This study aimed to investigate the impact of collective action and market participation on household food security. Data were collected using a structured survey questionnaire from 243 randomly selected households in Msinga Local Municipality. The binary probit model findings revealed that farmers’ group membership, market participation, gender, the total number of cattle owned, farm income, and credit access increased the likelihood of a food-secure household. This paper’s findings have crucial implications for the government and other development agencies for improving household food-security status. The findings identified collective action and market participation to be contributing to food-insecurity alleviation. The government and private organisations need to encourage and empower existing farmers’ groups through community mobilisation.

1. Introduction

Globally, the number of smallholder farmers is estimated to be around 500 million, and they produce food for about 80% of the population ([1] also stated that smallholder farmers are paradoxically the poorest and most food-insecure, and that they suffer from malnutrition). Ref. [2] reported the recent poverty statistics for South Africa, which showed that, despite a decline in poverty between 2006 and 2011, poverty levels rose in 2015. In 2011, the poverty level was 53.2%; in 2015, approximately 30.4 million (55.5%) South Africans lived in poverty. Smallholder farmer participation in the market may eradicate poverty and household food insecurity [3].
Ref. [3] indicated that marketing should be more than selling. One of the key constraints facing smallholder farmers has been a lack of access to reliable markets. Most smallholder farmers do not have financial and marketing skills. As a result, they cannot comply with the quality requirements developed by markets for fresh produce and food processors, especially in South Africa.
Ref. [4] reported that the agricultural sector is primarily subsistence. Most farm production is for household consumption rather than market participation in South Africa. According to [4], a lack of access to a reliable and lucrative formal market forced most smallholder farmers to not sell their crops, therefore restricting their crop production to household consumption rather than marketing. When they sell their crops to middlemen, they do so at lower prices and make little-to-no profit. The low involvement of smallholders in the crop market results in them realizing low incomes, exposing them to food insecurity and a vicious cycle of poverty [4].
According to [5], farmers’ market participation is both a source of economic growth and a result of it. It is an effective vehicle for rural people to secure better incomes and enhance household food security. Smallholder farming is essential in the fight against rural poverty and food insecurity in Sub-Saharan Africa [5,6] The potential role of smallholder farming in the fight against rural poverty and food insecurity in Sub-Saharan Africa has been paramount in promoting smallholder market participation. There is an increasing belief that if smallholder farmers break out of the subsistence trap and become more entrepreneurial and market-driven, it will contribute more to rural livelihoods [5].
Smallholder farmers’ market participation can enhance agricultural productivity, income, food security, and poverty [7,8,9]. Nevertheless, there is no definitive proof of its effect on food security and nutrition. On one hand, studies have shown that the marketing of agricultural produce successfully enhances food security and nutrition [10,11]. Studies such as [12], on the other hand, have found no evidence that market participation has a positive impact on smallholder farmers’ food- and nutrition-security status. Other studies, such as [13], found a positive relationship between group membership and food security. Ref. [14] found no contribution of collective action in ensuring food-security and poverty reduction because of heterogeneous membership, leadership, passive membership, a lack of trust, and an equality of dividends, irrespective of the participation level.
Ref. [15] conducted empirical research on market participation’s effects on food security. Some studies have examined drivers of household food security [16,17]. Other studies have looked at the impact of collective action on market participation [18]. However, a review of these studies shows their limitations on the impact of both collective action and market participation on household food security. They look at only one factor over the other and do not consider both. Most of these studies focus on rural communities in Sub-Saharan Africa and Southern Asia [16,17,19], and on livestock farming [20], and on grains [21]. There is a dearth of recent empirical literature regarding the link between crop-market participation, collective action, and household food security in the rural areas of South Africa. Hence, this study examined the impact of smallholder farmers’ markets and collective action participation on household food security. The hypothesis is that farmers who participate in the market and belong to a farmers’ group are more food-secure than their counterparts. From a policy perspective, the current study contributes to determining the influence of market participation and collective action on household food security among smallholder farm households. Understanding the impact of collective action and market participation on food security is critical for evidence-based policy and the targeting of food-security interventions among smallholder farmers.
The following section presents the research methodology. Further, it discusses the data collection approach, analytical framework, and empirical methods. Furthermore, it interprets and discusses results. The last section presents the main conclusions and policy implications.

Analytical Framework

According to the standard agricultural household model, farmers’ households allocate consumption expenditure by maximizing utility subject to income constraints [11]. The agricultural produce returns determine the household income, which depends on farmers’ productivity and their ability to generate a marketable surplus as the primary condition for market participation. Then, the market entry and participation would determine the household expenditure on essential goods. This study hypothesizes that market participation positively affects household food security, expressed as a Household Dietary Diversity Score (HDDS), by augmenting household food consumption. The Household Dietary Diversity Score (HDDS) can be described as the number of food groups consumed by a household over a given reference period and is an essential indicator of food security [22]. According to [22], the HDDS indicator indicates a household’s ability to access food and their socioeconomic status based on the previous 24 h. Market participation motivates more efficient production and increases household earnings. To assess the effects of market entry on household food security, a commonly used model in the literature, such as [11,23] on effect evaluation, is specified as follows:
Y = β X + γ I + ε and Y = 1 , Y i > 0 ; 0 , Y l 0
where Y is the household’s HDDS per capita, β represents coefficient, and X is a vector of household and farm characteristics and other factors expected to affect household food security. “ I ” is a dummy for market participation, γ is the coefficient capturing the effect of market participation on household food security, and ε stands for random errors.

2. Materials and Methods
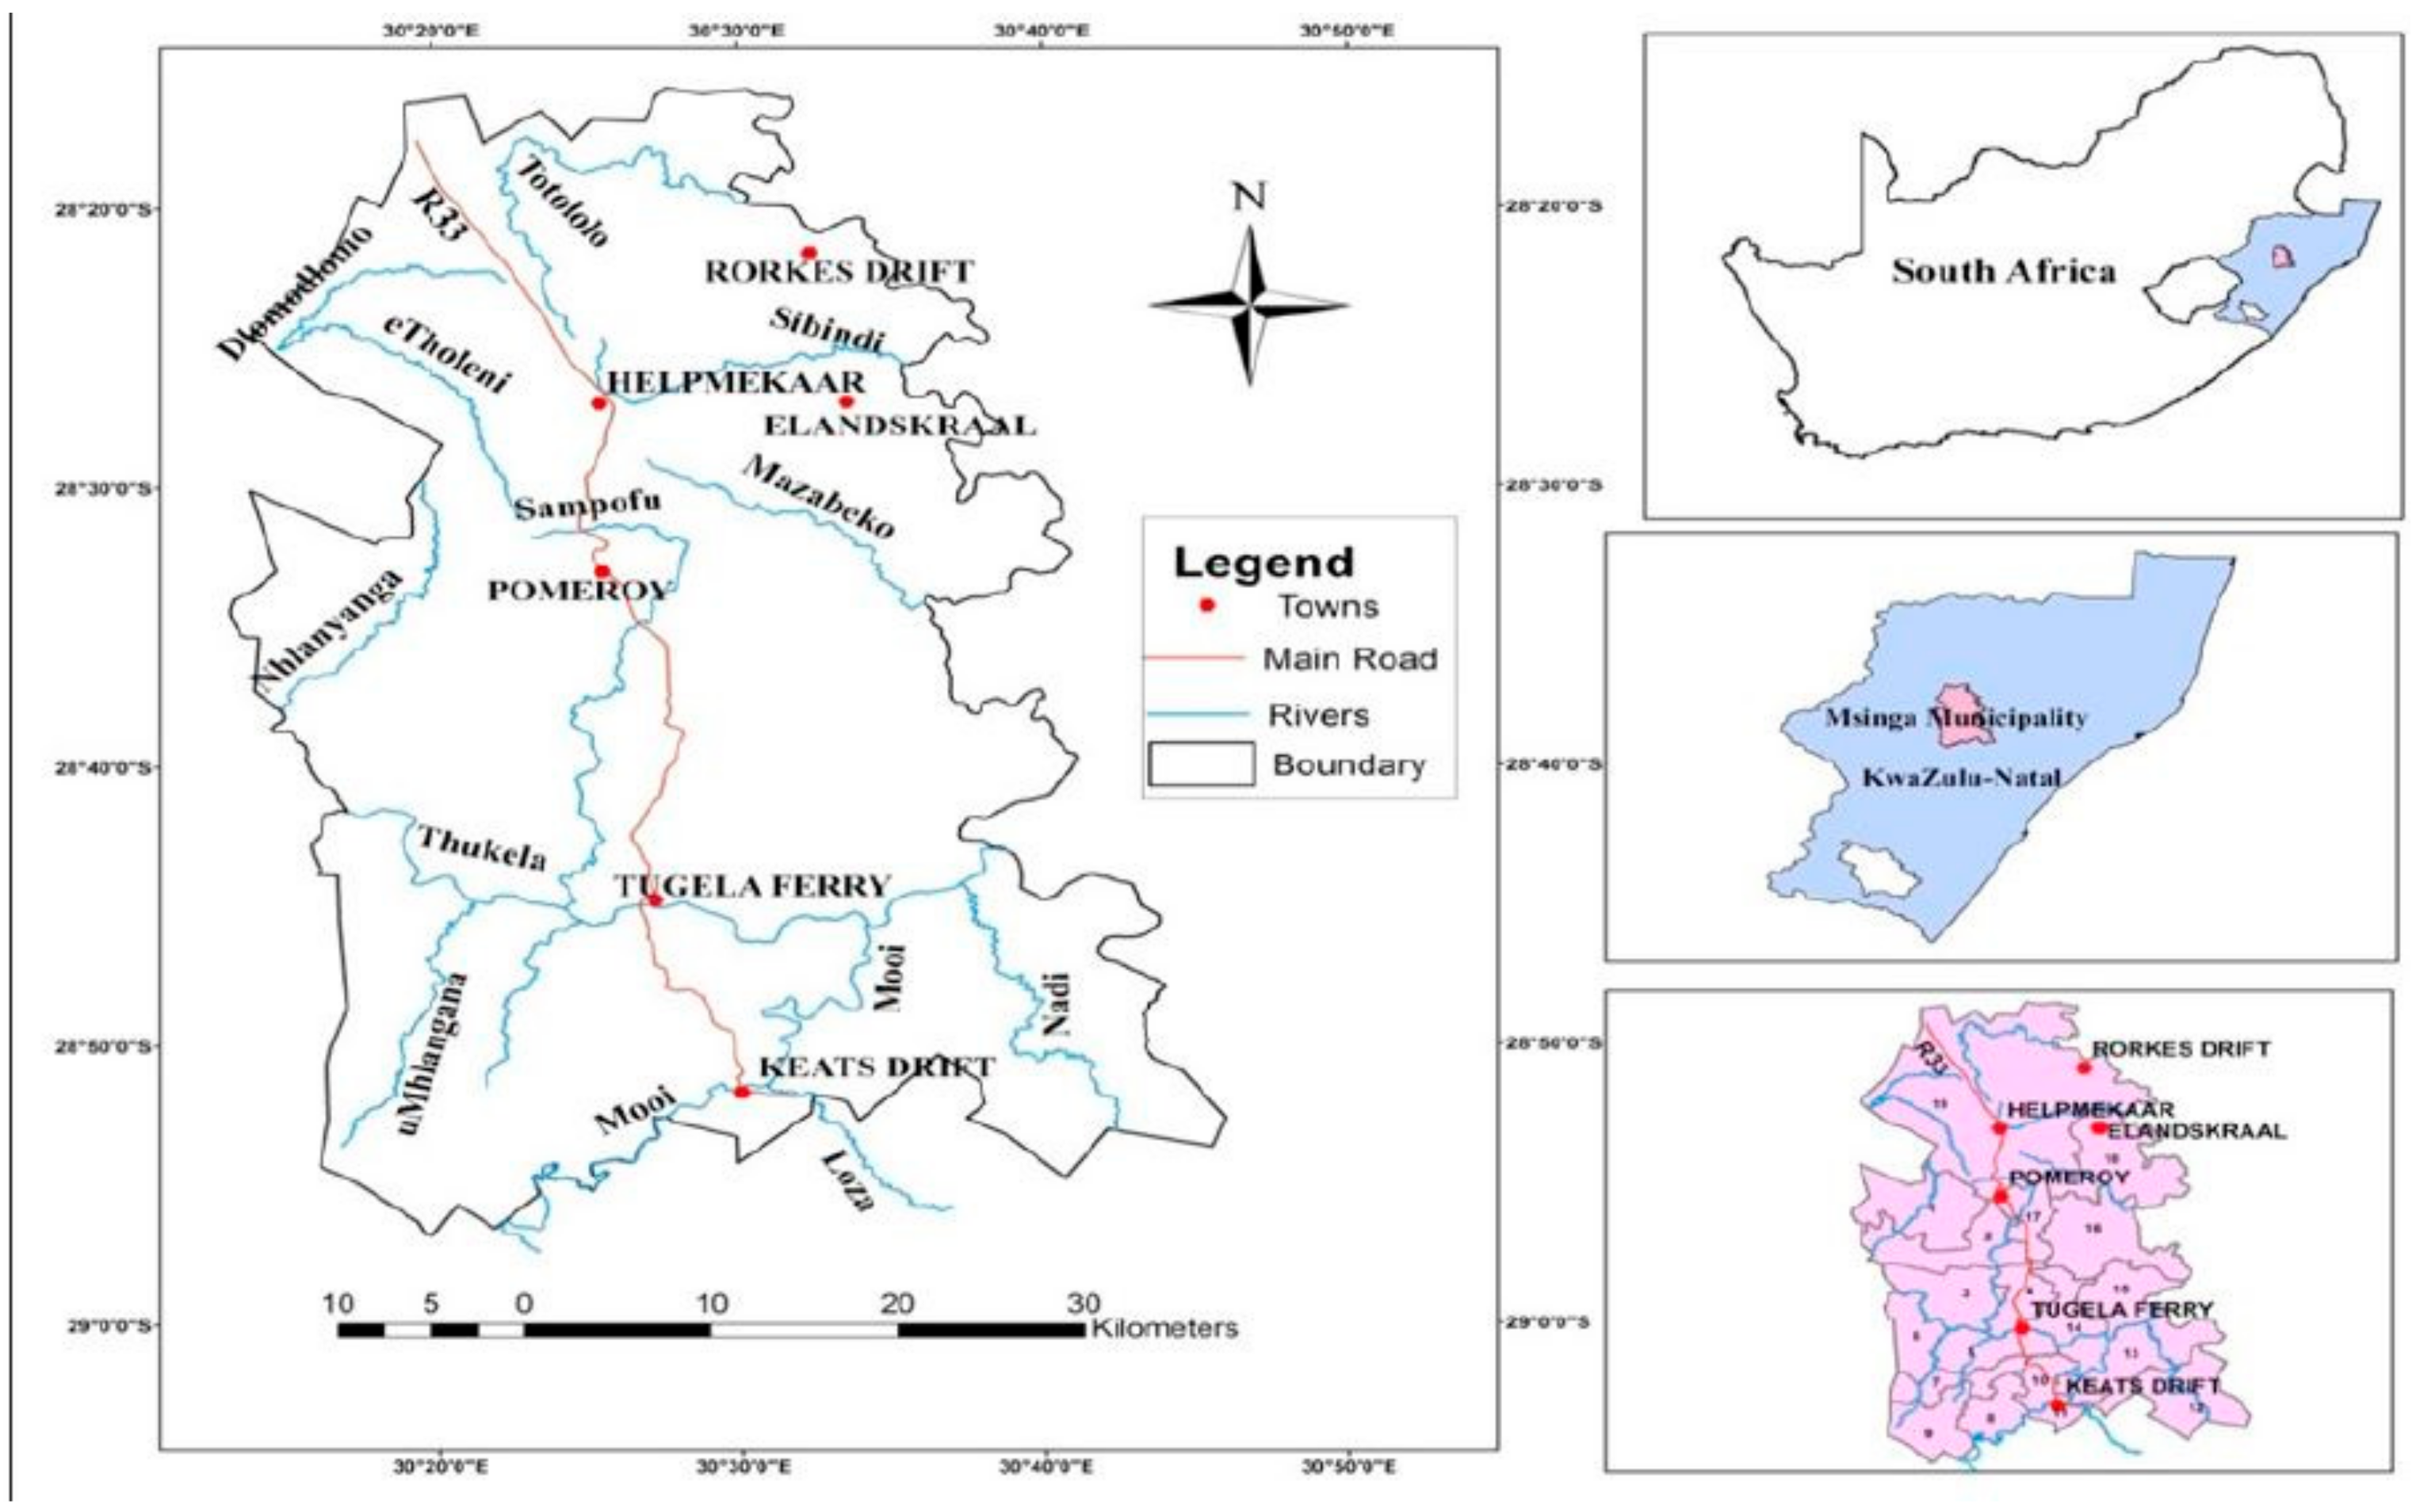
2.1. Study Area

The Tugela Ferry Irrigation Scheme (TFIS) and Mooi River Irrigation Scheme (MRIS), located at Msinga Local Municipality in the uMzinyathi District of KwaZulu-Natal Province in South Africa, served as the study sites (Figure 1). The Msinga Local Municipality has an average rainfall of 600 mm per annum and is a semi-arid area [24]. According to [25], the total population of the Local Municipality was 177,577, with 37,724 households, in 2011. Crop farming occurs along the main rivers, i.e., the Tugela and Mooi Rivers. Thus, farming contributes 18% of the income for the area. These smallholder irrigation schemes draw water from the Tugela and Mooi rivers. The TFIS covers 873 ha, while the MRIS covers 600 ha. The area consists of distinctly demarcated plots, each approximately 0.1 ha in size. However, some farmers own or use more than one plot, with most of them using about 0.5 ha on average [26]. A total of 1500 and 824 irrigators participate in the TFIS and MRIS, respectively. Vegetable crops grown in the irrigation schemes during winter and summer includes tomatoes, spinach, green peppers, sweet potatoes, potatoes, onions, and butternuts. Maize is the main crop grown in summer [24].

2.2. Sampling Design and Sample Size

The target population of smallholder farmers was selected using a multistage sampling technique. First, one local municipality was chosen out of the four—namely, the Msinga Local Municipality in Umzinyathi District Municipality, because the inhabitants there predominantly practice farming on a small scale. Second, two irrigation schemes were selected (TFIS and MRIS). Lastly, 243 farmers, out of approximately 2324 smallholder farmers, were randomly selected. Farmers were selected randomly from the list obtained from the extension officer. Out of the total sample size, 156 smallholder farmers were from TFIS and 87 were from MRIS. Both male and female smallholder farmers had equal chances of being selected for this study.

2.3. Empirical Models: Binary Probit Regression Model

The binary probit regression method is suitable for modelling dichotomous dependent variables. The Household Diet Diversity Score (HDDS) was used as a proxy to measure household food-security status. A numeric value of 1 was assigned if the households were food-secure, and 0 was assigned if the households were food-insecure. Refs. [23,28,29] measured household food security using HDDS and dichotomized the HDDS. Therefore, this study also followed the same method, as it has been approved and deemed fit to measure household food security. The participants were asked if they had consumed food in the past 24 h. The value of 1 was assigned if they had consumed, and 0 if they had not. The binary probit regression model then provided a basis for detecting the probability of a household being food-secure or otherwise (food-insecure). Various studies, such as the work of [30], have studied determinants of household food security using a binary probit model. This study used the marginal effect at mean for both continuous and dummy variables. In the probit model, it estimated marginal effects of the ith variable, as the effect of a unit change of this ith variable on the probability P (Y = 1|X = x), given that all other variables are constant and can be specified as follows:
Ρ y i   = 1 | x i / x i   = E y i | x i / x i = φ x i β β
The average marginal effect for each continuous variable in the model is as follows:
A M E = 1 n i n = 1 φ x i β β
The average marginal effect for each dummy variable in the model is as follows:
A M E = 1 n i n = 1 ϑ x i β / x i k = 1 ϑ x i β / x i k = 0
The study used Equation (1) to predict a household experiencing food security when food insecurity equals 0 and food security is 1.

2.4. Definitions of Variables

2.4.1. Dependent Variables

The HDDS was used as a proxy to measure household food security. HDDS is a continuous score ranging between 0 and 12 depending on whether the household consumed each of the 12 food groups [31]. The HDDS was then recorded as a dummy variable, using the average score as the cut-off value. This study used the average HDDS of 3.5 for the sample as the cut-off point, such that the value of 1 was assigned if the farmer’s HDDS was above the average score, meaning food-secure, and 0 if it was below the average score, indicating food insecurity. Refs. [23,28,29] used the cut-off method of using the average HDDs to measure food security. An HDDS questionnaire captured the farmers’ household dietary diversity as a proxy measure of food security [22].
Finding detailed information on farmers’ household food security or individual dietary consumption can be expensive and, thus, time-consuming [22]. Dietary diversity is a qualitative measure of food consumption that reflects household access to various foods and is a proxy for the nutrient adequacy of individuals’ diets. The dietary diversity questionnaire presents a rapid, user-friendly, and easily administered low-cost assessment tool [22].
A total of 243 randomly selected households participated in the survey in Msinga Local Municipality. Following [31], the heads of the households had to recall all food items/goods eaten in the previous 24 h before the interview. A scale of 12 food groups was used to determine the participants’ dietary diversity, as indicated in Table 1 [32]. A single point was allocated to each of the food groups eaten in the 24-h period, allocating each person a possible maximum total dietary diversity score of 12 points if his/her responses were “yes” for all food groups.

2.4.2. Independent Variables

The independent variables used in the probit regression modelling to elicit the determinants of household food security status include study participants’ market participation, farmers’ group, gender, farm size, marital status, number of cattle owned, farm income, social grant, total production output, education, food expenditure, off-farm income, own transport, credit access. Table 2 summarises the independent variables inputted in the binary probit regression model.
Gender: The de facto headship of the household head was captured in this study. Female household heads have a higher dependency, which is likely to hinder their households from allocating labour to off-farm or other income-generating activities [24]. Therefore, the expected outcome could be either negative or positive.
Education: This study expected education to impact household food security status positively. Ref. [23] stated that educated farmer is in a better position to practice what he/she might have learnt from school in their farming projects. Marital Status: Households with married spouses can be food secure. They help each other with household necessities. The married heads of households dominate in the survey. The female may be engaged in agricultural activities, and the male may be more involved in income-generating activities [24]. Therefore, the study expected marital status to impact food security positively.
Market participation: Market participation was expected to positively impact household food security because participating in the market improves household income. Ref. [15] found that selling cowpea to rural and urban traders significantly increased household income, food expenditure, and food security.
Farm size: In this study, farm size is expected to positively affect households’ food-security status. According to [34], food production can be increased extensively by expanding areas under cultivation. Therefore, the study expected landholding to play a significant positive role in influencing households’ food security.
Farm income, off-farm income, and social grant: One income alone is not enough to cover all expenses. Households receiving farm and off-farm income and social grants are less likely to follow unhealthy coping habits, such as consuming less nutritious food because of a lack of money, and to meet household food requirements. The number of people receiving social grants has significantly increased from 15.7 million in 2013 to almost 17.9 million in 2018 in South Africa [35]. This study expected these factors to positively affect households’ food-security status because they have sufficient money to buy food [36].
Credit access: Access to credit is a household’s ability to obtain credit in cash for either consumption or to support agricultural production [37]. Credit obtained for consumption increases a households’ consumption basket [38]. On the other hand, when obtained on time, production credit increases the chances of farming households acquiring productive resources (pesticides, seeds, fertilizers, and machinery hires), boosting productivity, and improving household food security.
Farmers’ group: Membership in a farmers’ group improves members’ food consumption by increasing farming production [39]. This variable was expected to affect food-security status positively.
Number of Cattle Owned: This study expected the number of livestock owned to affect household food security positively. The total number of livestock enables a household to be food-secure through the income earned or through direct consumption [24].
Food expenditure: The rationale is that households with a higher proportion of their total income spent on food are more vulnerable than households with a lower proportion of food [36]. Ref. [36] stated that households that spend a large share of their income on food are more vulnerable to changes in food prices and income. The study expected food expenditure to have a negative outcome.
Own transport: The study expected that vehicle ownership would impact household food security positively. Households without cars necessarily spend more time and money to travel to grocery stores. Higher costs may cut the size of meals, increasing food insecurity [40].
Total production output: The total amount of crops produced by a household head was measured in kilograms. The total production output was expected to affect household food security positively. If a household produces crops in large quantities, they may have adequate food for both their consumption and for selling [41,42].

3. Results

3.1. Food Security Measured by HDDs

According to [23], there is no clear, internationally recognised cut-off of high or low HDDS levels. However, an average HDDS was computed for the sample. The average HDD score was 3.5. Households whose HDDS was above the average HDDS were treated as food-secure and below the average level of HDDs were treated as food-insecure. The HDDS is a widely used instrument promoted by the Food and Agriculture Orginizations (FAO) and United States Agency for International Development (USAID) as a food-access proxy. Therefore, the HDDS was used in this paper to act as a proxy for household food-security status. The objective was to assess economic access to food. Therefore, this tool was suitable for this study.

3.2. Demographic and Socioeconomic Characteristics

Table 3 presents the t-test results for the continuous variables. The study indicated that 42% and 58% of the sample households were food-secure and food-insecure, respectively. The t-test results show that food-insecure farmers had average farm sizes of 0.291 ha, whereas, for food-secure farmers, it was 0.412 ha. In addition, food-secure households had larger farm sizes than their counterparts. The results could indicate that larger farmlands allow farmers to produce more crops. Off-farm income was statistically significant at 1%. Households who were food-secure get an average of ZAR 33,781, while the food-insecure get an average of ZAR 28,306 per annum.
Social grants were statistically significantly between food-secure and food-insecure farmers. The t-test indicated that recipients of social grants who are food-insecure received an average of ZAR 27,139 per annum. Food-secure households received ZAR 21,670 worth of social grants annually. Table 3 shows that food-insecure households received a farm income of ZAR 11,205 yearly, and food-secure households received ZAR 15,206 yearly.
There was a statistically significant difference (p < 0.01) in the number of cattle owned by food-secure and food-insecure households. Smallholder farmers that were food-insecure had an average of 8.721 livestock, and food-secure smallholder farmers had an average of 20.456 livestock. Farmers indicated that they sell their livestock to buy food. Every month a food-secure household spent ZAR 1537 on food items, and food-insecure households spent ZAR 1120. Households that were food-secure had a mean of 4518.175 kg of total production output of crops, compared to food-insecure households with a mean of 3160.971 kg.
In Table 4, the farmers’ group was statistically significant at 1%, which means that belonging to a farmers’ group played a significant role in household food-security status. The results show that 76% of smallholder farmers who did not belong to a farmers’ group were food-insecure, and 24% were food-secure. Furthermore, the results show that 73% of farmers with group membership were food-secure, and 27% were food-insecure.
The chi-square test was performed based on household participation and non-participation in the output market. The results revealed that market participants had a statistically significant difference (p < 0.01) between food-secure and food-insecure smallholder farmers. Market participation plays a significant role in a farmer’s food-security status. The results indicated that 77% and 23% of smallholder farmers who did not participate in the market were food-insecure and food-secure, respectively. About 45% and 55% of farmers who participated in the market were food-insecure and food-secure, respectively.
Credit access was significant at 5%; approximately 67% of the food-insecure households had access to credit, compared to the 33% of food-secure households who had access. These results imply that food-insecure households did not have enough money to buy adequate, safe, and nutritious food because they used the money to pay back the credit.

3.3. Effect of Market Participation and Collective Action on Household Food Security

The Variance Inflation Factor (VIF) was employed to check for multicollinearity. The VIF was less than the critical value of 10 [17,43], as shown in Table 5, confirming that multicollinearity was not a problem. The probit regression model results run on STATA version 15 are presented in Table 6. Since the original HDDS variable was right-censored, the Tobit model was run to check for robustness (Appendix A, Table A1). The probit regression model results are reported to have more significant independent variables.
The chi-square significance gives the overall measure of the goodness of fit model (p < 0.001). Among the 14 variables considered in the probit model, as indicated in Table 6, six had a statistically significant impact on household food security. The six variables were farmers’ group (p < 0.01), the number of cattle owned (p < 0.01), gender (p < 0.1), credit access (p < 0.05), farm income (p < 0.1), and market participation (p < 0.1). The probit model assessed market participation and collective action on household food security in Msinga Local Municipality.
Market participation: Market participation had a positive and statistically significant coefficient (p < 0.1). This marginal effect shows that farmers who participated in the markets had 0.001 higher chances of food security than their counterparts. These findings are consistent with [11,15,19], who showed that market participation improves household food security. Market participation increases agricultural productivity, followed by increasing marketable surpluses and incomes. Market participation leads to increased agricultural production, resulting in more marketable surpluses [44]. The market surplus raises farmers’ income, enhancing their ability to buy more varieties of foods [8] and, moreover, motivating increased production through opportunities for disposing surplus [44].
Farmers’ group: Belonging to a farmers’ group had a positive statistically significant (p < 0.01) impact on household food-security status. Household heads who were members of a farmers’ group had 0.414 higher chances to be food-secure than households whose heads did not have group membership, as indicated by the marginal effect. The likelihood of being food-secure because of group membership can be attributed to the fact that belonging to a farmers’ group has several benefits, such as access to credit. Furthermore, farmers’ group members share their experiences and the knowledge that they have acquired over the years amongst each other and with other groups. The results are consistent with other studies conducted in Northern Ethiopia [39]. The findings of these two studies suggested that group membership increased the probability of a household being food-secure.
Contrary to the expectations, credit access had a negative and statistically significant (p < 0.05) impact on household food security. The results imply that households with access to credit have −0.168 fewer chances to be food-secure. There are two possible explanations for these results. The first one is that formal credit facilities are not well utilized. Most households in Msinga were not getting any formal credit support [23]. Farmers were most likely borrowing money from informal creditors, such as stokvels, friends, and loan sharks (illegal moneylenders). Households who took credit from the informal creditors were likely to be food-insecure because they had to pay the loan with a higher interest rate. The second explanation is that the loan was not enough to cover the intended investment; hence, the household had to cut their food consumption. Ref. [23] also had similar findings in their study conducted in Maphumulo Local Municipality.
Gender: A household head’s gender had a negative and statistically significant influence on household food security (p < 0.1). The results suggest that households headed by females have 0.175 more chances to be food-secure than those headed by males. Gender had a negative impact on food security because some males move to urban areas in search of jobs, and those residing in rural areas are likely to be unemployed. Married-female-headed households are more likely to have their male counterparts earning an income in cities and sending remittances that can be used to buy food [45].
The number of cattle owned: The total number of cattle owned had a positive and statistically significant (p < 0.05) effect, implying that the households with more livestock have 0.009 higher chances of being food-secure. The livestock ownership represents a higher level of household wealth and income that enables a household to be food-secure, either through income earned through the selling of the livestock or, to a lesser degree, through direct consumption. The study was consistent with [30].
Farm income: The result indicated that farm income had a positive and statistically significant (p < 0.1) effect on a household being food-secure. The results suggest that as farm income per annum increases, the likelihood of a food-secure household also increases by 0.001. Households with more farm income can buy more food. The findings are consistent with the findings of [36].

4. Conclusions

The main aim of this study was to examine the impact of market participation and collective action with other socioeconomic factors on rural farm households’ food security in Msinga Local Municipality. Food security was measured using the Household Diet Diversity Score (HDDS). From the study sample, the binary probit model findings revealed that farmers’ group membership, market participation, gender, the total number of cattle owned, farm income, and credit access increased the likelihood of a household being food-secure.
The study results revealed a positive impact of farmers’ group membership on household food security. Hence, the government and private organisations need to encourage and empower existing farmers’ groups through community mobilization. The official and formal registration of farmers’ groups at the Department of Agriculture needs to be prioritized. Only registered groups should receive agricultural training from the department and other benefits such as access to credit. Market participation had a positive impact on household food security. More interventions should focus on improving smallholder farmers’ market participation, such as selling their produce as a collective so that they will be able to supply large retail stores. Farm income increases the likelihood of a household being food-secure. Therefore, this study recommends more investments in the agricultural sector, especially in rural areas. The total number of livestock (cattle) owned positively impacted household food security. Therefore, strengthening ownership of livestock should be prioritized by improving livestock production. Improving livestock production should provide smallholder farmers with training and animal husbandry support.
Further research on the determinants of household food security may include other factors, such as the level of collective action participation. This study was limited by district coverage within South Africa. However, the findings of this study provide a primary base of the determinants of household food security in rural areas.

Author Contributions

Conceptualization, T.C.; methodology, T.C.; software, T.C.; validation, T.C. and M.M.; formal analysis, T.C.; investigation, T.C.; resources, T.C. and M.M.; data curation, T.C. and M.M.; writing—original draft preparation, T.C.; writing—review and editing, M.M.; supervision, M.M.; project administration, T.C. and M.M.; funding acquisition, M.M. All authors have read and agreed to the published version of the manuscript.

Funding

The National Research Foundation, grant number 116921, and the University of KwaZulu-Natal funded the research.

Institutional Review Board Statement

The researchers obtained an ethical clearance approval letter from the University of KwaZulu-Natal. The ethical clearance application was submitted to the Humanities and Social Sciences Research Ethics Committee UKZN Research Ethics Office and obtained consent. Then, the gatekeeper’s letter was also obtained from extension officers, where the study was conducted. Informed consent was also obtained from the households, discussants, and informants before data collection, in conformity with the anonymity of the study participants.

Data Availability Statement

The authors want to declare that they can submit the data at any time based upon request. The datasets used and/or analysed during the current study will be available from the corresponding author upon reasonable request.

Acknowledgments

The authors acknowledge the respondent smallholder farmers and enumerators. The University of KwaZulu-Natal and the National Research Foundation are also acknowledged for their financial support in accomplishing this paper.

Conflicts of Interest

The authors declare no conflict of interest.

Appendix A

Table A1. Tobit regression.
HDDSCoef.Std. Err.p > z
Farmers’ group1.9270.3460.001
Market participation0.0010.0000.003
Gender0.6320.2850.026
Farm size−0.0390.2080.850
Marital status0.2430.2450.322
Number of cattle owned0.0140.0090.125
Farm income−0.0010.0000.089
Social grant−0.0010.0000.533
Total production output−0.2870.3080.351
Education0.2560.1530.094
Food expenditure0.0010.0000.138
Off-farm income−0.0010.0000.422
Own transport−0.2330.4280.586
Credit access−0.3250.2620.216
var(e.HDDS)3.2400.294
Number of obs = 243; Uncensored = 243; Limits: lower = −inf; upper = +inf; Left-censored = 0; Right censored = 0; Wald chi2(14) = 118.23; Log likelihood = −487.63497; Prob > chi2 = 0.0000.

References

  1. Wickramasinghe, U.; Omot, N.; Patiken, A.D.; Ryan, J. Market Participation of Smallholder Agricultural Households in Papua New Guinea; CAPSA: Bogor, Indonesia, 2014. [Google Scholar]
  2. Lehohla, P. Poverty Trends in South Africa: An Examination of Absolute Poverty Between 2006 and 2015; Statistics South Africa: Pretoria, South Africa, 2017. Available online: https://www.statssa.gov.za/publications/Report-03-10-06/Report-03-10-062015.pdf (accessed on 11 September 2020).
  3. Megerssa, G.R.; Negash, R.; Bekele, A.E.; Nemera, D.B. Smallholder market participation and its associated factors: Evidence from Ethiopian vegetable producers. Cogent Food Agric. 2020, 6, 1783173. [Google Scholar] [CrossRef]
  4. Oluwatayo, I.B. Towards assuring food security in South Africa: Smallholder farmers as drivers. AIMS Agric. Food 2019, 4, 485–500. [Google Scholar] [CrossRef]
  5. Mabuza, M.L.; Ortmann, G.F.; Wale, E.; Mutenje, M.J. The effect of major income sources on rural household food (in) security: Evidence from Swaziland and implications for policy. Ecol. Food Nutr. 2016, 55, 209–230. [Google Scholar] [CrossRef]
  6. Weaver, C. Hypocrisy Trap: The World Bank and the Poverty of Reform; Princeton University Press: Princeton, NJ, USA, 2008; p. 244. [Google Scholar]
  7. Barrett, C.B. Smallholder market participation: Concepts and evidence from eastern and southern Africa. Food Secur. Afr. 2010, 33, 299–317. [Google Scholar]
  8. Sibhatu, K.T.; Krishna, V.V.; Qaim, M. Production diversity and dietary diversity in smallholder farm households. Proc. Natl. Acad. Sci. USA 2015, 112, 10657–10662. [Google Scholar] [CrossRef] [PubMed] [Green Version]
  9. Radchenko, N.; Corral, P. Agricultural commercialisation and food security in rural economies: Malawian experience. J. Dev. Stud. 2018, 54, 256–270. [Google Scholar] [CrossRef] [Green Version]
  10. Aidoo, R.; Mensah, J.O.; Tuffour, T. Determinants of household food security in the Sekyere-Afram plains district of Ghana. Eur. Sci. J. 2013, 9, 514–521. [Google Scholar]
  11. Seng, K. The Effects of Market Participation on Farm Households’ Food Security in Cambodia: An Endogenous Switching Approach. Ph.D. Thesis, University Library of Munich, Munchen, Germany, 2016. Munich Personal RePEc Archive. [Google Scholar]
  12. Carletto, C.; Corral, P.; Guelfi, A. Agricultural commercialization and nutrition revisited: Empirical evidence from three African countries. Food Policy 2017, 67, 106–118. [Google Scholar] [CrossRef] [Green Version]
  13. Kehinde, A.; Kehinde, M. The impact of credit access and cooperative membership on food security of rural households in south-western Nigeria. J. Agribus. Rural Dev. 2020, 57, 255–268. [Google Scholar] [CrossRef]
  14. Dongfeng, S. Research on the impact of cooperative behaviors in alliance organization in member psychological contract. Afr. J. Bus. Manag. 2012, 6, 8737–8742. [Google Scholar] [CrossRef]
  15. Manda, J.; Alene, A.D.; Tufa, A.H.; Feleke, S.; Abdoulaye, T.; Omoigui, L.O.; Manyong, V. Market participation, household food security, and income: The case of cowpea producers in northern Nigeria. Food Energy Secur. 2020, 9, 211. [Google Scholar] [CrossRef]
  16. Ahmed, U.I.; Ying, L.; Bashir, M.K.; Abid, M.; Zulfiqar, F. Status and determinants of small farming households’ food security and role of market access in enhancing food security in rural Pakistan. PLoS ONE 2017, 12, e0185466. [Google Scholar] [CrossRef] [Green Version]
  17. Zhou, D.; Shah, T.; Ali, S.; Ahmad, W.; Din, I.U.; Ilyas, A. Factors affecting household food security in rural northern hinterland of Pakistan. J. Saudi Soc. Agric. Sci. 2019, 18, 201–210. [Google Scholar]
  18. Gyau, A.; Franzel, S.; Chiatoh, M.; Nimino, G.; Owusu, K. Collective action to improve market access for smallholder producers of agroforestry products: Key lessons learned with insights from Cameroon’s experience. Curr. Opin. Environ. Sustain. 2014, 6, 68–72. [Google Scholar] [CrossRef] [Green Version]
  19. Salami, M.F.; Osasona, K.K.; Akinsola, G.O.; Akanbi, S.U.O.; Durosaye, M.T. Effect of Market Participation on Food Security Among Smallholder Sorghum Farmers in Kwara State, Nigeria. Cercetări Agronomice în Moldova 2020, 53, 330–336. [Google Scholar] [CrossRef]
  20. Kibona, C.A.; Yuejie, Z. Factors that influence market participation among traditional beef cattle farmers in the Meatu District of Simiyu Region, Tanzania. PLoS ONE 2021, 16, e0248576. [Google Scholar] [CrossRef] [PubMed]
  21. Kyaw, N.N.; Ahn, S.; Lee, S.H. Analysis of the factors influencing market participation among smallholder rice farmers in magway region, central dry zone of Myanmar. Sustainability 2018, 10, 4441. [Google Scholar] [CrossRef] [Green Version]
  22. Swindale, A.; Bilinsky, P. Development of a universally applicable household food insecurity measurement tool: Process, current status, and outstanding issues. J. Nutr. 2006, 136, 1449S–1452S. [Google Scholar] [CrossRef]
  23. Ngema, P.Z.; Sibanda, M.; Musemwa, L. Household food security status and its determinants in Maphumulo local municipality, South Africa. Sustainability 2018, 10, 3307. [Google Scholar] [CrossRef] [Green Version]
  24. Maziya, M.; Mudhara, M.; Chitja, J. What factors determine household food security among smallholder farmers? Insights from Msinga, KwaZulu-Natal, South Africa. Agrekon 2017, 56, 40–52. [Google Scholar] [CrossRef]
  25. StatsSA. Statistical Release (Revised) P0301.4 Census 2011. 2021. Available online: https://www.statssa.gov.za/publications/P03014/P030142011.pdf (accessed on 30 September 2020).
  26. Gomo, T.; Senzanje, A.; Mudhara, M.; Dhavu, K. Assessing the performance of smallholder irrigation and deriving best management practices in South Africa. Irrig. Drain. 2014, 63, 419–429. [Google Scholar] [CrossRef]
  27. Njoko, S.; Mudhara, M. Determinant of farmers’ ability to pay for improved irrigation water supply in rural KwaZulu-Natal, South Africa. Water SA 2017, 43, 229–237. [Google Scholar] [CrossRef] [Green Version]
  28. Cheteni, P.; Khamfula, Y.; Mah, G. Exploring food security and household dietary diversity in the Eastern Cape Province, South Africa. Sustainability 2020, 12, 1851. [Google Scholar] [CrossRef] [Green Version]
  29. Huluka, A.T.; Wondimagegnhu, B.A. Determinants of household dietary diversity in the Yayo biosphere reserve of Ethiopia: An empirical analysis using sustainable livelihood framework. Cogent Food Agric. 2019, 5, 1690829. [Google Scholar] [CrossRef]
  30. Maharjan, K.L.; Joshi, N.P. Determinants of household food security in Nepal: A binary probit regression analysis. J. Mt. Sci. 2011, 8, 403–413. [Google Scholar] [CrossRef] [Green Version]
  31. FAO. Aquatic Biodiversity and Human Nutrition—The Contribution of Rice-Based Ecosystems; FAO: Rome, Italy, 2007; Available online: https://www.fao.org/3/ai759e/ai759e04.pdf (accessed on 19 October 2020).
  32. Taruvinga, A.; Muchenje, V.; Mushunje, A. Determinants of rural household dietary diversity: The case of Amatole and Nyandeni districts, South Africa. Int. J. Dev. Sustain. 2013, 2, 2233–2247. [Google Scholar]
  33. Kennedy, G.; Berardo, A.; Papavero, C.; Horjus, P.; Ballard, T.; Dop, M.; Delbaere, J.; Brouwer, I.D. Proxy measures of household food consumption for food security assessment and surveillance: Comparison of the household dietary diversity and food consumption scores. Public Health Nutr. 2010, 13, 2010–2018. [Google Scholar] [CrossRef] [PubMed] [Green Version]
  34. Najafi, B. An overview of current land utilization systems and their contribution to agricultural productivity. In Report of the APO Seminar on Impact of Land Utilization Systems on Agricultural Productivity; Asian Productivity Organization: Teheran, Iran, 2003. [Google Scholar]
  35. Government of the Republic of South Africa. Increased Allocations in Grants, Education and Health. SA News, 20 February 2019. Available online: https://www.sanews.gov.za/south-africa/increased(accessed on 15 October 2020).
  36. Waidler, J.; Devereux, S. Social grants, remittances, and food security: Does the source of income matter? Food Secur. 2019, 11, 679–702. [Google Scholar] [CrossRef] [Green Version]
  37. Kuwornu, J.K.; Osei, E.; Osei-Asare, Y.B.; Porgo, M. Off-farm work and food security status of farming households in Ghana. Dev. Pract. 2018, 28, 724–740. [Google Scholar] [CrossRef]
  38. Babatunde, R.O.; Omotesho, O.A.; Sholotan, O.S. Socioeconomic characteristics and food security status of farming households in Kwara State, North-Central Nigeria. Pak. J. Nutr. 2007, 6, 49–58. [Google Scholar]
  39. Nugusse, W.Z.; Van Huylenbroeck, G.; Buysse, J. Household food security through cooperatives in Northern Ethiopia. Int. J. Coop. Stud. 2013, 2, 34–45. [Google Scholar] [CrossRef] [Green Version]
  40. Baek, D. The effect of public transportation accessibility on food insecurity. East. Econ. J. 2016, 42, 104–134. [Google Scholar] [CrossRef] [Green Version]
  41. Hirvonen, K.; Hoddinott, J. Agricultural Production and Children’s Diets: Evidence from Rural Ethiopia; Ethiopian Development Research Institute: Addis Ababa, Ethiopia, 2014. [Google Scholar]
  42. Pawlak, K.; Kołodziejczak, M. The role of agriculture in ensuring food security in developing countries: Considerations in the context of the problem of sustainable food production. Sustainability 2020, 12, 5488. [Google Scholar] [CrossRef]
  43. Akinwande, M.O.; Dikko, H.G.; Samson, A. Variance inflation factor: As a condition for the inclusion of suppressor variable (s) in regression analysis. Open J. Stat. 2015, 5, 754. [Google Scholar] [CrossRef] [Green Version]
  44. Stifel, D.; Minten, B. Market access, well-being, and nutrition: Evidence from Ethiopia. World Dev. 2017, 90, 229–241. [Google Scholar] [CrossRef]
  45. Gebre, G.G.; Isoda, H.; Amekawa, Y.; Nomura, H.; Watanabe, T. What explains gender gaps in household food security? Evidence from maize farm households in Southern Ethiopia. Soc. Indic. Res. 2021, 155, 281–314. [Google Scholar] [CrossRef]
Figure 1. The Tugela Ferry and Mooi River Irrigation Schemes in Msinga Local Municipality, South Africa. Source [27].
Agriculture 12 00261 g001
Table 1. Household dietary diversity food groups.
Food Groups
  • Cereals
2.
Roots and tubers
3.
Vegetables
4.
Fruits
5.
Meat, poultry, offal
6.
Eggs
7.
Fish and seafood
8.
Beans, peas, lentils, or nuts
9.
Milk or milk products
10.
Oil, fat, or butter
11.
Sugar or honey
12.
Miscellaneous
Source: Adapted from [33].
Table 2. Description, definition, and values of variables used in the probit regression.
VariablesVariable’s ExplanationMeasurements
Food SecurityHousehold is food-insecure or food-secure0 = Food insecure 1 = Food secure
Market participationIf the farmer participated in the market0 = No, 1 = Yes
Farmers’ groupIf a farmer belongs to any farmers association0 = No, 1 = Yes
GenderGender of the household head0 = female, 1 = male
Farm sizeSize of the farming land in hectaresContinuous (hectares)
Marital statusMarital status of the household head 0 = unmarried 1 =married
Number of cattle ownedTotal number of cattle owned by a householdContinuous (number)
Farm incomeIncome from on-farm activities per year Continuous (Rands)
Social grantAnnual total social grant income Continuous (Rands)
Total production outputThe total amount of crops harvested in kilogramsContinuous (Kilograms)
EducationLevel of the household head’s education1 = No schooling, 2 = Primary, 3 = Secondary, 4 = Tertiary
Food expenditureAmount of money spent on food per monthContinuous (Rands)
Off-farm incomeIncome from off-farm sources per year Continuous (Rands)
Own transportIf a household head owns a vehicle0 = No, 1 = Yes
Credit accessIf a household head has access to credit0 = No, 1 = Yes
Table 3. T-test results for household food-security determinants.
VariablesFood Insecure (n = 140)Food Secure (n = 103)
MeanStd. Dev.MeanStd. Dev.t-Test
Farm size (ha)0.2910.193 0.4120.282 **
Off-farm income (ZAR)28,30666,667.30433,78131,166.332***
Social grant (ZAR)27,13920,807.80421,67019,768.022***
Farm income (ZAR)11,20510,566.52515,49111,741.541***
Total number of cattle owned8.72110.98720.45616.413***
Food expenditure (ZAR) 1120.357547.7191537.378910.793 ***
Total production output (kg)3160.9714771.5024518.1754573.186****
Note: ***, and **, means significant at 1%, and 5%, levels of significance, respectively.
Table 4. Association between food security and socioeconomic parameters.
VariablesCategoriesFood-Insecure
(n = 140) (%)
Food-Secure
(n = 103) (%)
X2 Sign. Level
Gender0 = Female5644n.s.
1 = Male62.537.5
Farmers’ group0 = No7624***
1 = Yes2773
Marital Status0 = Unmarried6139n.s.
1 = Married5446
Market participation0 = No7723***
1 = Yes4555
Credit access0 = No5446**
1 = Yes6733
Own transport0 = No5050n.s.
1 = Yes3664
1 = Yes6436
Education1 = No schooling5941n.s.
2 = Primary5248
3 = Secondary5446
4 = Tertiary01
*** and **means significant at 1% and 5% levels of significance, respectively. n.s. = not significant.
Table 5. Variable Variance Inflation Factors.
VariableVIF1/VIF
Farmers’ group2.1000.476
Total production output1.7200.581
Market participation1.6800.596
Food expenditure1.6100.620
Farm income1.4300.700
Number of cattle owned1.3800.725
Off-farm income1.1400.880
Marital status1.1200.892
Social grant1.0900.919
Farm size1.0900.920
Own transport1.0900.921
Gender1.0800.929
Education1.0500.949
Credit access1.0200.979
Mean VIF1.330
Table 6. Determinants of the household food-security status of households.
Food SecurityProbitMarginal Effect
Coef.Std. Err.p > zdy/dxStd. Err.p > z
Farmers’ group1.0980.2740.001 ***0.4140.0950.001 ***
Market participation0.0010.0010.052 *0.0010.0010.051 *
Gender−0.4550.2320.050 *0.1750.0890.050 *
Farm size−0.3460.3680.346−0.1330.1410.344
Marital status0.1070.1970.5870.0410.0750.587
Number of cattle owned0.0240.0070.003 ***0.0090.0030.003 ***
Farm income0.0010.0010.095 *0.0010.0010.093 *
Social grant−0.0010.0010.177−0.0010.0010.176
Total production output0.1980.2390.4090.0760.0900.404
Education0.1220.1230.3200.0470.0470.320
Food expenditure0.0010.0010.7930.0010.0010.793
Off-farm income−0.0010.0010.159−0.0010.0010.158
Own transport−0.4700.3800.216−0.1670.1210.168
Credit access−0.4540.2230.042 **−0.1680.0770.031 **
_cons−1.6830.6450.009 ***
Log likelihood = −119.86079 ***; Pseudo R2 = 0.2762; LR chi2(14) = 91.49; n = 243. Note: *, **, and *** means the coefficient is statistically significant at 10%, 5%, and 1% levels, respectively.
Publisher’s Note: MDPI stays neutral with regard to jurisdictional claims in published maps and institutional affiliations.

