Article

The Study of Sustainable Rural Development in Taiwan—A Perspective of Causality Relationship

1
College of Continuing Education, Chang Jung Christian University, Tainan City 71101, Taiwan
2
Department of Business Management, National Sun Yat-sen University, Kaohsiung City 80424, Taiwan
3
Ph.D./Master Program in Business and Operations Management, College of Management, Chang Jung Christian University, Tainan City 71101, Taiwan
*
Author to whom correspondence should be addressed.
Agriculture 2022, 12(2), 252; https://doi.org/10.3390/agriculture12020252
Submission received: 28 December 2021 / Revised: 30 January 2022 / Accepted: 7 February 2022 / Published: 10 February 2022
(This article belongs to the Section Agricultural Economics, Policies and Rural Management)

Abstract

:
From the perspective of sustainable development and based on literature review, this paper introduces modified Delphi and Decision Making and Trial Evaluation Laboratory (DEMATEL) to explore the critical factors of sustainable development in rural areas and their correlation. Through literature review and modified Delphi analysis, nine key factors of rural sustainable development are first identified, namely industrial activation, working environment, living conditions, infrastructure, public involvement, rural culture, government-related departments, educational resources, and health and welfare. DEMATEL is then adopted to determine the classification of the aforementioned factors, in which four (government-related departments, public involvement, infrastructure, and educational resources) are classified in the cause group and five (health and welfare, living conditions, rural culture, working environment, and industrial activation) are classified in the effect group. According to the centrality and relation of these factors, the causal network diagram is finally drawn before making practical suggestions based on the overall results, with a view to providing a reference for decision-makers in their follow-up rural sustainable development planning.

1. Introduction

In their quest for sustained economic and technological growth and breakthroughs, countries are facing challenges such as the depletion of natural resources, destruction of the natural environment, and poverty resulting from the unequal distribution of wealth [1,2]. The concept of sustainable development (SD) has been put forward in the context of excessive consumption of natural resources and degradation of the living environment, but a surging global population [1,3,4].
The concept of SD dates back to the United Nations Conference on the Human Environment (UNCHE) held in Stockholm, Sweden, in 1972. In 1980, in the World Conservation Strategy, jointly published by the International Union for Conversation of Nature and Natural Resources (IUCN), the United Nations Environment Programme (UNEP) and the World Wide Fund for Nature (WWF), concepts such as sustainability and conservation were incorporated into the development process, marking the official emergence of the term “sustainability”. The World Commission on Environment and Development (WCED) was founded in 1983 and concisely defined SD at the Brundtland Commission in 1987 as “the development that meets the needs of the present generation without compromising the ability of future generations to meet their own needs. It is the advocacy of standards of consumption within the ecologically possible range and of all possible ranges of consumption and standards to which all people can reasonably aspire. In this regard, sustainable development in the narrow sense means social equity between generations, provided with a reasonable extension of equity within each generation” [1,5]. At the Earth Summit held in Rio de Janeiro, Brazil in 1992, the United Nations Conference on Environment and Development (UNCED) expressed its support for SD and issued the Rio Declaration to promote the global SD together with Agenda 21. Apart from strategies aimed at continuing to provide adequate natural resources and living environment for future generations by preventing further destruction of the Earth’s environment, it was emphasized that SD was not only an option but also a requirement to be accepted [2]. Since then, the concept and connotation of SD have been introduced into multiple research fields as well as being a hot topic in itself [6,7,8,9].
Given the role of agriculture and rural development in human existence, habitation, and civilization, as well as the impacts of urbanization, population ageing and migration, global shift in production, the rise of emerging economies, climate change, poverty, malnutrition and poor quality of life on rural areas, the sustainable development of agriculture and rural areas is receiving extensive concern [10,11,12]. Also, in their 2019 report, the Organisation for Economic Co-operation and Development (OECD) and the International Food Policy Research Institute (IFPRI) noted that rural populations accounted for 45% of the world’s population and 70% of extreme poverty, implying the enormous poverty, malnutrition, and poor living conditions experienced by rural populations. In alleviating these difficulties and crises, rural revitalization and redevelopment is the main path to addressing climate change and achieving the sustainable development goals (SDGs) [10,13]. Take Taiwan as an example: rural areas in Taiwan are facing various impacts, such as the decreasing of agricultural output value and rural exodus, due to industrialization and globalization. The government of Taiwan also put lots of effort and resources to impetus rural SD for improving aspects of the economy, environment, resilience, and living conditions of rural areas. These impetuses for improving aspects also match SDGs of industry, innovation and infrastructure, responsible consumption and production, life on land, and sustainable cities and communities.
Hence, based on the Triple Bottom Line model of SD, i.e., environment, economy, and society, a large number of studies have been carried out to explore and provide corresponding suggestions on rural SD issues. At the environmental level, there is an assessment of rural SD environmental indicators, a discussion of the relationship between environmental quality and rural SD, and an analysis of rural SD environmental service strategies [14,15]. At the economic level, there is an exploration of the conditions and factors for the sustainable economic development of rural areas, as well as a study of rural SD from the perspectives of tourism, eco-economy, and economic-appraisals [16,17]. At the social level, there is a discussion on the social sustainability of the agricultural system, as well as an exploration of rural SD from the perspectives of social farming and social innovation [18,19]. In addition to the Triple Bottom Line model, some studies have analyzed the top-down and bottom-up implementation mechanisms and outcomes of government agencies for rural SD from the perspective of government and policy [11,20,21,22,23,24]. Other topics include the impact of modernization on rural SD [25,26], the application of Information and Communications Technology (ICT) in rural SD [27], networking in rural SD [28,29,30], and land use in rural SD [31,32,33].
In view of the extensive connotation of rural SD [34,35,36], some suggestions on the practice of SD in rural areas have been made by studying the construction of rural SD indicators, and the follow-up formulation direction of SD policies and strategies in rural areas has been put forward according to the indicators or measurement results [35,37,38,39,40].
Nevertheless, due to the increasing influence factors of rural SD and limited funding and manpower, the difficulty of addressing new challenges while immediately improving current rural SD deficiencies should not be underestimated. For this reason, in order to avoid confusion in policy and strategy formulation, this is required to establish an understanding of the relationships and priorities of rural SD factors in advance. However, most of the current rural SD studies have not proposed methods to systematically analyze the factors of rural SD or to identify the relationships and priorities among these factors.
In this regard, this study aims to propose a method of Hybrid Multiple Criteria Decision-making (HMCDM) to explore and analyze the main factors of rural SD and their causal correlation in Taiwan. Furthermore, the study demonstrates the causal network diagram based on analysis results. This will not only help government agencies formulate a rural SD strategy under limited resources but is also expected to expand the field of vision and scope of rural SD and HMCDM research while making up for the shortcomings of current rural SD research [6,41].

2. Materials and Methods

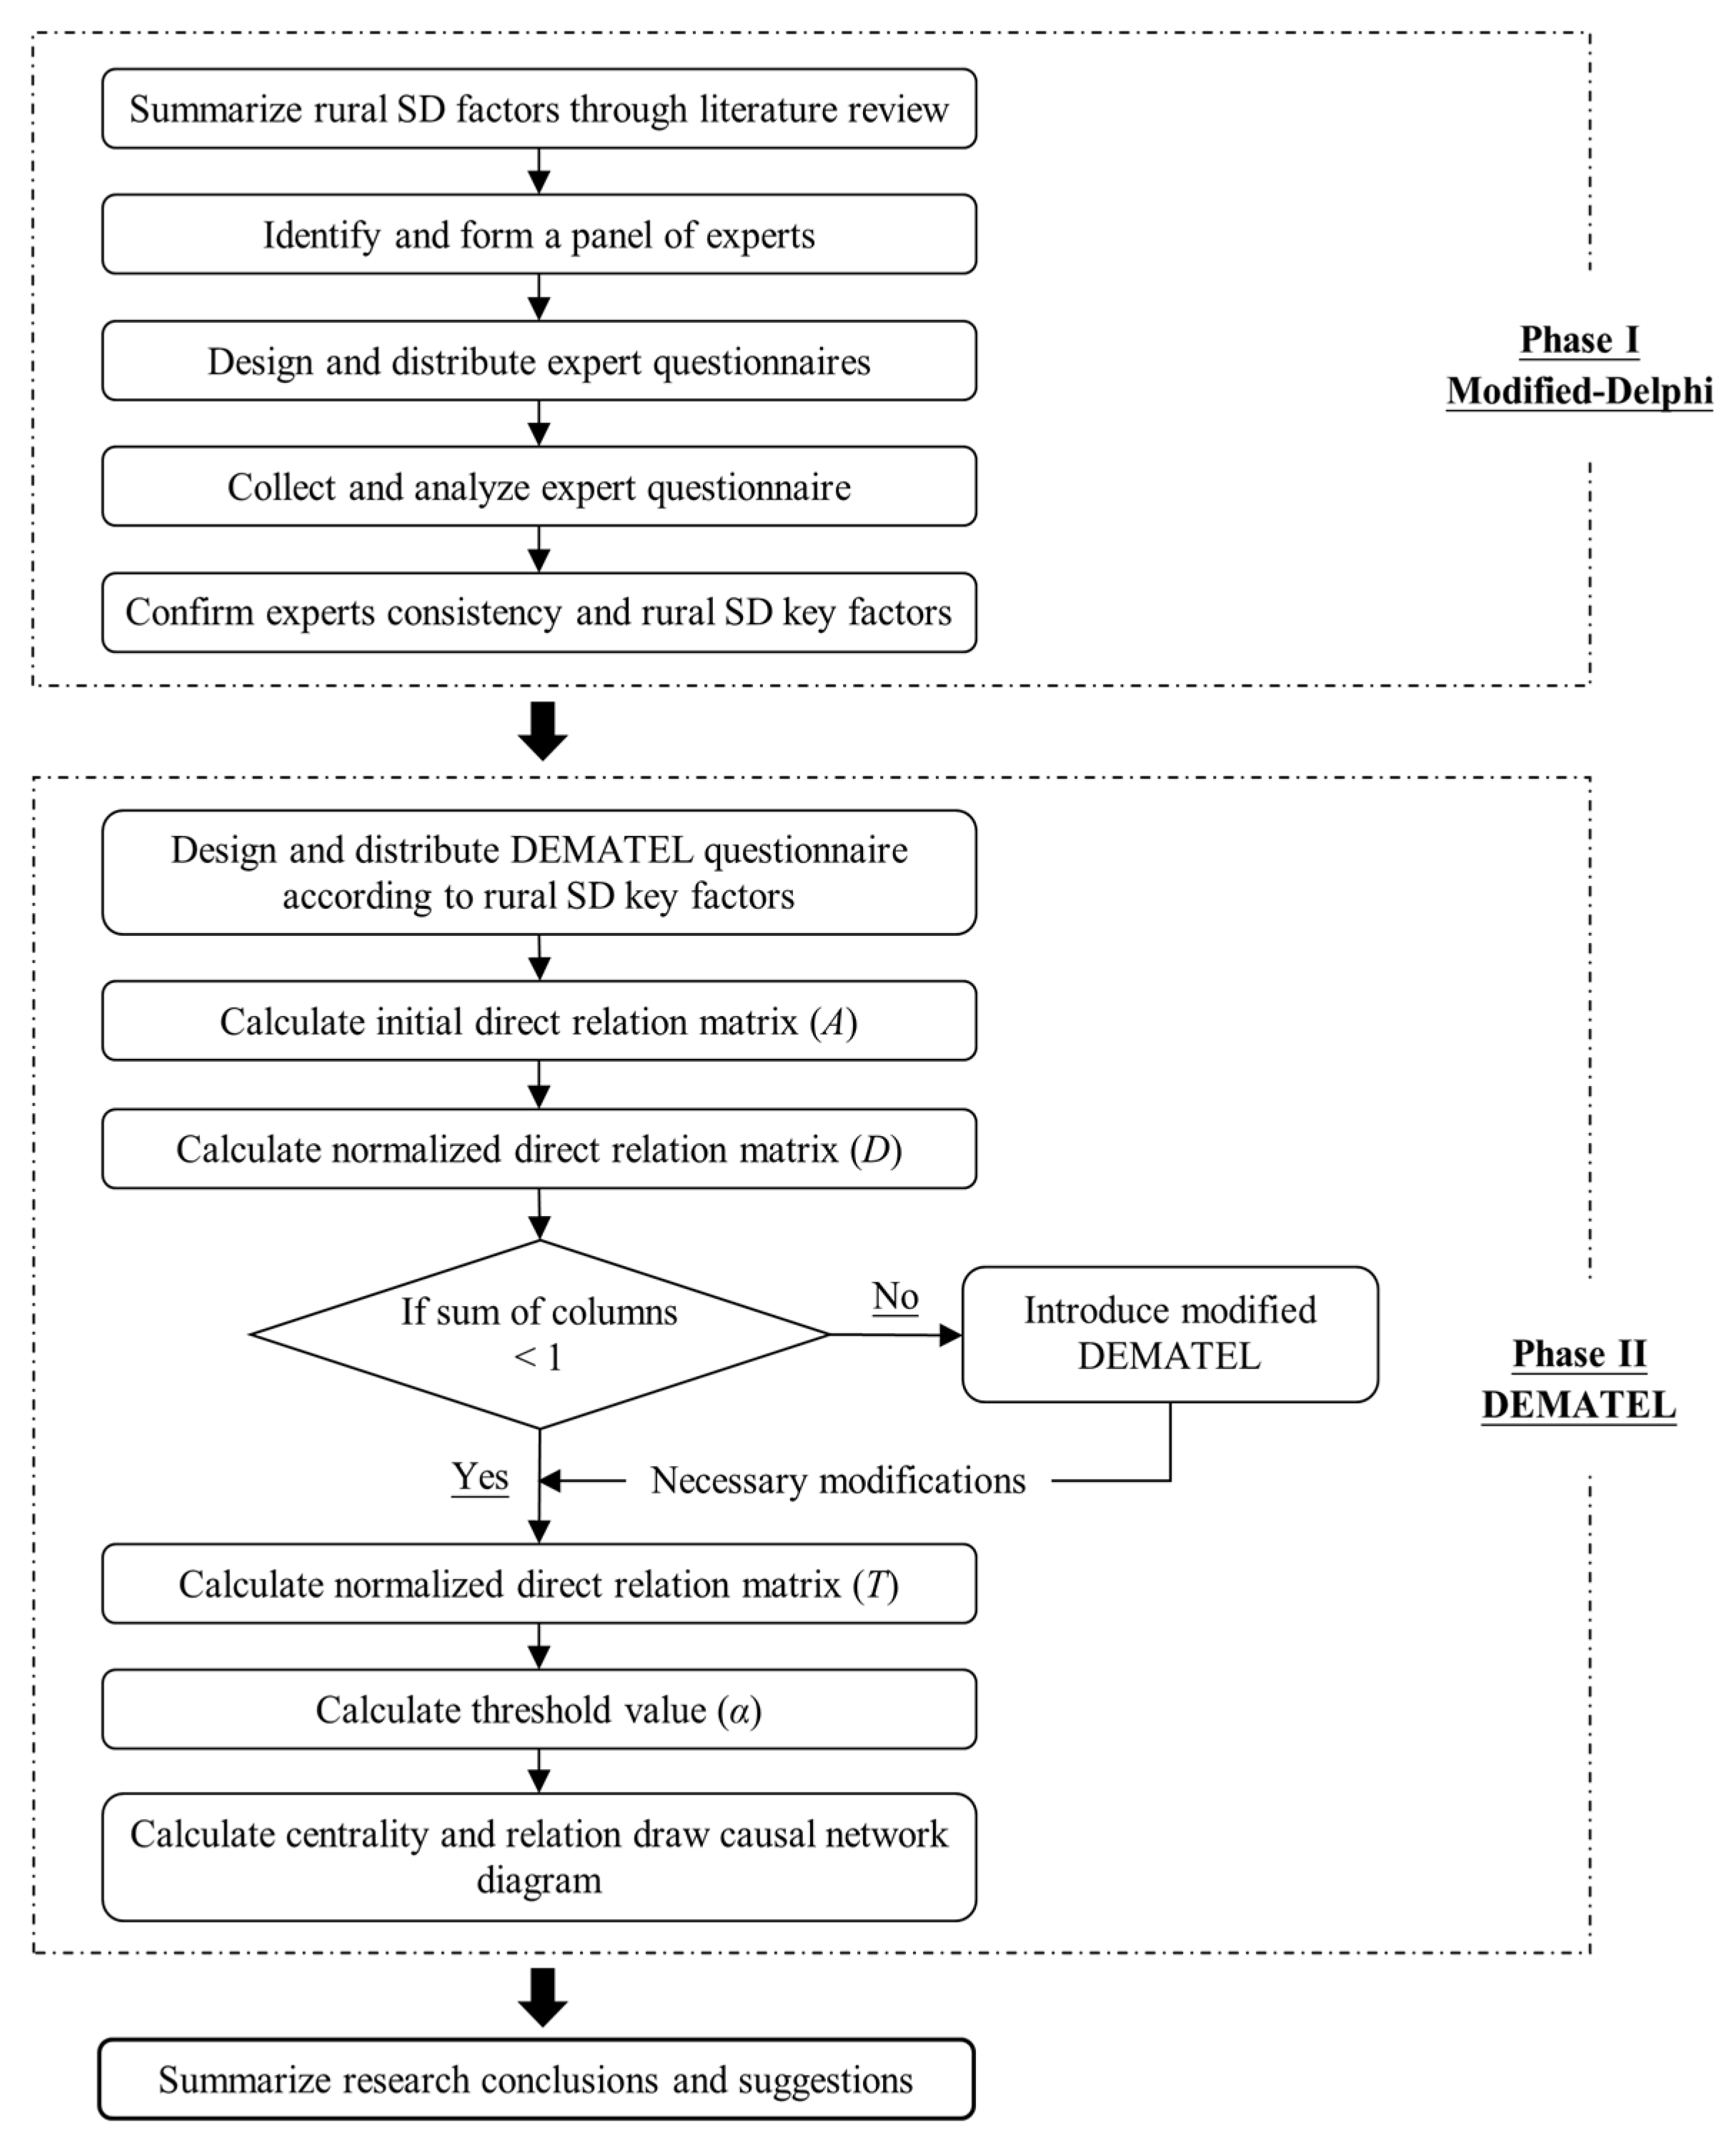
2.1. Proposed Research Framework

As a multifaceted concept, rural SD combines the complexity and uncertainty of sustainability issues, implying the difficulty of exploring and evaluating it [34,35,36]. In this study, a two-phase research framework is established by drawing on Kumar et al. [42] and Singh and Sarkar [43] to introduce modified Delphi and DEMATEL. In the first phase, when modified Delphi is adopted, relevant literature is firstly reviewed to summarize factors affecting rural SD. Through a literature review based on the research topic, 10 rural SD factors are summarized, namely, industrial activation, working environment, living conditions, infrastructure, public involvement, local culture, government-related departments, transportation, educational resources, and health and welfare. Their aspect of SD and definitions are shown in Table 1 [3,35,36,39].
After summarizing 10 rural SD factors through a literature review, an expert panel of 12 experts and scholars familiar with the topic was formed, which included 6 officers from 3 gold medal competition rural communities, 4 officers from 2 rural communities of government rural rejuvenation project, 2 retaining young farmers, and 2 professors who had executed rural rejuvenation project. Two questionnaires with Likert Scale were designed for modified Delphi and DEMATEL analysis. In modified Delphi, a 7-point scale evaluated the importance of 10 rural SD factors (1 = low importance, 4 = medium importance, and 7 = high importance). In DEMATEL, an 8-point scale evaluated the influence of 10 rural SD factors (0 = no influence, 1 = low influence, and 7 = high influence). The modified Delphi questionnaire was distributed and collected to analyze expert opinions until a consensus was reached, and the key factors for rural SD were finally identified based on the analysis results.
In the second phase, when DEMATEL was implemented, the questionnaire was designed according to the key rural SD factors identified in the first phase and distributed to experts. After the questionnaire was collected, the panel opinions were summarized and the initial direct relation matrix (A), normalized direct relation matrix (D), total impact relation matrix (T), and threshold value (α) were calculated in sequence. The centrality and relation of factors was finally calculated to plot causality. The research framework of the study is shown in Figure 1.

2.2. Modified Delphi Technique

Developed in the 1950s by Dalkey and Helmer of the Research and Development (RAND) Corporation, the Delphi Method was first applied to military forecasting. In case of a difficult and complex problem in the context of uncertain information and knowledge, the knowledge and opinions of groups of experts, scholars, and others was pooled to build consensus for the analysis, prediction, and evaluation of solutions and for the planning of future policies [44,45]. The Delphi Method has been introduced into many fields of research due to its advantages of anonymous feedback, repeatability, freedom from geographical distance, group consensus, and quantification [44,46,47].
Modified Delphi is adopted in this paper. With a similar connotation to the Delphi Method, modified Delphi distinguishes itself by changing its open-ended questionnaire in the first round to the development of a semi-structured or structured questionnaire based on literature review or expert interviews. This shortens the study time while alleviating the Delphi Method’s drawbacks, such as long time of measurement, difficulty in tracking progress, and inconsistent expert opinions [48,49,50].
Modified Delphi basically consists of the following five steps:
Step 1. Set goals and needs and design the questionnaire: Set research objectives and requirements, collect and sort the required data through literature review according to the research topic, and design the questionnaire with the Likert Scale.
Step 2. Form a panel of experts: Form a panel of experts by identifying and contacting experts and scholars familiar with the research topic, and establish as much understanding of the topic as possible through a detailed explanation to ensure follow-up implementation.
Step 3. Distribute and collect the questionnaire: Distribute the questionnaire designed according to research objectives and needs and literature review to the experts for investigation.
Step 4. Summarize and analyze expert opinions: Collect expert opinions based on the returned questionnaires for quantitative analysis, and seek expert responses, supplements or amendments.
Step 5. Confirm the consistency of experts’ questionnaires: Put together the experts’ opinions to confirm whether a consensus is reached. Modified Delphi will be considered completed in case there is a consensus; otherwise, the questionnaire is revised according to expert responses or corrections before repeating Step 3 and 4 to form a consensus. Determine if a consensus has been reached based on quartile deviation and average difference [49,50,51].

2.3. Decision Making and Trial Evaluation Laboratory (DEMATEL)

To find solutions to complex and difficult problems, such as race, hunger, environment, and energy, the Battelle Memorial Institute Geneva developed DEMATE between 1972 and 1976 to run the Science and Human Affairs Program [52,53,54,55]. According to the characteristics of objective things or problems, DEMATEL verifies the causality among factors, attributes, variables, and criteria, and establishes a network relationship map (NRM) based on the knowledge and judgment of experts and scholars in a hierarchical structure. Unknown and complex causal links are thus clarified to facilitate the reflection and development of response plans and strategies [56,57,58,59,60].
DEMATEL runs in the following five steps:
Step 1. Define factors and evaluation scales: Define factors through literature review, brainstorming, or expert opinion collection. Experts and scholars determine the degree of correlation between factors and usually mark them on a scale of 0 to 4, with 0 representing no impact, 1 representing very low impact, 2 representing low impact, 3 representing high impact, and 4 representing very high impact.
Step 2. Calculate the initial direct relation matrix (A): After defining the correlation and impact degree among factors, experts and scholars will conduct comparisons between them, such as between factor i (i = 1, 2, … n) and factor j (j = 1, 2, … n), and produces n. The nonnegative matrix of size n  a k = a i j k , where 1 k H . The initial direct relation matrix (A) is calculated by summing and averaging the matrix results H judged by experts and scholars, as shown in Equation (1):
A = 1 H [ a 11 a 1 j a 1 n a i 1 a i j a i n a n 1 a n j a n n ]
Step 3. Calculate the normalized direct relation matrix (D): Multiply the initial direct relation matrix (A) by the normalization S to get the normalized direct relation matrix (D). The calculation formula of S is shown in Equation (2), and that of the normalized direct relation matrix is shown in Equation (3):
S = m i n [ 1 m a x i = 1 n a i j , 1 m a x j = 1 n a i j ]
D = A · S
Step 4. Establish the total impact relation matrix (T): Calculate the total impact relation matrix (T) with D ( I D ) 1 in Equation (4), and calculate the threshold value (α) with Equation (5), where I is the identity matrix:
T = D ( I D ) 1
α = i = 1 n j = 1 n [ t i j ] H
Step 5. Calculate factor centrality and relation and draw the causal network diagram: Calculate the sum of rows ri (Equation (6)) and the sum of columns cj (Equation (7)) of factors according to the total impact relation matrix (T). ( r i + c j ) represents prominence, indicating the degree of influence and being influenced by this factor; ( r i c j ) is the relation. A positive value implies that the factor is “cause”, while a negative value implies that it is “effect”. Filter out inconspicuous or minimal influence values in the total impact relation matrix (T) with threshold value (α), and draw causal network diagram according to centrality and relation values:
r = [ r i ] n · 1 = [ i = 1 n t i j ] n · 1
c = [ c j ] 1 · n = [ j = 1 n t i j ] 1 · n

3. Results

3.1. Phase I: Modified Delphi Analysis

3.1.1. The Experts’ Questionnaire Survey of the First Round

After clarifying the content and purpose of this study and consulting 12 experts and scholars, the modified Delphi expert questionnaire was designed by Likert 7 Scale according to 10 rural SD factors and distributed for the first round. All 12 questionnaires are collected for analysis, with results as shown in Table 2.
According to analysis results of the first-round questionnaire in Table 2, the working environment has the highest average among experts and scholars (6.524), followed by industrial activation, infrastructure, health and welfare, educational resources, local culture, and government-related departments (6.476, 6.238, 6.238, 6.190, 6.095, and 6.048, respectively). The averages of transportation, public involvement, and living conditions are less than 6 (5.952, 5.714 and the lowest 5.571, respectively).
On the whole, the averages of all 10 factors are above 5, suggesting that they are fairly stable. According to the quartile deviation standard proposed by Hollden and Wedman [51], experts have a high degree of consistency on the seven factors with quartile deviations of less than 0.6, namely industrial activation, working environment, living conditions, infrastructure, local culture, educational resources, and health and welfare, and a moderate consistency on the three factors with quartile deviations of 1, namely public involvement, government-related departments, and transportation.
Despite the stability and consistency of the average and quartile deviations of infrastructure and transportation, in the first questionnaire, the panel recommended that transportation be included in the infrastructure in view of Taiwan’s currently developed high-speed railways, railways, and highways. Moreover, the panel proposed to modify local culture into rural culture due to the differences of rural culture because of its development background and course. Referring to the opinions of experts and scholars and the analysis results, this study combines transportation and infrastructure into infrastructure, and modifies local culture into rural culture for the second questionnaire analysis.

3.1.2. The Experts’ Questionnaire Survey of the Second Round

After modification according to suggestions of the panel of the first-round questionnaire, the second-round questionnaire was distributed to the 12-member panel of experts. The analysis results based on the returned questionnaires are shown in Table 3.
As shown in Table 3, working environment and industrial activation have the highest average of 6.762, followed by infrastructure, rural culture, health and welfare, educational resources, and government-related departments, with averages greater than 6 (6.381, 6.333, 6.238, 6.190, and 6.143, respectively). The averages of public involvement and living conditions are both less than 6 (5.762 and 5.667, respectively). In general, the averages of all 9 factors are above 5, suggesting considerable stability. According to the standard of Snape et al. [49], 15% average difference, the differences between the two averages of all 8 factors, are less than 15%, except for the new combined factor of infrastructure. Except for the quartile deviation of government-related departments, which is 1, indicating moderate consistency, the other 8 factors are all less than 0.6, indicating the panel’s consistency on the nine factors.

3.2. DEMATEL Analysis

3.2.1. Define Factors and Evaluation Scales

In the DEMATEL measurement, the DEMATEL expert questionnaire is designed according to the key rural SD factors identified in the first phase of modified Delphi, and the assessment scale is extended to 0–7 to ensure greater consistency with modified Delphi. Where 0 represents no impact, 7 represents high impact, and the others are rated as 1, 2, 3, 4, 5, or 6, respectively, according to the degree of impact.

3.2.2. Calculate the Initial Direct Relation Matrix (A)

Summarize and average the DEMATEL expert questionnaires of 12 experts to obtain the initial direct relation matrix (A), as shown in Table 4.

3.2.3. Calculate the Normalized Direct Relation Matrix (D):

Calculate the column sum of the initial direct relation matrix (A) and divide the value in the matrix by the maximum column sum of 46.09 to get the normalized direct relation matrix (D), as shown in Table 5.

3.2.4. Establish the Total Impact Relation Matrix (T)

Calculate the normalized direct relation matrix (D) and the identity matrix to obtain the total impact relation matrix (T), as shown in Table 6. The threshold value (α) is calculated to be 1.336.

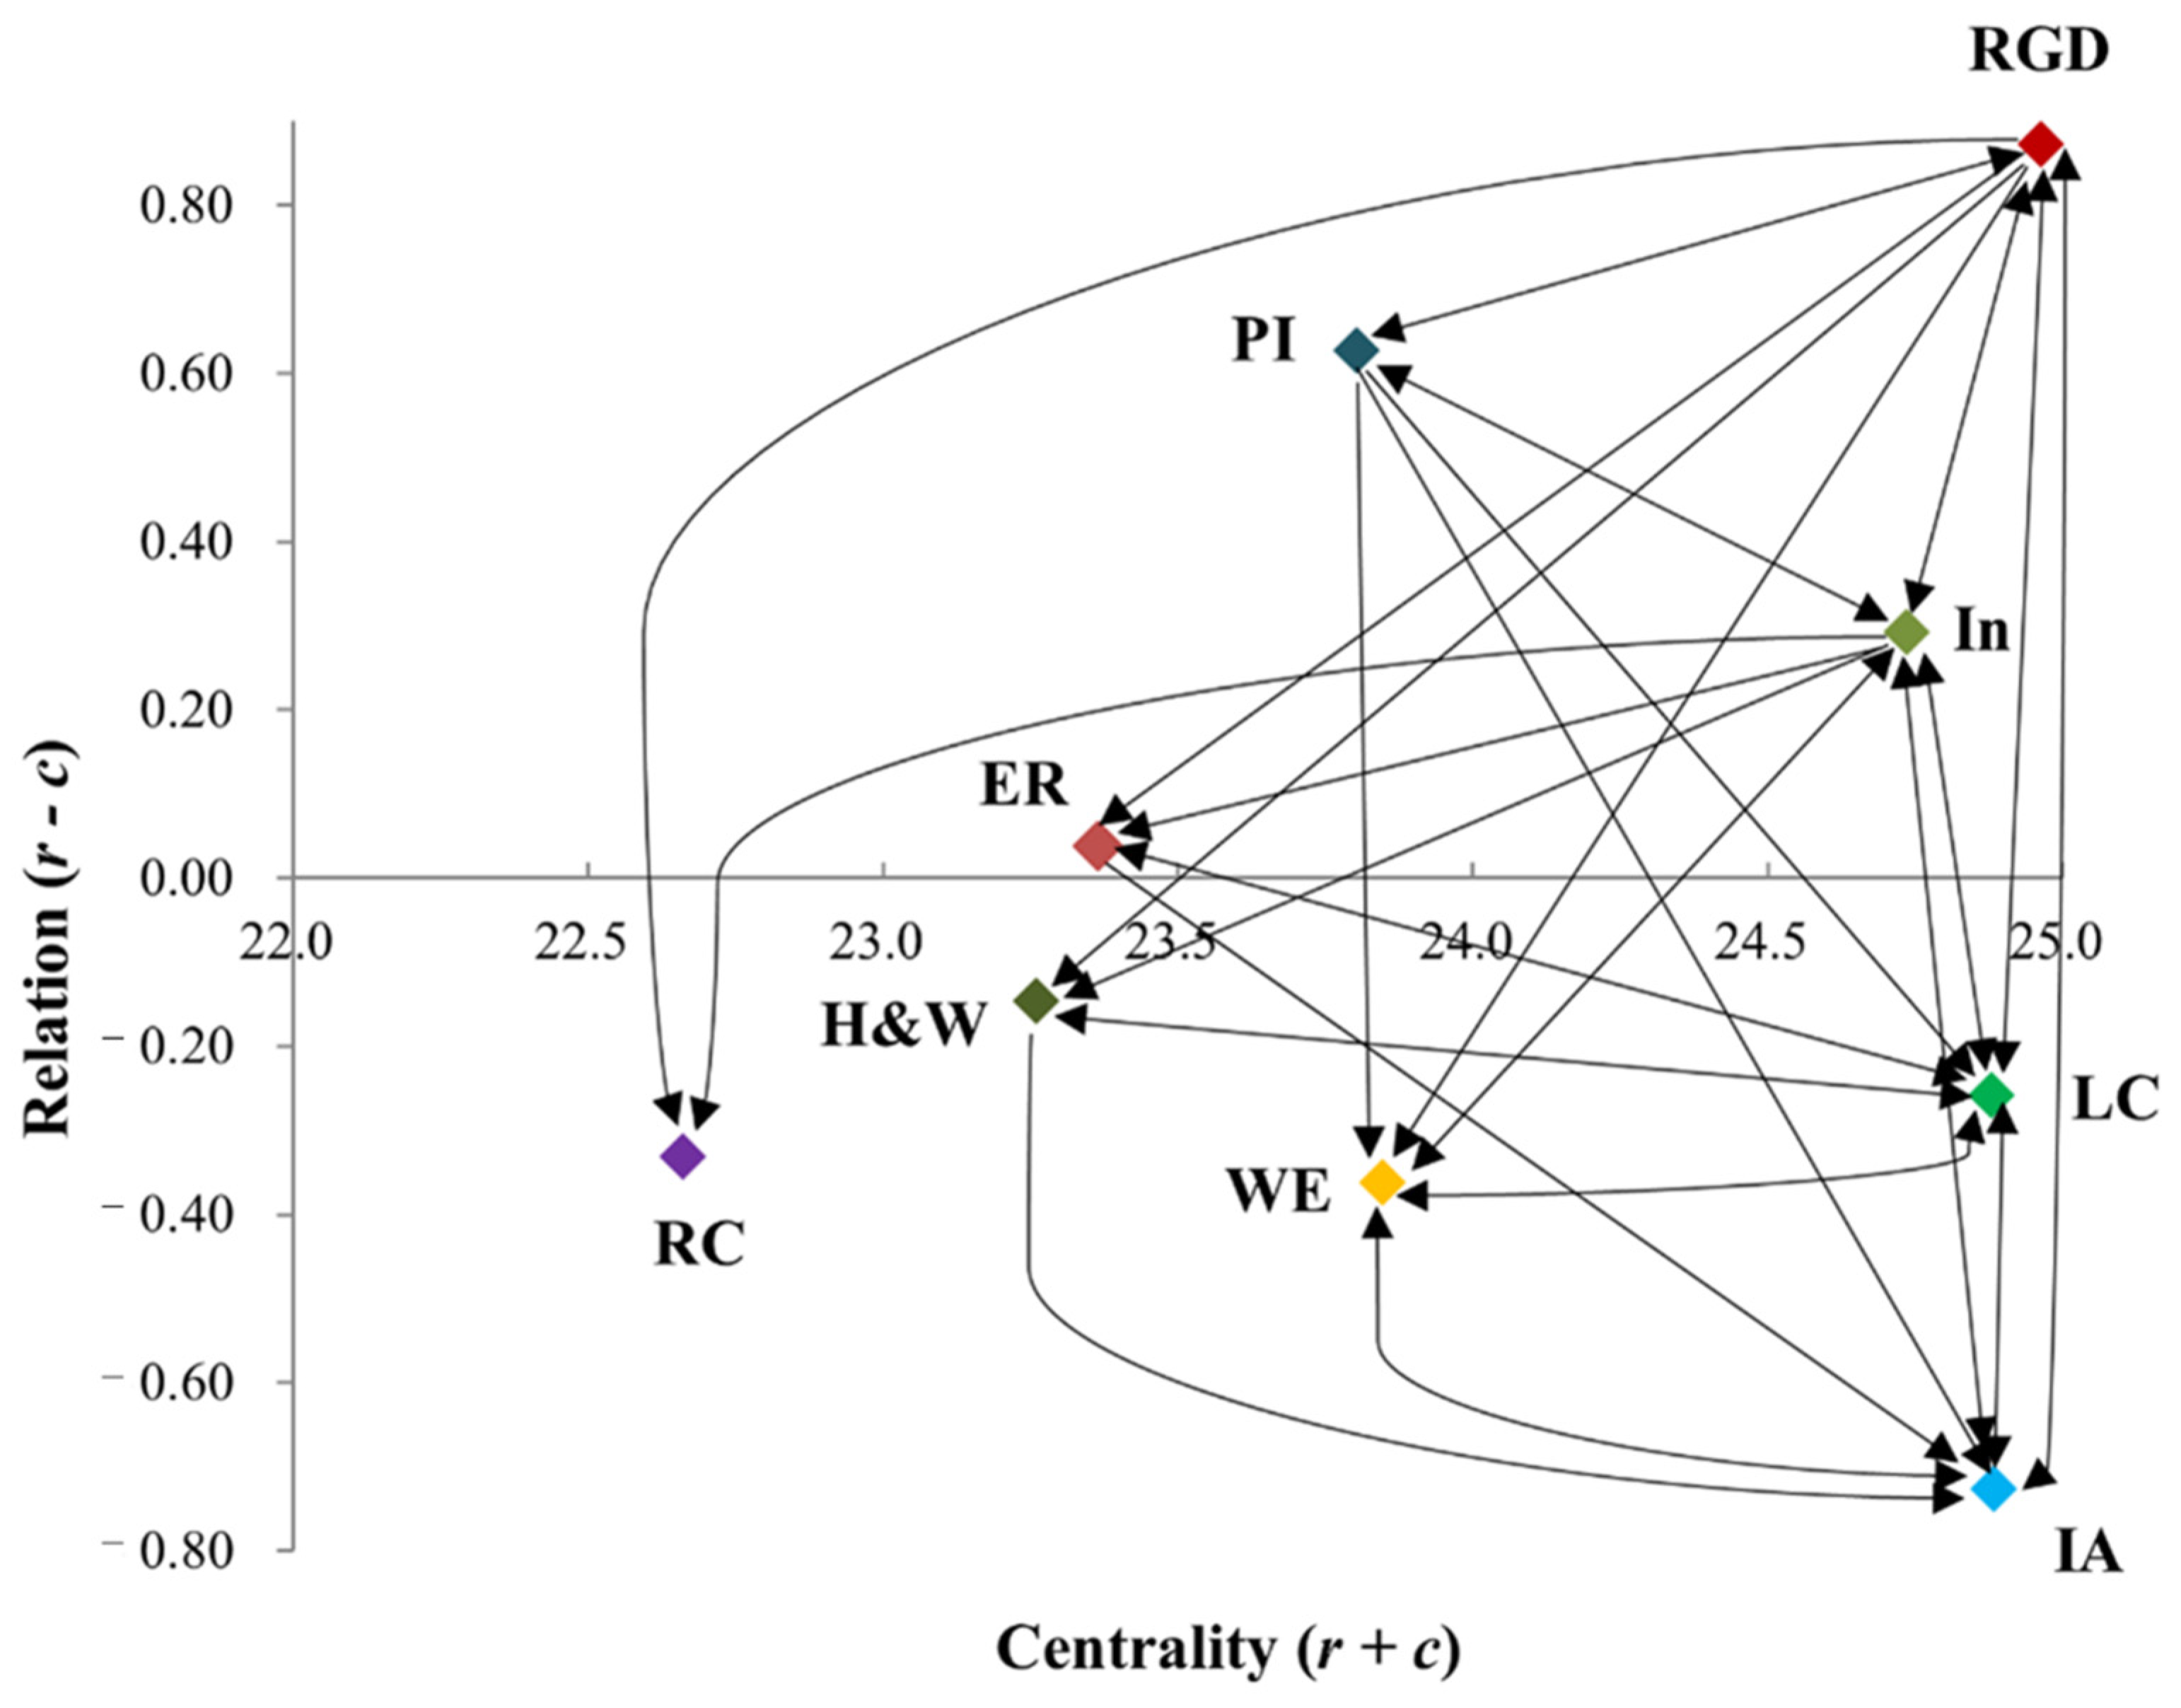
3.2.5. Calculate Factor Centrality and Relation and Draw the Causal Network Diagram

According to the total impact relation matrix (T), the sum of rows (r) and the sum of columns (c) of factors in the matrix are calculated, as shown in Table 7, with their centrality ( r i + c i ) and relation ( r i c j ) being obtained. The causal network diagram of nine factors is drawn by filtering out inconspicuous or minimal influence values in the total impact relation matrix (T) with the threshold value, as shown in Figure 2.
As indicated by the analysis results of DEMATEL, the four factors of government-related departments, public involvement, infrastructure, and educational resources are in the “cause” group, while the five factors of health and welfare, living conditions, rural culture, working environment, and industrial activation are in the “effect” group.

4. Discussion

Based on literature review and the introduction of modified Delphi, this paper firstly summarizes nine factors of rural SD, namely living conditions, infrastructure, public involvement, government-related departments, educational resources, industrial activation, working environment, rural culture, and health and welfare. Through DEMATEL analysis, these factors are then classified and judged for importance, as shown in Table 8.
According to the results of causality analysis, the four factors in the “cause” group are government-related departments, public involvement, infrastructure, and educational resources are in descending order by relation, and government-related departments, infrastructure, public involvement, and educational resources in descending order by centrality.
Not surprisingly, under the condition of rural exodus and resource outages, government-related departments is the crucial factor of rural SD. In the real world, the government of Taiwan not only is the main promoter and founder of rural SD but also holds the discretion of the public involvement and infrastructure development of rural areas. Therefore, three factors, government-related departments, public involvement, and infrastructure have reciprocal causal effects on each other. It is worth noting that educational resources as a factor of the “cause” group mean rural SD cannot just count on the government policy; it also needs impetus from an educational perspective. In the analysis results of DEMATEL, educational resources influence industrial activation and living conditions, which indicate that a commitment to educational resources in rural areas might facilitate industrial activation and subsequently enhance the ability of rural self-reliance.
The five factors in the “effect” group are health and welfare, living conditions, rural culture, working environment, and industrial activation, in descending order by relation, industrial activation, living conditions, working environment, health and welfare, and rural culture in descending order by centrality. From the view of rural SDGs, facilitating industrial activation and improving living conditions and working environment are also major goals that the government of Taiwan wants to achieve for implementing rural SD related plans. Therefore, three factors—industrial activation, living conditions, and working environment—have reciprocal causal effects on each other.
Last but not least, although rural culture has not been included in the “cause” group nor has it been identified as a major factor in the “effect” group, it is of great significance for sustainable development. Culture promotes public involvement and the exercise of citizenship while improving and enforcing patterns of production and consumption. That is, it influences and, more importantly, connects the three dimensions of sustainability, i.e., society, economy, and environment [16,61]. Still, culture has received less attention and discussion than other rural sustainable development factors [61,62]. Follow-up studies are therefore expected to focus on the impact and contribution of cultural factors to rural sustainable development.

5. Conclusions

According to DEMATEL analysis results, government-related departments, public involvement, and infrastructure are important factors in the “cause” group, suggesting their critical and decisive influence on rural SD. Therefore, suggestions for subsequent sustainable development of rural areas are put forward from the following three aspects.

5.1. Facilitate Cooperation and Support between Government-Related Departments

Amid trends of industrialization, urbanization, and informatization, agriculture and rural development have been neglected or shelved in most countries. In Taiwan, to promote the modernization and sustainability of agricultural and rural development, the responsibility of rural SD was almost fully authorized by the central government to the Soil and Water Conservation Bureau (SWCB). However, under the situation of no planning and drawing up of rural SD plans with other governmental departments, such as transportation, health and welfare, labor, and education, many problems and conflicts are emerging while implementing rural SD plans, especially when it comes to urban versus rural development. Therefore, rural SD should not be a matter of just the agricultural sector. Instead, it needs all government-related departments to work together to accelerate the goals of sustainable rural development through policy promotion, resource allocation, and continuous monitoring [21,38,63].

5.2. Promote and Strengthen Public Involvement

Apart from the unprecedented gap between urban and rural areas, urbanization has brought about the aging of rural population and labor migration. The resulting lack of human resources is one of the major difficulties and bottlenecks facing rural sustainable development [64]. This requires government-related departments to make efforts to attract commitment to rural construction and development while enhancing the cohesion of rural residents and their willingness to participate in rural development activities through cooperation and integration, thereby achieving the ultimate goal of independent rural operation.

5.3. Infrastructure

Given its close connection to human life, infrastructure has significant positive or negative impacts on the three dimensions of sustainability, i.e., environment, society, and economy, in both urban and rural areas, implying the need for sound consideration, planning, design, delivery, and disposal schemes [65,66]. In view of this, efforts should be made to minimize the negative impact and maximize the positive impact on economy, society, and environment when adding or updating rural infrastructure based on current infrastructure deficiencies.
Lastly, since the rural SD is a multifaceted and multidimensional concept, it is hard to be defined through specific variables or concrete quantitative indices. The study summarized, defined, and identified nine factors of the rural SD through a literature review and modified Delphi analysis and tried to contribute by conducting a preliminary exploration of causal relations between rural SD factors. The completeness and specification of factors and definitions might still have room for improvement, and it is also the limitation of this study. Therefore, future studies could look for more variables, indices, and even methods to break through this limitation and expand a new research direction for rural SD.

Author Contributions

Conceptualization, C.-C.L. and T.-Y.W.; methodology, C.-C.L. and T.-Y.W.; software, C.-C.L. and T.-Y.W.; data curation, C.-C.L., C.-T.L. and T.-Y.W.; investigation, C.-C.L., C.-T.L. and T.-Y.W.; formal analysis, C.-C.L. and T.-Y.W.; validation, C.-T.L., Y.-F.G. and K.-N.C.; writing—original draft preparation, C.-C.L., Y.-F.G. and T.-Y.W.; writing—review and editing, C.-C.L., Y.-F.G. and T.-Y.W.; visualization, K.-N.C. and T.-Y.W.; resources, C.-C.L. and T.-Y.W.; funding acquisition, C.-C.L.; project administration, C.-C.L. and T.-Y.W.; supervision, C.-C.L. and T.-Y.W. All authors have read and agreed to the published version of the manuscript.

Funding

This research was funded by the Soil and Water Conservation Bureau, Council of Agriculture (SWCB), Taiwan (code. SWCB-107-188).

Institutional Review Board Statement

Not applicable.

Informed Consent Statement

Not applicable.

Data Availability Statement

The data presented in this research are available on request from the corresponding author.

Acknowledgments

The authors would like to thank all those who assisted our research and the support from the Soil and Water Conservation Bureau, Council of Agriculture, Executive Yuan (SWCB), Taiwan.

Conflicts of Interest

The authors declare that there are no known conflict of interest associated with this publication.

References

  1. The World Commission on Environment and Development. Our Common Future; Oxford University Press: Oxford, UK, 1987. [Google Scholar]
  2. Sitarz, D. Agenda 21: The Earth Summit Strategy to Save Our Planet; Earth Press: Boulder, CO, USA, 1993. [Google Scholar]
  3. Tasaki, T.; Kameyama, Y. Sustainability Indicators—Are We Measuring What We Ought to Measure? Glob. Environ. Res. 2015, 19, 147–154. [Google Scholar]
  4. Mirshojaeian Hosseini, H.; Kaneko, S. Causality between Pillars of Sustainable Development: Global Stylized Facts or Regional Phenomena? Ecol. Indic. 2012, 14, 197–201. [Google Scholar] [CrossRef]
  5. Redclift, M. The Meaning of Sustainable Development. Geoforum 1992, 23, 395–403. [Google Scholar] [CrossRef]
  6. Zavadskas, E.K.; Govindan, K.; Antucheviciene, J.; Turskis, Z. Hybrid Multiple Criteria Decision-Making Methods: A Review of Applications for Sustainability Issues. Econ. Res. Ekon. Istraz. 2016, 29, 857–887. [Google Scholar] [CrossRef] [Green Version]
  7. Leal Filho, W.; Azeiteiro, U.; Alves, F.; Pace, P.; Mifsud, M.; Brandli, L.; Caeiro, S.S.; Disterheft, A. Reinvigorating the Sustainable Development Research Agenda: The Role of the Sustainable Development Goals (SDG). Int. J. Sustain. Dev. World Ecol. 2018, 25, 131–142. [Google Scholar] [CrossRef] [Green Version]
  8. Pope, J.; Annandale, D.; Morrison-Saunders, A. Conceptualising Sustainability Assessment. Environ. Impact Assess. Rev. 2004, 24, 595–616. [Google Scholar] [CrossRef] [Green Version]
  9. Malkina-Pykh, I.G. Integrated Assessment Models and Response Function Models: Pros and Cons for Sustainable Development Indices Design. Ecol. Indic. 2002, 2, 93–108. [Google Scholar] [CrossRef]
  10. Organisation for Economic Co-Operation and Development. Innovation, Productivity and Sustainability in Food and Agriculture; OECD: Paris, France, 2019. [Google Scholar] [CrossRef]
  11. Hwang, J.; Park, J.; Lee, S. The Impact of the Comprehensive Rural Village Development Program on Rural Sustainability in Korea. Sustainability 2018, 10, 2346. [Google Scholar] [CrossRef] [Green Version]
  12. Erokhin, V.; Heijman, W.; Ivolga, A. Sustainable Rural Development in Russia through Diversification: The Case of the Stavropol Region. Visegr. J. Bioecon. Sustain. Dev. 2014, 3, 20–25. [Google Scholar] [CrossRef] [Green Version]
  13. International Food Policy Research Institute. 2019 Global Food Policy Report; International Food Policy Research Institute (IFPRI): Washington, DC, USA, 2019. [Google Scholar] [CrossRef]
  14. Schultink, G. Critical Environmental Indicators: Performance Indices and Assessment Models for Sustainable Rural Development Planning. Ecol. Model. 2000, 130, 47–58. [Google Scholar] [CrossRef]
  15. Park, J.R.; Stabler, M.J.; Jones, P.J.; Mortimer, S.R.; Tiffin, J.R.; Tranter, R.B. Evaluating the Role of Environmental Quality in the Sustainable Rural Economic Development of England. Environ. Dev. Sustain. 2009, 11, 735–750. [Google Scholar] [CrossRef]
  16. Calabrò, F.; della Spina, L. The Cultural and Environmental Resources for Sustainable Development of Rural Areas in Eco-nomically Disadvantaged Contexts. Economic-Appraisals Issues of a Model of Management for the Valorisation of Public Assets. Adv. Mater. Res. 2013, 869, 43–48. [Google Scholar] [CrossRef]
  17. Weinberg, A.S. Sustainable Economic Development in Rural America Development. Ann. Am. Acad. Political Soc. Sci. 2000, 570, 173–185. [Google Scholar] [CrossRef]
  18. Janker, J.; Mann, S.; Rist, S. Social Sustainability in Agriculture—A System-Based Framework. J. Rural Stud. 2019, 65, 32–42. [Google Scholar] [CrossRef]
  19. Castro-Arce, K.; Vanclay, F. Transformative Social Innovation for Sustainable Rural Development: An Analytical Framework to Assist Community-Based Initiatives. J. Rural Stud. 2020, 74, 45–54. [Google Scholar] [CrossRef]
  20. Furmankiewicz, M.; Janc, K.; Macken-Walsh, Á. The Impact of EU Governance and Rural Development Policy on the De-velopment of the Third Sector in Rural Poland: A Nation-Wide Analysis. J. Rural Stud. 2016, 43, 225–234. [Google Scholar] [CrossRef]
  21. Bjärstig, T.; Sandström, C. Public-Private Partnerships in a Swedish Rural Context—A Policy Tool for the Authorities to Achieve Sustainable Rural Development? J. Rural Stud. 2017, 49, 58–68. [Google Scholar] [CrossRef] [Green Version]
  22. Navarro, F.A.; Woods, M.; Cejudo, E. The LEADER Initiative Has Been a Victim of Its Own Success. The Decline of the Bottom-Up Approach in Rural Development Programmes. The Cases of Wales and Andalusia. Sociol. Rural. 2016, 56, 270–288. [Google Scholar] [CrossRef]
  23. Li, Y.; Westlund, H.; Zheng, X.; Liu, Y. Bottom-up Initiatives and Revival in the Face of Rural Decline: Case Studies from China and Sweden. J. Rural Stud. 2016, 47, 506–513. [Google Scholar] [CrossRef]
  24. De Graaf, H.J.; Noordervliet, M.A.W.; Musters, C.J.M.; de Snoo, G.R. Roadmap for Interactive Exploration of Sustainable Development Opportunities: The Use of Simple Instruments in the Complex Setting of Bottom-up Processes in Rural Areas. Land Use Policy 2009, 26, 295–307. [Google Scholar] [CrossRef]
  25. Kristen, L. The Rural Developmental State: Modernization Campaigns and Peasant Politics in China, Taiwan and South Korea. Ph.D. Thesis, Harvard University, Cambridge, MA, USA, August 2012. [Google Scholar]
  26. Koopmans, M.E.; Rogge, E.; Mettepenningen, E.; Knickel, K.; Šūmane, S. The Role of Multi-Actor Governance in Aligning Farm Modernization and Sustainable Rural Development. J. Rural Stud. 2018, 59, 252–262. [Google Scholar] [CrossRef]
  27. Nayak, S.K.; Thorat, S.B.; Kalyankar, N.V. Reaching the Unreached a Role of ICT in Sustainable Rural Development. Int. J. Comput. Sci. Inf. Secur. 2010, 7, 220–224. [Google Scholar]
  28. Le Blanc, D. Towards Integration at Last? The Sustainable Development Goals as a Network of Targets. Sustain. Dev. 2015, 23, 176–187. [Google Scholar] [CrossRef]
  29. Ammirato, S.; Felicetti, A.M.; Gala, M.D.; Frega, N.; Volpentesta, A.P. Sustainable Development for Rural Areas: A Survey on the Agritourism Rural Networks. In Collaboration in a Data-Rich World; Camarinha-Matos, L.M., Afsarmanesh, H., For-nasiero, R., Eds.; Springer International Publishing: Cham, Switzerland, 2017; pp. 564–574. [Google Scholar] [CrossRef] [Green Version]
  30. Hirschi, C. Strengthening Regional Cohesion: Collaborative Networks and Sustainable Development in Swiss Rural Areas. Ecol. Soc. 2010, 15, 16. [Google Scholar] [CrossRef]
  31. Pašakarnis, G.; Morley, D.; Maliene, V. Rural Development and Challenges Establishing Sustainable Land Use in Eastern European Countries. Land Use Policy 2013, 30, 703–710. [Google Scholar] [CrossRef]
  32. Boron, V.; Payán, E.; MacMillan, D.; Tzanopoulos, J. Achieving Sustainable Development in Rural Areas in Colombia: Future Scenarios for Biodiversity Conservation under Land Use Change. Land Use Policy 2016, 59, 27–37. [Google Scholar] [CrossRef] [Green Version]
  33. Romano, G.; Dal Sasso, P.; Trisorio Liuzzi, G.; Gentile, F. Multi-Criteria Decision Analysis for Land Suitability Mapping in a Rural Area of Southern Italy. Land Use Policy 2015, 48, 131–143. [Google Scholar] [CrossRef]
  34. Boggia, A.; Rocchi, L.; Paolotti, L.; Musotti, F.; Greco, S. Assessing Rural Sustainable Development Potentialities Using a Dominance-Based Rough Set Approach. J. Environ. Manag. 2014, 144, 160–167. [Google Scholar] [CrossRef] [Green Version]
  35. Hedayati-Moghadam, Z.; Eskandar Seidayi, S.; Nouri, H. Bulletin of Environment, Pharmacology and Life Sciences Analysis of Effective Indicators in Rural Sustainability (Case Study: Falavarjan County in Isfahan Province). Environ. Pharmacol. Life Sci. 2014, 3, 123–131. [Google Scholar]
  36. Ottomano Palmisano, G.; Govindan, K.; Loisi, R.V.; Dal Sasso, P.; Roma, R. Greenways for Rural Sustainable Development: An Integration between Geographic Information Systems and Group Analytic Hierarchy Process. Land Use Policy 2016, 50, 429–440. [Google Scholar] [CrossRef]
  37. Mohamed, E.S.; Saleh, A.M.; Belal, A.A. Sustainability Indicators for Agricultural Land Use Based on GIS Spatial Modeling in North of Sinai-Egypt. Egypt. J. Remote Sens. Space Sci. 2014, 17, 1–15. [Google Scholar] [CrossRef] [Green Version]
  38. Shcherbak, V.; Ganushchak-Yefimenko, L.; Nifatova, O.; Fastovets, N.; Plysenko, H.; Lutay, L.; Tkachuk, V.; Ptashchenko, O. Use of Key Indicators to Monitor Sustainable Development of Rural Areas. Glob. J. Environ. Sci. Manag. 2020, 6, 175–190. [Google Scholar] [CrossRef]
  39. Kim, T.-H.; Yang, S.-R. Construction of the Rural Development Index: The Case of Vietnam. J. Rural Dev. 2016, 39, 113–142. [Google Scholar] [CrossRef]
  40. Semenova, N.N.; Busalova, S.G.; Eremina, O.I.; Makeikina, S.M.; Ivanova, I.A. Assessment of Sustainable Development of Rural Areas of Russia. Indian J. Sci. Technol. 2016, 9, 1–6. [Google Scholar] [CrossRef] [Green Version]
  41. Akgün, A.A.; Baycan, T.; Nijkamp, P. Rethinking on Sustainable Rural Development. Eur. Plan. Stud. 2015, 23, 678–692. [Google Scholar] [CrossRef]
  42. Kumar, A.; Kaviani, M.A.; Bottani, E.; Dash, M.K.; Zavadskas, E.K. Investigating the Role of Social Media in Polio Prevention in India: A Delphi-DEMATEL Approach. Kybernetes 2018, 47, 1053–1072. [Google Scholar] [CrossRef]
  43. Singh, P.K.; Sarkar, P. A Framework Based on Fuzzy Delphi and DEMATEL for Sustainable Product Development: A Case of Indian Automotive Industry. J. Clean. Prod. 2020, 246, 118991. [Google Scholar] [CrossRef]
  44. Linstone, H.A.; Turoff, M.; Helmer, O. The Delphi Method Techniques and Applications; Addison-Wesley Publishing Company: Boston, MA, USA, 1975. [Google Scholar] [CrossRef]
  45. Dalkey, N.; Helmer, O. An Experimental Application of the Delphi Method to the Use of Experts. Manag. Sci. 1963, 9, 458–467. [Google Scholar] [CrossRef]
  46. Gbededo, M.A.; Liyanage, K. Descriptive Framework for Simulation-Aided Sustainability Decision-Making: A Delphi Study. Sustain. Prod. Consum. 2020, 22, 45–57. [Google Scholar] [CrossRef]
  47. Whitman, N.I. The Committee Meeting Alternative. Using the Delphi Technique. J. Nurs. Adm. 1990, 20, 30–36. [Google Scholar] [CrossRef]
  48. Custer, R.L.; Scarcella, J.A.; Stewart, B.R. The Modified Delphi Technique—A Rotational Modification. J. Vocat. Tech. Educ. 1999, 15, 50–58. [Google Scholar] [CrossRef]
  49. Snape, D.; Kirkham, J.; Preston, J.; Popay, J.; Britten, N.; Collins, M.; Froggatt, K.; Gibson, A.; Lobban, F.; Wyatt, K.; et al. Exploring Areas of Consensus and Conflict around Values Underpinning Public Involvement in Health and Social Care Research: A Modified Delphi Study. BMJ Open 2014, 4, 4217. [Google Scholar] [CrossRef] [PubMed]
  50. Sobaih, A.E.E.; Ritchie, C.; Jones, E. Consulting the Oracle? Applications of Modified Delphi Technique to Qualitative Re-search in the Hospitality Industry. Int. J. Contemp. Hosp. Manag. 2012, 24, 886–906. [Google Scholar] [CrossRef]
  51. Holden, M.C.; Wedman, J.F. Future Issues of Computer-Mediated Communication: The Results of a Delphi Study. Technol. Res. Dev. 1993, 41, 5–24. [Google Scholar] [CrossRef]
  52. Gabus, A.; Fontela, E. World Problems, An Invitation to Further Thought within the Framework of DEMATEL; Battelle Geneva Research Centre: Geneva, Switzerland, 1972. [Google Scholar]
  53. Fontela, E.; Gabus, A. The DEMATEL Observer; Battelle Geneva Research Centre: Geneva, Switzerland, 1976. [Google Scholar]
  54. Falatoonitoosi, E.; Leman, Z.; Sorooshian, S.; Salimi, M. Decision-Making Trial and Evaluation Laboratory. Res. J. Appl. Sci. Eng. Technol. 2013, 5, 3476–3480. [Google Scholar] [CrossRef]
  55. Si, S.L.; You, X.Y.; Liu, H.C.; Zhang, P. DEMATEL Technique: A Systematic Review of the State-of-the-Art Literature on Methodologies and Applications. Math. Probl. Eng. 2018, 2018, 3696457. [Google Scholar] [CrossRef] [Green Version]
  56. Zhang, W.; Deng, Y. Combining Conflicting Evidence Using the DEMATEL Method. Soft Comput. 2019, 23, 8207–8216. [Google Scholar] [CrossRef]
  57. Li, Y.; Mathiyazhagan, K. Application of DEMATEL Approach to Identify the Influential Indicators towards Sustainable Supply Chain Adoption in the Auto Components Manufacturing Sector. J. Clean. Prod. 2018, 172, 2931–2941. [Google Scholar] [CrossRef]
  58. Kumar, A.; Dixit, G. Evaluating Critical Barriers to Implementation of WEEE Management Using DEMATEL Approach. Resour. Conserv. Recycl. 2018, 131, 101–121. [Google Scholar] [CrossRef]
  59. Hsu, C.W.; Kuo, T.C.; Chen, S.H.; Hu, A.H. Using DEMATEL to Develop a Carbon Management Model of Supplier Selection in Green Supply Chain Management. J. Clean. Prod. 2013, 56, 164–172. [Google Scholar] [CrossRef]
  60. Lee, H.S.; Tzeng, G.H.; Yeih, W.; Wang, Y.J.; Yang, S.C. Revised DEMATEL: Resolving the Infeasibility of DEMATEL. Appl. Math. Model. 2013, 37, 6746–6757. [Google Scholar] [CrossRef]
  61. Nocca, F. The Role of Cultural Heritage in Sustainable Development: Multidimensional Indicators as Decision-Making Tool. Sustainability 2017, 9, 1882. [Google Scholar] [CrossRef] [Green Version]
  62. Bole, D.; Pipan, P.; Komac, B. Cultural Values and Sustainable Rural Development: A Brief Introduction. Acta Geogr. Slov. 2013, 53, 367–370. [Google Scholar] [CrossRef] [Green Version]
  63. Stafford-Smith, M.; Griggs, D.; Gaffney, O.; Ullah, F.; Reyers, B.; Kanie, N.; Stigson, B.; Shrivastava, P.; Leach, M.; O’Connell, D. Integration: The Key to Implementing the Sustainable Development Goals. Sustain. Sci. 2017, 12, 911–919. [Google Scholar] [CrossRef] [PubMed] [Green Version]
  64. Haider, L.J.; Boonstra, W.J.; Peterson, G.D.; Schlüter, M. Traps and Sustainable Development in Rural Areas: A Review. World Dev. 2018, 101, 311–321. [Google Scholar] [CrossRef] [Green Version]
  65. Bacior, S.; Prus, B. Infrastructure Development and Its Influence on Agricultural Land and Regional Sustainable Development. Ecol. Inform. 2018, 44, 82–93. [Google Scholar] [CrossRef]
  66. Thacker, S.; Adshead, D.; Fay, M.; Hallegatte, S.; Harvey, M.; Meller, H.; O’Regan, N.; Rozenberg, J.; Watkins, G.; Hall, J.W. Infrastructure for Sustainable Development. Nat. Sustain. 2019, 2, 324–331. [Google Scholar] [CrossRef]
Figure 1. Proposed Research Framework.
Agriculture 12 00252 g001
Figure 2. The causal network diagram of nine factors.
Agriculture 12 00252 g002
Table 1. Summary of Factors of Rural Sustainable Development.
AspectFactorsDefinitions
EconomyIndustrial activationDevelop and promote rural specific industries, products and production activities derived from other agricultural resources, and promote local production and consumption while enhancing communication with other regions.
EconomyWorking environmentDevelop and promote agricultural technology progress and improve farmers’ employment and the rights and protection of occupational disasters, so as to attract young people to return home and start agricultural business.
EnvironmentLiving conditionsEncourage rural organizations to formulate conventions on administrative and development, and continuously plan for house renovation and overall environmental improvement and maintenance.
EnvironmentInfrastructureUpdate and maintain infrastructure related to energy supply, water supply, drainage, lighting, communications and waste resource recovery, as well as disaster prevention and rescue in rural areas.
SocietyPublic involvementSupport local organizations and activity centres related to rural development and encourage public involvement in rural celebrations and regular events to promote development awareness and cohesion in rural areas.
SocietyLocal culturePreserve and maintain unique historical and cultural attractions, skills and traditional celebrations in rural areas, and promote environmental and cultural heritage in conjunction with local cultural and creative industries.
SocietyGovernment-related departmentsMaintain a clear and smooth liaison and communication process with central and local rural departments to obtain timely responses, support, and solutions to rural development issues.
EnvironmentTransportationEstablish convenient and developed road and rail stations and routes, and develop viable rural tourist routes.
SocietyEducational resourcesEstablish adult and early childhood education and childcare centres in rural areas, and develop and expand agricultural extension education through ongoing collaboration with industry, government, and academia.
SocietyHealth and welfareCarry out planning of medical, health and maintenance facilities, equipment and manpower in rural areas to expand the social and medical security and well-being of farmers.
Data source: Collated by the author.
Table 2. Summary of the First Round Delphi Analysis.
FactorsAverageStandard DeviationModeQuartile Deviation
Industrial activation6.4760.81470.5
Working environment6.5240.81470.5
Living conditions5.5710.87050.5
Infrastructure6.2380.76870.5
Public involvement5.7141.10261
Local culture6.0950.94460.5
Government-related departments6.0481.07171
Transportation5.9521.24471
Educational resources6.1900.98170.5
Health and welfare6.2380.76870.5
Data sources: Collated by the author.
Table 3. Summary of the Second Round Delphi Analysis.
FactorsCodeAverageDifference Ratio (%)Standard DeviationModeQuartile Deviation
Industrial activationIA6.7620.5390.53970
Working environmentWE6.7620.4360.43670
Living conditionsLC5.6670.7960.79660.5
InfrastructureIn6.3810.80570.5
Public involvementPI5.7620.8310.83160.5
Rural cultureRC6.3330.7300.73070.5
Government-related departmentsGRD6.1430.9640.96471
Educational resourcesER6.1900.8730.87370.5
Health and welfareH&W6.2380.8310.83160.5
Data sources: Collated by the author.
Table 4. Initial Direct Relation Matrix (A).
FactorsIAWELCInPIRCRGPERH&WSum
IA06.0005.8105.5245.0954.8575.4765.0954.85742.714
WE6.19006.0955.4764.5244.4294.9054.7145.04841.381
LC5.7625.71405.6195.3335.1435.0005.4295.71443.714
In6.0485.9056.09504.9055.0005.4765.4295.61944.476
PI5.6675.2385.5715.42905.8105.7144.8575.00043.286
RC5.2384.2864.6674.8105.71405.1434.9054.38139.143
GRD6.0955.4295.1906.3815.5715.38106.1435.90546.095
ER5.6194.9525.1435.0004.9525.5245.38104.71441.286
H&W5.0005.2386.0955.0484.7624.3815.5714.524040.619
Data sources: Collated by the author.
Table 5. Normalized Direct Relation Matrix (D).
FactorsIAWELCInPIRCRGPERH&W
IA00.1300.1260.1200.1110.1050.1190.1110.105
WE0.13400.1320.1190.0980.0960.1060.1020.110
LC0.1250.12400.1220.1160.1120.1080.1180.124
In0.1310.1280.13200.1060.1080.1190.1180.122
PI0.1230.1140.1210.11800.1260.1240.1050.108
RC0.1140.0930.1010.1040.12400.1120.1060.095
GRD0.1320.1180.1130.1380.1210.11700.1330.128
ER0.1220.1070.1120.1080.1070.1200.11700.102
H&W0.1080.1140.1320.1100.1030.0950.1210.0980
Data sources: Collated by the author.
Table 6. Total Impact Relation Matrix (T).
FactorsIAWELCInPIRCRGPERH&WTotal
IA1.3311.3741.4191.3781.3041.2901.3581.3121.31212.078
WE1.4131.2241.3881.3421.2601.2491.3131.2721.28211.743
LC1.4681.3931.3321.4031.3311.3181.3741.3411.35012.310
In1.4951.4181.4711.3161.3441.3361.4031.3611.36912.513
PI1.4561.3751.4291.3901.2181.3211.3771.3221.32812.216
RC1.3321.2481.2991.2691.2241.1051.2581.2171.21111.163
GRD1.5401.4511.4991.4811.3961.3831.3391.4141.41512.918
ER1.3981.3161.3661.3291.2641.2651.3171.1751.27111.701
H&W1.3721.3061.3671.3151.2461.2301.3061.2501.16511.557
Total12.80512.10512.5712.22311.58711.49712.04511.66411.703108.199
Note: The threshold value (α) 1.336 = 108.199 ÷ 81. Data sources: Collated by the author.
Table 7. Summary of Factor Centrality and Relation Values.
GroupsFactorsSum of Rows
(r)
Sum of Columns
(c)
Centrality
(r + c)
Relation
(rc)
Cause groupGRD12.91812.04624.9630.872
PI12.21511.58823.8030.627
In12.51412.22224.7360.291
ER11.70011.66323.3630.038
Effect groupH&W11.55611.70323.259−0.147
LC12.31012.56924.879−0.259
RC11.16411.49622.660−0.332
WE11.74212.10623.848−0.363
IA12.07812.80524.883−0.727
Data sources: Collated by the author.
Table 8. Summary of Relation and Centrality Values and Ranking of Nine Factors.
GroupsFactorsRelationRankingCentralityRanking
Cause groupGRD0.872124.9631
PI0.627223.8033
In0.291324.7362
ER0.038423.3634
Effect groupH&W−0.147123.2594
LC−0.259224.8792
RC−0.332322.6605
WE−0.363423.8483
IA−0.727524.8831
Data sources: Collated by the author.
Publisher’s Note: MDPI stays neutral with regard to jurisdictional claims in published maps and institutional affiliations.

