Article

Soil Compaction from Wheel Traffic under Three Tillage Systems

Department of Biosystems Engineering, University of Manitoba, Winnipeg, MB R3T 2N2, Canada
*
Author to whom correspondence should be addressed.
Agriculture 2022, 12(2), 219; https://doi.org/10.3390/agriculture12020219
Submission received: 8 December 2021 / Revised: 28 January 2022 / Accepted: 31 January 2022 / Published: 3 February 2022
(This article belongs to the Special Issue Design and Application of Agricultural Equipment in Tillage System)

Abstract

:
Agricultural fields are usually subjected to high amounts of traffic from field operations. The influence of traffic on sandy loam soil in three tillage systems were investigated in a field experiment. The field was located in a Canadian prairie region. In the experiment, the treatments were three tillage systems: no-tillage, disc tillage, and spring-tine tillage. Following tillage operations, field plots were trafficked with one pass of a sub-compact tractor. Soil properties were measured before and after the traffic to examine the effects of tillage systems and wheel traffic. For the effects of the tillage systems on the soil bulk density, soil shear strength, soil surface resistance, and soil cone index, the no-tillage system had higher values for all the soil properties when compared with the disc and spring-tine tillage systems. The plant (canola) population density ranged from 18.2 plants/m2 to 34.9 plants/m2, with the no-tillage having the lowest plant densities. For the effects of wheel traffic, one pass of the tractor in the disc and spring-tine tillage plots resulted in a 2.7% and 17.4% reduction in soil moisture content, respectively. After wheel traffic, the average soil shear strength for the disc and spring-tine systems were still significantly lower than the no-tilled system. Sinkages of 40 and 50 mm were observed for the spring-tine and disc tillage systems, respectively. The results of this study highlight the importance of preventing the demerits of soil compaction induced by wheel traffic after tillage operations.

1. Introduction

Tillage operations such as harrowing, ploughing and pulverization of soil crust [1] are usually performed under conventional tillage practises. One of the main purposes of tillage is to loosen the soil for good seedbed conditions. However, a subsequent field operation such as seeding or chemical spraying can compact the loosened soil, erasing the benefit of the tillage. The wheel traffic will alternate the structure of the topsoil layer [2]. Existing studies have been focusing on soil property changes caused solely by different trafficking scenarios, such as by large or small tractors, or different numbers of passes of tractors, in the same field condition. There is a lack of documentation on the soil property changes by trafficking on differently tilled soil conditions, especially in Canadian prairie regions. This study aimed to fill this gap by investigating the effects of trafficking under three different tillage systems.
To avoid soil compaction problems, agricultural producers use different tillage systems such as conventional and conservation tillage systems [3]. No-tillage and minimum tillage systems fall under conservation tillage systems due to reduced reliance on farm machinery for soil tiling purposes. On the other hand, conventional tillage systems rely heavily on farm machinery for seedbed preparations. A conventional tillage system would require more than 20% of the total traffic experienced before seeding operations, as this tillage system often consists of both primary and secondary tillage activities [4]. Disc and spring-tine tillage systems are generally associated with secondary tillage practices. These systems are generally used due to their quick work rates and low draft [5]. There are some demerits associated with both disc and spring-tine tillage systems, such as the ineffective burial of crop residue or weeds and soil smearing [5]. However, tillage involving one pass of such implements (disc or spring-tine harrows) can be classified as a reduced tillage system and, in turn, is beneficial for soil conservation. In addition, the low draft associated with these implements allow agricultural producers to use smaller tractors for tillage operations. Thus, disc and spring-tine tillage systems, together with the no-tillage system were selected in this study. Wheeling or traffic from seeding operations after tillage can affect the soil properties. For example, the increased intensity of tractor movements (traffic) on a field can decrease soil porosity which can lead to improper aeration and drainage, increased soil strength, and impedance of root growth [6,7]. All these may have adverse effects on plant growth and crop yield.
Understanding the influence of traffic or wheeling events under different tillage systems are very important in reducing severe soil compaction. Alaoui and Helbling [8] studied the soil compaction effects on the soil structure, and the results showed that traffic caused severe soil compaction from the soil surface to the 0.10 m depth resulting in the collapse of the soil structure. This stopped or reduced water flow movement from the topsoil layer to the subsoil layer. Moreover, Villanueva et al. [9] observed a 23% decrease in the soil moisture content in the conventional tillage system when compared to the zero tillage and minimum tillage systems. The conventional tillage systems experienced more tractor passes than the other tillage systems investigated.
In terms of the effect of soil compaction on the soil properties, Botta et al. [10] studied the effect of the number of tractor passes on the soil cone index in two tillage systems. That study inferred that irrespective of the mass and size of the tractor used, the cone index was observed to be higher in the conventional tillage system as compared to the direct sowing system (zero tillage). Zhang et al. [11] observed an increase in the soil bulk density and soil penetration resistance with an increase in tractor movement intensity and axle loads when studying the influence of small tractor traffic on soil compaction in northeast China. Lastly, Samuel and Ajav [1] also observed an increase in soil bulk density and soil strength when the number of tractor passes increased. Consequently, the soil compaction from the traffic intensity decreased soil porosity and soil moisture content.
In a nutshell, the aforementioned research studies did not focus on sandy loam soil found in the Canadian prairie regions. Additionally, other research studies made conclusions based on only crop yield and root growth [4,12,13]. However, the studies also involved clayey and Stagnic Luvisol soils and mostly focused on how different tire characteristics and configurations affected soil properties without considering the effect of the different tillage systems. The aim of the research study was to investigate the influence of traffic or wheeling events on sandy loam soil in a Canadian prairie region. The specific objectives of this study were to conduct a field experiment to study (1) the effect of no-tillage, disc tillage, and spring-tine tillage systems on the soil properties and plant population density, and (2) the effect of soil compaction across different tillage systems on soil properties.

2. Materials and Methods

2.1. Description of Test Equipment and Experimental Field

A John Deere 1023e sub-compact tractor was used for the experiment. The total mass of the tractor was 656 Kg. The tires (Carlisle® multi-trac C/S) were generally elastic and composed of polyurethane rubber material. The front and rear tires had a four-ply and six-ply rating, respectively, and the corresponding recommended inflation pressures were 151.7 and 206.8 KPa. The front tire had a diameter, width, and rim width of 0.47, 0.21, and 0.15 m, respectively. The diameter, width, and rim width of the rear tire were 0.65, 0.29, and 0.22 m, respectively. The tillage equipment included a double-action disc harrow and a spring-tine cultivator. The double-action disc harrow was a type of disc harrow with four gangs arranged in tandem (Figure 1a). It consisted of eight notched front discs and eight smooth rear discs (Figure 1b). Each disc had a diameter of 0.46 m. The implement had a cutting width of 1.52 m. The spring-tine cultivator consisted of nine individual spring-tines (Figure 2a). The tines were arranged in a staggered manner to prevent stepping. The tine consisted of an S-shank and a “spoon” point (Figure 2b). The implement had a working width of 1.5 m. The experiment was performed on a field located in the municipality of Piney, Manitoba, Canada. The soil contained 73.5% sand, 23.6% silt, and 2.9% clay, which was classified as a sandy loam by the USDA soil texture triangle [14]. The previous crop was wheat, and straw was spread in the field at the harvest.

2.2. Experimental Design and Field Layout

The experimental design was a completely randomized design, which consisted of a factorial treatment layout. The three tillage systems were no-tillage, disc tillage, and spring-tine tillage systems. These tillage systems served as the factors for the experiment. Each treatment was replicated five times in the experimental design, giving a total of 15 field plots.
Each plot was 1.5 m wide to accommodate one pass of the tillage implement and seeder. The plot length was 45.7 m long. The three tillage systems were applied to the plots which had the wheat residue condition, as shown in Figure 3a. After tillage, the soil surface conditions are shown in Figure 3b. A tillage depth of 12.5 mm was used for the disc and spring-tine tillage systems.

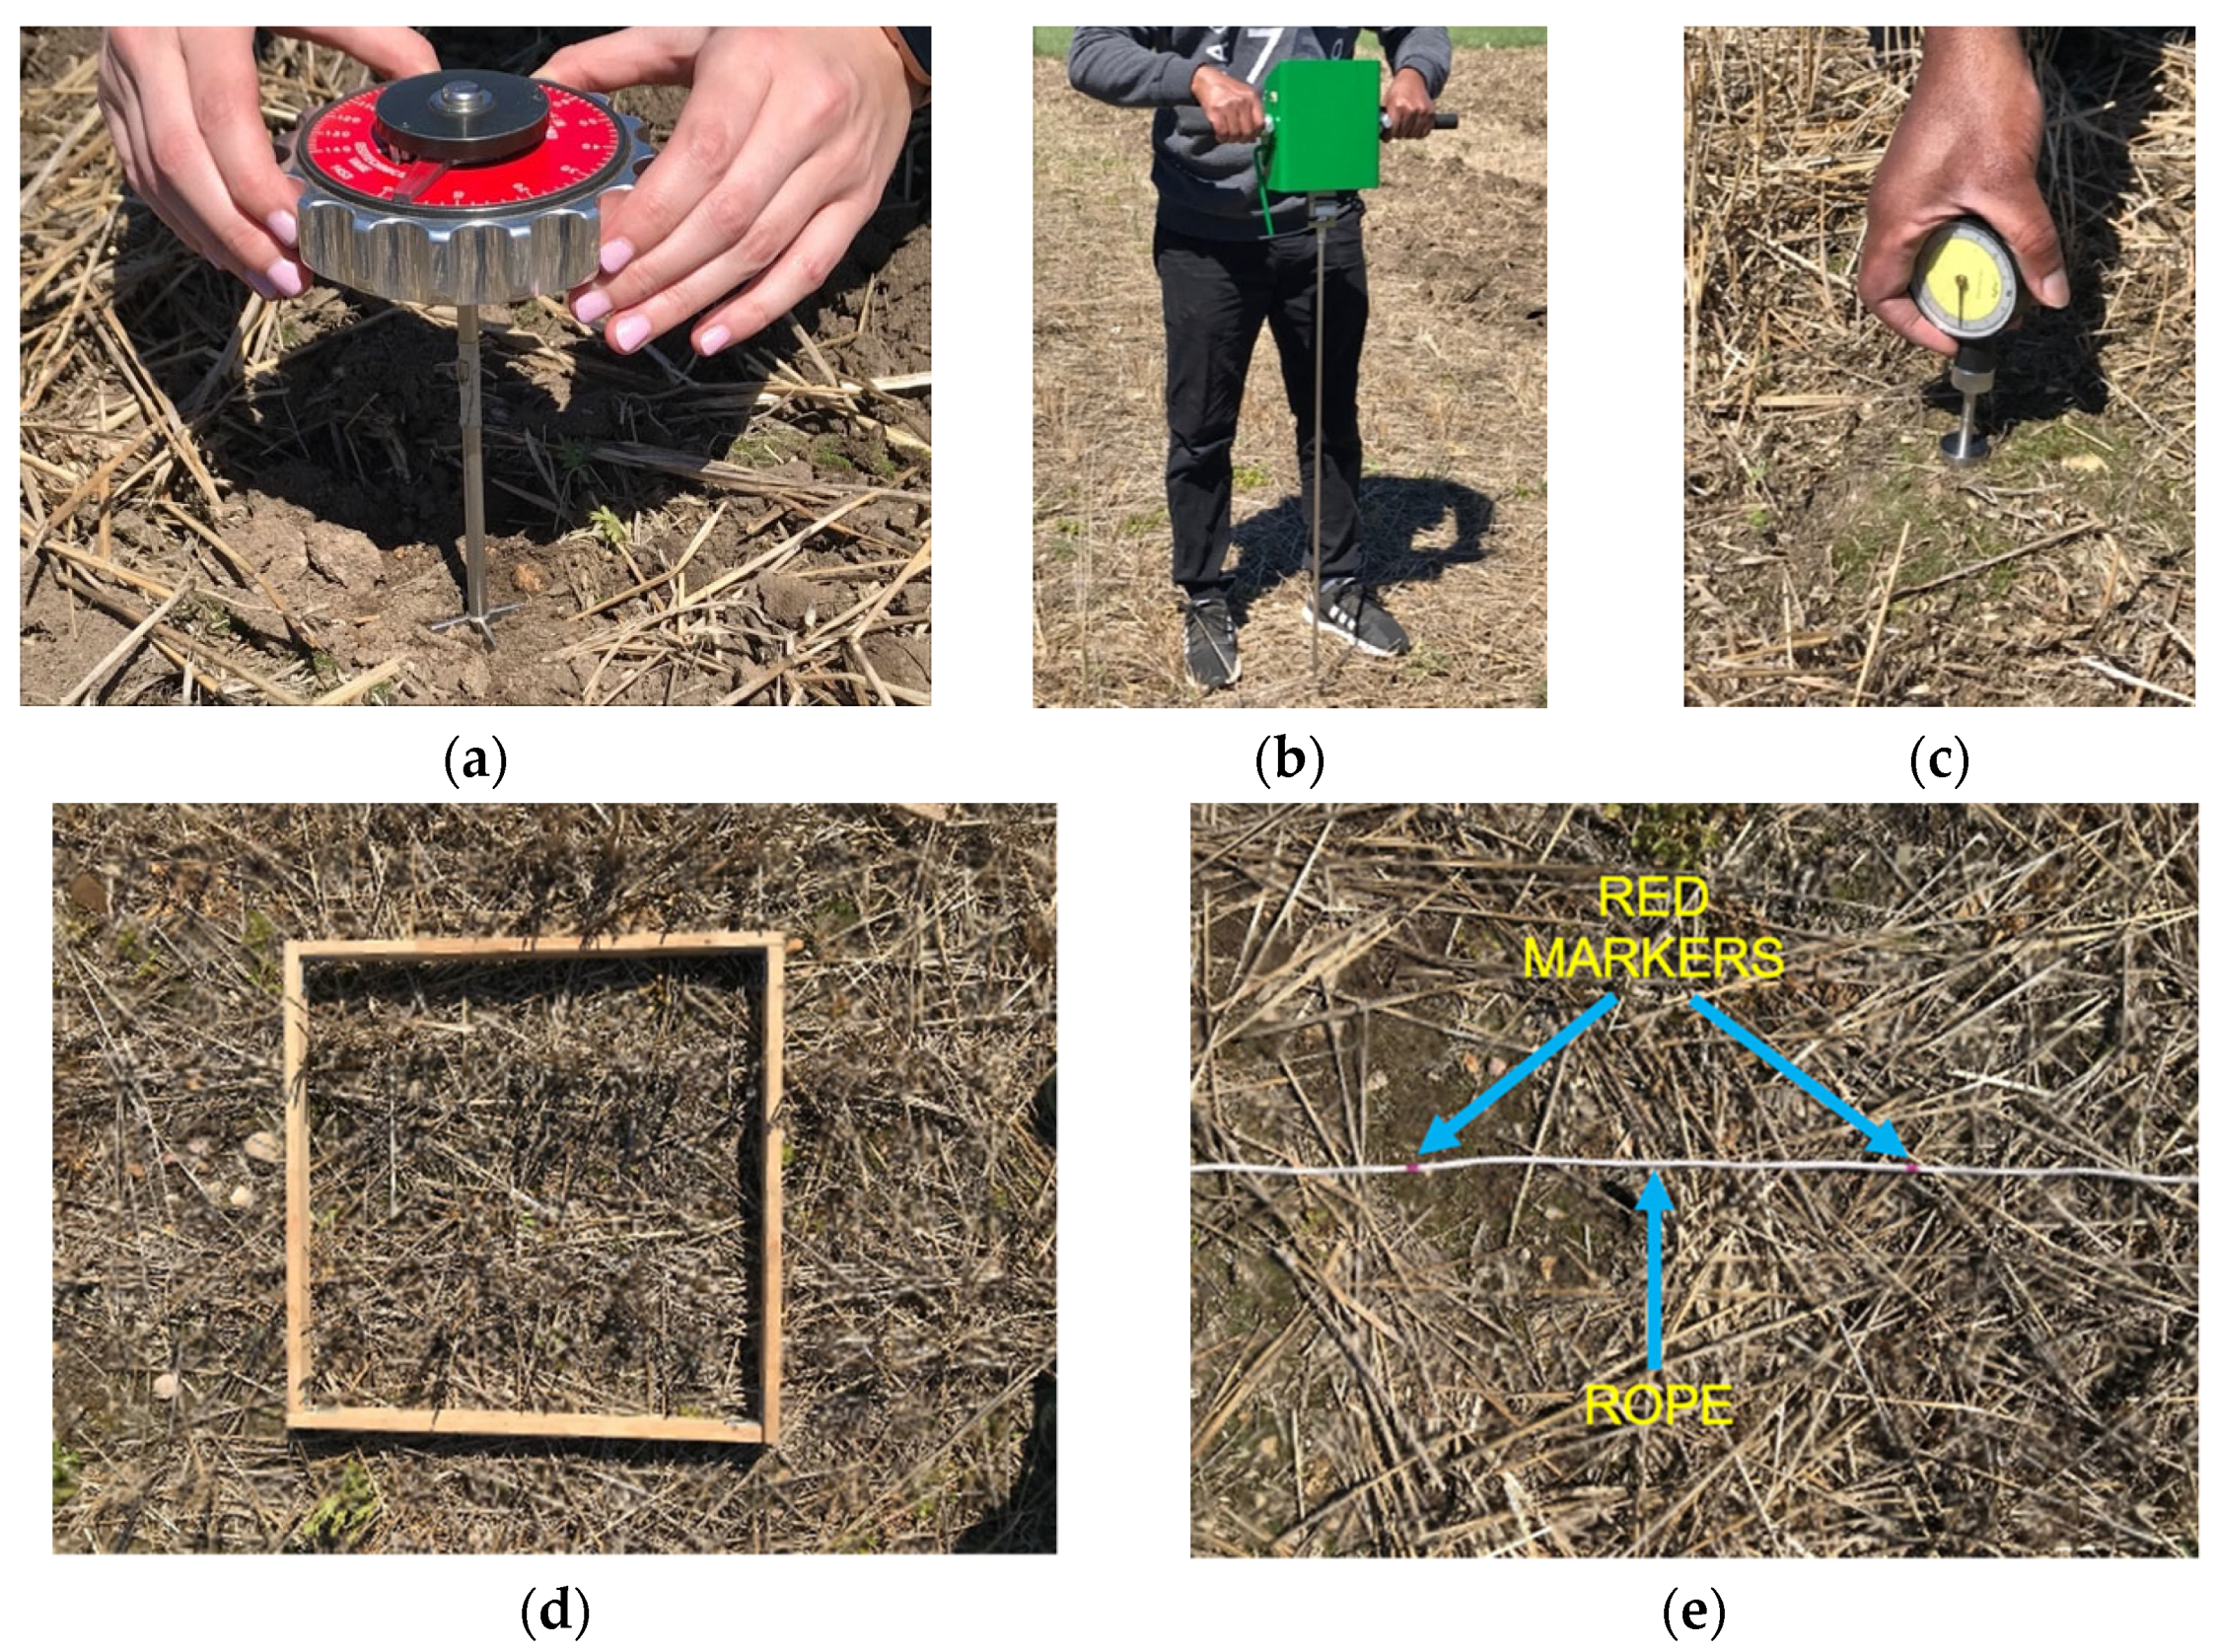
2.3. Experimental Procedure and Measurements

The experiment involved taking measurements under three phases. For the first phase, measurements were taken to characterize the initial soil surface condition of the field before tillage application (Figure 3a). These measurements included soil properties, residue cover, and dry residue mass. In the second phase, the various tillage systems were performed on the field (Figure 3b). Again, soil properties were measured immediately after the tillage operation. Then, the third phase involved tractor passage of the seeding operation on the tilled plots (Figure 3c). Soil properties and compaction variables were measured in the tractor wheel tracks. Finally, the plant population density was measured after canola plants emerged (Figure 3d).

2.3.1. Initial Field Conditions before Field Operations

Soil properties (dry bulk density, soil cone index, soil shear strength, soil moisture content, and soil surface resistance) and residue condition (residue cover and dry residue mass) were measured to determine the initial soil surface conditions of the field. Seven samples were taken for each soil property measured. Soil moisture content and soil dry bulk density of the experimental field were measured using the soil core method. Soil samples were taken with a core sampler at random locations of the field. The core sampler had a diameter and height of 50 and 100 mm, respectively. The soil samples were weighed and oven-dried at 105 °C for 24 h. Soil shear strength was measured using a Geotechnics vane shear meter (Figure 4a). The vane shear meter consisted of four rectangular bladed vanes with a vane height of 29 mm. The vane diameter and area of a single blade were 19 mm and 275.5 mm2, respectively [15]. The soil cone index was measured with a Rimik CP20 cone penetrometer device (Figure 4b). It consisted of a standard cylindrical rod with a cone tip angle of 30°, a load cell, and a chipset. Measurements were taken from the soil surface to a maximum depth of 105 mm at 15 mm intervals. The measurements were taken at a constant penetration velocity of 0.02 m/s [16]. The soil surface resistance was measured with a Humboldt dial pocket penetrometer (Figure 4c). The pocket penetrometer consisted of a 25 mm diameter plunger or foot and a dial with inner and outer scales. The dial had an accuracy of ±1% full scale at 20 °C. Measurements were taken by pushing the plunger into the soil until its foot flushed with the soil surface, then the value on the dial was read. The residue mass on the soil surface was determined by collecting residue within a 1 m2 quadrant placed at seven random locations on the field (Figure 4d). The seven collected samples were oven-dried at 60 °C for 72 h [17] and weighed to determine the dry mass (Kg/ha). The residue cover was measured using the rope method. This method involved counting the number of times marked lines on a rope, spaced at 0.3 m intervals, intersected with a piece of residue on the field (Figure 4e).

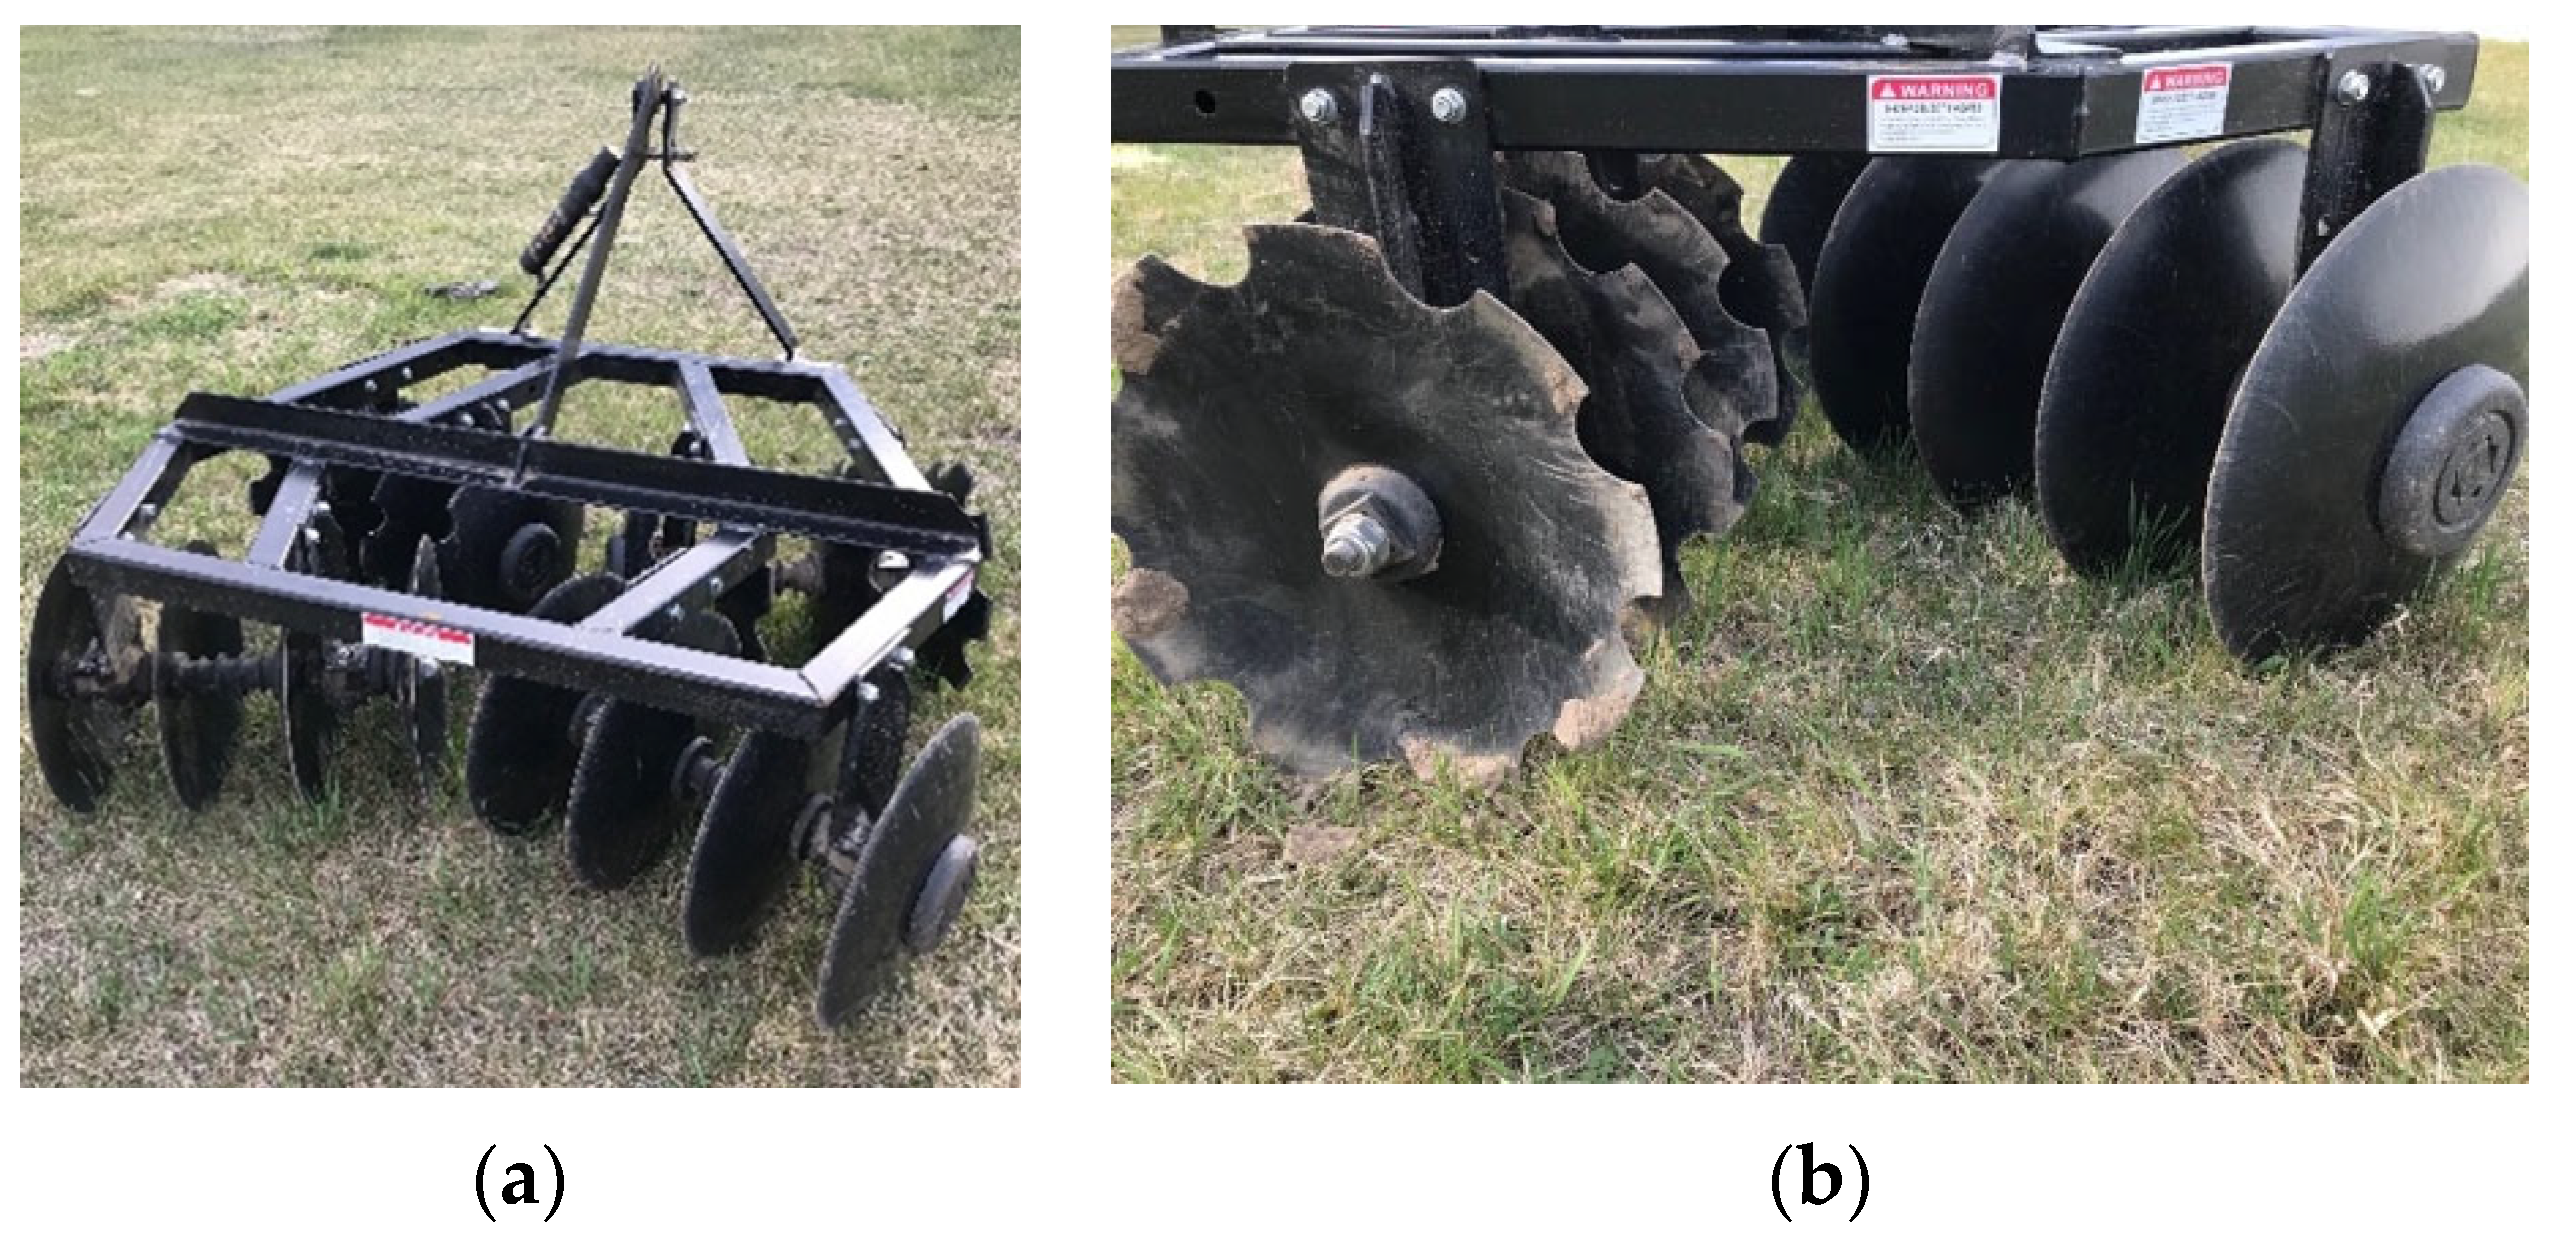
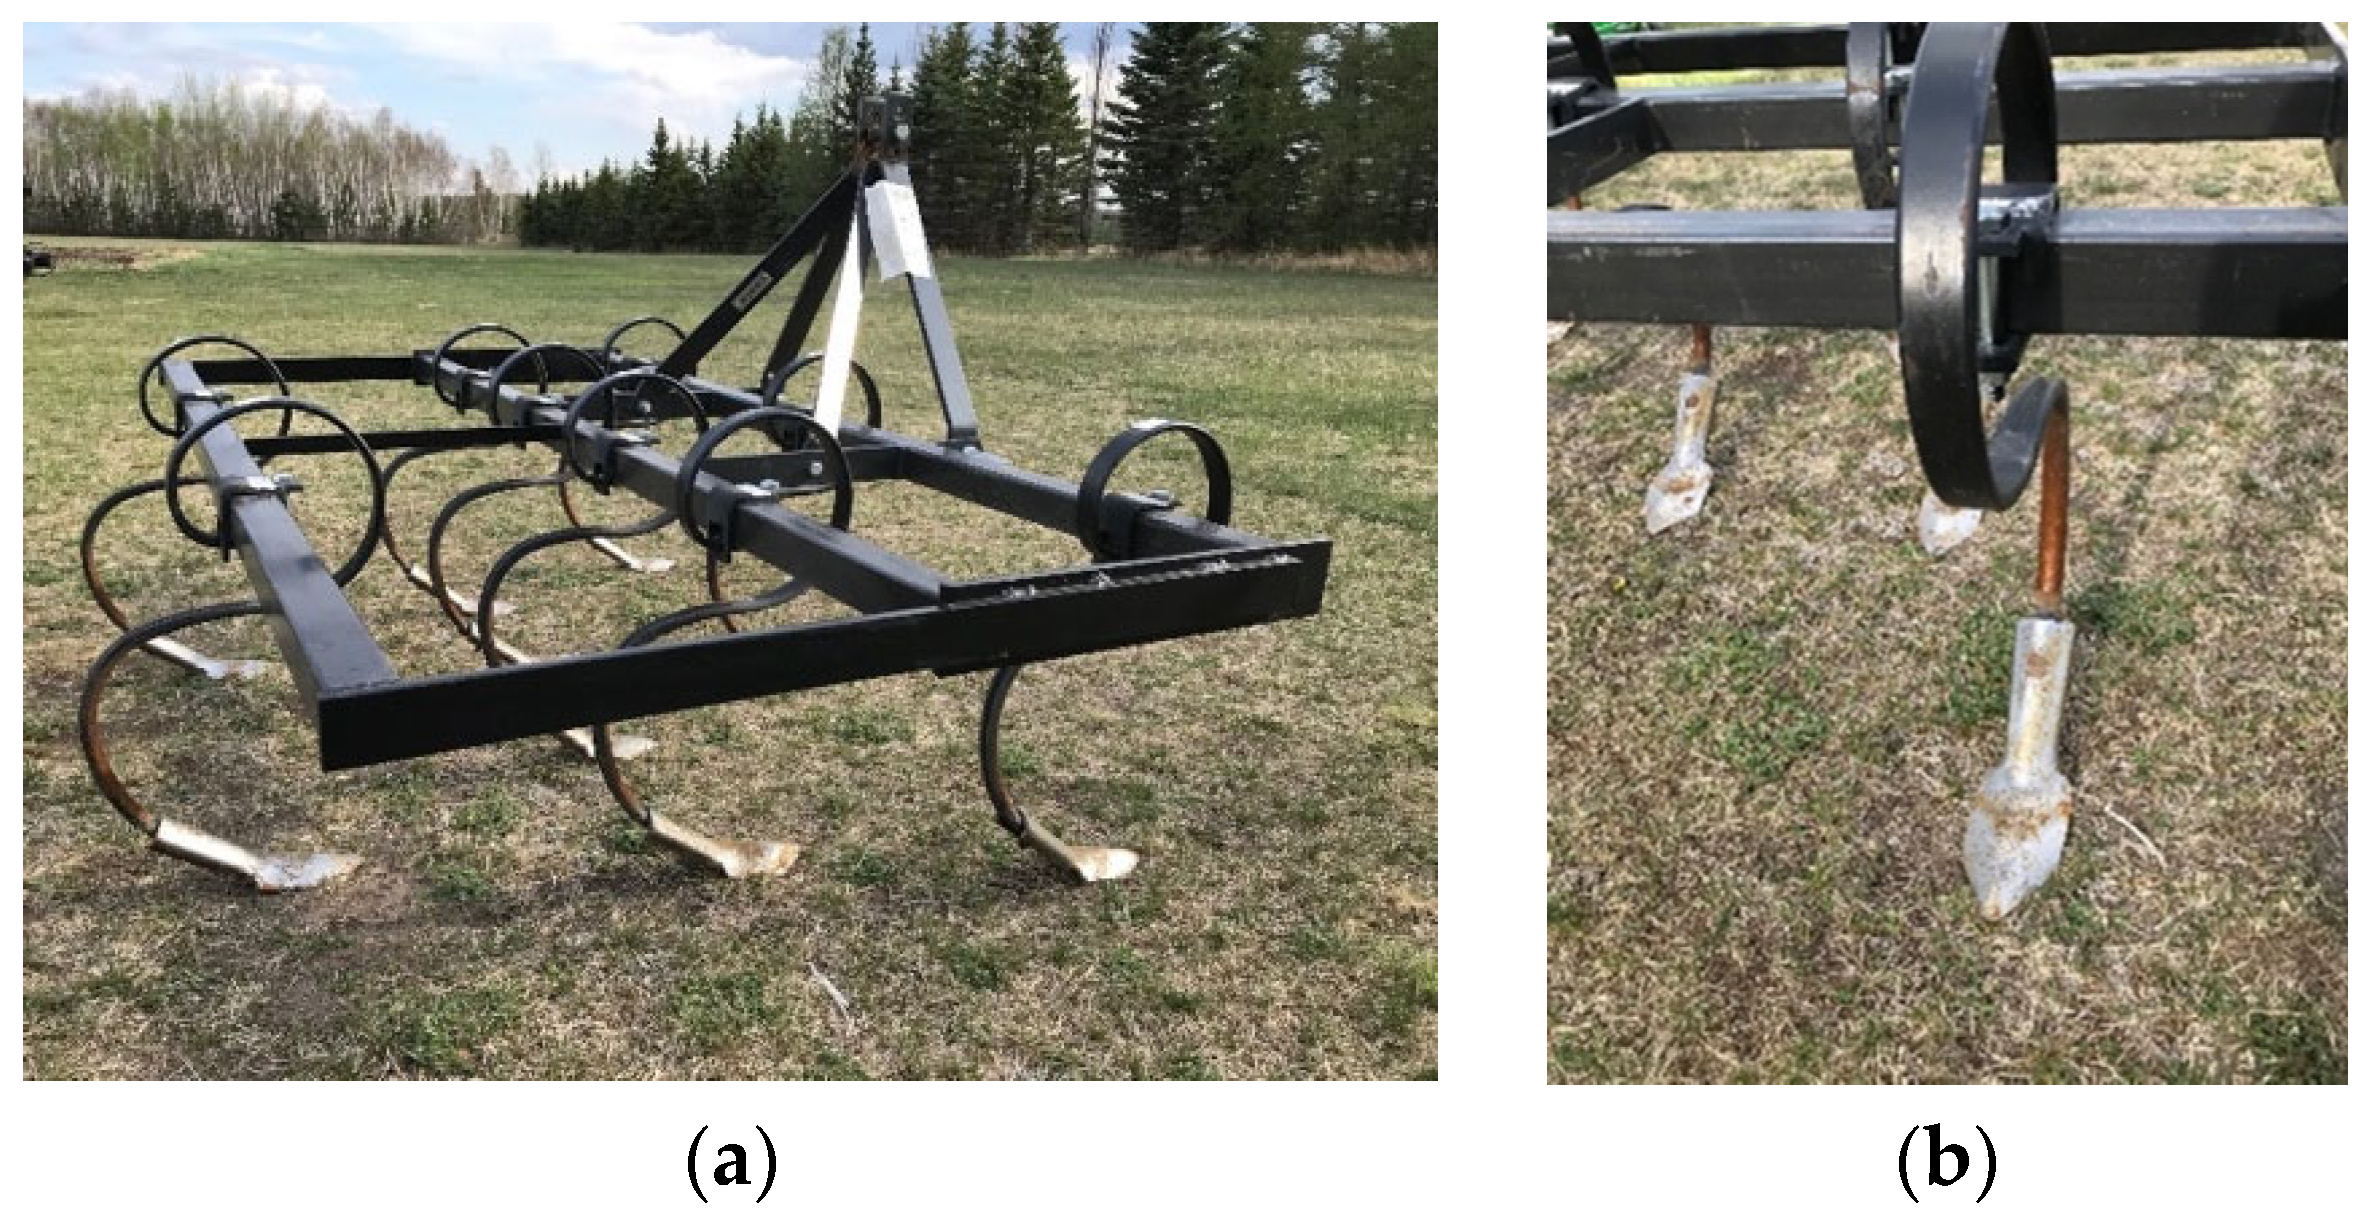
2.3.2. Tillage Operation

The tillage operation was performed based on the plot layout of the experimental design. A tillage depth of 12.5 mm was used for the disc and spring-tine tillage systems. The tractor was driven at a velocity of 1.1 m/s [8]. After the tillage operation, soil dry bulk density, soil cone index, soil shear strength, soil moisture content, and soil surface resistance were measured in each plot. Within each plot, three samples or measurements were taken for each aforementioned soil property.

2.3.3. Traffic and Seeding Operations

Afterwards, the tilled plots were trafficked with one pass of the tractor for seeding operations (Figure 3c). Seeding was also performed with a four-row seeder (Plotter Choice, Kasco Manufacturing, 170 W 600 N, Shelbyville, IN 46176, USA). Canola was seeded at a row spacing of 300 mm. The canola seeds (variety: InVigor L340) were certified seeds from a Manitoban seed supplier (Friesen Seeds Ltd, Rosenort, MB, Canada.). The seeds were treated with Prosper Evergol 4.25 M. The travel speed of the tractor for the operation was 1.1 m/s (4 Km/h). The target seeding depth was 12.5 mm, recommended by the canola council of Canada [18].
In the centreline of the wheel track, soil dry bulk density, soil cone index, soil shear strength, soil moisture content, soil surface resistance, imprinted tire width, and soil sinkage were measured in individual plots. Within each individual plot, three samples or measurements were taken for each soil property, imprinted tire width, and soil sinkage. The imprinted tire width and soil deformation (sinkage) were measured using a measuring rule and tape on the wheel track. The plant population density was counted 10 days after seeding. The number of emerged canola seedlings within the central two crop rows were counted at three random locations per plot. At each location, the length of the crop rows used for counting was 2 m. Unfortunately, flea beetles attacked and destroyed the plants. As a result, plant counting was performed only two times, and crop yields could not be obtained.
Field operations were managed based on normal farm practices [19]. A summary of the crop production management information is presented in Table 1.

2.4. Statistical and Data Analysis

Analysis of variance (ANOVA) was used to determine if the three tillage systems had a significant effect on the measured variables. ANOVA was also used to determine if the soil compaction across the three tillage systems had an effect on the variables. SAS University edition, 2021 statistical software was used to perform the ANOVA and Duncan’s multiple range test (a pairwise comparison) at p < 0.05.

3. Results and Discussion

3.1. Initial Field Conditions

Residue cover measured using the rope method was 76.4%, which was close to the percentage residue cover range stated by Burgess et al. [20] for classifying no-till plots with high amounts of corn stover residue. The dry residue mass was 1847 Kg/ha, which was lower than that reported in Burgess et al. [20]. The low residue mass was possibly due to the residue decomposition over time. The soil moisture content for the field at the time of the experiment was 18.5% (dry basis). This amount of moisture content level in the topsoil layer was suitable for field operations on sandy loam soil. The values of dry soil bulk density, soil surface resistance, soil shear strength, and soil cone index were typical for the given soil type before tillage. A summary of the initial soil condition and measurements is presented in Table 2.

3.2. Effect of Tillage Systems on Soil Properties

3.2.1. Dry Soil Bulk Density

The dry soil bulk density was significantly different between the no-tillage system and the other two tillage systems (Figure 5a). The no-tillage system recorded a dry soil bulk density of 1520 Kg/m3 while the disc and spring-tine tillage systems recorded 23% (1170 Kg/m3) and 27.6% (1100 Kg/m3) reduction, respectively, in dry soil bulk density. Both conventional tillage systems (disc and spring-tine) aid in reducing the dry soil bulk density by breaking and loosening the soil in the topsoil layer. The difference in dry soil bulk density between the disc and spring-tine tillage systems was not significant. This was due to the similar tilling depth (12.5 mm) used for both tillage systems. In a nutshell, this indicated that both double-action disc and spring-tine harrow implements were suitable for reducing the dry soil bulk density in firm soil.

3.2.2. Soil Shear Strength

The soil shear strength for the no-tillage system was 2.81 Nm (Figure 5b). This reflected the state of the soil at the no-tillage plots. The soil was typically firm and unresponsive to deformation (compression). The disc and spring-tine tillage systems recorded an 80% (0.56 Nm) and 84% (0.43 Nm) reduction in soil shear strength as compared to the no-tillage systems. Shearing, rotation, and compression are the three forms of soil deformation in soil dynamics [21]. Soil deformation due to shearing was evident when the double-action disc and spring-tine harrow implements were developed to till the soil. When tilling the soil, the internal structure and interlocking soil particles in the topsoil layer experienced friction. This led to the disassociation of bonds between soil particles resulting in shear. This resulted in the observed decrease of the soil shear strength in the conventional tillage systems. The soil shear strength was not significantly different between the disc and spring-tine tillage systems.

3.2.3. Soil Surface Resistance

In terms of the surface resistance of the soil surface, the no-tillage system was significantly different from the conventional (disc and spring-tine) tillage systems (Figure 5c). The highest surface resistance (1.75 Kg/cm2) was observed for the no-tillage system, reflecting the firm state of the soil surface in those plots. The disc and spring-tine tillage systems recorded lower surface resistance due to the ability of the double-action disc and spring-tine harrow implements to break up firm soils. However, the surface resistance between the disc and spring-tine tillage systems were not significantly different. This could be due to the primary objective of both harrow implements to achieve soil pulverization in the topsoil layer irrespective of the degree of intensity provided.

3.2.4. Soil Cone Index

The relationship between the soil cone index and depth was investigated to understand the effect of both harrow implements on the soil (Figure 6a). As the depth increased, the soil cone index increased, regardless of the tillage system. The soil cone index values for the spring-tine tillage system ranged from 265.5 KPa to 1760 KPa within a specified depth range of 15 mm to 90 mm. In contrast, the soil cone index values for the disc tillage and no-tillage systems varied in a much narrower range within the same depth range. Other researchers observed similar linearly increasing trends for the relationship between soil cone index and the specified depth range of 15 mm to 105 mm in their research studies involving the effect of traffic on different tillage regimes [11,22,23].
To further demonstrate the effects of the tillage system on the soil cone index, data points over an index curve were averaged over the depth of 105 mm (Figure 6b). The average soil cone index was not significantly different between the no-tillage and disc tillage systems. However, the average soil cone index for the spring-tine tillage system was significantly different when compared to the no-tillage and disc tillage systems. There was an observed reduction in the average soil sone index for the disc and spring-tine tillage systems. However, the spring-tine tillage system recorded a greater reduction in the average soil cone index when compared to the no-tillage and disc tillage systems. This could suggest the efficacy of the spring-tine harrow implement in reducing soil cone index at similar depths in sandy loam soils.

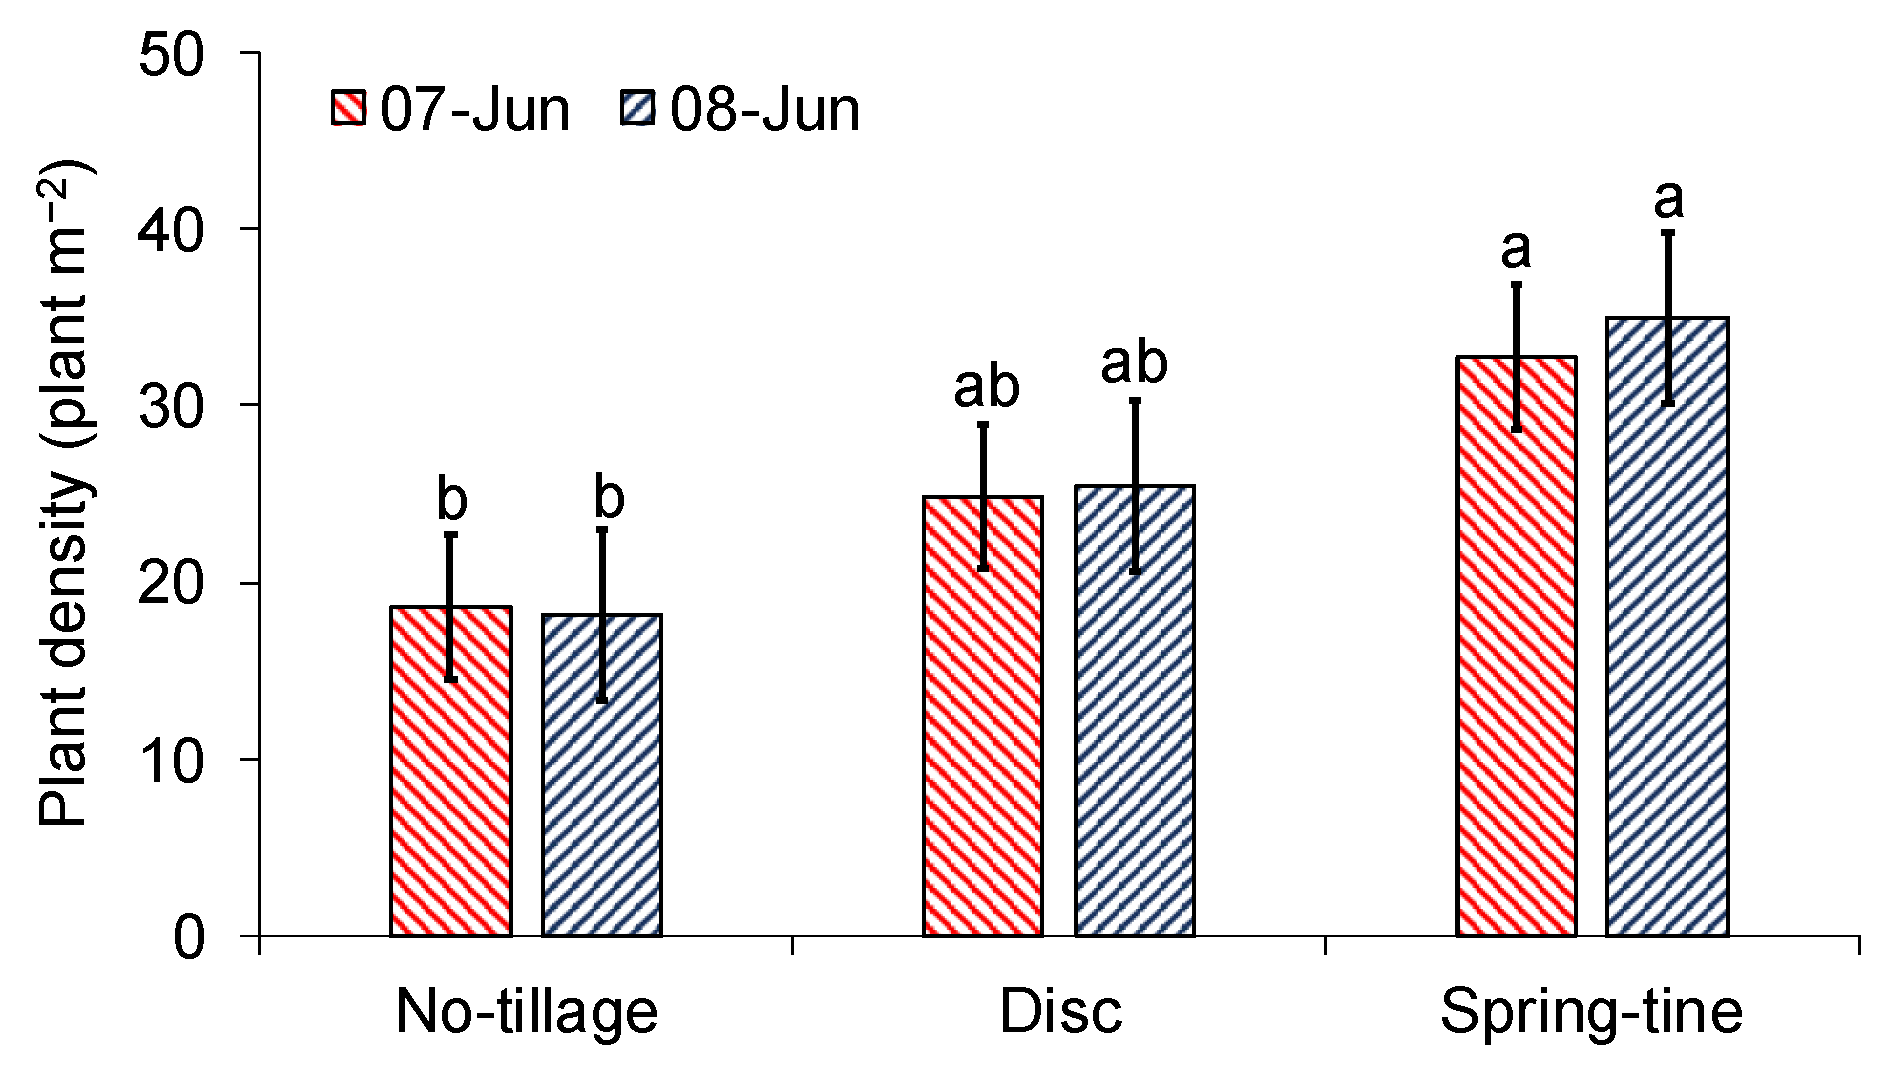
3.3. Plant Population Density

The first emergence of the canola seedlings began on 4 June. This was seven days after seeding. The spring-tine tillage system was marked with a significantly higher population density of canola plants as compared with the disc tillage and no-tillage systems on both dates when plants were counted (Figure 7). The plant population density for the disc tillage and no-tillage systems were not significantly different. On average, over two dates, the population density per unit area of canola plants for the spring-tine tillage, disc tillage, and no-tillage systems were 33.9, 25.2, and 18.5 plants/m2, respectively.
As mentioned in the previous sections, the soil within the no-tillage system was firm and highly resistant to shear and penetration. This clearly affected the seed germination and resulted in the smallest population of canola plants within that tillage system. The population density of canola plants for the disc tillage and no-tillage systems were not significantly different. The observed values of the soil properties in the disc tillage system were similar to the values recorded in the no-tillage system (Figure 8a and Figure 9a–c). In contrast, the spring-tine tillage system observed a significantly higher population density of canola plants as compared to the no-tillage system. This was due to the lower readings for the soil properties (Figure 5a–c and Figure 6a,b). This reduction in the soil properties gave credence to the ability of the spring-tine cultivator to alleviate the heightened effects of soil degradation in order to promote plant growth.

3.4. Effect of Wheel Track across Tillage Systems on Soil Properties

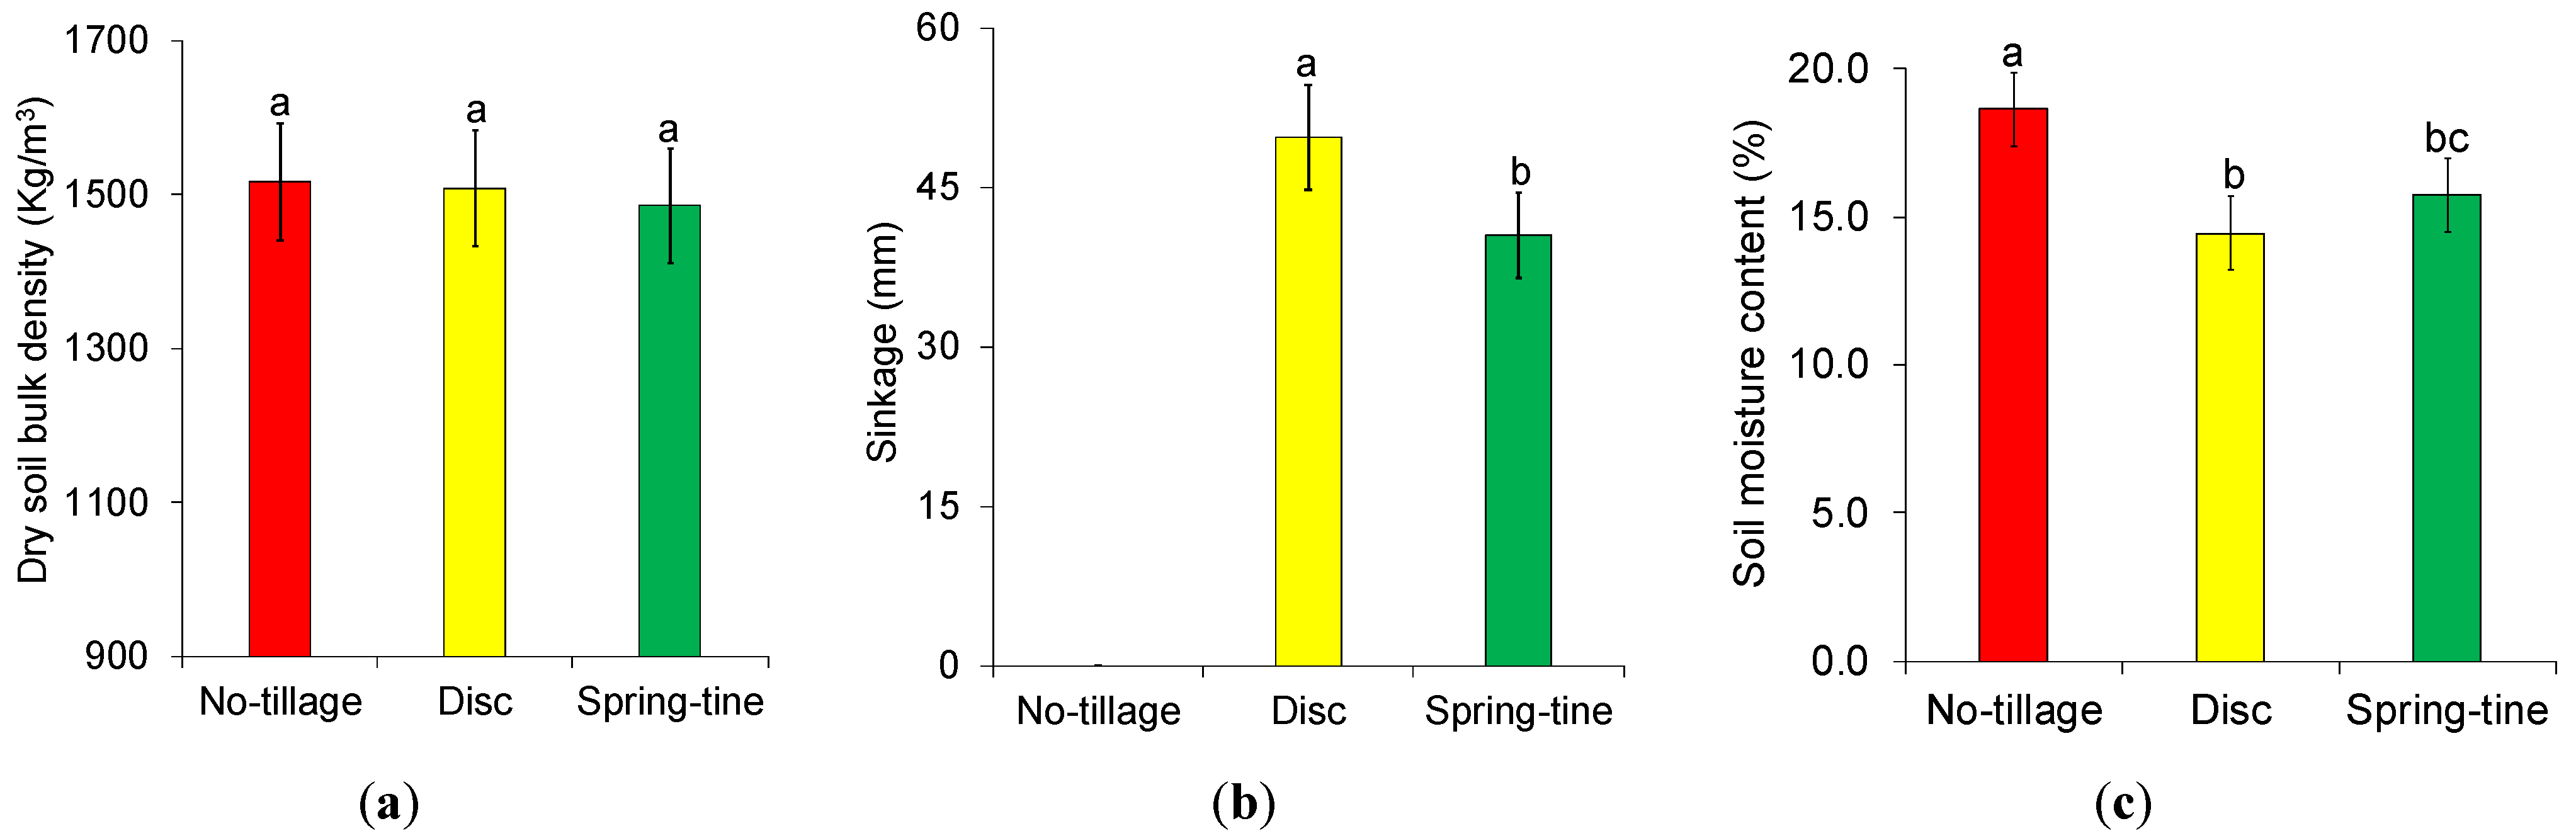
3.4.1. Dry Soil Bulk Density

The dry soil bulk density taken on the wheel tracks was not significantly different between the disc tillage, spring-tine tillage and no-tillage systems (Figure 8a). Considering the before and after effects of traffic, the dry soil bulk density significantly increased after the passage of the tractor in both disc and spring-tine tillage systems. However, the change in dry soil bulk density after tractor passage was not significantly different between the disc tillage, spring-tine tillage, and no-tillage systems. The effect of the passage of the tractor increased the dry soil bulk density towards the initial dry soil bulk density value of the experimental field for the disc and spring-tine tillage systems. The dry soil bulk density value recorded for the no-tillage system remained the same even after the passage of the tractor. Overall, the aim of drastically reducing soil bulk density before seeding would be considered not achievable. Increasing the field traffic by a higher number of tractor passes would lead to higher dry soil bulk density. This would, in turn, affect seed germination and plant growth resulting in lower crop yields.

3.4.2. Soil Sinkage

Due to the firmness of the soil in the no-tillage plots, there was no presence of deformation (compression) on the soil surface after the passage of the tractor. Therefore, the sinkage was recorded as zero. The soil sinkage was significantly different between the disc and spring-tine tillage systems (Figure 8b). Generally, when a load such as a tractor tire is in contact with the soil surface, regional soil shear failure occurs, which results in the deformation of the soil structure beneath the tire [24]. This phenomenon was evident during the passage of the tractor. Additionally, the pore spaces in the soil are greatly reduced for every tractor passage. If pore spaces are greatly reduced or non-existent, further soil compression or deformation cannot occur [25]. The disc tillage system observed higher sinkage than the spring-tine tillage system due to the reduction of the pore spaces after the passage of the tractor. These pore spaces were created during the breaking and loosening of the soil structure by both implements. However, this indicated that the double-action disc harrow increased the porosity in the topsoil layer during tillage.

3.4.3. Soil Moisture Content

The soil moisture content for the no-tillage, disc tillage, and spring-tine tillage systems was not significantly different from each other directly after tillage. After the passage of the tractor (after compaction), the disc and spring-tine tillage systems observed lower soil moisture content readings when compared to its initial readings directly after tillage (Figure 8c). However, the soil moisture content for the disc and spring-tine tillage systems were not significantly different after compaction. The soil moisture content for the disc and spring-tine tillage systems were 14.4% and 15.7%, respectively. The effect of soil compaction was evident on the soil moisture content for the disc and spring-tine tillage systems. The disc tillage system observed a 2.7% (14.4% dry basis) reduction in soil moisture content directly after the passage of the tractor. When comparing the initial (after tillage) and final (after compaction) effects, the soil moisture content was not significantly different. In contrast, the spring-tine tillage system observed a 17.4% (15.7% dry basis) reduction in soil moisture content directly after the passage of the tractor. When comparing the initial (after tillage) and final (after compaction) effects, the soil moisture content was significantly different. Overall, soil compaction as a result of traffic had an observable effect on the soil moisture content. The passage of the tractor influenced the disruption of the soil structure in the topsoil layer resulting in the reduction of macropores (porosity) for water flow [8]. This led to a decrease in soil moisture content after compaction. Samuel and Ajav [1] and Villanueva et al. [9] observed similar findings where soil moisture content decreased after several passes of the tractor in conventional tillage plots.

3.4.4. Soil Shear Strength and Soil Surface Resistance

Shear strength and surface resistance were not significantly different between the wheel tracks under the disc and spring-tine tillage systems (Figure 9a,b). Similar to what was observed with the dry soil bulk density, the shear strength and surface resistance significantly increased after the passage of the tractor in the disc and spring-tine tillage systems. Again, the shear strength and surface resistance values recorded for the no-tillage system remained the same even after the passage of the tractor. The change in shear strength and surface resistance was not significantly different between the disc and spring-tine tillage systems. In the wheel tracks, the shear strength and surface resistance also increased towards the initial shear strength and surface resistance recorded. The influence of the tractor passage on the soil surface led to the collapse of the loosened soil structure. This form of soil compaction combined the soil particles together, thereby creating a dense soil structure in the topsoil layer. As a result, the soil shear strength and surface resistance increased for the topsoil layer as well.

3.4.5. Average Soil Cone Index

The average soil cone index was not significantly different between the wheel tacks under three tillage systems (Figure 9c). There was a significant increase in the average cone index after the passage of the tractor in the disc and spring-tine tillage systems. The change in average cone index was significantly different between the disc and spring-tine tillage systems. In the disc and spring-tine tillage systems, the average cone index increased towards the initial soil cone index value. However, the spring-tine tillage system observed a 28.6% (2507 KPa) increase in the average soil cone index, while the disc tillage system observed a 6.5% (2485 KPa) increase. The average soil cone index for the no-tillage system did not increase or decrease due to its firm nature. As previously mentioned, the spring-tine harrow implement was effective in reducing the soil cone index in the 105 mm depth. However, the spring-tine tillage system was greatly influenced by the passage of the tractor on the soil surface. The resulting soil compaction compressed the topsoil layer, which led to an increase in the soil cone index at the specified depth. The relationship between the depth and soil cone index after tractor passage (Figure 10) was variable as compared to the relationship between the depth and soil cone index after tillage. The disc tillage system observed a higher soil cone index ranging from 2002 KPa to 2217 KPa for the specified depth of 15 mm to 60 mm. In the same specified depth, the spring-tine tillage system observed a lower soil cone index ranging from 1914 KPa to 2069 KPa. Thereafter, the soil cone index in both tillage systems became similar, and the trend increased linearly.

4. Conclusions

A field experiment was performed to study the influence of tillage and traffic on sandy loam soil in the Canadian prairie region. In terms of the effect of tillage systems on the soil properties, the no-tillage system observed significantly higher dry soil bulk density, soil shear strength, and soil surface resistance when compared with the disc and spring-tine tillage systems. The relationship between the soil cone index and depth was observed to be an increasing trend for all three tillage systems. The spring-tine favoured a higher plant population density when compared to the no-tillage system. After wheel trafficking on the tilled soil, some soil properties on the wheel tracks were significantly different. The soil sinkage was greater in the disc tillage plots than the spring-tine tillage plots. The wheel tracks on the disc and spring-tine tillage plots reduced the soil moisture content compared with the wheel tracks in the no-tillage plots. Overall, soil preparation using tillage was highly advantageous to the establishment of the canola crop. The reduction of the dry soil bulk density and soil strengths in the tilled plots led to the improvement of the plant population density. Specifically, the spring-tine tillage system was the best method of soil preparation for the canola crop considering both soil condition and plant establishment. This study showed that soil properties varied not only with different tillage systems but also with the field traffic from the subsequent field operation. Therefore, both the tillage system and subsequent traffic should be taken into consideration for the management of field operations in supporting crop production.

Author Contributions

Conceptualization, methodology, resources, formal analysis, investigation, validation, writing—original draft, data curation, visualization, K.A. and Y.C.; supervision, Y.C. All authors have read and agreed to the published version of the manuscript.

Funding

This research was funded by the Natural Sciences and Engineering Research Council of Canada (NSERC). Grant No.: RGPIN-2019-05861.

Institutional Review Board Statement

Not applicable.

Informed Consent Statement

Not applicable.

Data Availability Statement

Not applicable.

Acknowledgments

The authors would like to thank Sylvio Tessier, Leno Guzman, Sydni Reimer, and Robyn Birch for their assistance in the field experiments.

Conflicts of Interest

We declare that we have no conflict of interest.

References

  1. Samuel, T.M.; Ajav, E.A. Optimum Tillage System for Pepper Production in an Alfisol of South-Western Nigeria. Afr. J. Agric. Res. 2010, 5, 2647–2652. [Google Scholar]
  2. Badalíková, B. Influence of Soil Tillage on Soil Compaction. Soil Eng. 2010, 20, 19–30. [Google Scholar] [CrossRef]
  3. Moraru, P.I.; Rusu, T. Effect of Tillage Systems on Soil Moisture, Soil Temperature, Soil Respiration and Production of Wheat, Maize and Soybean Crops. J. Food Agric. Environ. 2012, 10, 445–448. [Google Scholar]
  4. Botta, G.F.; Rivero, D.; Tourn, M.; Melcon, F.B.; Pozzolo, O.; Nardon, G.; Balbuena, R.; Becerra, A.T.; Rosatto, H.; Stadler, S. Soil Compaction Produced by Tractor with Radial and Cross-Ply Tyres in Two Tillage Regimes. Soil Tillage Res. 2008, 101, 44–51. [Google Scholar] [CrossRef]
  5. Choudhary, M.A. Seedbed Preparation Methods and Their Effect on Soil Physical Conditions and Crop Establishment; In Soil physics: Application under stress environments. Proceedings of the International Symposium on Applied Soil Physics in Stress Environments, Islamabad, Pakistan, 22–26 January 1989; Pakistan Agricultural Research Council (PARC): Islamabad, Pakistan, 1990; pp. 296–300. [Google Scholar]
  6. Hamza, M.A.; Anderson, W.K. Soil Compaction in Cropping Systems: A Review of the Nature, Causes and Possible Solutions. Soil Tillage Res. 2005, 82, 121–145. [Google Scholar] [CrossRef]
  7. Bayhan, Y.; Kayisoglu, B.; Gonulol, E. Effect of Soil Compaction on Sunflower Growth. Soil Tillage Res. 2002, 68, 31–38. [Google Scholar] [CrossRef]
  8. Alaoui, A.; Helbling, A. Evaluation of Soil Compaction Using Hydrodynamic Water Content Variation: Comparison between Compacted and Non-Compacted Soil. Geoderma 2006, 134, 97–108. [Google Scholar] [CrossRef]
  9. Villanueva, J.J.M.; García, V.M.V.; Alberich, M.V.E.; Huerta, A.G.; Arriaga, M.R.; Rodríguez, F.G. Mean Infiltration Speed in a Vertisol under Different Tillage Systems. TERRA Latinoam. 2015, 33, 95–99. [Google Scholar]
  10. Botta, G.F.; Becerra, A.T.; Tourn, F.B. Effect of the Number of Tractor Passes on Soil Rut Depth and Compaction in Two Tillage Regimes. Soil Tillage Res. 2009, 103, 381–386. [Google Scholar] [CrossRef]
  11. Zhang, X.Y.; Cruse, R.M.; Sui, Y.Y.; Jhao, Z. Soil Compaction Induced by Small Tractor Traffic in Northeast China. Soil Sci. Soc. Am. J. 2006, 70, 613–619. [Google Scholar] [CrossRef]
  12. Koch, H.J.; Heuer, H.; Tomanová, O.; Märländer, B. Cumulative Effect of Annually Repeated Passes of Heavy Agricultural Machinery on Soil Structural Properties and Sugar Beet Yield under Two Tillage Systems. Soil Tillage Res. 2008, 101, 69–77. [Google Scholar] [CrossRef]
  13. Millington, A. The Effect of Low Ground Pressure and Controlled Traffic Farming Systems on Soil Properties and Crop Development for Three Tillage Systems (. Ph.D. Thesis, Harper Adams University, Newport, Shropshire, UK, 2019. [Google Scholar]
  14. USDA. Keys to Soil Taxonomy. Soil Conserv. Serv. 2014, 12, 410. [Google Scholar] [CrossRef]
  15. ASTM Standards. Standard Test Method for Field Vane Shear Test in Cohesive Soil D2573—01. Am. Soc. Test. Mater. 2002, 4, 4–11. [Google Scholar]
  16. ASAE Standards. Soil Cone Penetrometer S 313.3; ASAE: St. Joseph, MI, USA, 1999; pp. 3–5.
  17. ASABE Standards. S358.3 Moisture Measurement—Forages. ASAE: St. Joseph, MI, USA, 2012.
  18. The Canola Council of Canada. Plant Establishment—Seed Depth. Available online: https://www.canolacouncil.org/canola-encyclopedia/plant-establishment/seed-depth/ (accessed on 8 September 2021).
  19. Manitoba Agriculture. Canola Production and Management. Available online: https://www.gov.mb.ca/agriculture/crops/crop-management/canola.html (accessed on 8 September 2021).
  20. Burgess, M.S.; Mehuys, G.R.; Madramootoo, C.A. Tillage and Crop Residue Effects on Corn Production in Quebec. Agron. J. 1996, 88, 792–797. [Google Scholar] [CrossRef]
  21. Pytka, J. Effects of Repeated Rolling of Agricultural Tractors on Soil Stress and Deformation State in Sand and Loess. Soil Tillage Res. 2005, 82, 77–88. [Google Scholar] [CrossRef]
  22. Kurjenluoma, J.; Alakukku, L.; Ahokas, J. Rolling Resistance and Rut Formation by Implement Tyres on Tilled Clay Soil. J. Terramechanics 2009, 46, 267–275. [Google Scholar] [CrossRef]
  23. Larney, F.J.; Kladivko, E.J. Soil Strength Properties Under Four Tillage Systems at Three Long-Term Study Sites in Indiana. Soil Sci. Soc. Am. J. 1989, 53, 1539–1545. [Google Scholar] [CrossRef]
  24. McKyes, E. Soil Cutting and Tillage. Dev. Agric. Eng. 1989, 10, 192–221. [Google Scholar] [CrossRef]
  25. Taghavifar, H.; Mardani, A. Effect of Velocity, Wheel Load and Multipass on Soil Compaction. J. Saudi Soc. Agric. Sci. 2014, 13, 57–66. [Google Scholar] [CrossRef] [Green Version]
Figure 1. (a) Double-action disc harrow; (b) notched and smooth discs on disc harrow.
Agriculture 12 00219 g001
Figure 2. (a) Spring-tine cultivator; (b) individual spring-tine on the spring-tine cultivator.
Agriculture 12 00219 g002
Figure 3. (a) Initial soil surface condition of field with wheat residue; (b) experimental field after tillage; (c) presence of a wheel track after passage of the tractor for seeding; (d) emerged canola plants in the no-tillage plot.
Agriculture 12 00219 g003
Figure 4. (a) Vane shear meter; (b) Standard penetrometer; (c) Pocket penetrometer; (d) Quadrant for residue mass measurement; (e) Rope method for residue cover measurement.
Agriculture 12 00219 g004
Figure 5. Soil properties across the three tillage systems: no-tillage, disc tillage, and spring-tine tillage; (a) Dry soil bulk density; (b) Soil shear strength; (c) Soil surface resistance. Values labelled with different letters are significantly different based on Duncan’s multiple-range test at a significance level of 0.05 (p < 0.05).
Agriculture 12 00219 g005
Figure 6. Soil cone index across the three tillage systems: no-tillage, disc tillage, and spring-tine tillage; (a) index-depth curves; (b) average indices over the depth range. Values labelled with different letters are significantly different based on Duncan’s multiple-range test at a significance level of 0.05 (p < 0.05).
Agriculture 12 00219 g006
Figure 7. Plant population density per unit area in three tillage systems: no-tillage, disc tillage, and spring-tine tillage. Values labelled with different letters are significantly different based on Duncan’s multiple-range test at a significance level of 0.05 (p < 0.05).
Agriculture 12 00219 g007
Figure 8. Soil properties taken in the wheel tracks under the no-tillage, disc tillage, and spring-tine tillage systems; (a) dry soil bulk density, (b) soil sinkage and (c) soil moisture content. Values labelled with different letters are significantly different based on Duncan’s multiple-range test at a significance level of 0.05 (p < 0.05).
Agriculture 12 00219 g008
Figure 9. Soil properties taken in the wheel tracks under the no-tillage, disc tillage, and spring-tine tillage systems; (a) soil shear strength, (b) soil surface resistance and (c) average indices over the depth range. Values labelled with different letters are significantly different based on Duncan’s multiple-range test at a significance level of 0.05 (p < 0.05).
Agriculture 12 00219 g009
Figure 10. Index-depth curves for the no-tillage, disc tillage, and spring-tine tillage systems after passage of the tractor.
Agriculture 12 00219 g010
Table 1. Crop production management information.
Field ActivityTypeDate
Soil fertility samplingSoil coreMay 3
Herbicide applicationGlyphosate Ammonium sulphate (20-0-0-24)May 3
Fertilizer applicationMonoammonium phosphate (11-52-0) and NitrogenMay 28
Tillage applicationNo till, Disc, and Spring-tineMay 28
SeedingFour-row seederMay 28
1st Plant count June 7
2nd Plant count June 8
Table 2. Summary of initial soil conditions.
MeasurementUnitValue
Soil moisture content%18.5 ± 5.4
Soil dry bulk densityKg/m31524.3 ± 0.2
Soil surface resistanceKg/m31.8 ± 0.4
Soil shear strengthNm2.9 ± 1.1
Soil cone indexKPa2611.4 ± 511.2
Crop residue massKg/ha1847 ± 477
Crop residue cover%76.4 ± 12.1
Publisher’s Note: MDPI stays neutral with regard to jurisdictional claims in published maps and institutional affiliations.

