Article

Study of Ammonia Concentration Characteristics and Optimization in Broiler Chamber during Winter Based on Computational Fluid Dynamics

1
College of Artificial Intelligence, Nanjing Agricultural University, Nanjing 210031, China
2
School of Environmental Science and Engineering, Nanjing University of Information Science and Technology, Nanjing 210044, China
3
College of Engineering, Nanjing Agricultural University, Nanjing 210031, China
4
Department of Mechanical Engineering, University College London, London WC1E 7JE, UK
*
Authors to whom correspondence should be addressed.
Agriculture 2022, 12(2), 182; https://doi.org/10.3390/agriculture12020182
Submission received: 3 December 2021 / Revised: 21 January 2022 / Accepted: 24 January 2022 / Published: 27 January 2022
(This article belongs to the Section Agricultural Technology)

Abstract

:
Poultry breeding is one of the most significant components of agriculture and an essential link of material exchange between humans and nature. Moreover, poultry breeding technology has a considerable impact on the life quality of human beings, and could even influence the survival of human beings. As one of the most popular poultry, broiler has a good economic benefit due to its excellent taste and fast growing cycle. This paper aims to improve the efficiency of raising broilers by understanding the impact of ammonia concentration distribution within a smart broiler breeding chamber, and the rationality of the system’s design. More specifically, we used computational fluid dynamics (CFD) technology to simulate the process of ammonia production and identify the characteristics of ammonia concentration. Based on the simulation results, the structure of the broiler chamber was reformed, and the ammonia uniformity was significantly improved after the structural modification of the broiler chamber and the ammonia concentration in the chamber had remained extremely low. In general, this study provides a reference for structural optimization of the design of broiler chambers and the environmental regulation of ammonia.

1. Introduction

The yellow-feathered broiler has the characteristics of delicious meat—tender and delicious. The annual output of yellow-feathered broilers in China is about four billion, accounting for about 50% of China’s broiler production [1]. There is a large number of small-to-medium sized yellow-feathered broiler raising farms in rural China, with dozens of them located in Jinniuhu Street, Luhe District, Nanjing, China. During the broiler breeding process, a large number of air pollutants are produced, including ammonia (NH3), hydrogen sulfide (H2S) and methane (CH4), which adversely affect the production and growth performance of the broiler. From 2019 to 2020, our research group carried out four breeding experiments in different seasons; according to the results, hydrogen sulfide and methane concentrations were at extremely low levels (<0.1 ppm), while the ammonia concentration was relatively high in the broiler house. Ammonia can be adsorbed on the skin as well as in eye conjunctiva of broilers quite easily, due to its high solubility. Even a very low concentration of ammonia, such as 20 ppm, can also cause conjunctivitis, upper respiratory tract membrane congestion, edema, and increased secretions [2]. Ammonia, as a pollutant in the broiler house, is produced during the decomposition process of the nitrogen in broiler feces. During recent years, ammonia discharge has become one of the major environmental protection problems, as it can endanger the health of animals and human beings, as well as cause environmental pollution [3]. Factors such as humidity, breeding density and ventilation have non-negligible impacts on ammonia concentration in the broiler house. Hence a well-designed structure of the broiler house is important, since it ensures the health of the broilers and workers by maintaining the ammonia concentration at a relatively low level. Overall, it is of great significance to study the ammonia concentration distribution in a broiler house when considering its design quality.
As livestock and poultry grow, they will emit more ammonia, and the difference in the distribution of ammonia concentration in the chamber will gradually increase [4]. To achieve a more intuitive understanding of the ammonia diffusion in livestock and poultry houses, computational fluid dynamics (CFD) simulation technology can be used. CFD is a comprehensive discipline integrating fluid mechanics, heat transfer, engineering thermodynamics, numerical analysis, computer science and other disciplines. It originated in the Second World War and became a branch of Fluid mechanics in the 1960s [5]. CFD technology has been widely applied in the fields of commerce, industry and agriculture, as it can complete the simulation of fluid flow in an efficient manner [6,7,8,9,10,11]. With the continued increase of the computational power of CFD software during past years, the simulation results of CFD software are authentic and reliable in most cases. Furthermore, using CFD simulations can save a large number of resources in field experiments. The research results can be analyzed intuitively through numerical calculation and cloud image display. In terms of agricultural buildings, CFD technology has become an important tool for predicting and evaluating the internal environment of agricultural buildings, with high accuracy and obvious application effects in building internal parameters and structure simulations [12]. The environment of the broiler chamber is similar to that of other buildings. Although CFD technology has barely been applied directly to broiler houses in previous research works, it has been widely used in the environmental analysis of other types of livestock and poultry houses. One of the previous research works implemented by Yin et al. [13] established three different CFD models to simulate ammonia emissions in dairy cows: a flat plate model (SFM), turbulent porous media model (PMM-T) and laminar flow porous media model (PMM-L). Their results demonstrated that the three models increase the ammonia emission rate under certain conditions such as increasing the average wind speed while reducing the headspace height, or adding side walls around the tunnel. Meanwhile, it concluded that the simulation results mainly depend on the treatment of turbulence in porous media, and PMM-T and PMM-L can provide closer flow characteristics and emission rate predictions than SFM. Nevertheless, PMM-T significantly overestimated the turbulent kinetic energy, and the ammonia emission rate. Another previous study performed by Rojano et al. [14] established a three-dimensional CFD model of a poultry farm and verified it with the mean spatiotemporal data related to the microclimate of the poultry house. Their results showed that the overall variability of the experimental data related to the microclimate was lower than the predicted data. Subsequently, CFD models were used to predict the horizontal emissions through the side vents and the emissions of pollutants such as ammonia due to natural ventilation, and the areas near the poultry farms were defined. Research work carried out by Tabase [15] used CFD for the modelization of airflow and ammonia emissions, to promote the mitigation of ammonia emissions and improve air quality in the house and provide thermal comfort for the animals. A steady-state CFD model was developed to predict ammonia distribution in a pig house with an underfloor air distribution (UFAD) system. Advanced ammonia emission modeling methods were used in the CFD model to simulate ammonia production. There was a good correlation between the simulation and the measured results. Finally, research work conducted by Stamou et al. [16] used the shear stress transport (SST) K-ω model to calculate the airflow velocity and temperature in the model room. Based on a competitive study between the calculated results, the measured results and other turbulent models, they concluded that the calculated results using the SST K-ω model were in good agreement with measured results. Based upon the aforementioned previous works, we believe that using CFD to simulate ammonia concentration distribution in the broiler house with the SST K-ω turbulence model is feasible.
For the experimental settings in the study described in this article, the smart-breeding broiler chamber was used as the experimental environment, and the yellow-feathered broilers were selected as the breeding object. In view of the ammonia produced in the breeding process during winter, zoning collection and calculation of ammonia concentration values were adopted, the basic governing equations of CFD were established, the broiler chamber was modeled, the grid was reasonably divided, and the appropriate solution model and boundary conditions were selected. Based on the mentioned experimental settings, CFD technology was used to simulate the ammonia concentration distribution in the broiler chamber in winter, which is useful for the evaluation of ammonia concentration and the renovation of ventilation system in the broiler chamber.

2. Materials and Methods

2.1. Materials

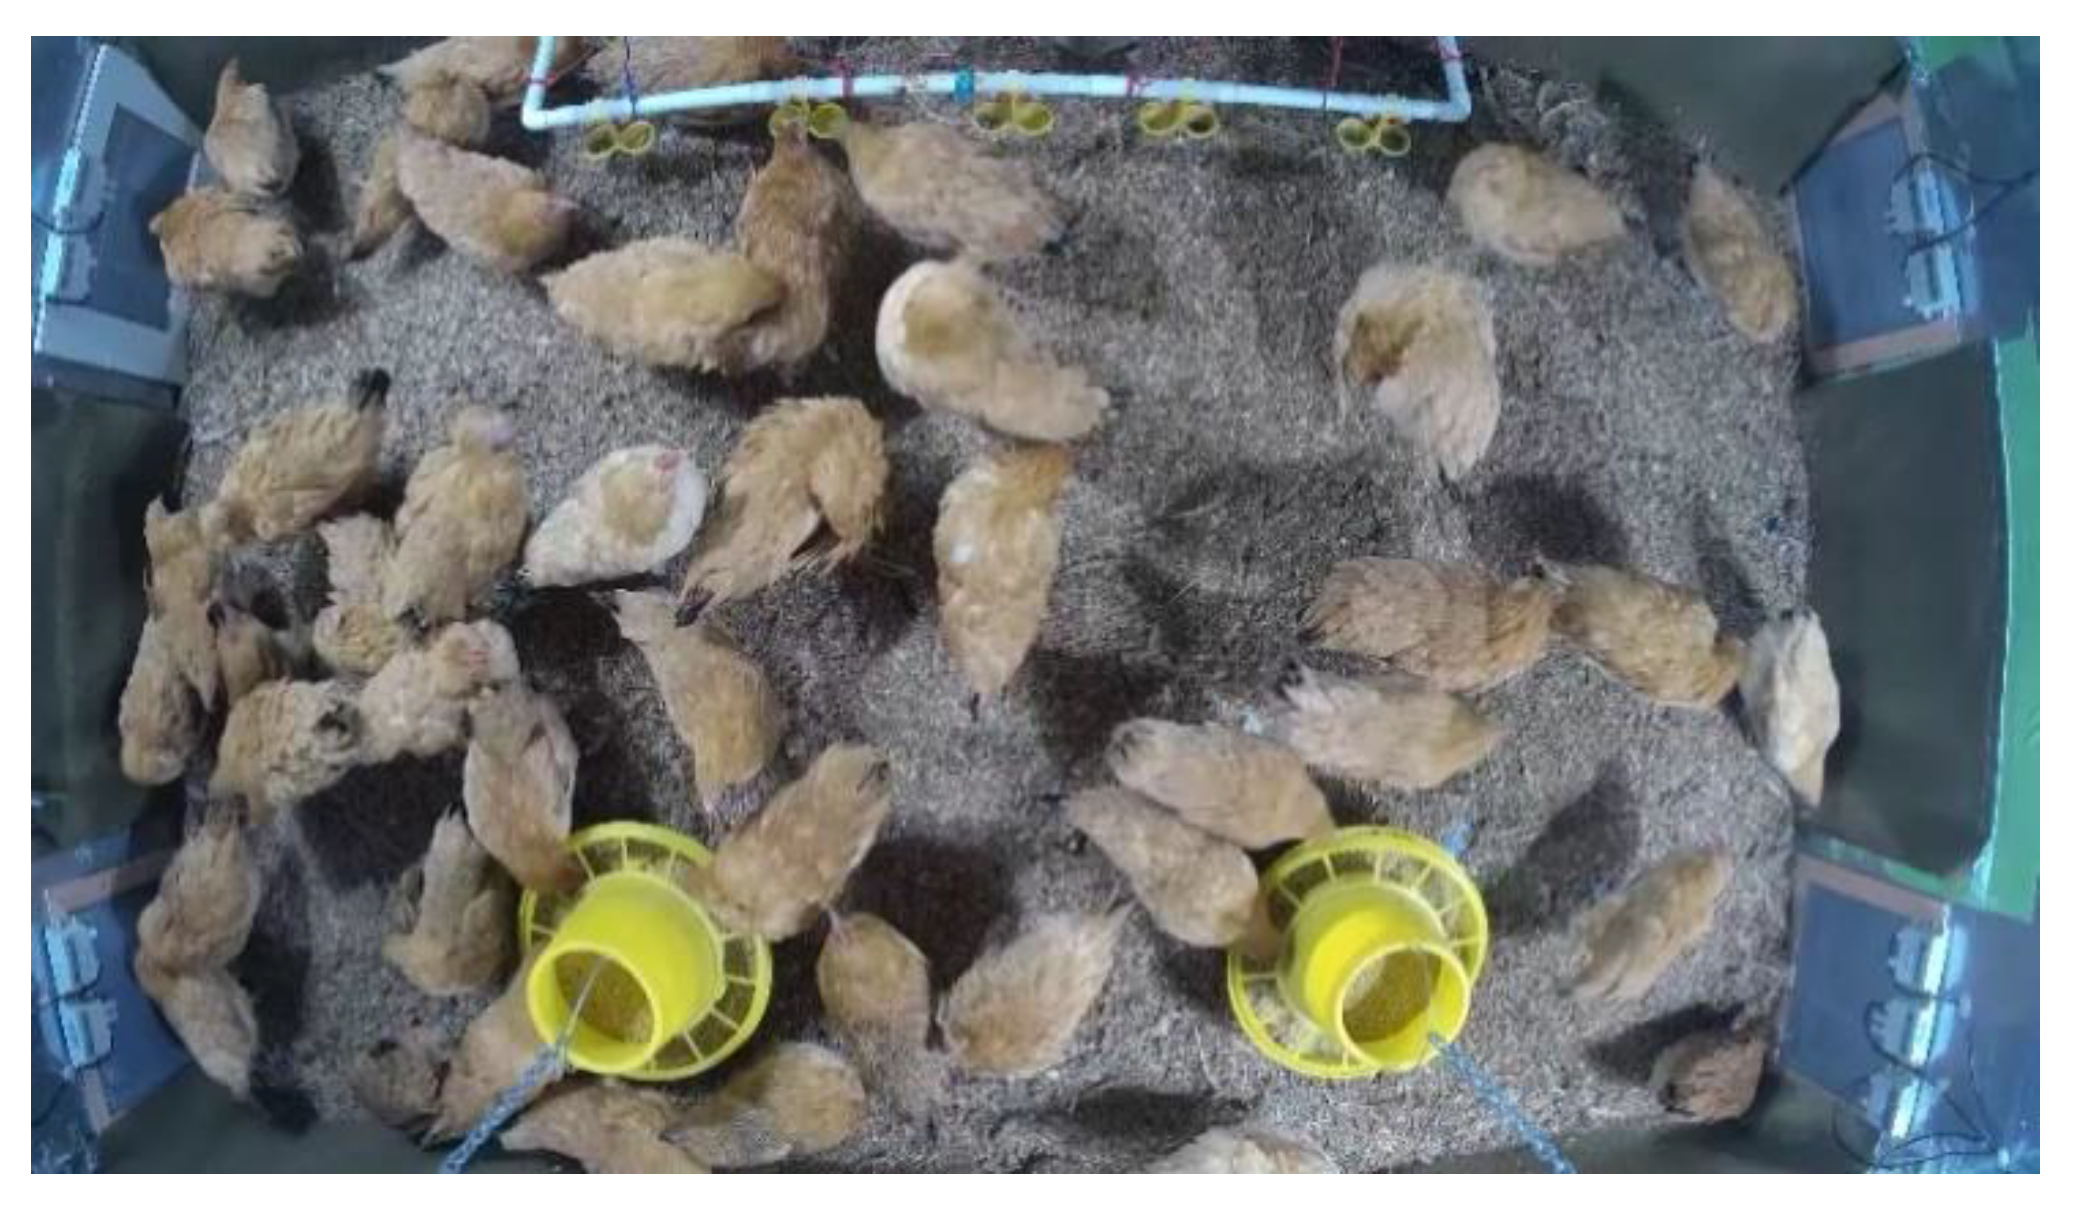
2.1.1. Basic Information about the Experiment

The used broiler house in the following experiment was located in Jinniuhu Street, Liuhe District, Nanjing, Jiangsu, China with longitude coordinates of 118°52′64″ E and latitude coordinates of 32°26′77″ N. The walls around the chamber of broiler house were made of 55 mm color steel sandwich panel. The width of the broiler chamber was 1.9 m, the length was 2.9 m, and the total area was 5.51 m2. The roof was of a slope type, with a clear height of 1.88 m on the west side and a clear height of 1.77 m on the east side, which made it easier to drain the rainwater from the west side to the east side. The ventilation system in the broiler chamber was composed of an air inlet, an air outlet and an internal circulation (the part connected by the openings at both ends through the pipe). Two Pulinleshi 400 negative pressure air fans (Fan A and Fan B) were installed at the two outlets of internal circulation and external circulation; the rated air volume of the fan was 9000 m3/h, and the frequency conversion controllers with various frequencies were installed accordingly to satisfy various temperature conditions. Furthermore, a ventilation scheme was designed for a variety of seasons and temperatures based on the fan parameters [17,18].

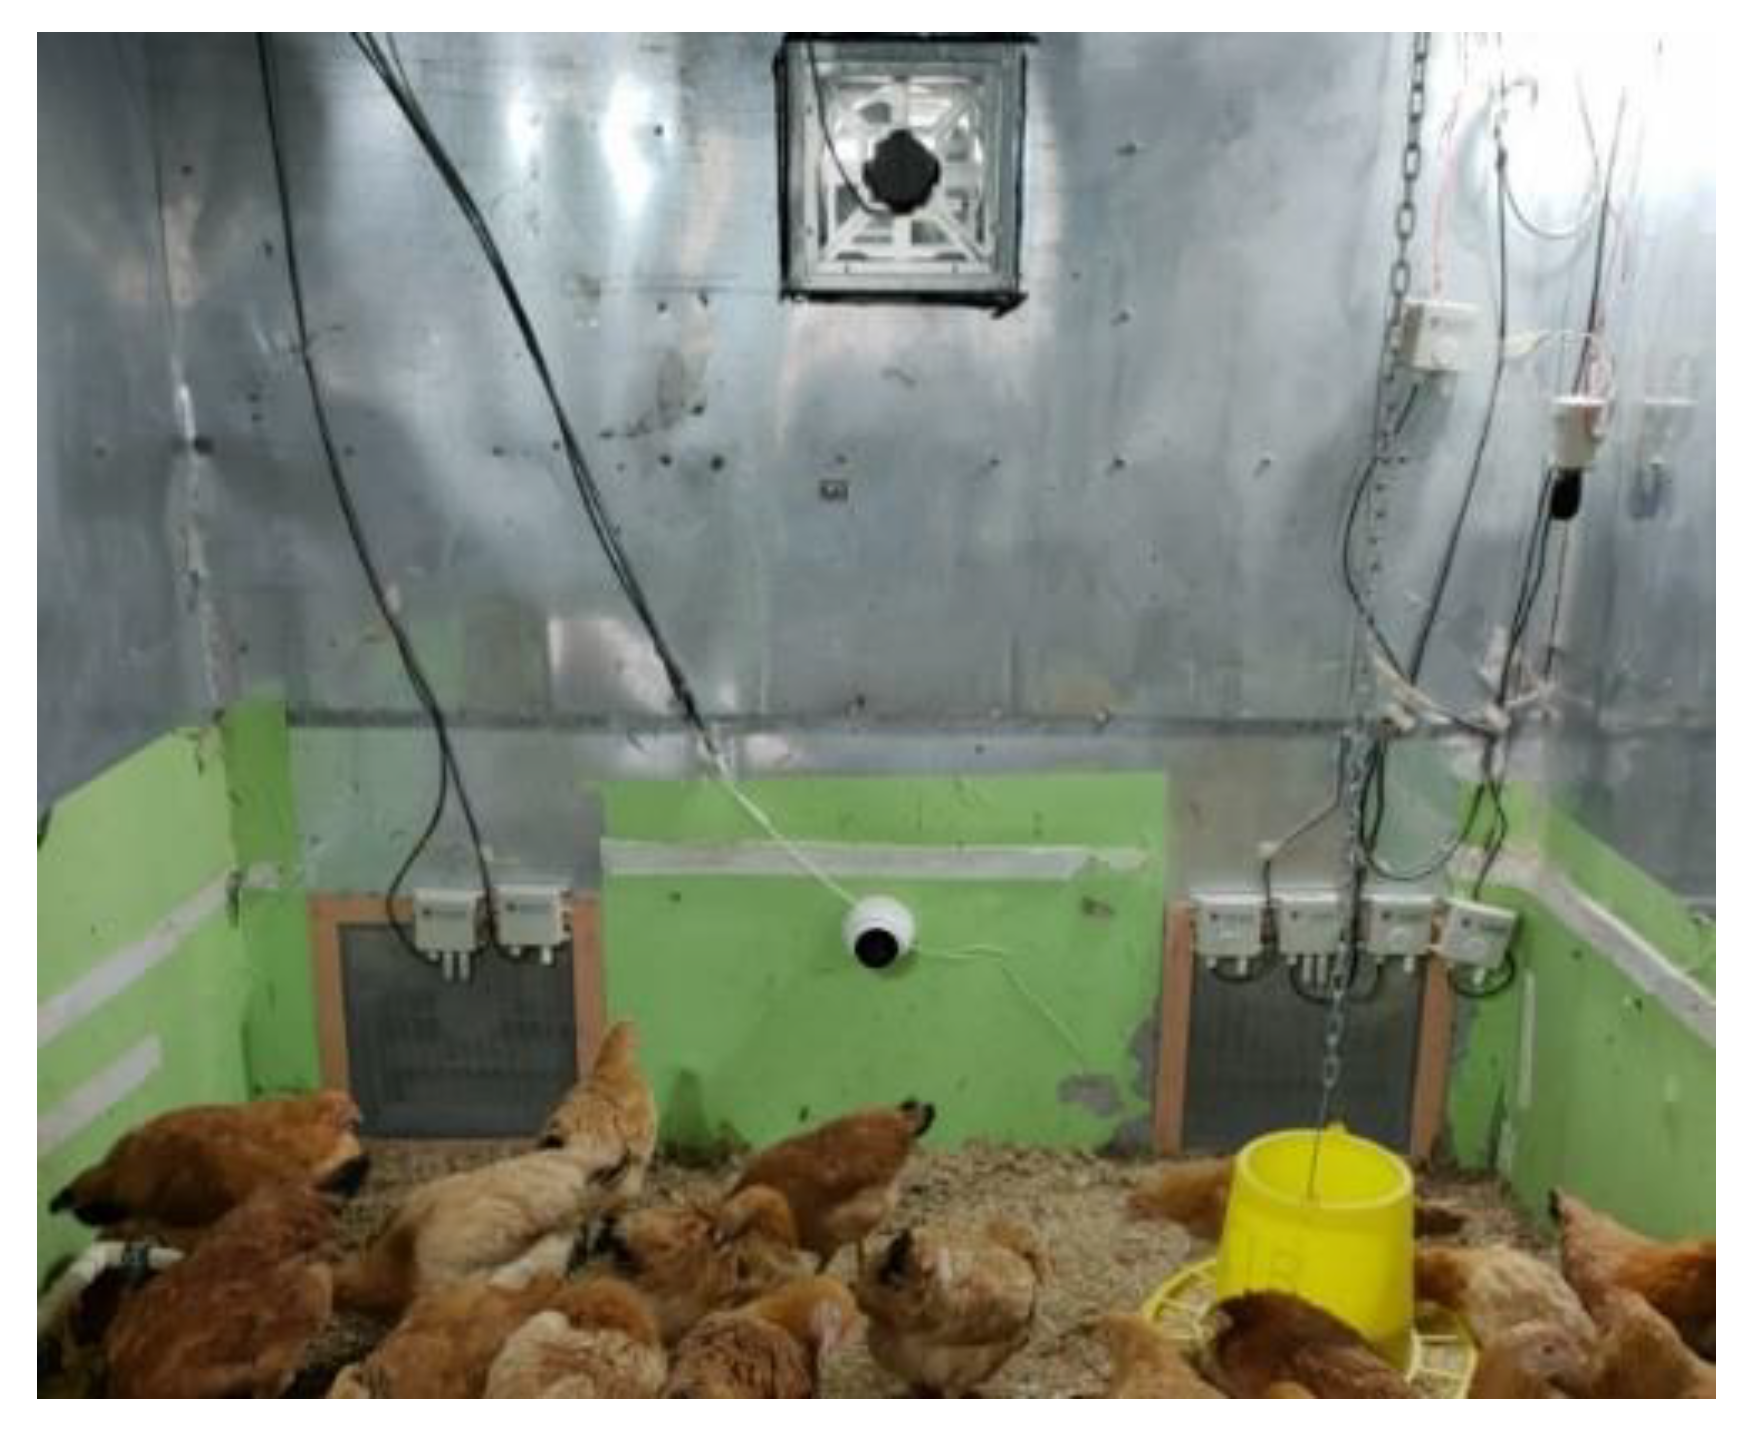
2.1.2. Experimental Arrangement

The experiment was scheduled between 5 December 2019 and 12 January 2020, and lasted 38 days. More specifically, 45 yellow-feathered broilers were raised inside the experimental broiler chamber. Before starting to raise broilers in the chamber, we selected broilers with a weight of about 800 g and an age of about 75 days. Moreover, a high-definition camera was mounted at the top center of the chamber for recording purposes.
During the breeding process of the selected broilers in winter, the negative pressure fan ventilation reduced the production of harmful gases in the broiler chamber, which was closed. The reduction of ammonia further reduced the temperature loss rate. The two air outlet fans (Fan A and Fan B) of the broiler chamber worked independently, and the frequency modulation scheme was provided according to the actual indoor temperature. In this paper, the simulation results were generated mainly based on the working conditions presented in Table 1.
Before conducting the experiments, a yellow-feathered broiler was used to measure and determine the model size of each broiler before raising the broilers inside the broiler chamber. More details regarding the process of measuring the model size of each broiler is demonstrated in Figure 1.
Based on the measurement results, the size of an adult broiler is defined as 30 cm in length, 20 cm in width, 20 cm in height from the thigh to the back, and 10 cm in height above the neck. The broiler sample used to measure and determine the model size is demonstrated in Figure 2.
In the conducted experiments, 45 yellow-feathered broilers were raised and screened in the described broiler chamber. Therefore, geometric modeling was carried out for a single broiler to improve the simulation accuracy. As described by Cheng et al. [19], common models for a single broiler include the body only model, the block body model and the ellipsoid model. Based on the result of a competitive study in simulations, we decided to use the block body model as the research model [20]. To improve the calculation efficiency and accuracy, the broiler model was simplified according to the original volume, as shown in Figure 3.

2.1.3. Optimized Experimental Arrangement

We further optimized the ventilation system based on the results of the first experiment. The second experiment was scheduled between 1 January 2021 and 28 January 2021, which lasted for 28 days. More specifically, 45 broilers were raised inside the broiler chamber with optimized ventilation system. Before starting to raise broilers in the chamber, we selected broilers with a weight of about 800 g and an age of about 75 days. Moreover, a high-definition camera was used to record video from the top center of the chamber.

2.2. Methods

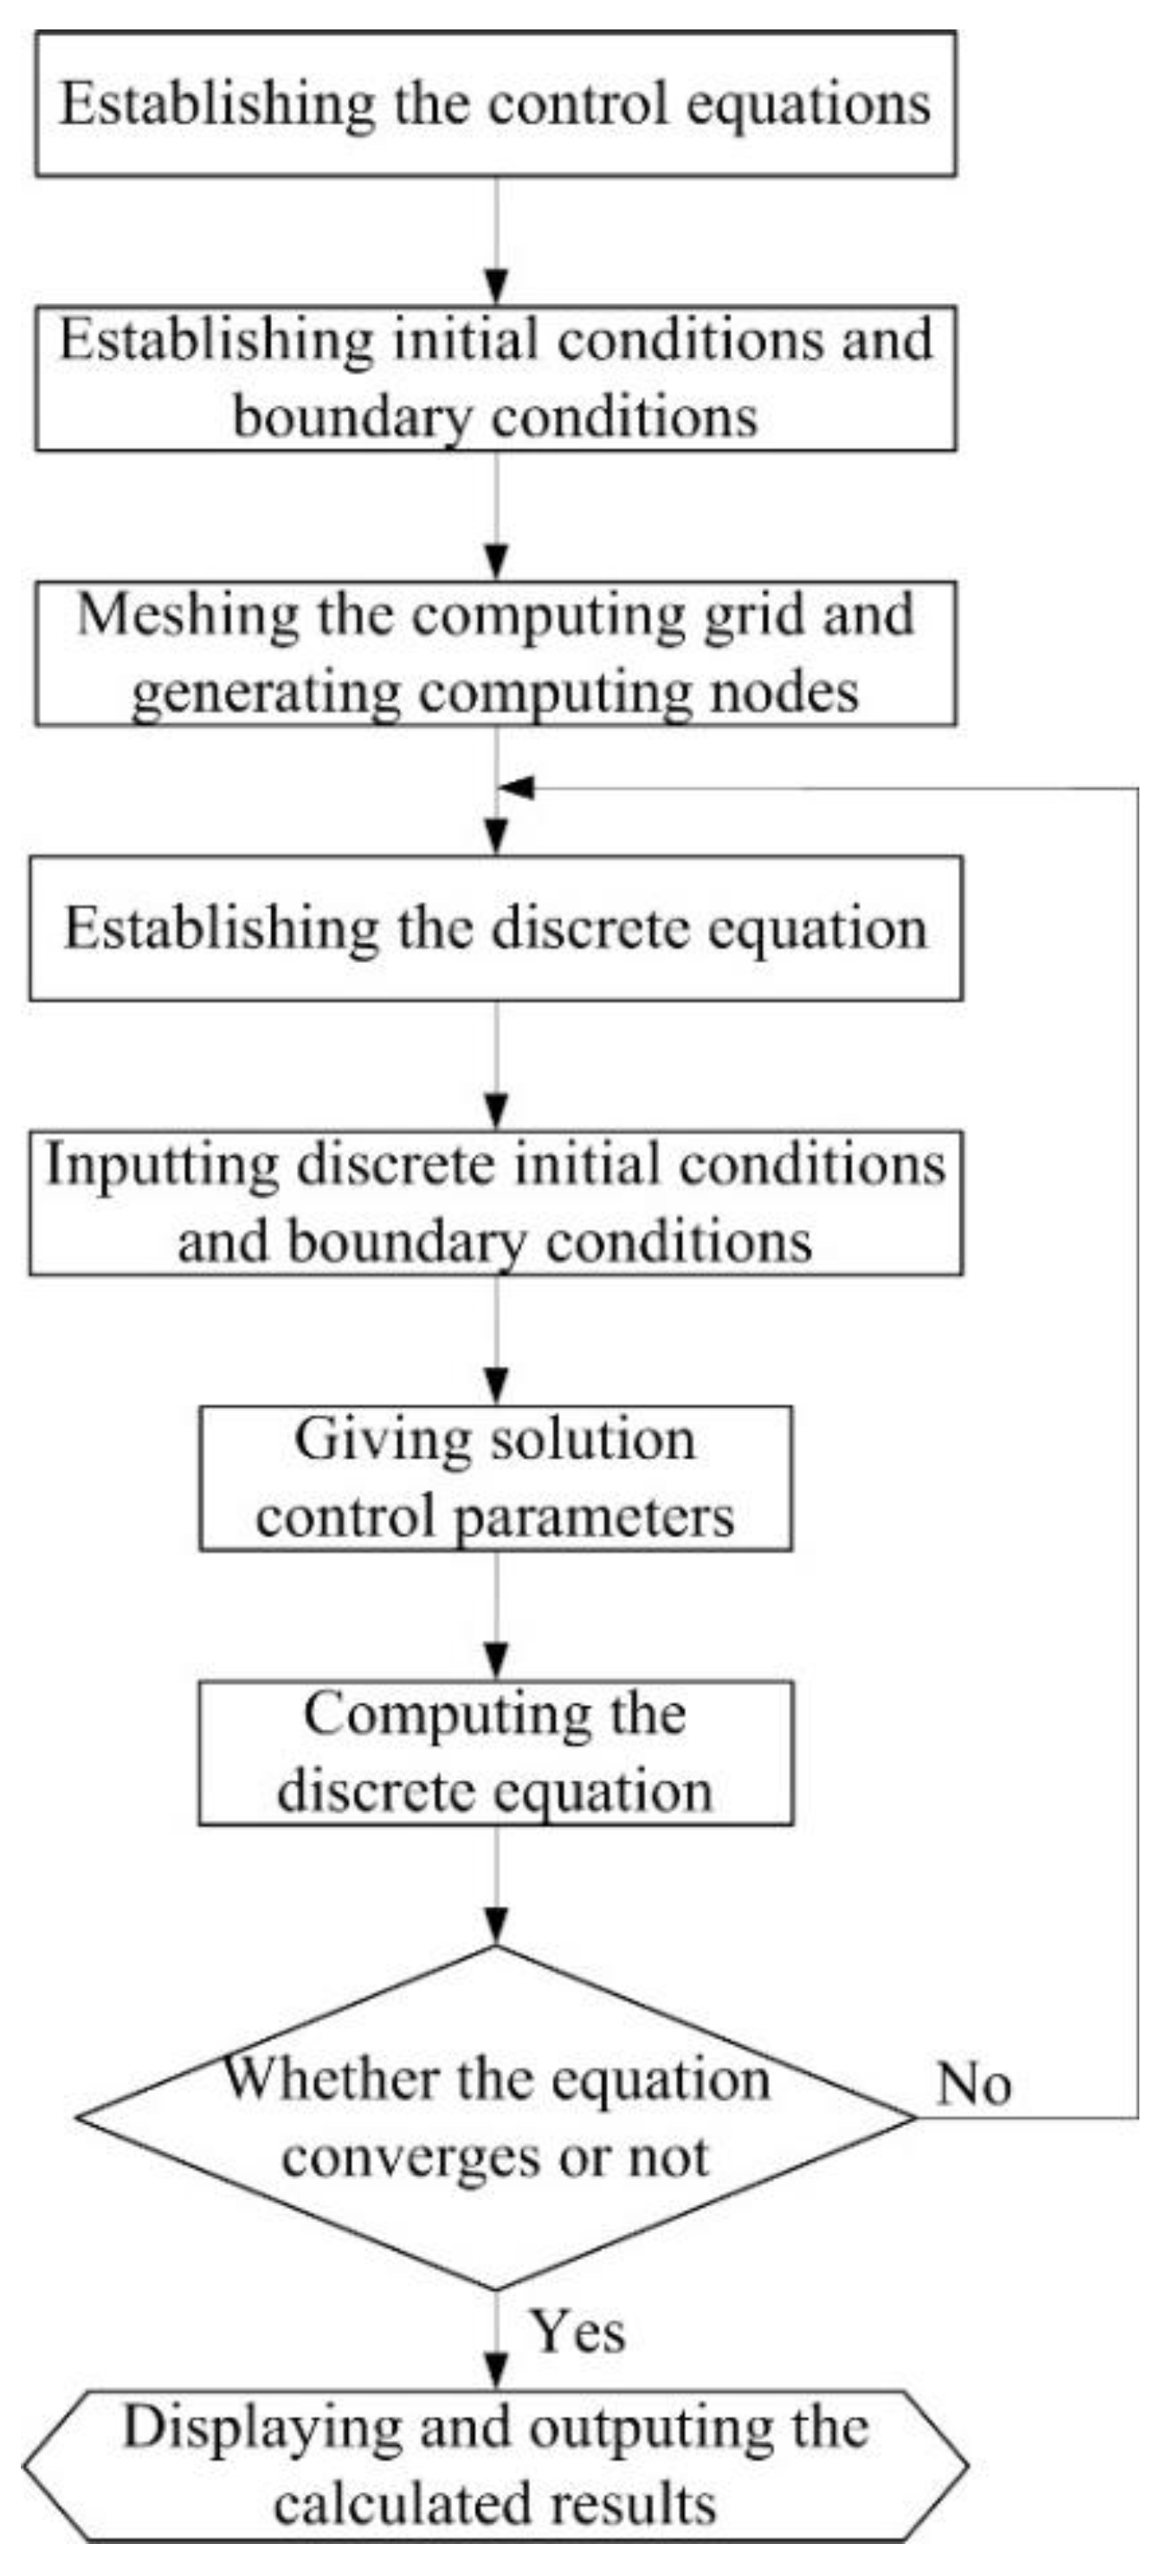
2.2.1. Technical Route

The value of ammonia concentration generated during the breeding process of selected broilers in the broiler chamber in winter was collected and calculated by zoning. Furthermore, the Integrated Computer Engineering and Manufacturing (ICEM) CFD was used to model the broiler chamber, divide the grid reasonably, and then select the appropriate solving model with boundary conditions. After that, Fluent software (ANSYS Inc., Pittsburgh, PA, USA) was applied to simulate ammonia concentration distribution. Finally, CFD-POST (ANSYS Inc., Pittsburgh, PA, USA) was applied to analyze the simulation results. Figure 4 demonstrates the systematic process of CFD calculation as a flowchart.

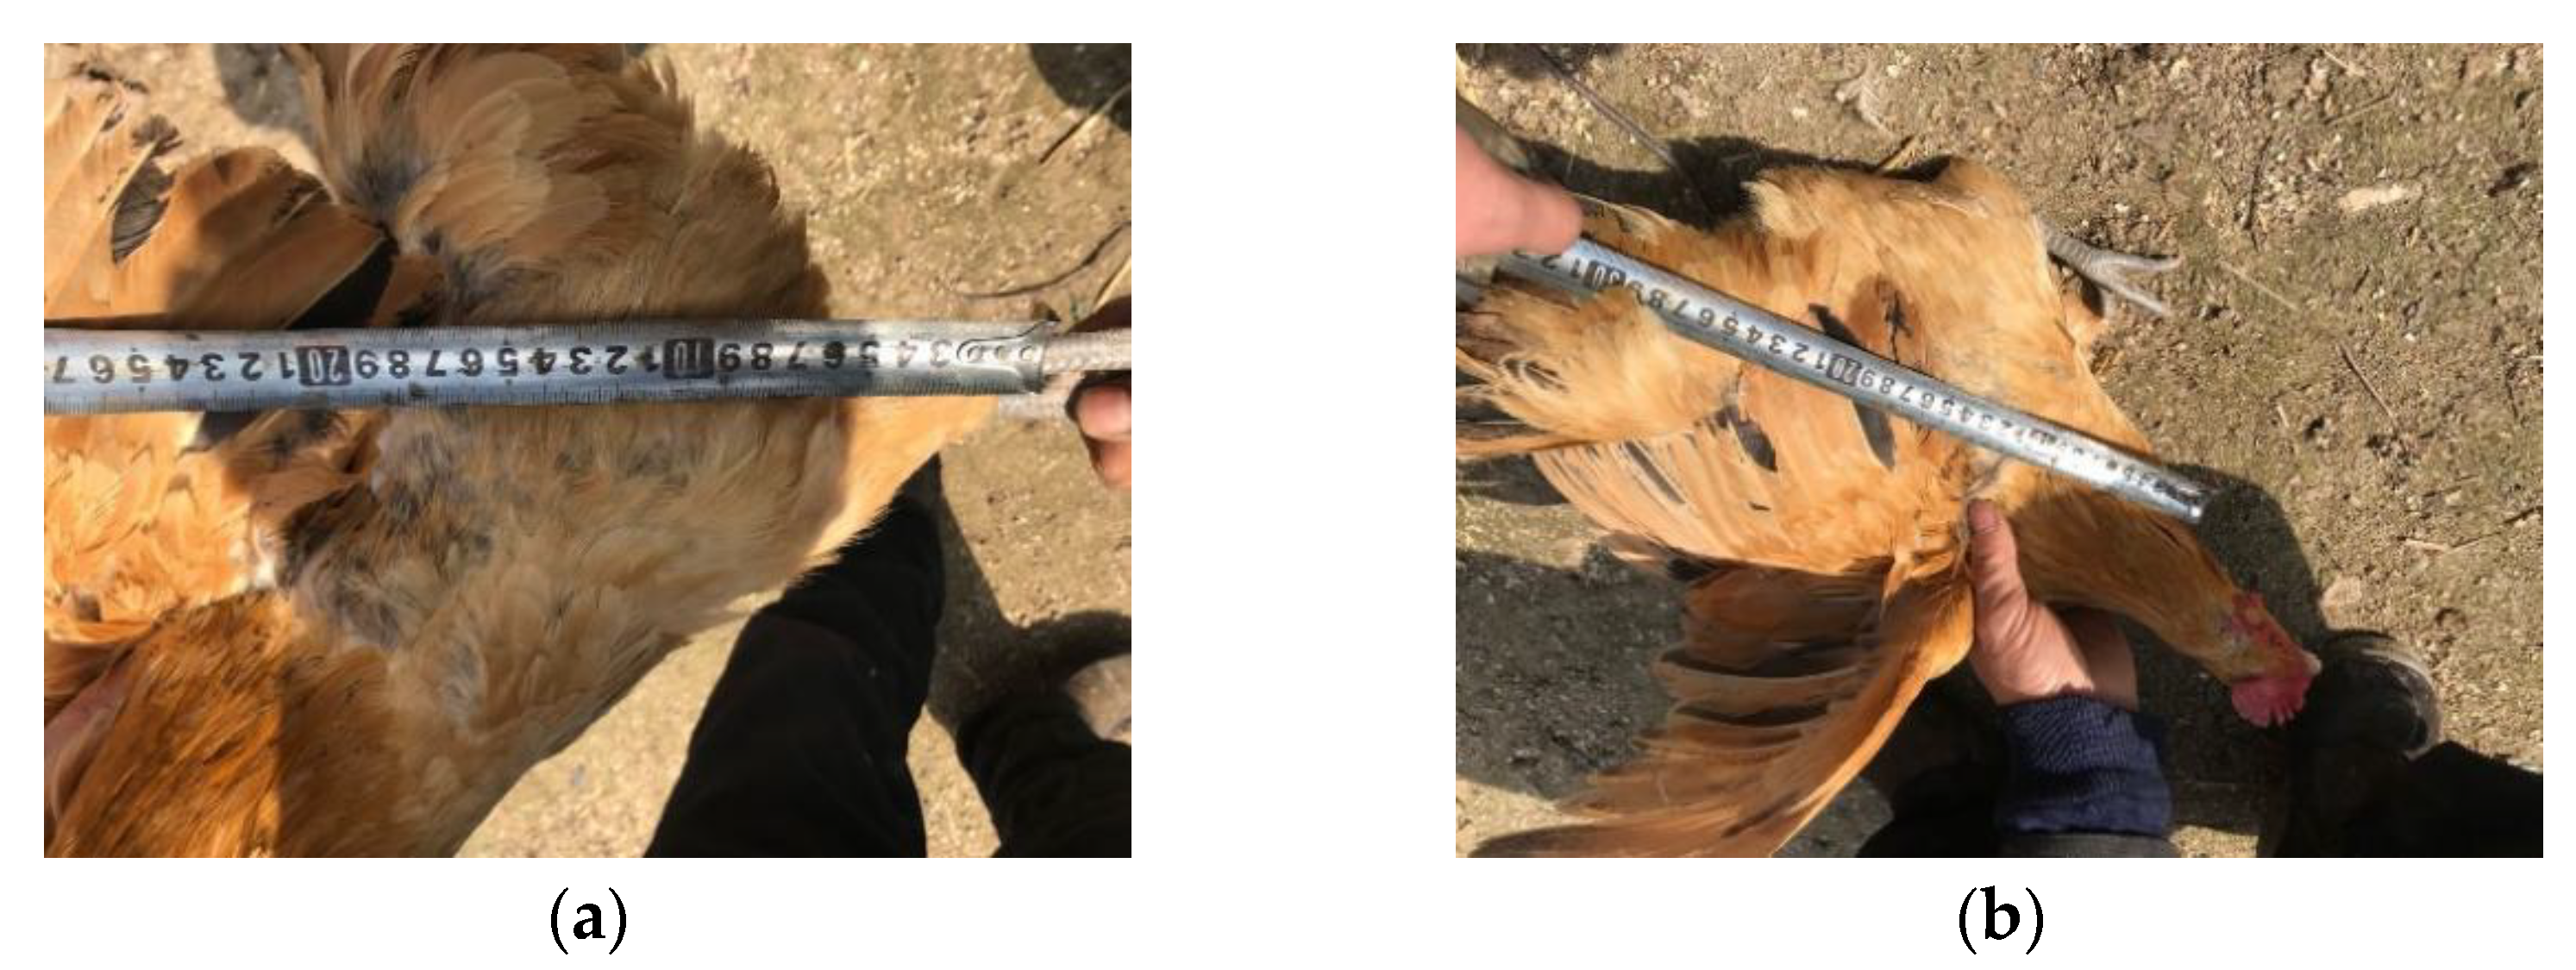
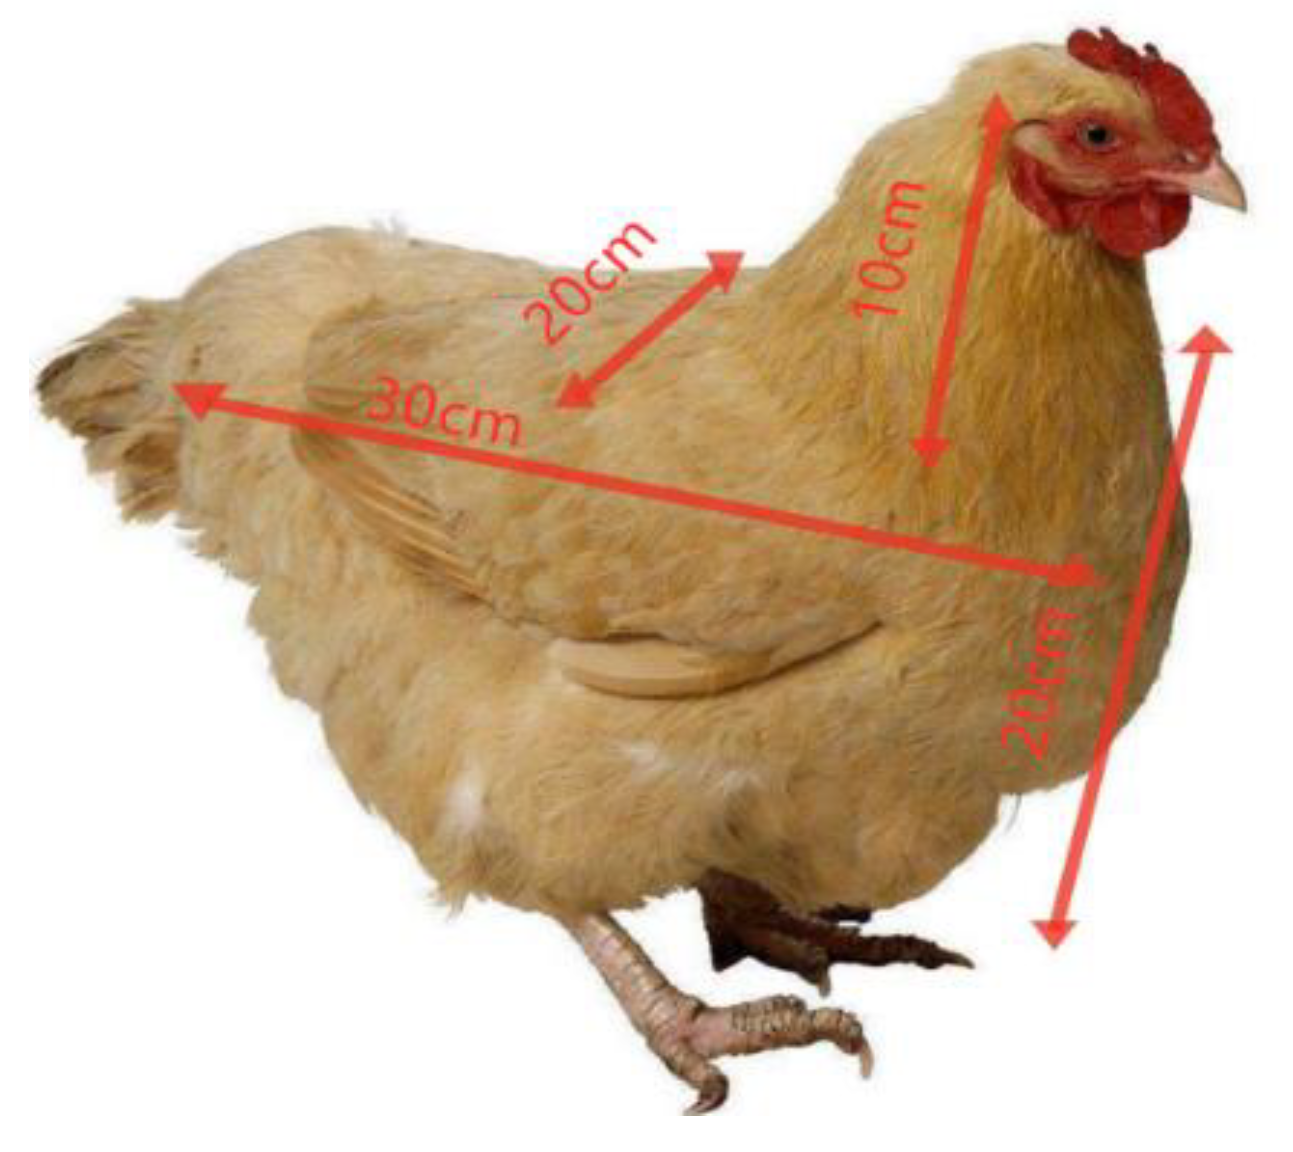
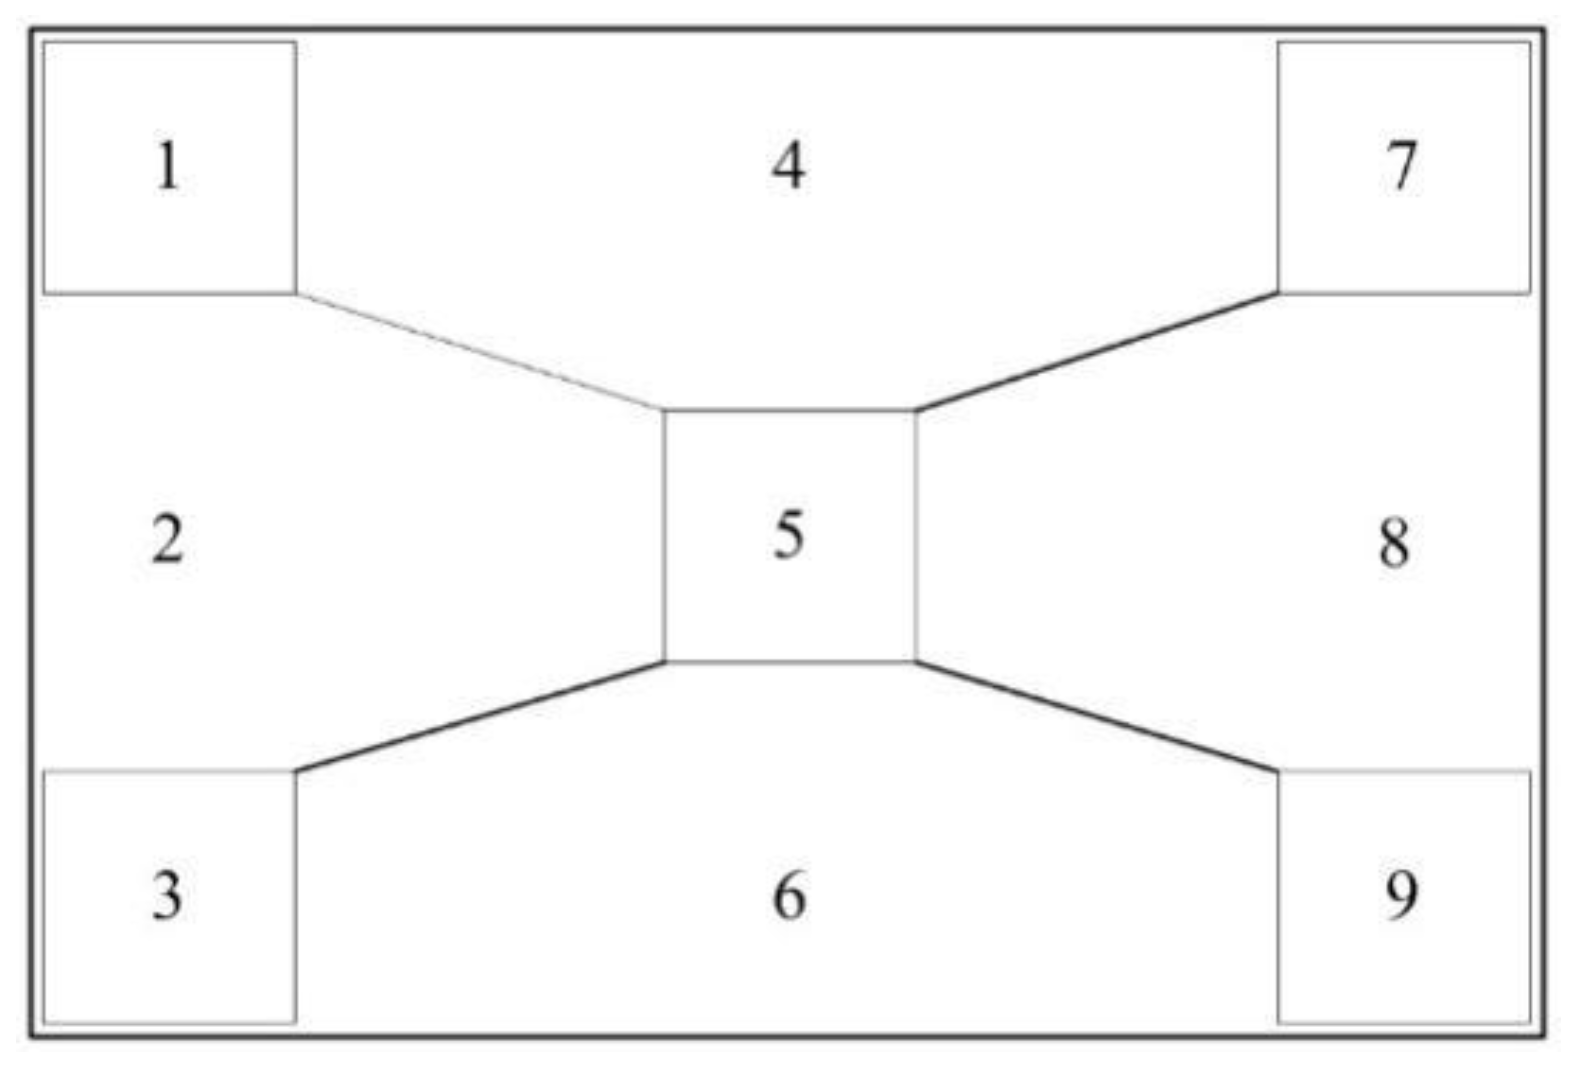
2.2.2. Monitoring Area Division and Gas Mass Determination

As shown in Figure 5, the two air inlets, two air outlets and the center of the broiler chamber floor were divided into five square parts (Part 1, Part 3, Part 5, Part 7 and Part 9), with the length of each square part being 0.6 cm. In each of these five parts, a high-precision ammonia transmitter was placed to monitor ammonia concentration. The remaining region was divided into four non-square parts, namely Part 2, Part 4, Part 6 and Part 8. In addition, the ammonia values in these four parts were obtained by using the neighborhood mean method, namely the average values measured by the three nearby parts.
The surface generated by ammonia was set as the mass inflow inlet and was converted according to the measurement point data and the conversion equation in Equations (1) and (2). The ammonia transmitter detected the value with an accuracy of 0.1 ppm, while the unit of mass inflow inlet was kilograms per second (kg/s). The measured height of the ammonia transmitter was 0.15 m away from the cushion material layer. The collected value represents the ammonia concentration value of the entire region. The stable result of the ammonia concentration value under various frequency converter conditions during the measurement process was considered as the concentration value, which belongs to the steady-state simulation. The surface area of each part is detailed in Figure 5 and the air mass within the measurement area is determined as Equation (1).
M 0 = V d   ρ air
where M 0 is the air mass (unit is kg); V d is the volume of the measured area, and the unit is m3; and ρ air is the air density, and the unit is kg / m 3.
v M = M 0 V 0
where v M is the mass flow rate, and the unit is m / s ; and V 0 is the measured concentration of ammonia corresponding to the region, and the unit is ppm .
The area and volume of each partition of the broiler living layer tested and the total air mass calculated according to Equation (2) are listed in Table 2.

2.2.3. Modeling and Meshing of CFD

Broiler Chamber Modeling

In the simulation of wind field with broiler chamber, the position distribution of broilers has different effects on the wind field. The videos were recorded from the top center of the broiler chamber. To improve the image resolution, we replaced the 2-megapixel Haikang network camera in the broiler chamber with an 8-megapixel high-definition network camera. Regarding the perspective of the recorded videos, all of them were recorded from the top center of the broiler. To provide a more intuitive view from the camera, Figure 6 demonstrates a photo randomly selected from the recorded video stream data. This research mainly examined the wind speed and wind velocity flow field layout in the random distribution area of broilers, and compared this to the wind velocity of the empty chamber; this was carried out to analyze the influence of broilers on the wind field of the broiler chamber, so as to bring about better improvements and optimization for future research.
In ICEM CFD software, broilers were simplified as block body models: the body part was expressed as a cube with dimensions of 30 cm × 20 cm × 20 cm, and the head part was expressed as a cube with dimensions of 10 cm × 10 cm × 10 cm. The block body model was composed of two geometrical bodies, and 45 broilers were placed in winter. Figure 6 illustrates the distribution of broilers in the broiler chamber model. Figure 7 shows the distribution in the broiler chamber model after the transformation of the block model.

Grid Division of Broiler Chamber

To improve the computing speed and the quality of the grid, a three-dimensional model was established in the ICEM CFD 2019R1 (ANSYS Inc., Pittsburgh, PA, USA). In the model, the formula of the broiler chamber was simplified: to be more specific, the steel frame structure of the top was removed and the internal structure was simplified as much as possible without the effect of the simulation results, and the non-structural grid was used to divide the empty broiler chamber. The maximum length of the whole broiler mill model was set to 0.05 m. Due to the fact that the main activity area of the broiler was at the bottom of the broiler chamber, our research focuses more on the impact of surface ventilation on the broilers’ health. We had a grid encryption of the broiler chamber that contain 45 square models. The total number of the model grid was 4,817,444, and the grid check quality was 0.2, which meets the requirements of the calculation. The results of the broiler comb grid are detailed in Figure 8.

2.2.4. Boundary Condition Setting

Determination of Ammonia Concentration Value

The ammonia concentration values in Parts 1, 3, 5, 7 and 9 were measured according to the 9 zones in Figure 5. The ammonia concentration values in Parts 2, 4, 6 and 8 were calculated using Equation (3). The ammonia transmitter recorded the values every minute. After the ammonia concentration reached a constant level under a certain working condition, the average value of the three times was considered the ammonia concentration value under the stable working condition. The values are shown in Table 3.
c = i = 0 2 c i 3
where c is the ammonia concentration value in Parts 2, 4, 6 and 8, and the unit is ppm; c i is the ammonia concentration value in Parts 1, 3, 5, 7 and 9, and unit is ppm.
Substituting each of the values from Table 3 into Equation (2), the ammonia mass indicating the ammonia flow through each part per second was obtained. The density of ammonia is equal to 0.771 mg/mL. The calculated values of the total mass of ammonia in the calculation area are shown in Table 4.

Fluent Solution Mode Setting

After the mesh model was completed, the simulation calculation was carried out in the broiler chamber with 45 square model broilers in the actual position in Fluent 2019R1. The SST K-ω model was adopted. The SST K-ω model incorporates the cross diffusion derived from the ω equation. Its turbulent viscosity takes into account the wave propagation of turbulent shear stress. These improvements make the SST K-ω model more accurate and reliable over a wide range of flow fields than the standard K-ω model. The values of Fluent solution setting parameters are shown in Table 5.

3. Results and Discussion

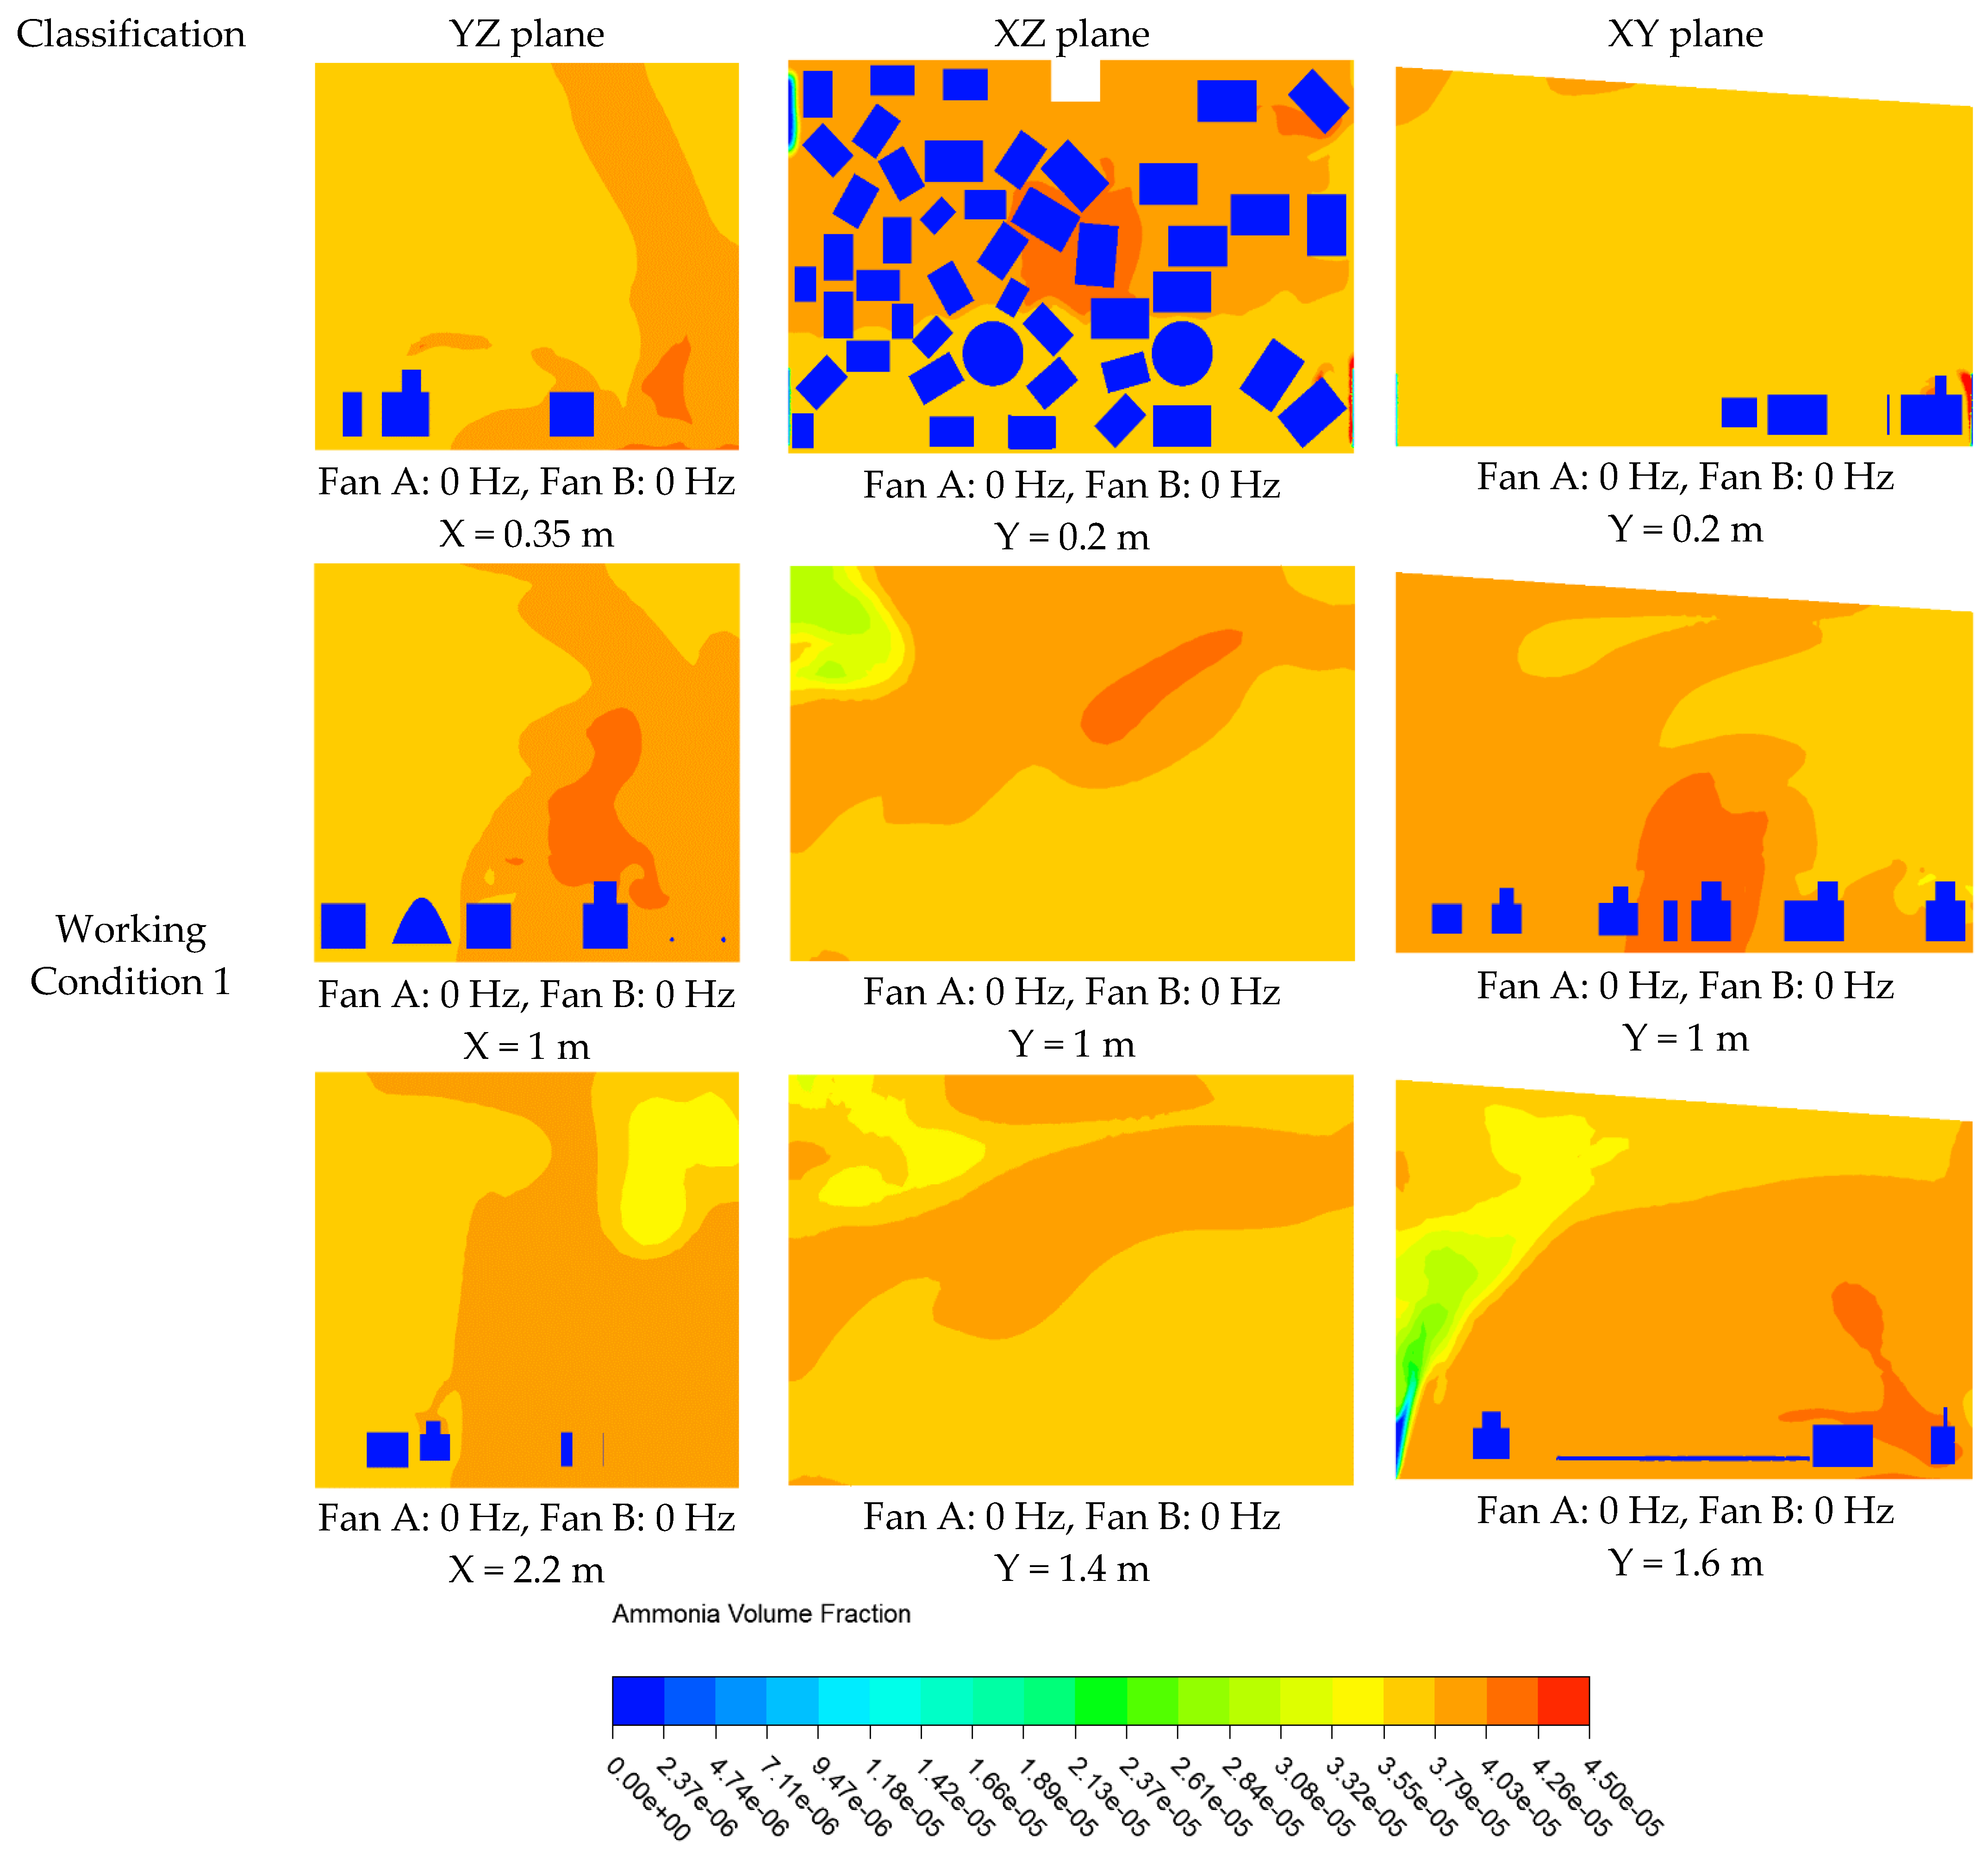
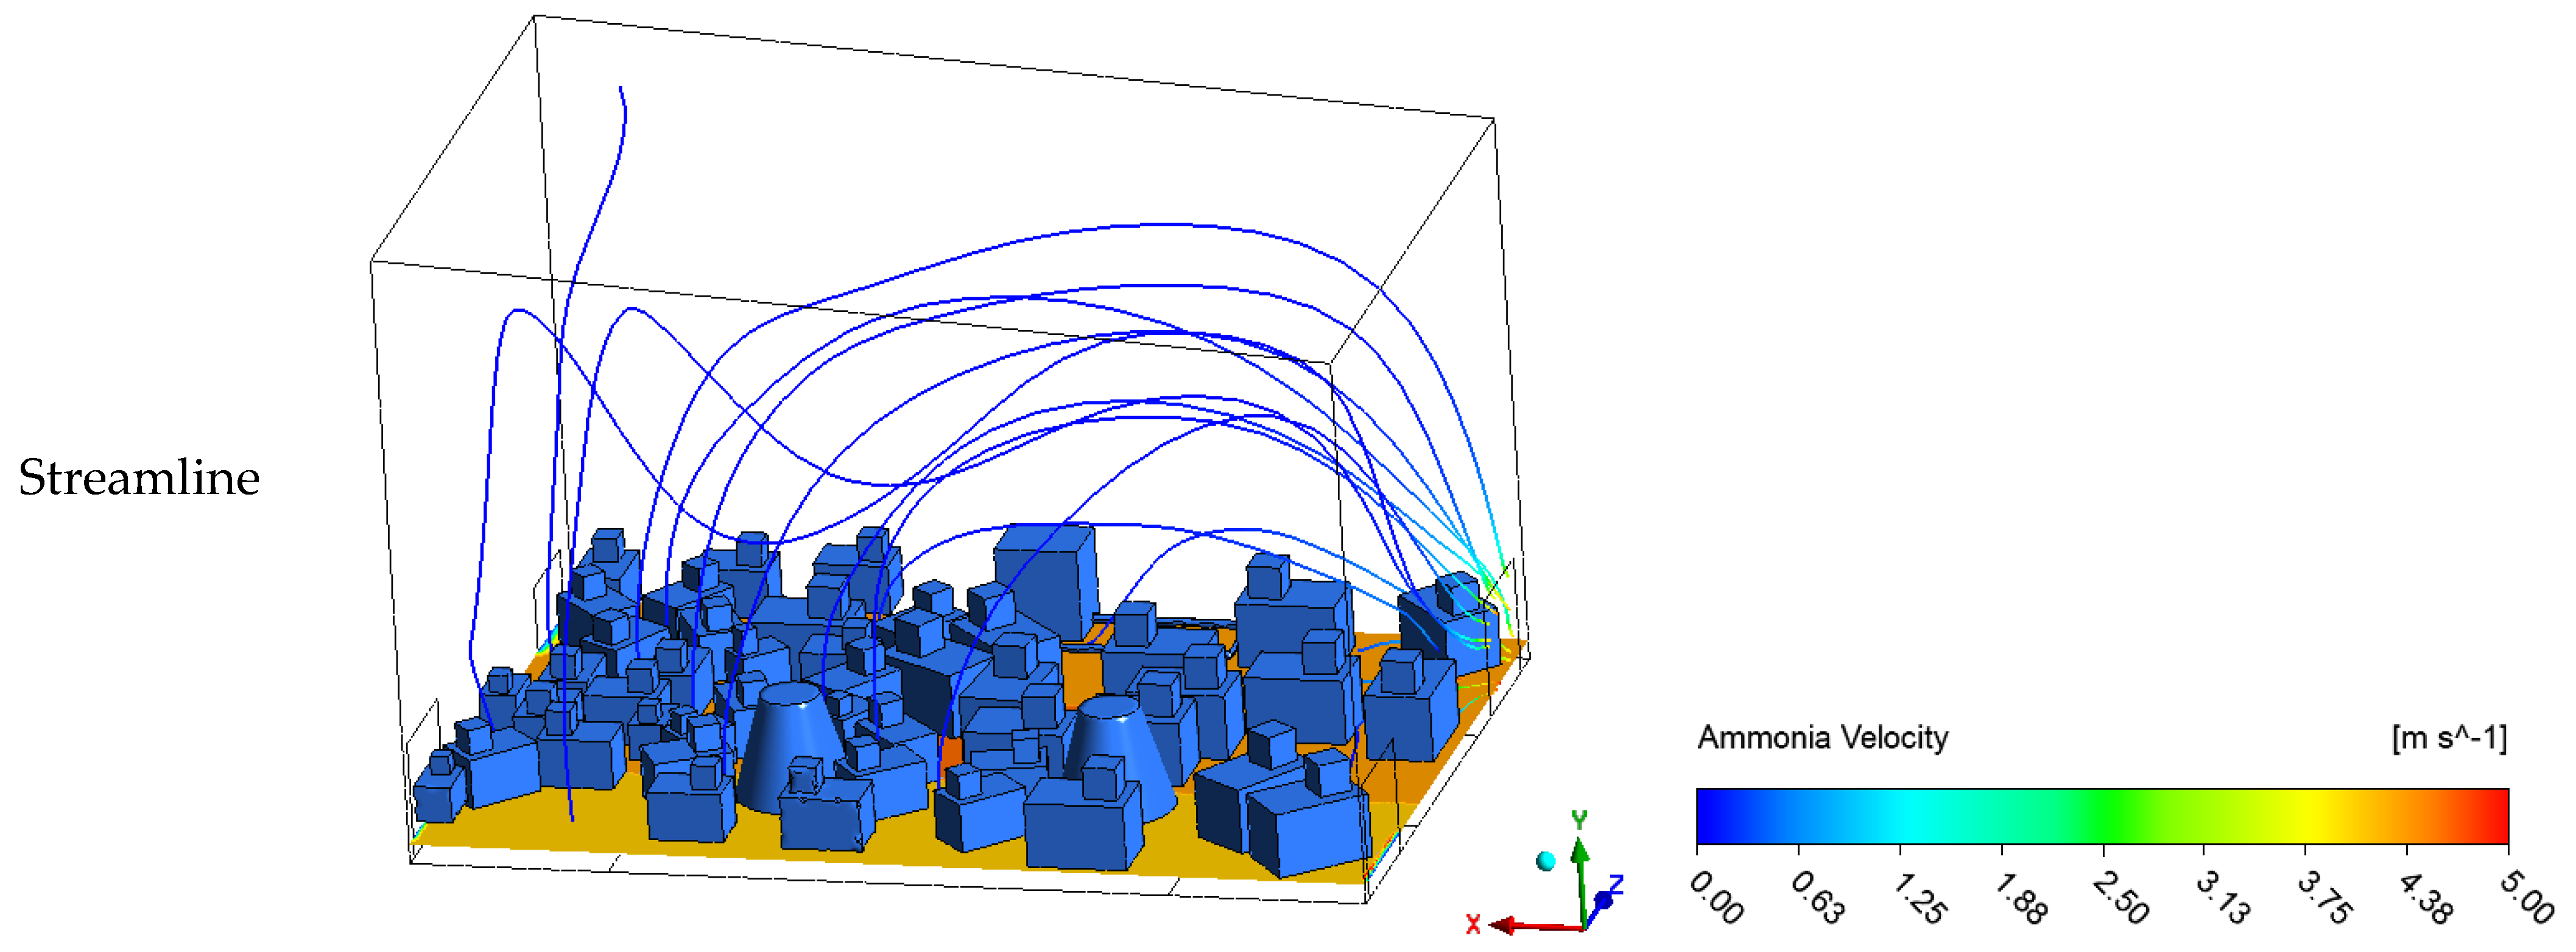
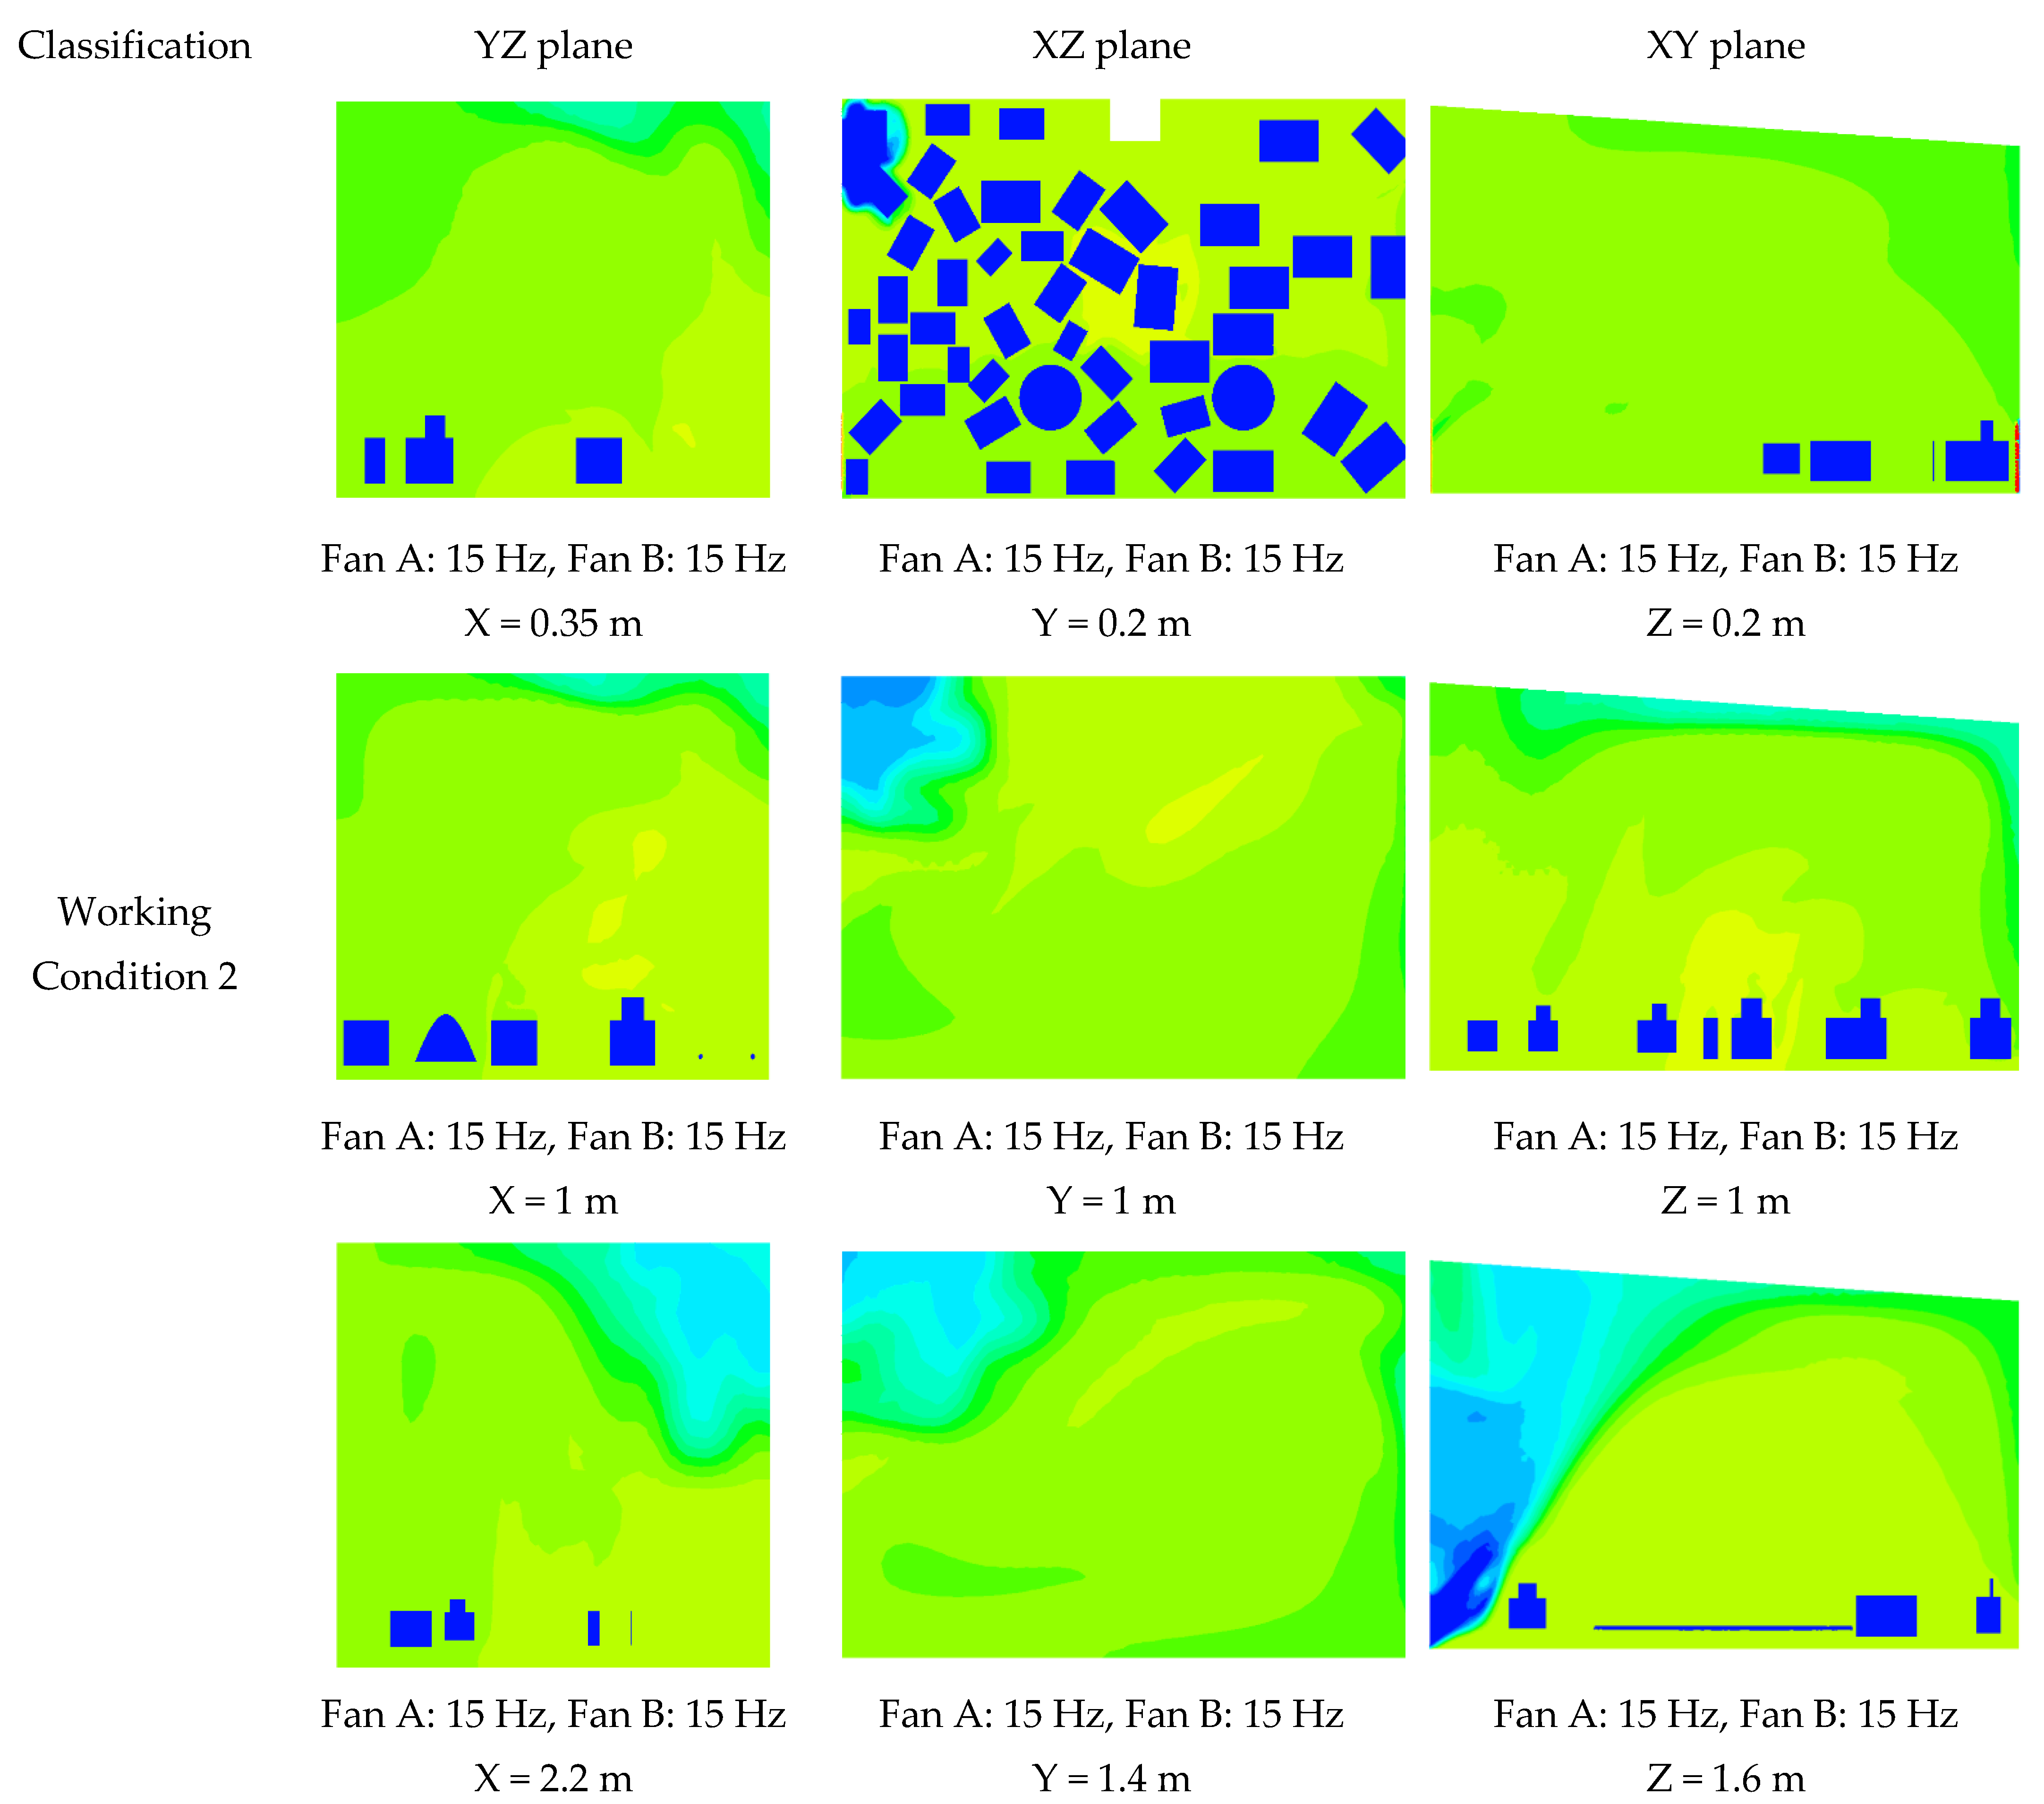
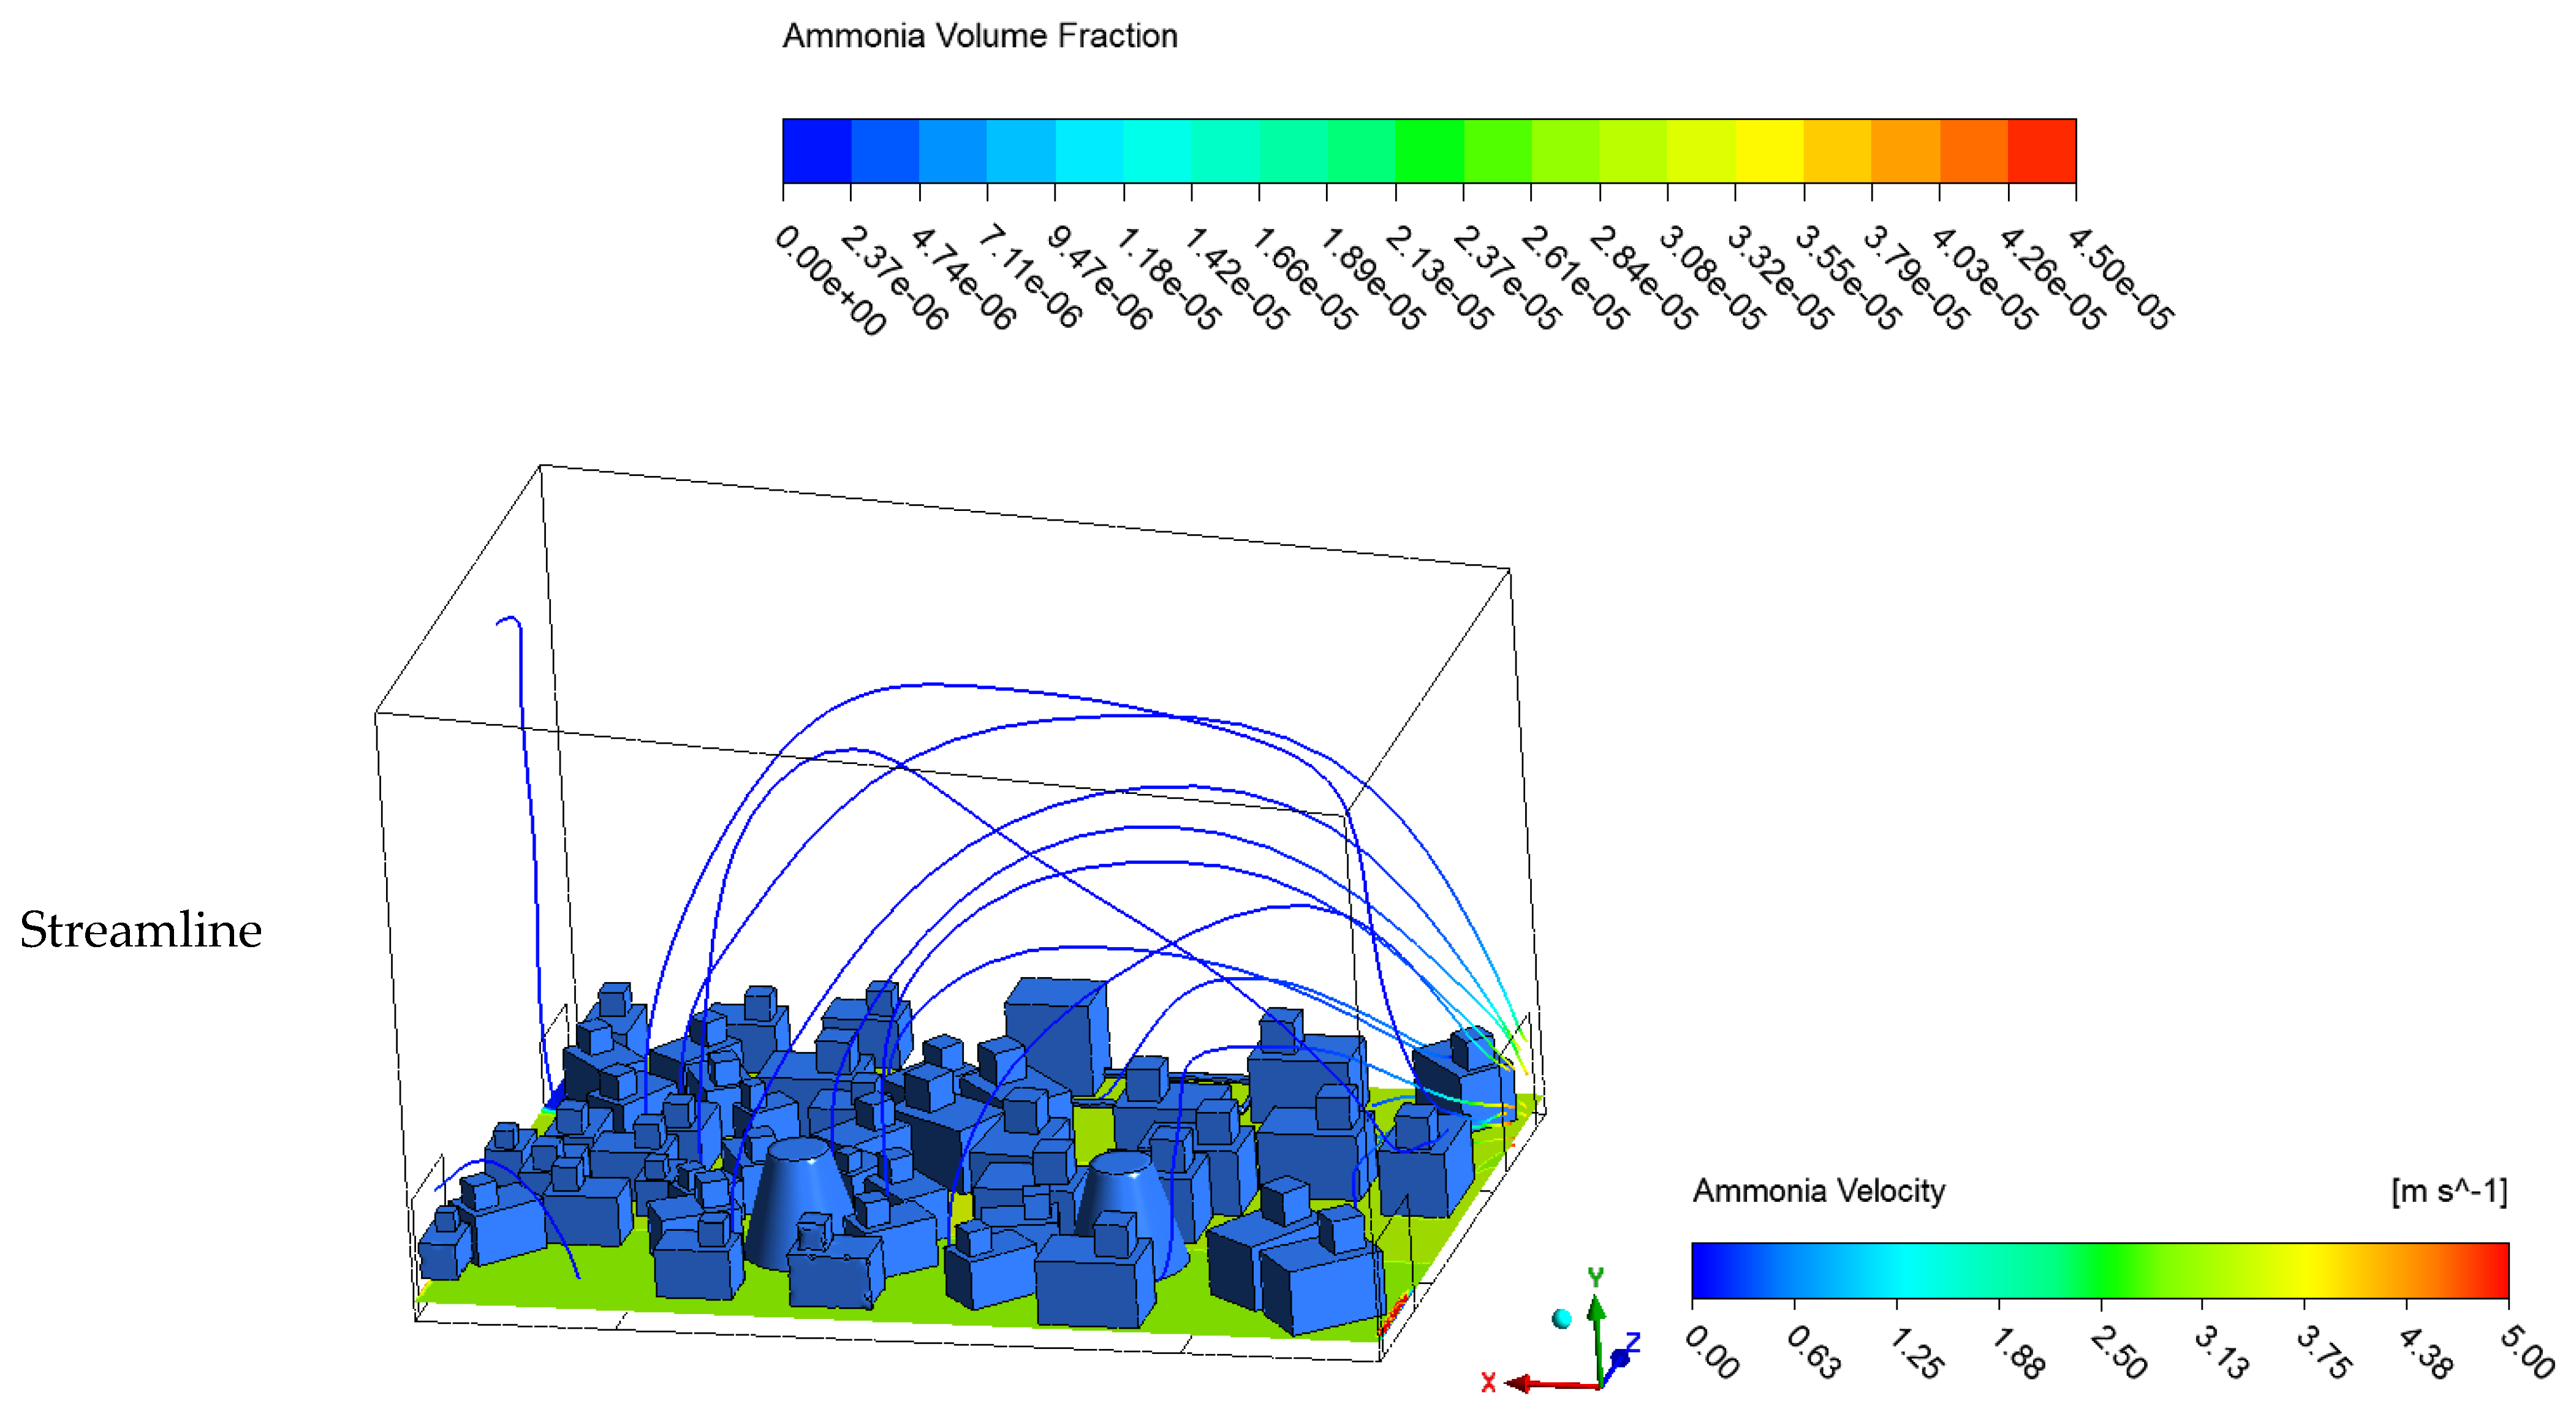
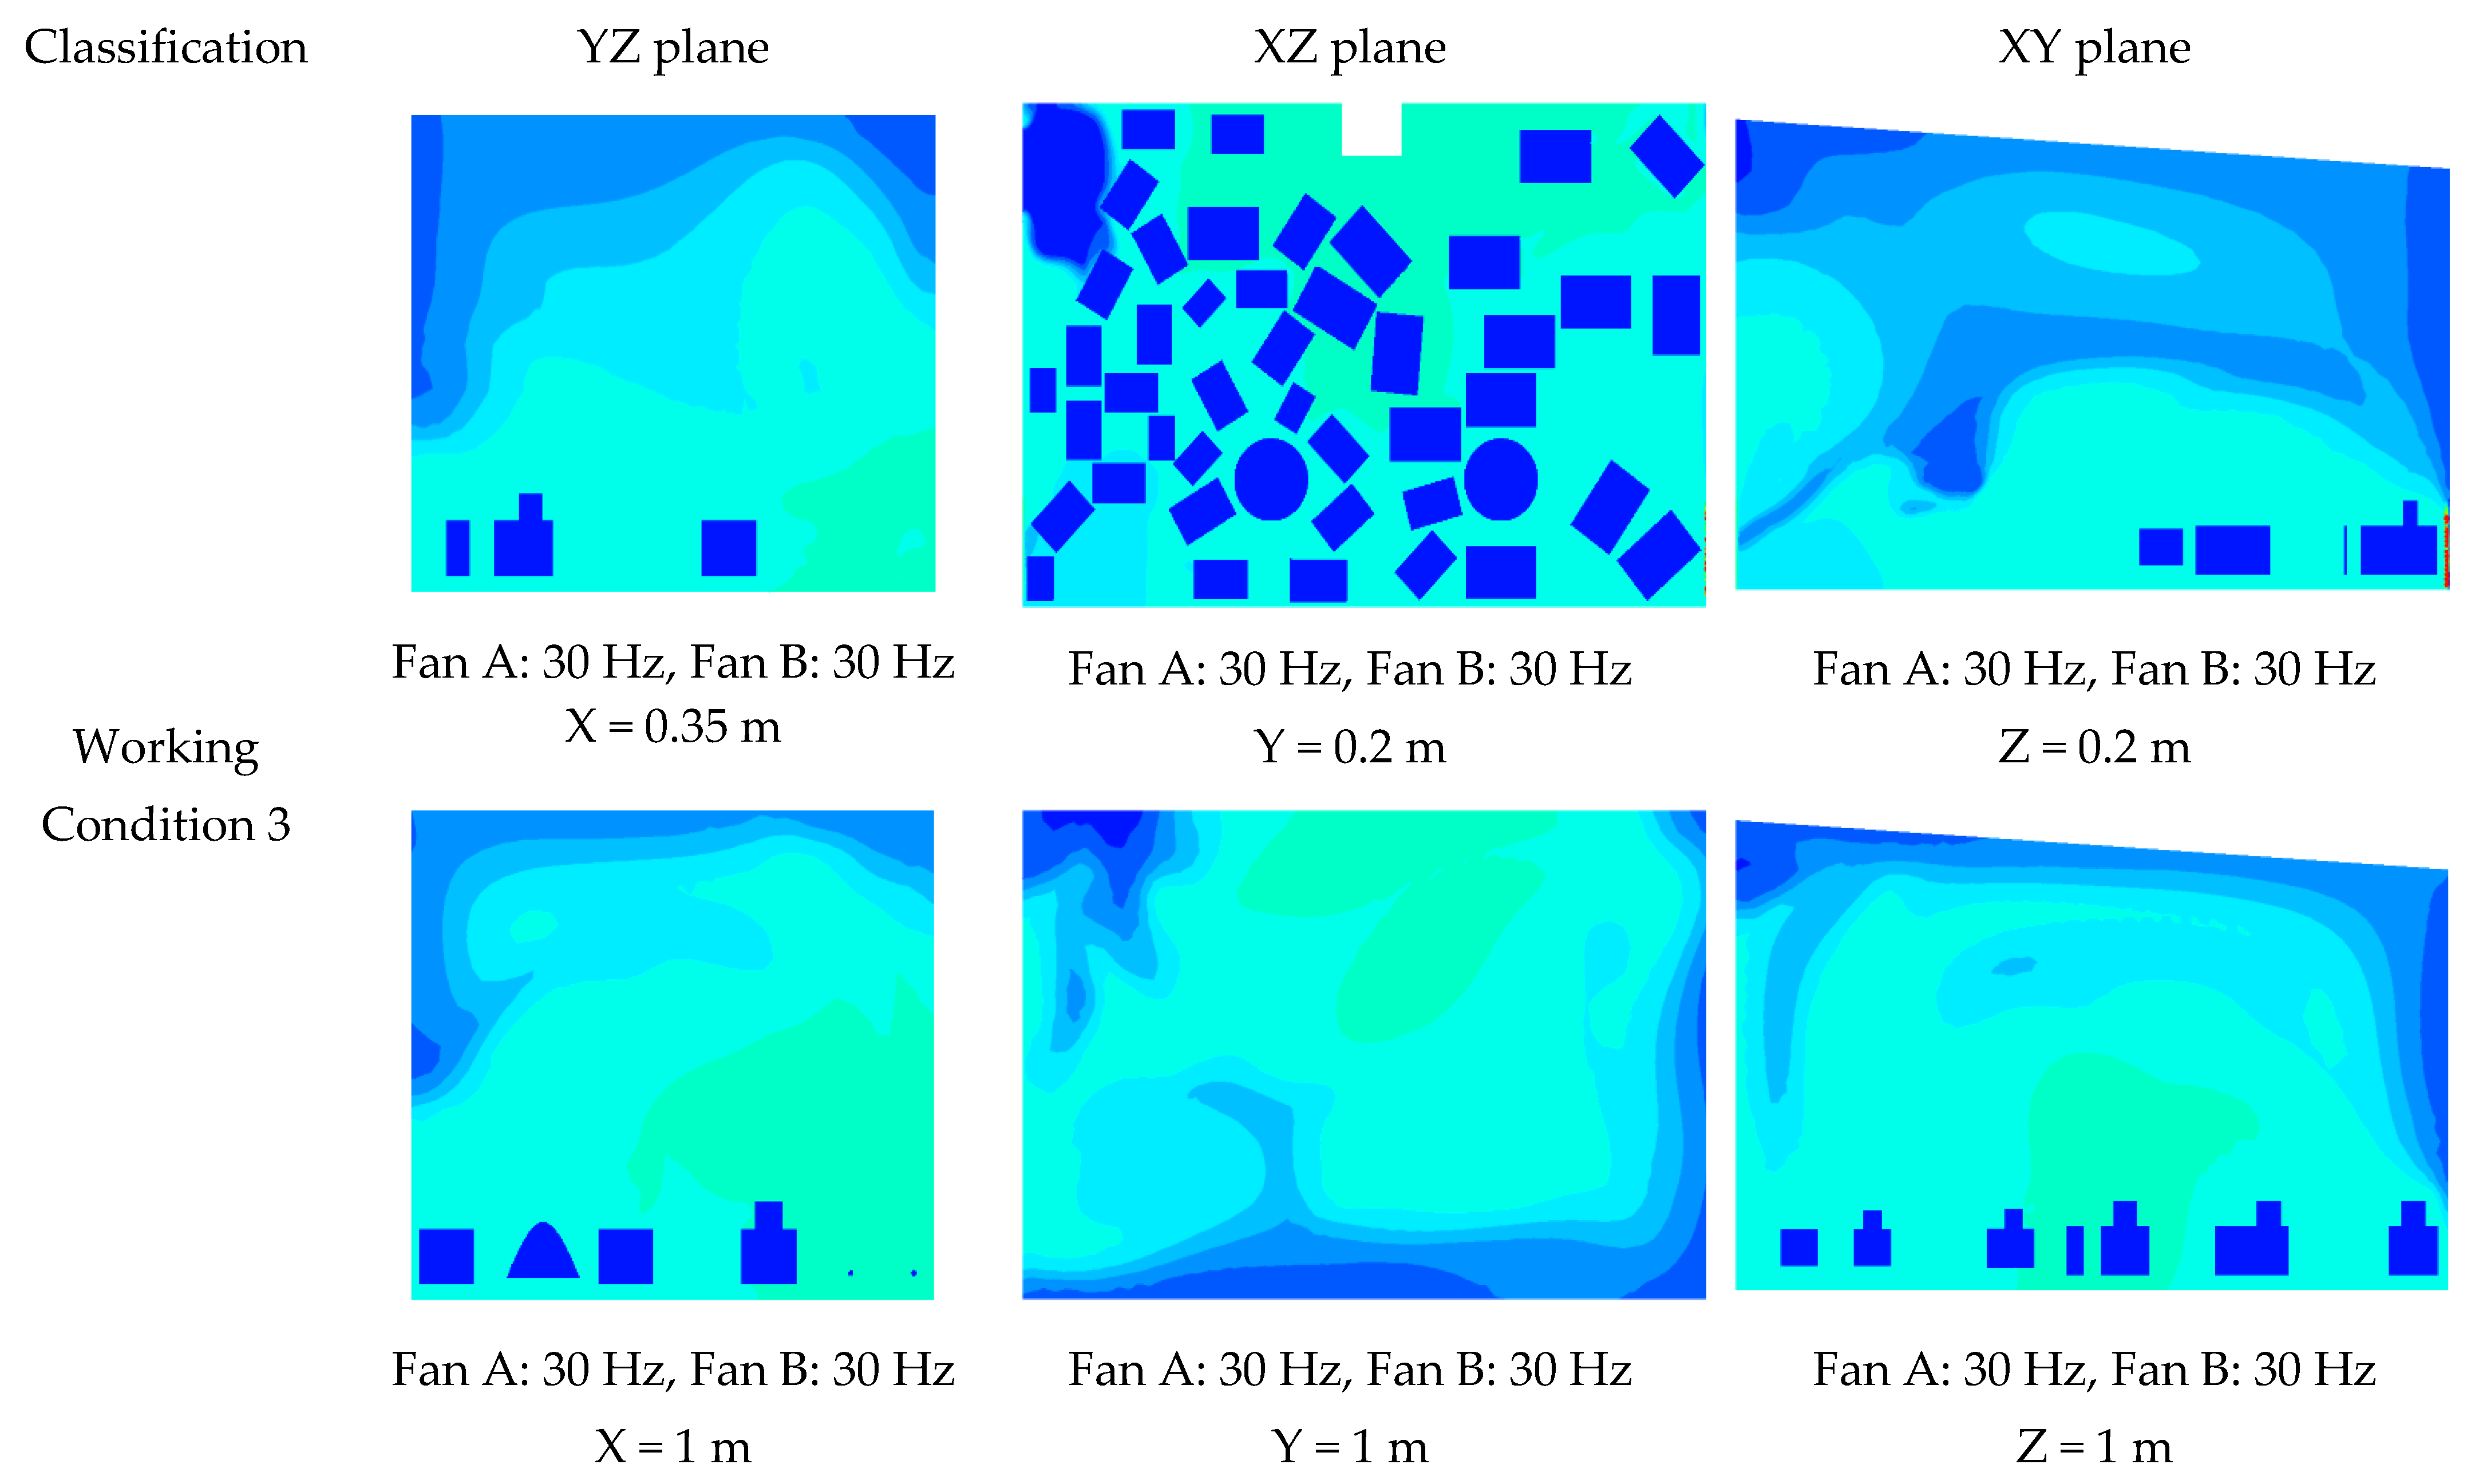
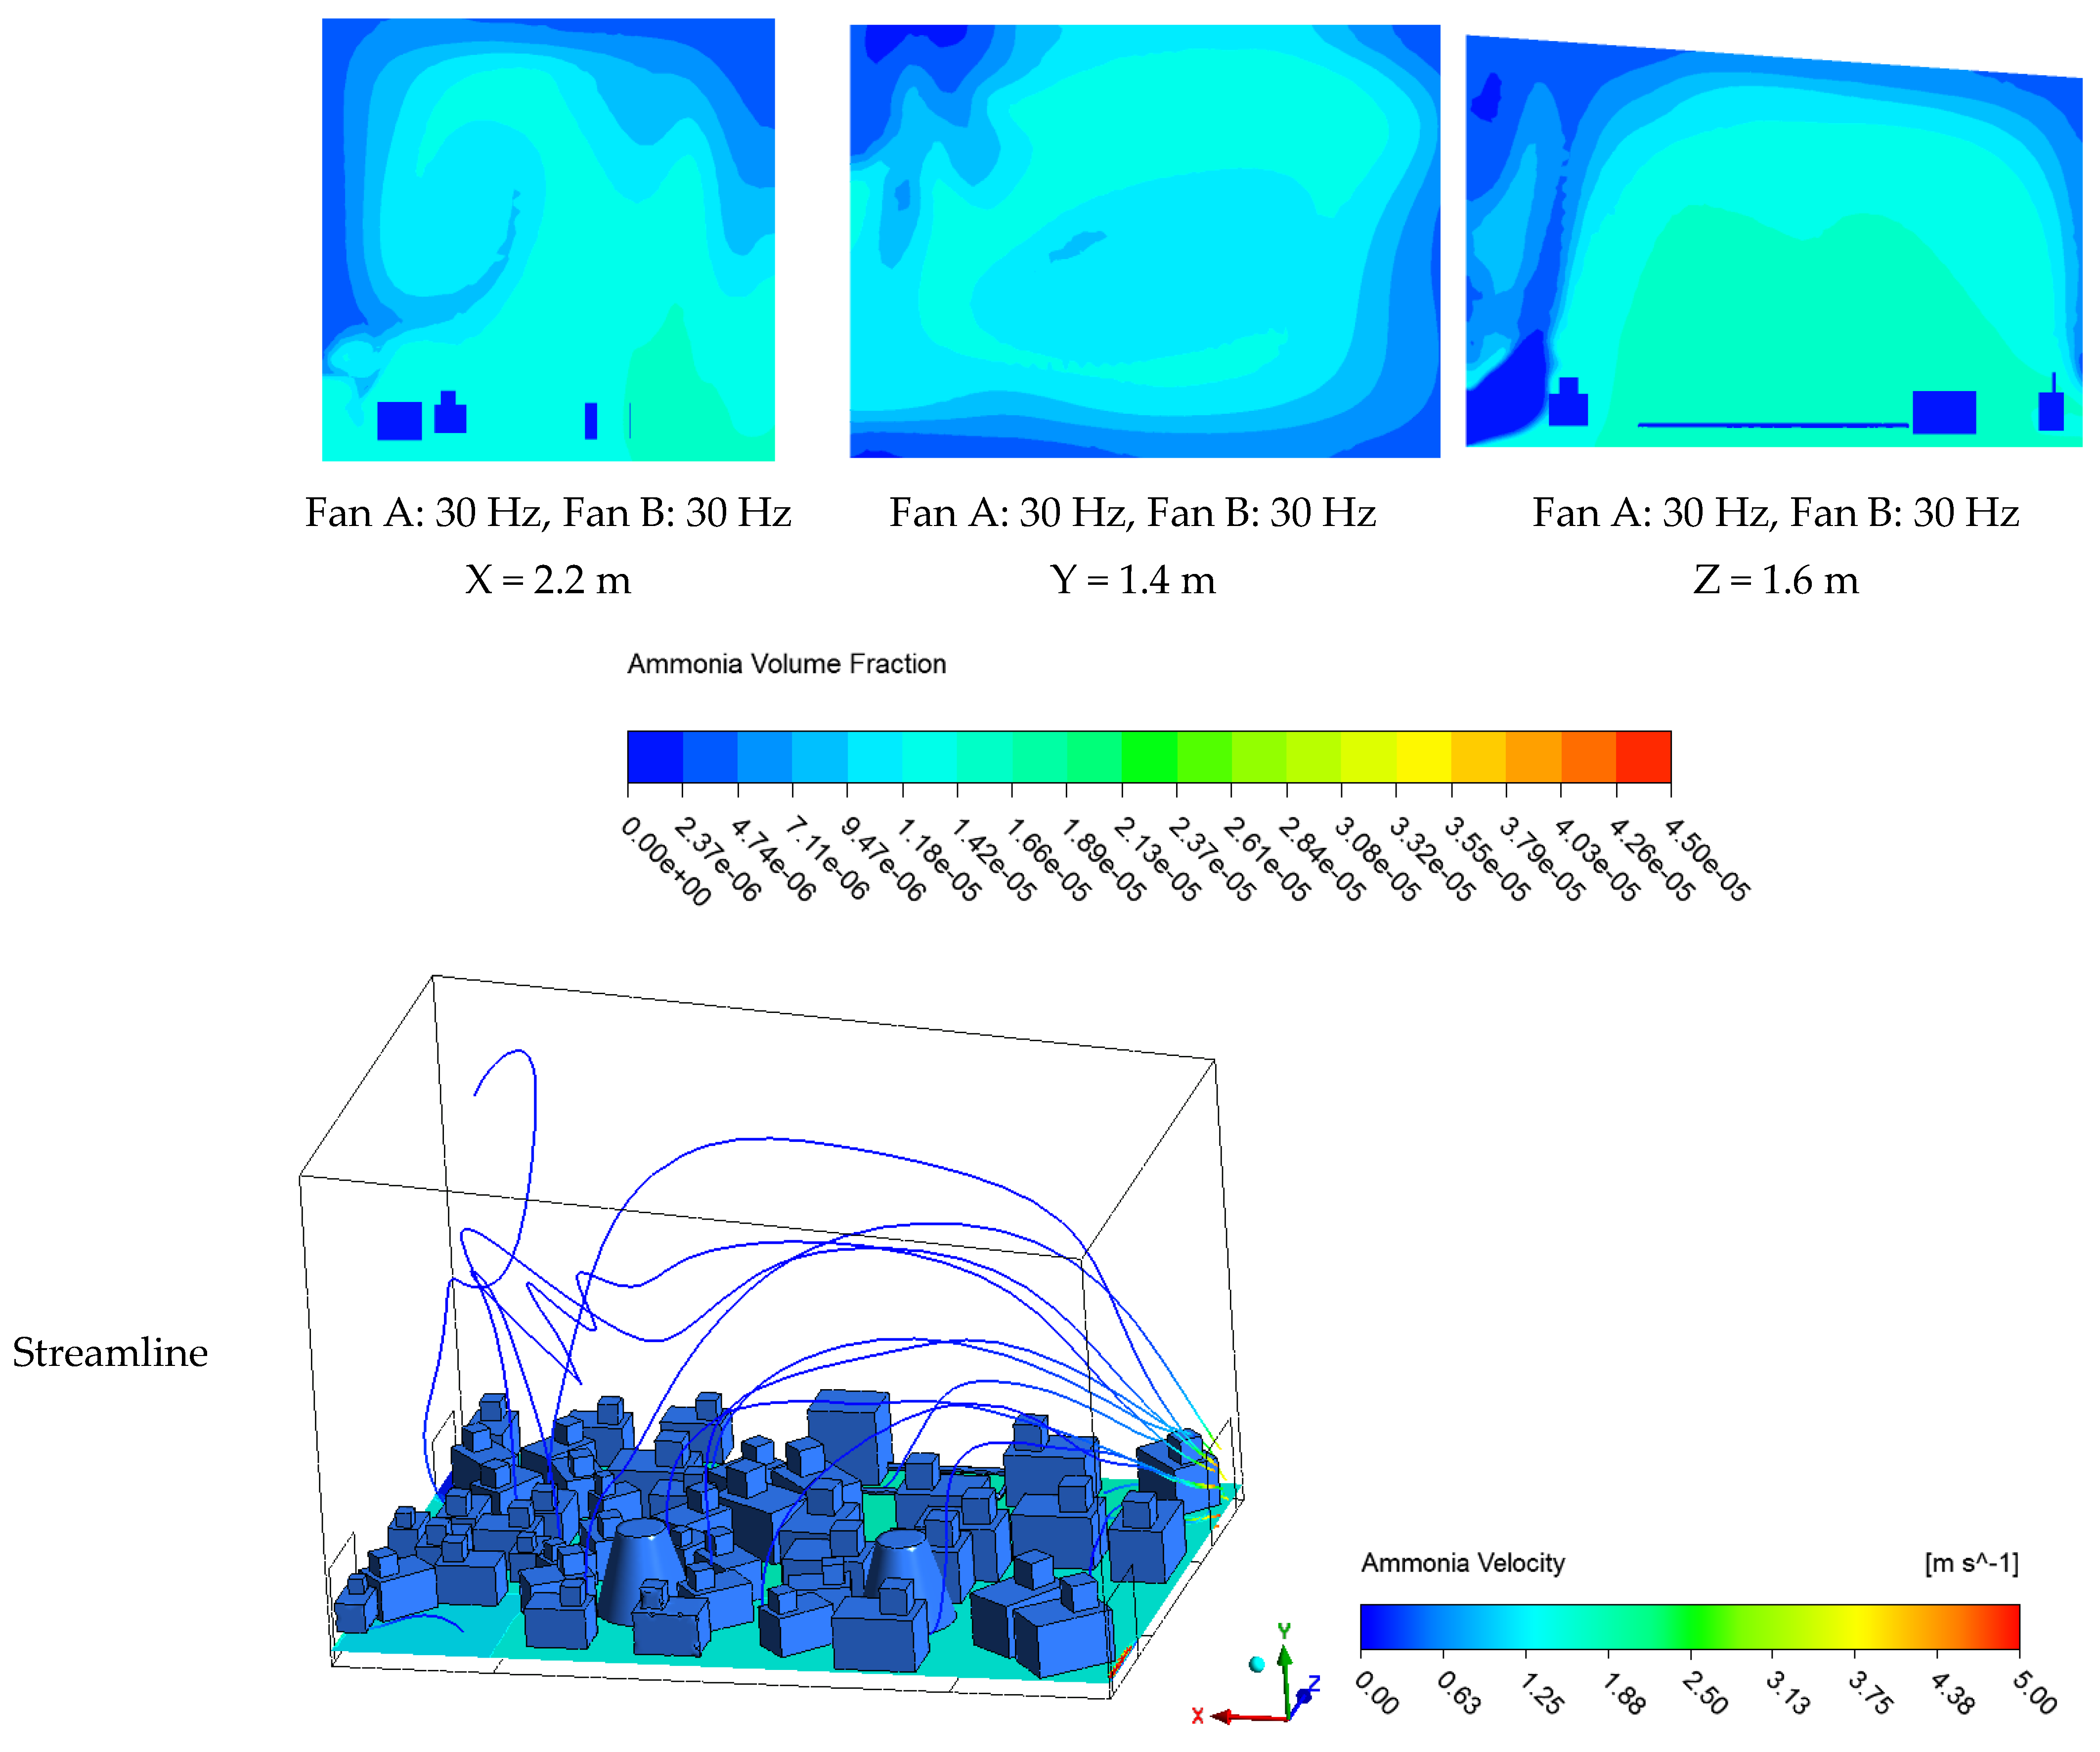
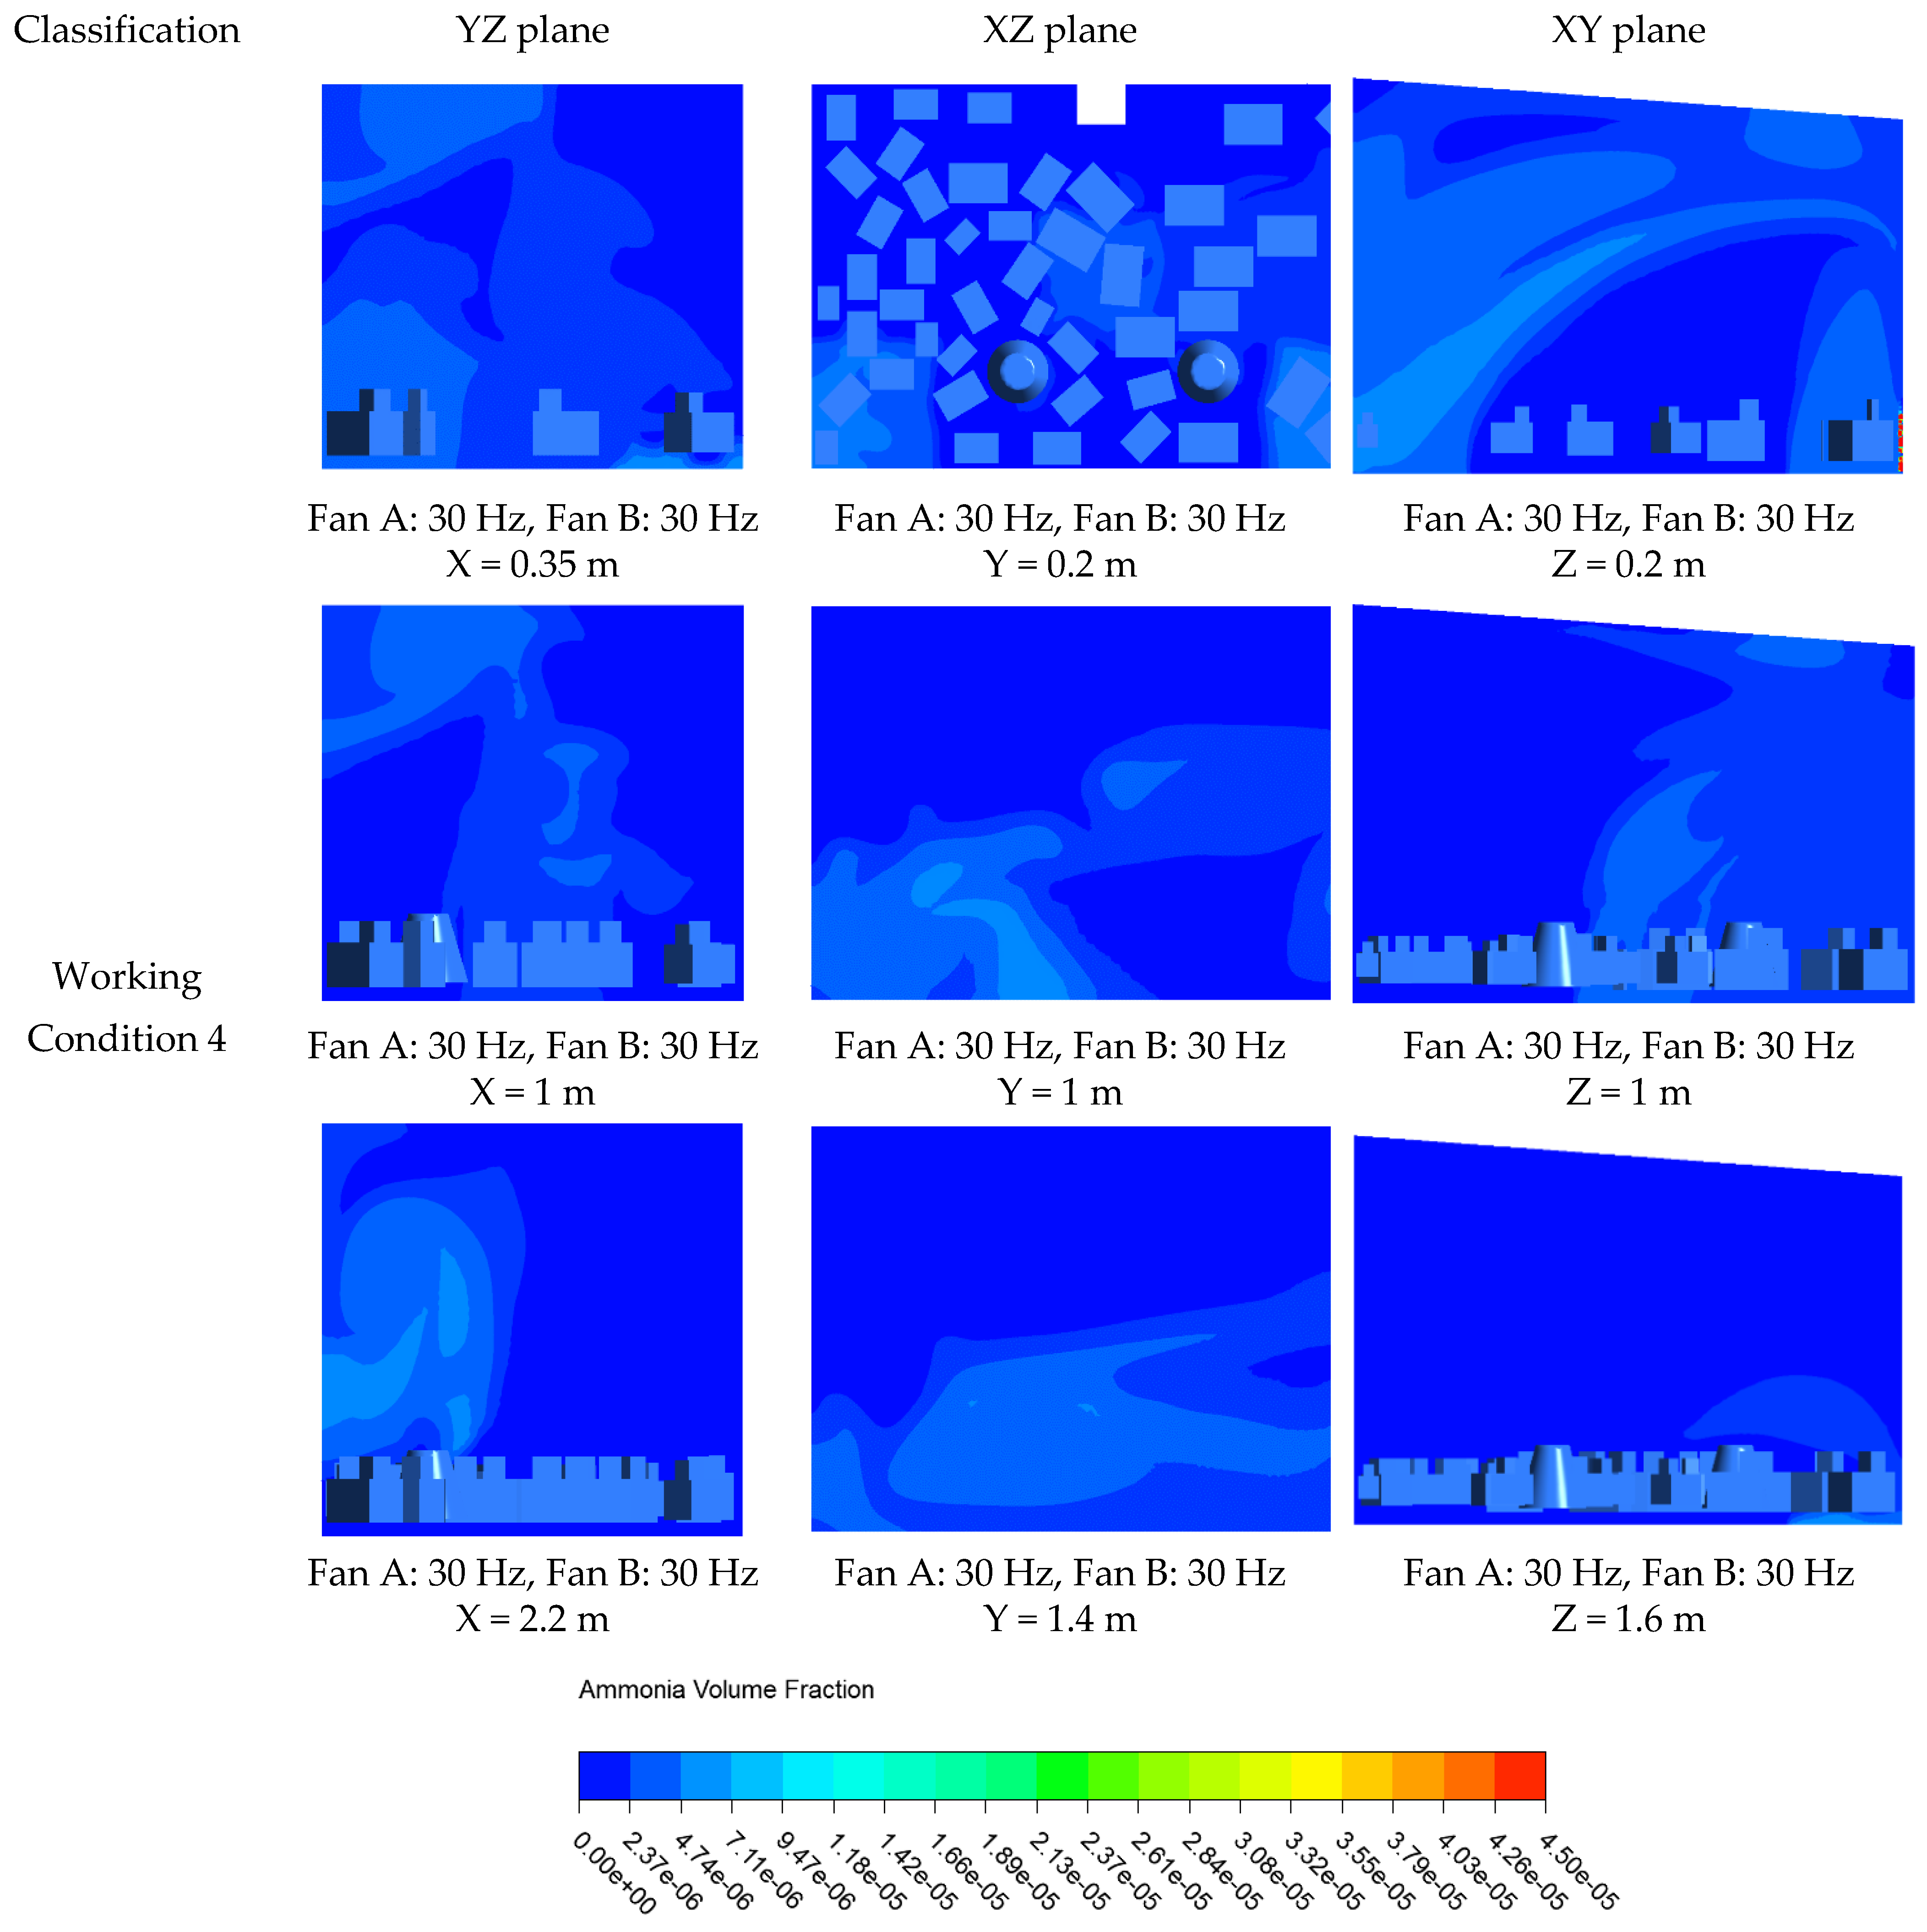
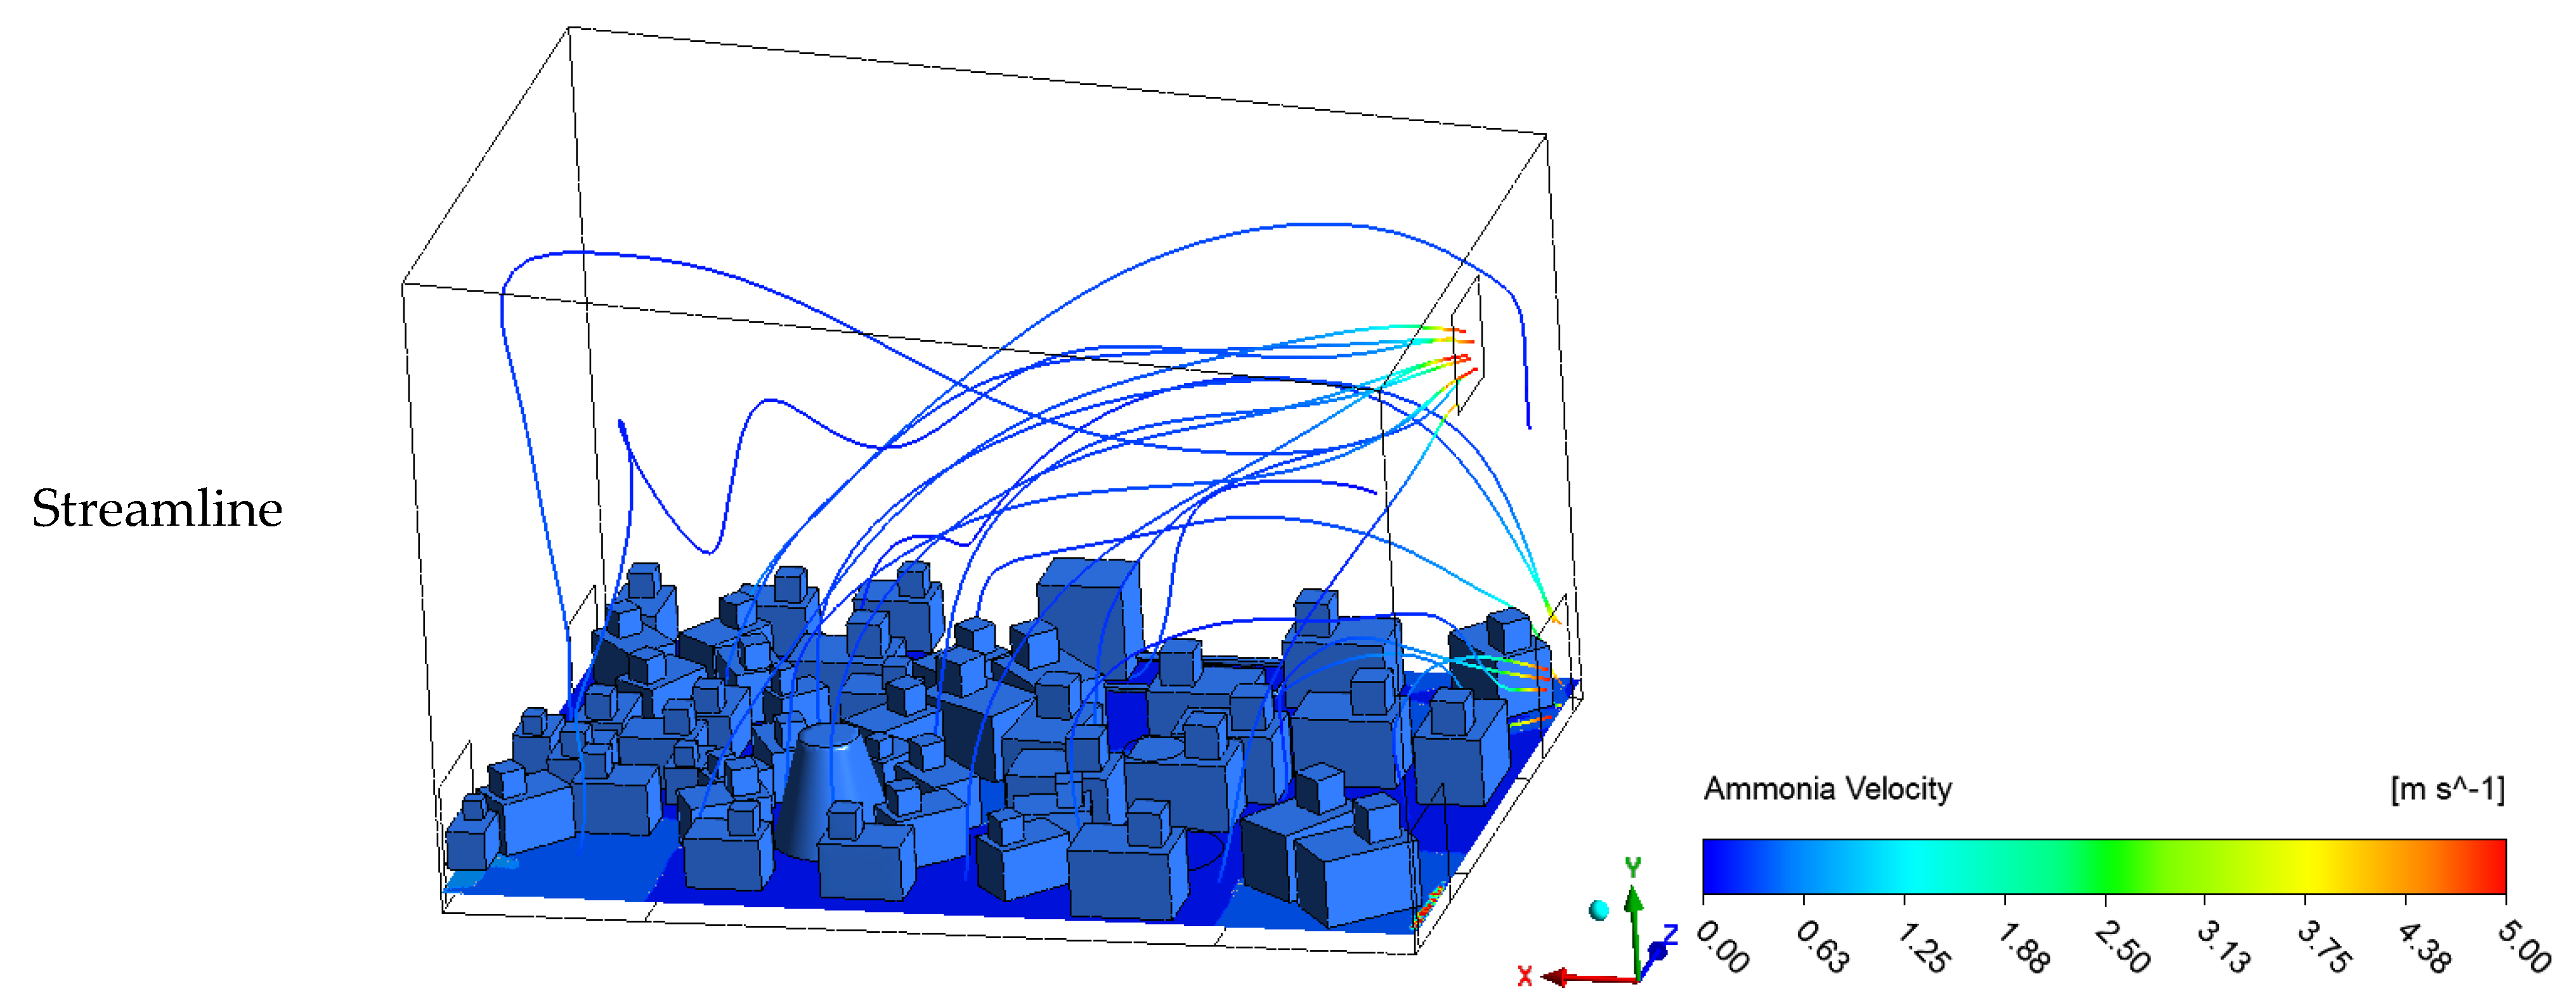
3.1. Ammonia Concentration Simulation under Different Working Conditions

The frequency converter corresponding to the internal circulation and external circulation of broiler chamber gas was adjusted to 0 Hz, 15 Hz, and 30 Hz according to Table 1. An anemometer was used to measure the wind speed from the air inlet of the internal circulation, the air outlet of the internal circulation and the air inlet of the external circulation three times, respectively, and take the average value of each point. Outflow from the external circulation outlet flow was set as natural outflow. The inlet and outlet wind speeds are shown in Table 6.
The wind speed values at the inlet and outlet of the broiler chamber in Table 6 were put into the boundary conditions. The air mass values in Table 2 and the ammonia mass values in Table 4 were, respectively, substituted into Part 1 to Part 9 in Fluent, corresponding to the three work conditions in Table 1. The solution parameters of Fluent were set according to Table 5, and the number of calculation steps was set as 600 steps. After solving according to the solution steps of Fluent and CFD-POST software, the simulation distribution results of two-dimensional ammonia concentration in the YZ plane, XZ plane and XY plane of the broiler chamber were finally obtained. Three-dimensional streamline diagram of ammonia in the whole broiler chamber were also obtained, as shown in Figure 9, Figure 10 and Figure 11.
If the ventilation system works in working condition 3, the concentration of ammonia in the whole broiler chamber is lower than 10 ppm, which meets the requirements of breeding. The suitable growth temperature for broilers is about 20 degrees Celsius. However, the temperature in Nanjing, Jiangsu Province of China, is rarely higher than 20 degrees Celsius during winter, so it works in working condition 1. The ammonia concentration of the broiler chamber was higher, and the whole broiler chamber was more than 30 ppm without the ventilation of the negative pressure fan. Furthermore, the ammonia concentration in the middle part of the broiler chamber was even more than 40 ppm, which is more than twice the requirement of the high concentration standard of ammonia. If the ventilation system works in working condition 2, the concentration of ammonia in the broiler chamber is in a small area of the air inlet of the external circulation, and the rest of the area is more than 20 ppm. As a result, the broiler chamber has improved ventilation requirements in the winter. Through the three-dimensional model of the broiler chamber, it can be observed that the two air inlets lift significantly after contact with the ground air. This will suppress the ammonia diffusion in the living layer of the broiler, resulting in the ammonia concentration in the living layer of the broiler being significantly higher than in the upper space of the broiler chamber. Therefore, it is still suggested that an outlet on the wall of the broiler chamber be open, to effectively discharge ammonia via a negative pressure fan.
It can be concluded from the simulation results that the ammonia concentration in the broiler chamber under working conditions 1 and 2 fails to meet the national standard for livestock and poultry breeding. Working condition 3 can keep the ammonia concentration in the broiler chamber at a low level; however, the ammonia concentration distribution in the broiler chamber is not uniform. The fan has almost no influence on the ventilation at the top of the broiler chamber, and greatly reduces the ambient temperature in the broiler chamber.

3.2. Experimental Results of Improved Broiler Chamber

The center of the negative pressure fan at the internal and external circulation is about 25 cm away from the floor, and its installation position can better solve the ventilation function of the living layer of broilers. However, the relative molecular weight of ammonia is lower than the average relative molecular weight of air, which makes it easy to gathered on the top of the broiler chamber without external interference after the generation of the living layer of broilers. After considering the collaboration effect between the ammonia exhaust path and the fans, the negative pressure fan in the optimization scheme is set above the middle part of the wall where the internal and external circulation fans are located, as shown in Figure 12. Both Fan A and Fan B work at the frequency of 10 Hz and the RPM of the two fans is 280. The distance of the new fan is about 10 cm from the roof, and the opening is 30 cm × 30 cm. The rated air volume is 2000 m3/h, and the outer side of the fan is equipped with a louver. When the fan is closed, the louver will also be closed to reduce the penetration of cold air.
After repeating the same measurement process three times, we can then calculate the average values of inlet and outlet wind speed; the results are shown in Table 7. The simulation distribution results of the two-dimensional ammonia concentration in the broiler living layer and three-dimensional streamline of ammonia in the whole broiler chamber are detailed in Figure 13.
As indicated by comparing the optimized and original results, the ammonia concentration in the broiler chamber in the optimization scheme is the lowest. When the internal and external circulation fans are turned on at 10 Hz, it can be found that the scheme of the “the internal and external circulation fans of 10 Hz with added negative pressure” can better achieve the uniformity of ammonia concentration in the chamber. Meanwhile, the ammonia at the top of the broiler chamber can be discharged more efficiently. By observing the flow diagram, it can be concluded that in the original ventilation method, the ammonia far away from the fan wall is generated from the floor layer and needs to rise to the roof then descend to the external circulation outlet to be eliminated; meanwhile, the negative pressure fan in the optimized scheme can directly eliminate the ammonia on the top of the broiler chamber.

4. Conclusions

In this paper, CFD technology was used to simulate ammonia production and identify the characteristics of its concentration in a smart broiler chamber in Nanjing, China. The models of the smart-breeding broiler chamber and the corresponding broilers were constructed based on field monitoring: first, the grid was reasonably meshed into discrete computing domains for each model, and second, the boundary conditions were determined accordingly. In the process of simulating the distribution of ammonia concentration in the broiler chamber during winter, the SST K-ω model was applied as the steady-state turbulence model, and the structure of the chamber was optimized based on the simulation results.
The simulation results demonstrated that under working conditions 1 and 2, the ventilation fan could not provide the flow rate to meet the ammonia concentration requirements of the broiler chamber, as the ammonia distribution was uneven, and the ammonia concentration in the living layer of the broilers was relatively high. The ammonia concentration in the chamber could be controlled to reach lower than 20 ppm under working conditions 3; however, attempts to reach the working temperature during winter was highly tricky. The broiler chamber structure was reformed on the basis of the simulation results, and a negative pressure fan was placed in the middle part of the chamber above the internal and the external circulation fans on the fan wall, to improve the uniformity of the air flow in the chamber. This modification to the broiler chamber significantly improved the uniformity of the ammonia, and allowed the ammonia concentration in the chamber to remain below 10 ppm. This treatment effectively reduced the ammonia concentration in the living layer of the broilers and accelerated the ammonia discharge.

Author Contributions

X.Z., Y.Q. and X.Q. conceived and designed the experiments; X.Z., S.W., F.G., Y.Q. and S.Z. (Shixiu Zhang) performed the experiments and analyzed the data; J.H., W.L., Y.S., S.Z. (Shikai Zhang) and J.M. helped to perform the data analysis; X.Z., S.W. and Y.Q. wrote the paper. All authors have read and agreed to the published version of the manuscript.

Funding

This research was funded by the Fundamental Research Funds for the Central Universities of China (KYTZ201661), Jiangsu Agriculture Science and Technology Innovation Fund (CX(21)3058), and the National University Student Entrepreneurship Training Program of China (202110307002X).

Institutional Review Board Statement

Not applicable.

Informed Consent Statement

Not applicable.

Data Availability Statement

Not applicable.

Acknowledgments

We are thankful for Jie Zhang, Chenyang Wang and Yungang Bai, who contributed to our field data collection and primary data analysis.

Conflicts of Interest

The authors declare no conflict of interest.

References

  1. Li, L.; Abouelezz, K.F.M.; Gou, Z.; Lin, X.; Wang, Y.; Fan, Q.; Cheng, Z.; Ding, F.; Jiang, S.; Jiang, Z. Optimization of Dietary Zinc Requirement for Broiler Breeder Hens of Chinese Yellow-Feathered Chicken. Animals 2019, 9, 472. [Google Scholar] [CrossRef] [PubMed] [Green Version]
  2. Zhou, Y.; Zhang, M.; Liu, Q.; Feng, J. The alterations of tracheal microbiota and inflammation caused by different levels of ammonia exposure in broiler chickens. Poult. Sci. 2021, 100, 685–696. [Google Scholar] [CrossRef] [PubMed]
  3. Shi, Q.X.; Wang, W.; Chen, M.H.; Zhang, H.F.; Xu, H.W. Ammonia induces Treg/Th1 imbalance with triggered NF-κB pathway leading to chicken respiratory inflammation response. Sci. Total Environ. 2019, 659, 354–362. [Google Scholar] [CrossRef] [PubMed]
  4. Li, J.; Wang, T.; Yao, W.; Hu, L.; Gao, Y.; Huang, F. Ammonia emission characteristic from livestock and poultry house and its harm to livestock and poultry health. Chin. J. Anim. Nutr. 2017, 29, 3472–3481. [Google Scholar] [CrossRef]
  5. Lee, I.-B.; Bitog, J.P.P.; Hong, S.-W.; Seo, I.-H.; Kwon, K.-S.; Bartzanas, T.; Kacira, M. The past, present and future of CFD for agro-environmental applications. Comput. Electron. Agric. 2013, 93, 168–183. [Google Scholar] [CrossRef]
  6. van Hooff, T.; Blocken, B. CFD evaluation of natural ventilation of indoor environments by the concentration decay method: CO2 gas dispersion from a semi-enclosed stadium. Build. Environ. 2013, 61, 1–17. [Google Scholar] [CrossRef]
  7. Lv, J.; Wang, X.-B.; Qiu, X.; Lv, H.-J. Optimization of air conditioning scheme for reading room based on CFD simulation. J. Shenyang Univ. Technol. 2019, 41, 223–229. [Google Scholar] [CrossRef]
  8. Wu, Y.C.; Yang, A.S.; Tseng, L.Y.; Liu, C.L. Myth of ecological architecture designs: Comparison between design concept and computational analysis results of natural-ventilation for Tjibaou Cultural Center in New Caledonia. Energy Build. 2011, 43, 2788–2797. [Google Scholar] [CrossRef]
  9. Tominaga, Y.; Blocken, B. Wind tunnel experiments on cross-ventilation flow of a generic building with contaminant dispersion in unsheltered and sheltered conditions. Build. Environ. 2015, 92, 452–461. [Google Scholar] [CrossRef] [Green Version]
  10. Xu, H.; Cao, Y.; Li, Y.; Alapati; Gao, J.; Jiang, W.; Zou, Z. Determination of thickness of thermal storage layer of solar greenhouse wall based on CFD. Trans. Chin. Soc. Agric. Eng. (Trans. CSAE) 2019, 35, 175–184. [Google Scholar] [CrossRef]
  11. Su, W.; Xue, X.; Xiong, Y.; Cao, J. Modeling the effect of natural ventilation on temperature inside solar greenhouse. Chin. J. Ecol. 2016, 35, 1635–1642. [Google Scholar] [CrossRef]
  12. Chalill, S.M.; Chowdhury, S.; Karthikeyan, R. Prediction of key crop growth parameters in a commercial greenhouse using CFD simulation and experimental verification in a pilot study. Agriculture 2021, 11, 658. [Google Scholar] [CrossRef]
  13. Yin, S.; Ooster, B.v.t.; Ogink, N.W.M.; Groot Koerkamp, P.W.G. Assessment of porous media instead of slatted floor for modelling the airflow and ammonia emission in the pit headspace. Comput. Electron. Agric. 2016, 123, 163–175. [Google Scholar] [CrossRef]
  14. Rojano, F.; Bournet, P.E.; Hassouna, M.; Robin, P.; Kacira, M.; Choi, C.Y. Modelling the impact of air discharges caused by natural ventilation in a poultry house. Biosyst. Eng. 2019, 180, 168–181. [Google Scholar] [CrossRef]
  15. Tabase, R.K.; Van Linden, V.; Bagci, O.; De Paepe, M.; Aarnink, A.J.A.; Demeyer, P. CFD simulation of airflows and ammonia emissions in a pig compartment with underfloor air distribution system: Model validation at different ventilation rates. Comput. Electron. Agric. 2020, 171, 105297. [Google Scholar] [CrossRef]
  16. Stamou, A.; Katsiris, I. Verification of a CFD model for indoor airflow and heat transfer. Build. Environ. 2006, 41, 1171–1181. [Google Scholar] [CrossRef]
  17. Yao, H.; Sun, Q.; Zou, X.; Wang, S.; Zhang, S.; Zhang, S.; Zhang, S. Research of yellow-feather chicken breeding model based on small chicken chamber. INMATEH-Agric. Eng. 2018, 56, 91–199. [Google Scholar]
  18. Zhang, S.; Ding, A.; Zou, X.; Feng, B.; Qiu, X.; Wang, S.; Zhang, S.; Qian, Y.; Yao, H.; Wei, Y. Simulation analysis of a ventilation system in a smart broiler chamber based on computational fluid dynamics. Atmosphere 2019, 10, 315. [Google Scholar] [CrossRef] [Green Version]
  19. Cheng, Q.; Wu, W.; Li, H.; Zhang, G.; Li, B. CFD study of the influence of laying hen geometry, distribution and weight on airflow resistance. Comput. Electron. Agric. 2018, 144, 181–189. [Google Scholar] [CrossRef]
  20. Li, H.; Rong, L.; Zong, C.; Zhang, G. A numerical study on forced convective heat transfer of a chicken (model) in horizontal airflow. Biosyst. Eng. 2016, 150, 151–159. [Google Scholar] [CrossRef]
Figure 1. Measurements of broiler size: (a) measure the height of an adult broiler, (b) measure the length of an adult broiler.
Agriculture 12 00182 g001
Figure 2. A diagram that shows the broiler sample used to measure and determine the model size.
Agriculture 12 00182 g002
Figure 3. Schematic diagram of block body model.
Agriculture 12 00182 g003
Figure 4. Flowchart of CFD calculation.
Agriculture 12 00182 g004
Figure 5. Diagram of the partitioning of the broiler living layer in the broiler chamber.
Agriculture 12 00182 g005
Figure 6. Field map of winter broiler breeding.
Agriculture 12 00182 g006
Figure 7. The distribution of block model broilers in the broiler chamber model.
Agriculture 12 00182 g007
Figure 8. Grid division of broiler chamber with yellow-feathered broilers in ICEM CFD.
Agriculture 12 00182 g008
Figure 9. Simulation results of ammonia concentration distribution under working condition 1.
Agriculture 12 00182 g009aAgriculture 12 00182 g009b
Figure 10. Simulation results of ammonia concentration distribution under working condition 2.
Agriculture 12 00182 g010aAgriculture 12 00182 g010b
Figure 11. Simulation results of ammonia concentration distribution under working condition 3.
Agriculture 12 00182 g011aAgriculture 12 00182 g011b
Figure 12. The negative pressure fan was set for the optimization scheme.
Agriculture 12 00182 g012
Figure 13. Simulation results of ammonia concentration distribution under working condition 4.
Agriculture 12 00182 g013aAgriculture 12 00182 g013b
Table 1. Frequency modulation scheme of Fan A and Fan B.
Working ConditionTemperatureFan ARPM (Fan A)Fan BRPM (Fan B)
Working condition 1Greater than 20 °C30 Hz84030 Hz840
Working condition 2Greater than 10 °C and less than 20 °C15 Hz42015 Hz420
Working condition 3Less than 10 °C0 Hz00 Hz0
Table 2. Measured values of air mass in the block areas of the broiler chamber.
Broilers’ Living Layer PartitionMeasurement Area/m2Measurement Height/mVolume/m3Total Air Mass/kg
Part10.36000.150.0540000.069822
Part20.77750.150.1166250.150796
Part30.36000.150.0540000.069822
Part41.07750.150.1616250.208981
Part50.36000.150.0540000.069822
Part61.07750.150.1616250.208981
Part70.36000.150.0540000.069822
Part80.77750.150.1166250.150796
Part90.36000.150.0540000.069822
Table 3. Ammonia concentration value in calculation area corresponding to Fan A and Fan B operating frequencies (unit: ppm).
Fan AFan B123456789
0 HZ0 HZ44.444.240.845.747.442.845.444.340.1
15 HZ15 HZ33.532.829.534.235.431.733.633.130.2
30 HZ30 HZ15.41511.416.618.114.416.21613.8
Note: The two air inlets, two air outlets and the center of the broiler chamber floor were divided into five square parts (Part 1, Part 3, Part 5, Part 7 and Part 9), and the remaining region was divided into four non-square parts: namely Part 2, Part 4, Part 6 and Part 8.
Table 4. Total mass of ammonia in calculation area corresponding to working frequency of FAN A and FAN B (unit: mg).
Fan AFan B123456789
0 HZ0 HZ3.16.562.859.43.318.83.176.572.8
15 HZ15 HZ2.344.872.067.032.476.522.354.912.11
30 HZ30 HZ1.082.230.83.411.262.961.132.370.96
Note: The two air inlets, two air outlets and the center of the broiler chamber floor were divided into five square parts (Part 1, Part 3, Part 5, Part 7 and Part 9), and the remaining region was divided into four non-square parts: namely Part 2, Part 4, Part 6 and Part 8.
Table 5. Settings of solution mode of Fluent.
ParameterType/Values
Simulated stateSteady state
Turbulence modelSST K-ω
Air density (kg·m−3)1.293
Dynamic viscosity (kg·m−1·s−1)
Dynamic grid
1.83 × 10⁻⁵.
Smoothing
Table 6. Wind speed measurement at inlet and outlet of broiler chamber under different working conditions.
Air Inlet and OutletWind Speed (Unit: m/s)
Working Condition 1Working Condition 2Working Condition 3
The air inlet of the internal circulation00.440.97
The air outlet of the internal circulation−0.02−0.42−0.91
The air inlet of the external circulation0.050.350.83
The air outlet of the external circulationoutflowoutflowoutflow
Table 7. Wind speed measurement at inlet and outlet of broiler chamber under improved working condition.
Air Inlet and OutletWind Speed (Unit: m/s)
Working Condition 4
The air inlet of the internal circulation0.43
The air outlet of the internal circulation−0.11
The air inlet of the external circulation0.31
The air outlet of the external circulation−0.15
The air outlet of the optimization schemeoutflow
Publisher’s Note: MDPI stays neutral with regard to jurisdictional claims in published maps and institutional affiliations.

