Article

Does COVID-19 Affect Farmland Prices? How and Why?

1
Program in Science, Technology and Environmental Policy, Princeton University, Princeton, NJ 08544, USA
2
Department of Leisure and Recreation Management, Taipei City University, Taipei 11230, Taiwan
3
Department of Urban Industrial Management and Marketing, University of Taipei, Taipei 10048, Taiwan
4
Department of Agricultural Economics, National Taiwan University, Taipei 10617, Taiwan
*
Author to whom correspondence should be addressed.
Agriculture 2022, 12(12), 2163; https://doi.org/10.3390/agriculture12122163
Submission received: 31 October 2022 / Revised: 4 December 2022 / Accepted: 12 December 2022 / Published: 15 December 2022

Abstract

:
COVID-19 has profoundly impacted the global economy, particularly the agricultural sector. However, relatively little attention has been paid to the relationship between COVID-19 and the farmland market. A few descriptive studies have speculated about the impact of COVID-19 on farmland prices but presented no quantitative evidence. This study provides quantitative evidence on the causal effect of COVID-19 on farmland prices using the difference-in-differences method with population-based data on farmland transactions in Taiwan. While prior descriptive studies argued that increased farmland prices associated with COVID-19 were largely driven by macroeconomic conditions, we found that the onset of COVID-19 increased farmland prices by 5.1%, even after controlling for macroeconomic conditions and parcel-level farmland characteristics. Furthermore, we found that government payments are likely responsible for these increases in farmland prices. Financial assistance easing the economic burdens of the agricultural sector can also stabilize farmland prices.

1. Introduction

COVID-19 has profoundly impacted the global economy, slashing economic output by USD 8.5 trillion since 2020 [1]. These changes in economic output have also affected other aspects of human society. The fast-growing literature has examined the impacts of COVID-19 on environmental indicators [2], transportation patterns [3], and the utilization of urban parks [4]. This literature also extends to the agricultural sector. For example, Beckman and Countryman [5] found that agricultural shocks attributable to COVID-19 had disproportionately large impacts on the gross domestic product of the United States. Charlton [6] found that agricultural supply chains have been subjected to increased labor-related input costs as outbreaks spread among agricultural workers at their worksites. Arita et al. [7] suggested that COVID-19 reduced global agricultural trade by 5 to 10%, with these losses being pronounced in commodity markets.
Although this broader literature has considered the impacts of COVID-19 on the agricultural sector, most of these studies only examined macroeconomic outcomes specified at the aggregate level, including agricultural production and agricultural trade. These studies may not have fully identified the distributional impact of COVID-19 on the agricultural sector because of their emphasis on the larger components of agricultural systems. Agricultural indicators are particularly salient for farmers reliant on agricultural production for their livelihoods, but substantially less evidence exists on the impacts of COVID-19 with respect to agricultural indicators specified at the individual level.
Farmland prices are an important indicator of farm well-being because farmland represents both an asset and production input. Indeed, farm real estate constitutes up to 80% of the total value of all farm assets and is used as the primary source of collateral for agricultural loans in the USA [8]. However, the causal effect of COVID-19 on farmland prices has merely been subject to speculation in government reports. Following the onset of COVID-19 in the USA, agricultural professionals, including agricultural lenders, farm managers, and farm realtors, expected declines in farmland prices for the following 18 months in Iowa [9]. Specifically, they cited lower commodity prices and uncertainty in agricultural trade regarding a reduction in economic returns from agriculture, which are subsequently capitalized into farmland prices. However, several states in the USA reported that farmland prices had increased [10]. These conflicting results suggest that the causal effect of COVID-19 on farmland prices has not been identified or understood. Furthermore, the mechanism responsible for this relationship remains unclear.
This study provides quantitative evidence of the causal effect of COVID-19 on farmland prices using population-based data on farmland transactions. We also take another step towards fully estimating the impact of COVID-19 on farmland prices by empirically testing the mechanism behind this relationship. We use data on farmland prices provided by the Actual Price Registration System (APRS) in Taiwan, which is an important economic indicator for farmers on the island. This dataset records the day, month, and year of farmland transactions, allowing for comparisons of farmland prices before and after the onset of COVID-19 in Taiwan. The main result shows that COVID-19 increased farmland prices by 5.1%, ceteris paribus. A heterogeneity analysis further suggests that these increases are more pronounced for rural farmland. Finally, an analysis of the mechanism shows that government payments are likely responsible for these increases in farmland prices.
This study contributes to the burgeoning research on COVID-19 and the agricultural sector across several fronts. First, this study provides quantitative evidence on the causal effect of COVID-19 on farmland prices using quasi-experimental research methods. Lawley [11] and Lawley [12] discussed the potential mechanisms through which COVID-19 impacted farmland prices and examined this relationship in Canada. Using aggregate quarterly estimates of farmland values with quantile regression, the farmland sold in the first six months of 2020 had higher sales prices of 2.3% in Manitoba, Canada. The author interpreted these results as correlations [11,12]. In contrast, this study applies the difference-in-differences (DiD) method to identify the causal effect of COVID-19 on farmland prices. The DiD method compares outcomes between farmland prices for treatment and control groups before and after the first confirmed cases of COVID-19 in Taiwan. Thus, the estimates presented in this study can be interpreted as causal effects rather than correlations.
Second, this study uses population-based data on farmland transactions. Zhang and Duffy [9] found that COVID-19 was associated with a 1.7% increase in farmland prices using county-level estimates of farmland prices in Iowa. Oppendahl [10] suggested that COVID-19 was associated with a 6% increase in farmland prices using state-level data in the Midwestern United States (Iowa, Illinois, Indiana, Michigan, and Wisconsin). A limitation of these descriptive studies included their reliance on county- or state-level averages of farmland prices, rendering them unable to account for the parcel-level characteristics of farmland. We use population-based data on farmland transactions from the Ministry of Interior in Taiwan, allowing for comprehensive analyses with precisely estimated results. These population-based data also allow us to conduct a heterogeneity analysis based on whether the farmland was sold in rural or urban areas. We also use actual sales prices of farmland transactions provided by the Taiwanese government, avoiding the measurement errors stemming from self-reported values from buyers and sellers [13].
Finally, this study empirically tests the mechanism through which COVID-19 impacts farmland prices in Taiwan. This analysis of the mechanism is crucial for formulating public policy related to farmers and COVID-19. Prior studies in other countries hypothesized that the positive correlation between COVID-19 and farmland prices was largely caused by macroeconomic conditions. For example, Zhang [14] suggested that low interest rates were responsible for increased farmland prices because lower interest rates reduced interest expenses for farmers, supporting farm profitability in the USA. However, we still found that COVID-19 increased farmland prices in Taiwan, even after controlling for macroeconomic conditions, including interest rates and parcel-level farmland characteristics. We found that the effect of COVID-19 on farmland prices is not completely driven by macroeconomic conditions. Rather, we found that government payments provided to the agricultural sector are responsible for these increases in farmland prices during the COVID-19 period.

2. Government Payments to the Agricultural Sector and COVID-19 in Taiwan

Taiwan provides government payments to farmers and farms to cope with the risks associated with agricultural production, including natural disasters and supply chain concerns. The primary basis of these government payments includes ‘policy-based agricultural product loans’, where the Bureau of Agricultural Finance (BOAF) provides no-interest loans to farmers and farms under the Agricultural Finance Act [15].
The main purpose of these government payments is twofold: First, government payments directly support farmers and farms. These government payments could be spent on (1) agricultural machinery, (2) agricultural operations and production, and (3) farm operations and production. Second, government payments directly support the farmland market. The BOAF injects capital into the farmland market through these government payments to individuals interested in purchasing farmland, including young and middle-aged farmers and farmers expanding the size of their farm. Farmers paying off mortgages can also receive government payments [15].
Since the ‘policy-based agricultural product loans’ under the Agricultural Finance Act were designed to reduce the uncertainties associated with agricultural production, COVID-19 exponentially increased the amount of government payments provided under the Agricultural Finance Act. Thus, the BOAF also used government payments to provide economic support to the agricultural sector and the farmland market in response to COVID-19 in Taiwan.

3. Data

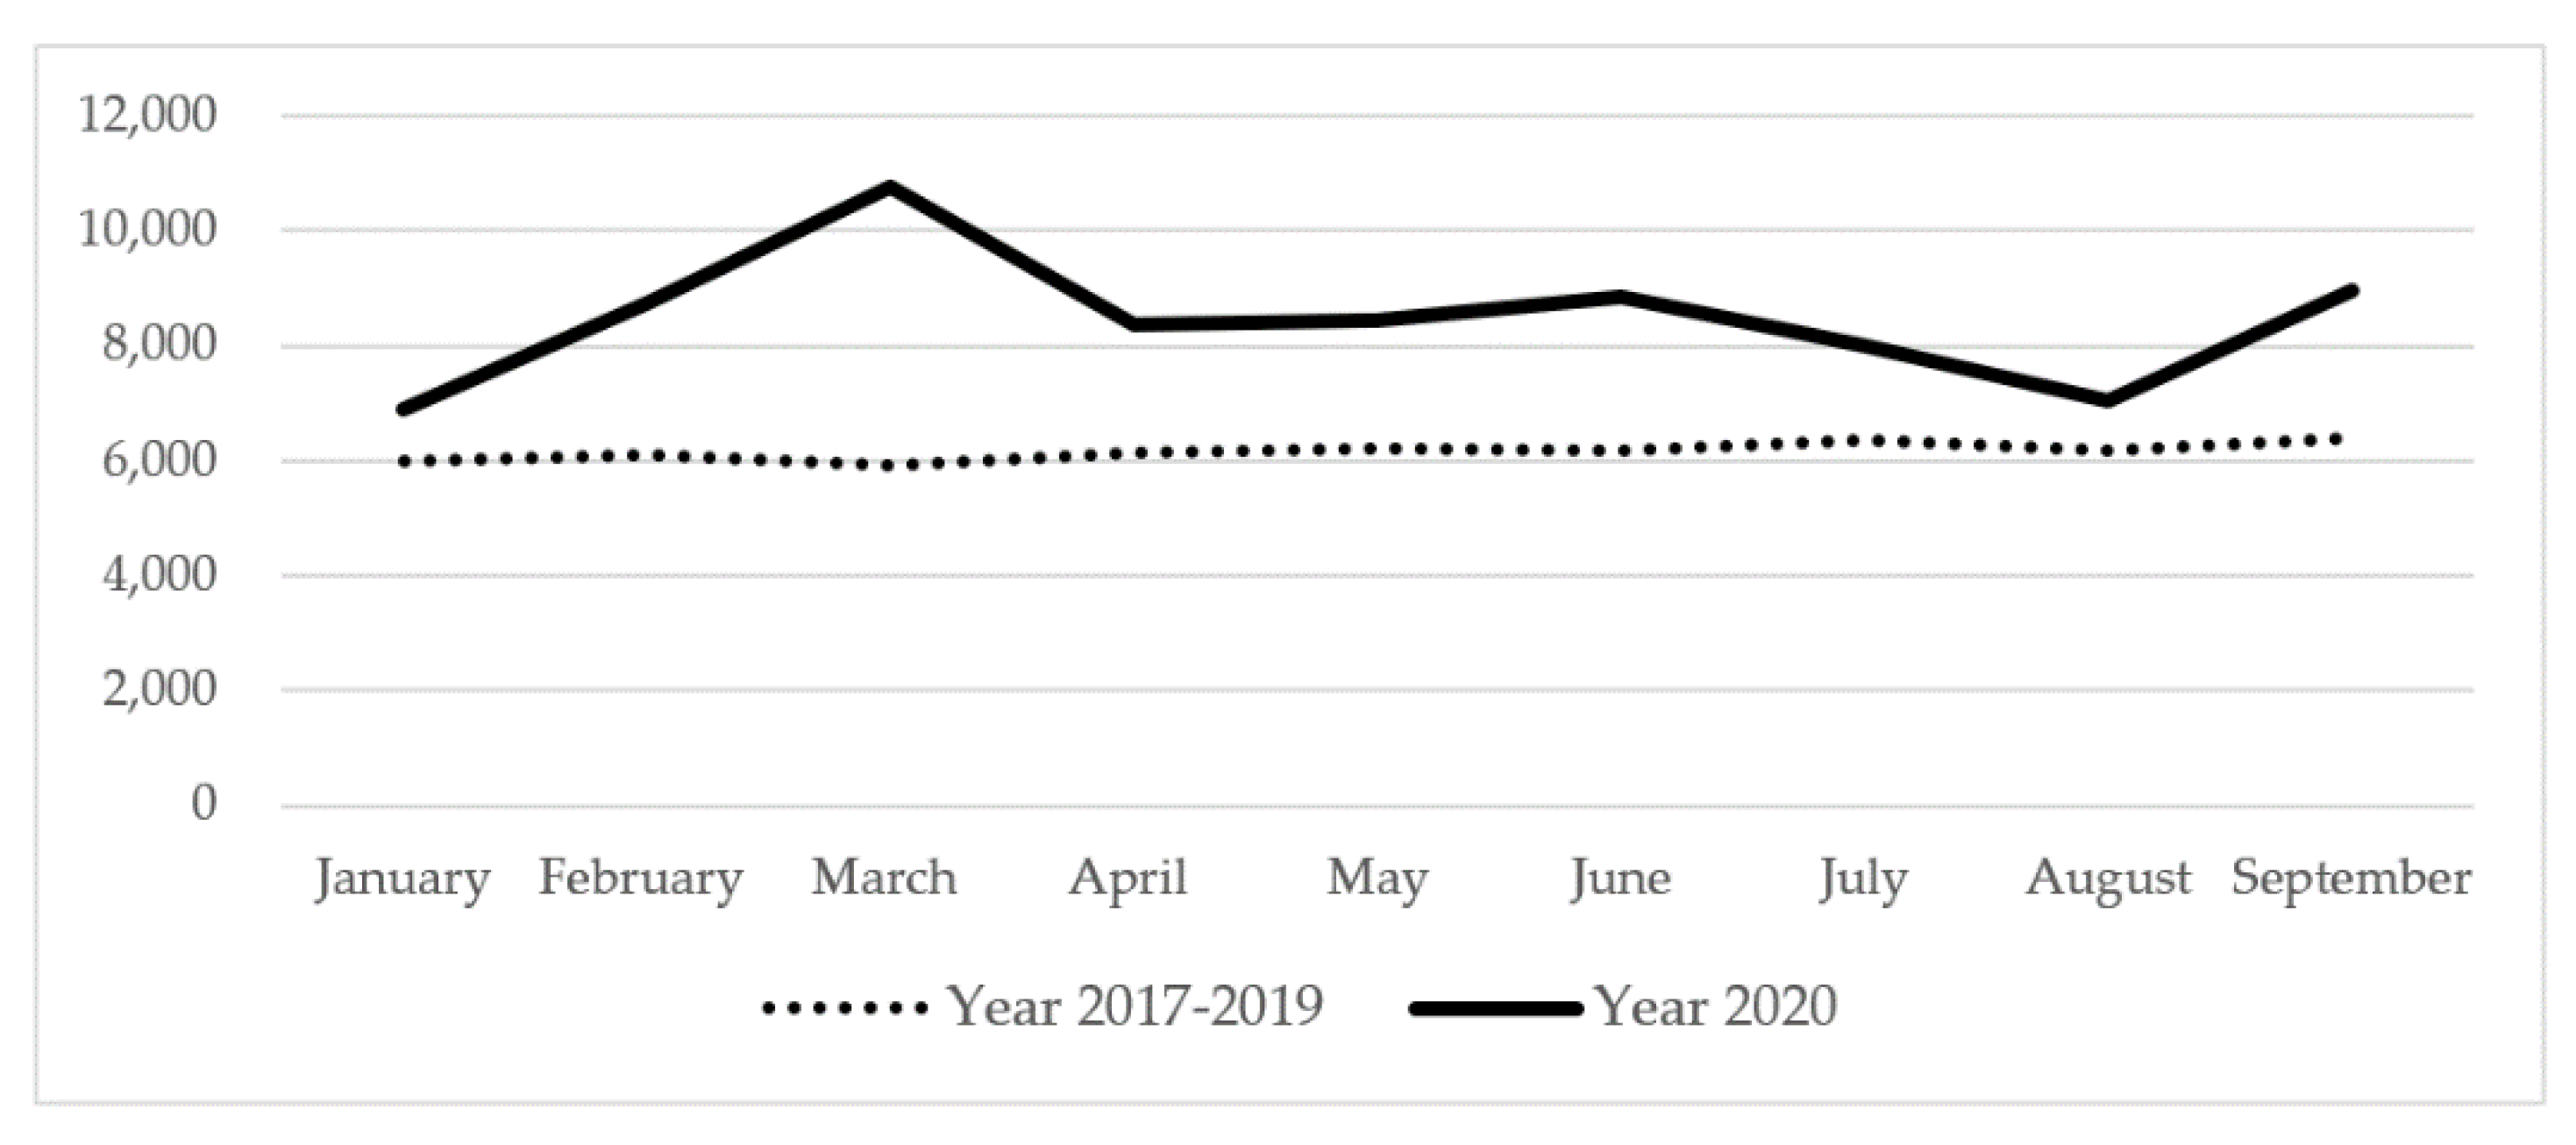
3.1. Data on Farmland Transactions

The Actual Price Registration System (APRS) provides data on farmland transactions in Taiwan. The APRS was established in December 2011 under the Ministry of Interior. The APRS records the sales prices of property transactions sold by property owners. By law, property owners must report the sale of their property within 14 days or receive fines of up to TWD 300,000 [16]. The APRS includes administrative records on the sales prices of properties along with their physical characteristics. The administrative records also include the time (day, month, and year) of property transactions. Thus, the APRS is the most important source of information for understanding changes in the economic trends of property transactions in Taiwan. Previous studies have also used the APRS to analyze the farmland and real estate markets in Taiwan [16,17]. The sample used in this study is based on the population of farmland transactions recorded by the APRS. It includes all of the farmlands sold between 1 January and 30 September in 2017, 2018, 2019, and 2020. In total, 51,624 parcels of farmland were sold during these 36 months, of which, 37,543 were sold in 2017, 2018, and 2019, and 14,081 parcels were sold in 2020.
Figure 1 shows the monthly averages of farmland prices from the years of 2017 to 2019 and 2020. The dotted line representing the monthly average of farmland prices from the years of 2017 to 2019 shows that farmland prices were relatively constant at TWD 6000/m2. In contrast, the monthly averages of farmland prices in 2020 were higher, ranging from TWD 6899/m2 to TWD 10,775/m2. This figure provides a snapshot of the evidence indicating that COVID-19 increased farmland prices in Taiwan, although quasi-experimental research methods are necessary to derive causal estimates.

3.2. Data on Agricultural, Environmental, and Geographic Characteristics

The hedonic price theory indicates that the price of a product is determined by its attributes or characteristics [18]. In the case of farmland, the price of farmland is associated with its agricultural, geographic, and environmental characteristics because these factors affect the economic returns from agriculture [19]. Geographic maps containing information on the spatial distribution of agricultural facilities, agricultural zoning, and farmland productivity provided by the Council of Agriculture (CoA) are merged with the data on farmland transactions from the APRS. Two variables are used to measure the closest distance of each parcel of farmland to the nearest irrigation facility: a dummy variable, which indicates whether the farmland is in a major crop production zone, and a continuous variable of land productivity, which is indexed from 1 to 11. Higher scores indicate better land quality.
The previous literature suggests that farmland prices are not only determined by variables related to the economic returns from agriculture but also to the convenience of transportation and the potential for urban development [20]. We specify three variables to measure the convenience of transportation and the potential for urban development for each parcel of transacted farmland: the closest distance to the nearest highway, major road, and railroad in Taiwan.

3.3. Data on COVID-19

The Centers for Disease Control (CDC) provide data on COVID-19 cases in Taiwan. Specifically, we collect the daily number of confirmed cases of COVID-19 from 22 January to 30 September 2020. Next, we define two variables to quantify the spread of COVID-19. The first variable is a binary indicator defining the incidence of COVID-19. The value of this dummy variable is equal to one if the parcel of farmland was transacted after 22 January 2020 (the date of the first confirmed case of COVID-19 in Taiwan) and zero otherwise. The second variable is a continuous variable for the number of cumulative confirmed cases of COVID-19 for each day of the study period. These two variables measure the extensive and intensive spread of COVID-19 in Taiwan. In addition to these two variables, we specify another variable measuring web searches related to COVID-19 from Google Trends. We extract an index measuring the popularity of web searches for ‘COVID-19′ or ‘Coronavirus’ during each week of the treatment period (the COVID-19 period). This variable measures the general interest in COVID-19 among the public in Taiwan, given that individuals may not immediately become aware of additional cases of the disease.

3.4. Data on Government Payments and Macroeconomic Conditions

Other explanatory variables specified in this study include data on macroeconomic conditions and government payments provided to the agricultural sector. The Bureau of Agricultural Finance (BOAF) provides data on the total amount of government payments issued to the agricultural sector aggregated to each township at the monthly level from 2017 to 2020. This variable proxies for the total amount of government payments provided to the agricultural sector because the majority of the support provided by the BOAF included these financial instruments [15].
We specify three variables to reflect macroeconomic conditions across time in Taiwan. These three variables are drawn from official statistics reported by the Ministry of Economic Affairs (MOEA). The first variable is the monthly food price index between 2017 and 2020. The second and third variables are the monthly interest rates and the monthly stock market price index between 2017 and 2020. These three variables are merged by month and year with the data on farmland transactions.

3.5. Sample Statistics of the Selected Variables

Table 1 reports the sample statistics of farmland prices. Panel A of Table 1 shows the sample statistics of farmland prices before and after the first confirmed cases of COVID-19 were reported in Taiwan. We average the monthly farmland prices from 2017 to 2019 and define these years as the Pre-COVID-19 period in Taiwan. The average farmland prices were 5989 TWD/m2 in January, peaking at 6218 TWD/m2 in May from 2017 to 2019. The monthly numbers of transactions were relatively consistent, ranging from 1382 to 1286 transactions for the months of January and September from 2017 to 2019. Next, we average the monthly farmland prices in 2020 and define this year as the COVID-19 period in Taiwan. The average farmland prices were 6899 TWD/m2 in January 2020, peaking at 10775 TWD/m2 in March 2020.
Table 1 also reports the number of cumulative confirmed cases of COVID-19 and Google Searches related to COVID-19 in Taiwan. Panel B of Table 1 shows this distribution. At the end of January 2020, there were 10 cumulative confirmed cases of COVID-19 in Taiwan. This grew to 322 cumulative confirmed cases in March 2020, until gradually receding to 514 cumulative confirmed cases in September 2020. Information on COVID-19 was widely searched for in January 2020, peaking in March 2020. Google Searches related to COVID-19 decreased after March 2020, corresponding to the months where the community spread of COVID-19 was rather minimal in Taiwan.
Table 2 reports the summary statistics of the selected variables. We present the sample statistics based on the full sample and the prices of farmland sold after 22 January 2020 (Post = 1 & Treat = 1), after 22 January from 2017 to 2019 (Post = 0 & Treat = 1), between 1 January and 22 January 2020 (Post = 1 & Treat = 0), and between 1 January and 22 January for 2017, 2018, and 2019 (Post = 0 & Treat = 0). On average, farmland prices were TWD 6930/m2 for the entire sample. After 22 January 2020, farmland prices were TWD 8727/m2. The average amount of government payments issued to the agricultural sector in each township per year increased to TWD 15.31 million/month compared to TWD 10.32 million/month during other periods of time. Finally, 14.6% of the farmland sold after 22 January 2020 was located in urban areas compared to 24.6% of that sold during other periods of time.

4. Methodology

Because COVID-19 was an unexpected exogenous shock to the global economy, prior studies applied the difference-in-difference (DiD) method to estimate the impact of COVID-19 on economic outcomes [21,22]. In line with these studies, we specify the DiD method to identify the causal effect of COVID-19 on farmland prices in Taiwan.
The DiD method compares the differences in outcomes between treatment and control groups before and after the occurrence of an event or intervention. In this study, the control group is defined as the parcels of farmland sold between 1 January and 21 January of each respective year because the first confirmed case of COVID-19 was officially reported on 22 January 2020 in Taiwan. Similarly, the treatment group is defined as the parcels of farmland sold after 22 January of each respective year. Next, we define the time period before and after the occurrence of an event or intervention. Farmland sold in 2017, 2018, and 2019 are defined as the Pre-COVID-19 period, while those sold in 2020 are defined as the Post-COVID-19 period. The generalized version of the model for the farmland price equations is specified as follows:
l o g P i j t = α + γ × C O V I D t + β X i j t + ρ × T r e a t i t + u j + u t + ε i j t
where l o g P i j t is the logged value of the farmland price for the ith parcel of farmland located in township j transacted on day t. COVIDt is a variable measuring the spread of COVID-19 in Taiwan. This includes the binary indicator defining the incidence of COVID-19 and the other two continuous variables defining the number of cumulative confirmed cases of COVID-19 for each day of the study period and the intensity of web searches related to COVID-19 on Google Trends. X i j t is a vector of explanatory variables associated with farmland prices, and Treatit is a binary indicator for the treatment group. u j and u t are township and time fixed effects. The time fixed effects include month and year fixed effects to account for the monthly and yearly trends of farmland prices across townships. α ,   γ ,   β ,   ρ are the estimated parameters. The standard errors of the coefficients are clustered at the township level.
In Equation (1), the parameter γ quantifies the average treatment effect on the treated (ATT) of COVID-19 on farmland prices in Taiwan. The ATT estimator compares farmland prices before and after the first confirmed cases of COVID-19 in Taiwan across otherwise similar times after controlling for the explanatory variables associated with farmland prices. When the binary indicator measuring the incidence of COVID-19 is used, γ measures the change in percent in farmland prices before and after the first case of COVID-19 was confirmed in Taiwan on 22 January 2020. When the two continuous variables are used, γ measures the change in percent in farmland prices in response to an additional cumulative confirmed case of COVID-19 or an increase in Google Searches. We estimate Equation (1) using the fixed-effect models, and the standard errors of the parameters are clustered at the township level.

5. Empirical Results

5.1. Main Findings

Table 3 reports the main results of the farmland price equations. Model A reports the extensive effects of COVID-19 on farmland prices based on the binary indicator measuring the spread of COVID-19. Models B and C report the intensive effects of COVID-19 using the continuous variables on an additional cumulative confirmed case and web searches on Google Trends related to COVID-19. The other explanatory variables specified in the farmland price equations are listed in Table 2.
Model A of Table 3 captures the impact of COVID-19 on farmland prices after controlling for other explanatory variables of interest. The onset of COVID-19 increased farmland prices by 5.1%, ceteris paribus. Model B of Table 3 reports the estimates when the number of cumulative confirmed cases of COVID-19 is specified as the variable measuring the spread of COVID-19. An additional increase in the number of cumulative confirmed cases of COVID-19 increased farmland prices by 0.038%, ceteris paribus. Model C reports the estimates using web searches related to COVID-19 on Google Trends. An additional increase in web searches related to COVID-19 increased farmland prices by 0.086%, ceteris paribus. These results indicate that COVID-19 increased farmland prices across all three specifications of the variable measuring the spread of COVID-19 in Taiwan.
The models also control for farmland characteristics and environmental characteristics. The point estimates of these controls are practically identical in statistical significance and magnitude across all three models in Table 3. We discuss these point estimates using the results from Model A in Table 3. Farmland located in urban areas had higher sales prices of 51.4%. This premium is driven by speculation on behalf of real estate investors for converting farmland into residential housing [20]. Agricultural productivity increased farmland prices, as a one-point increase in this index increased sales prices by 2.5%. Size decreased farmland prices. Every 1000 m2 increase in the size of farmland reduced sales prices by 1.9%. Greater distances away from farmer’s associations, railroads, highways, and roads reduced farmland prices.
We also control for macroeconomic conditions in the farmland price equations. Specifically, we focus on food prices, interest rates, and stock prices because government reports have speculated that the positive correlation between COVID-19 and farmland prices are largely driven by these variables. The results from Model A in Table 3 show that interest rates and stock prices are positively associated with farmland prices in Taiwan. However, after controlling for these macroeconomic variables in the farmland price equations, the coefficient of the variable measuring the spread of COVID-19 remained statistically significant and substantial in magnitude. This provides evidence that macroeconomic conditions do not solely explain the causal effect of COVID-19 on farmland prices.

5.2. Urban versus Rural Areas

Previous studies have suggested that the primary purpose of farmland use differs between urban and rural areas. Plantinga and Miller [19] observed that urban farmland is purchased as a financial investment, while rural farmland is more likely to be purchased for agricultural use. Subsequently, the difference in the primary purpose of farmland use could possibly result in differential impacts of COVID-19 on farmland prices across urban and rural areas. In this section, we conduct a heterogeneity analysis to test this hypothesis.
Panel A of Table 4 presents the results for the farmland price equations using the sub-sample of farmland sold in urban areas. As reported, COVID-19 caused urban farmland prices to increase by 3.8%, and an increase in the number of cumulative confirmed cases of COVID-19 increased urban farmland prices by 0.028%, ceteris paribus. Moreover, an increase in the number of web searches related to COVID-19 increased urban farmland prices by 0.061%.
Panel B of Table 4 presents the results for the farmland price equations using the sub-sample of farmland sold in rural areas. It is evident that the onset of COVID-19 caused rural farmland prices to increase by 6.3%. An additional increase in the number of cumulative confirmed cases of COVID-19 increased rural farmland prices by 0.049%. Finally, an additional increase in web searches related to COVID-19 increased rural farmland prices by 0.091%. The heterogeneity analysis shows that COVID-19 caused larger increases in farmland prices in rural areas.

5.3. Robustness Checks of the Main Findings

We conduct a placebo test to confirm the robustness of the main results. We estimate the model using hypothetical years for the onset of COVID-19 in Taiwan in 2019, 2018, and 2017. Because the first cases of COVID-19 were confirmed in Taiwan on 22 January 2020, there should be an insignificant result when estimating the DiD estimators using these falsified treatment groups. Table 5 reports the results of the placebo test. The results show that COVID-19 had statistically insignificant effects on farmland prices in 2019, 2018, and 2018, suggesting that the main results are not caused by spurious correlations.

5.4. The Impact of COVID-19 on Government Payments

The next question of interest includes understanding the mechanism responsible for the impact of COVID-19 on farmland prices in Taiwan. We propose that government payments provided to individual farmers or farms can help to explain the main findings. The link between government payments and farmland prices has been widely documented in the agricultural economics and land economics literature, known as the capitalization effect [23]. In their review article, Latrouffe and Mouel [24] found that government payments were capitalized into farmland prices because farmers considered these funds akin to other sources of farm income, including the economic returns from agriculture.
To test whether government payments to the agricultural sector is the mechanism through which COVID-19 increases farmland prices in Taiwan, we estimate another DiD model with the dependent variable specified as the monthly amount of government payments that each township received from the BOAF. The intuition behind the government payments equation is that COVID-19 may correspond to increases in government payments to the agricultural sector, which could be capitalized into farmland prices in Taiwan. Table 6 reports the results of the government payments equation. The results reported in Model A show that COVID-19 increased government payments to the agricultural sector at the township level by TWD 2.74 million, ceteris paribus. An additional cumulative confirmed case of COVID-19 increased government payments to the agricultural sector at the township level by TWD 0.5 million. An increase in the number of web searches related to COVID-19 increased government payments to the agricultural sector by TWD 0.03 million. These results indicate that COVID-19 increased the amount of government payments that the agricultural sector received in Taiwan.

6. Discussions and Conclusions

This study examined the causal effect of COVID-19 on farmland prices in Taiwan. COVID-19 caused farmland prices to increase by 5.1%. An increase in the number of cumulative confirmed cases of COVID-19 also increased farmland prices. Finally, we empirically tested the mechanism through which COVID-19 increased farmland prices. The payments provided by the Taiwanese government to financially support the agricultural sector provided are responsible for these increases.
We found that interest rates are not the sole determinant of changes in farmland prices caused by COVID-19. Recall that the farmland price equations show that, even after controlling for macroeconomic conditions, such as food prices, interest rates, and stock prices, COVID-19 significantly increased farmland prices. Previous studies concluded that the relationship of COVID-19 with farmland prices depends on the direction and magnitude of macroeconomic conditions, particularly interest rates [11]. Thus, this study shows that government payments also impact farmland prices, consistent with more recent descriptive studies where ad hoc government payments, such as the Coronavirus Food Assistance Program, were found to be correlated with farmland prices in the United States [14].
The heterogeneity analysis shows that this effect is more pronounced for rural farmland. The Bureau of Agricultural Finance (BOAF) provided government payments only to the agricultural industry, where they must be used for agricultural purposes. The guidelines of these government payments are that they must be used to directly support agricultural operations and production for the agricultural sector or individuals interested in purchasing farmland for agriculture. Fairbairn [25] found that farmland in urban areas is more likely to be used by part-time farmers because they also use farmland as an asset investment. The heterogeneity analysis reflects the possibility that part-time farmers are less likely to purchase urban farmland as an investment due to the economic uncertainty caused by COVID-19. Subsequently, government payments have larger effects on rural farmland where agriculture is more likely to be its primary use [19].
This study has several policy implications. Anecdotal evidence suggests that emerging variants such as Omicron BA.2 will continue to impact the operations and production of the agricultural sector, subsequently affecting farm incomes [26]. As the pandemic continues, understanding the relationship between COVID-19 and farmland prices will remain important. Relatedly, while the previous literature has examined how farmland prices are impacted by exogeneous shocks, such as commodity prices for corn, these results are applicable for understanding how farmland prices will respond to exogeneous shocks related and non-related to COVID-19 [27].
Finally, this study provides insight into the economic instruments that policymakers can use to stabilize the farmland market. Many countries have implemented measures to support the agricultural sector in response to COVID-19. The USDA developed and implemented the Coronavirus Food Assistance Program and the USDA Pandemic Assistance to Producers to support producers impacted by market disruptions. Similarly, the Agricultural Finance Act used by the BOAF in Taiwan also reduced the economic burdens of the agricultural sector, subsidizing agricultural and farm operations and production. Thus, this study suggests that policymakers should consider government payments to the agricultural sector as a potential instrument to stabilize farmland markets in the future.
Although this study quantified the causal effect of COVID-19 on farmland prices, several caveats remain. First, we could not examine the impact of COVID-19 on other individual farm-level outcomes, such as farm profits. Second, we could not examine the impact of COVID-19 on different types of farms, such as fruit, vegetable, and rice farms. Third, we only investigated the causal effect of COVID-19 on farmland prices over nine months. Fourth, the data only include farmland transacted on the farmland market in Taiwan. Finally, our results may not be valid in the presence of potential spillover effects. That is, farmland sold in response to COVID-19 could affect the price of other parcels. Regardless of these potential drawbacks, the analytical framework used in this study can also be used to investigate the impact of COVID-19 on farmland prices in other countries. Moreover, given the global spread of COVID-19, these results provide implications for the farmland market in other countries.

Author Contributions

Conceptualization, all authors; methodology, B.L., L.-C.S., and P.-Y.C.; software, Y.-T.H.; validation, H.-H.C.; formal analysis, P.-Y.C., L.-C.S., and Y.-T.H.; writing—original draft preparation, B.L. and H.-H.C.; writing—review and editing, B.L. and H.-H.C.; funding acquisition, P.-Y.C. and L.-C.S. All authors have read and agreed to the published version of the manuscript.

Funding

This research received no external funding.

Data Availability Statement

Readers who are interested in the dataset can contact the Council of Agriculture for approval.

Acknowledgments

The authors thank the Council of Agriculture for making the data available. The findings of this paper do not reflect the view of the institute. The authors are responsible for any errors.

Conflicts of Interest

The authors declare no conflict of interest.

References

  1. United Nations. COVID-19 to Slash Economic Output by US $8.5 Trillion over Next Two Years. 2020. Available online: https://www.un.org/en/desa/covid-19-slash-global-economic-output-85-trillion-over-next-two-years (accessed on 30 April 2021).
  2. Elsaid, K.; Olabi, V.; Sayed, E.; Wilberforce, T.; Abdelkareem, M. Effects of COVID-19 on the Environment: An Overview on Air, Water, Wastewater, and Solid Waste. J. Environ. Manag. 2021, 292, 112694. [Google Scholar] [CrossRef] [PubMed]
  3. Sahraei, M.; Kuskapan, E.; Codur, M. Public Transit Usage and Air Quality Index During the COVID-19 Lockdown. J. Environ. Manag. 2021, 286, 112166. [Google Scholar] [CrossRef] [PubMed]
  4. Zhang, W.; Li, S.; Gao, Y.; Liu, W.; Jiao, Y.; Zeng, C.; Gao, L.; Wang, T. Travel Changes and Equitable Access to Urban Parks in the Post COVID-19 Pandemic Period: Evidence from Wuhan, China. J. Environ. Manag. 2022, 304, 114217. [Google Scholar] [CrossRef] [PubMed]
  5. Beckman, J.; Countryman, A. The Importance of Agriculture in the Economy: Impacts from COVID-19. Am. J. Agric. Econ. 2021, 103, 1595–1611. [Google Scholar] [CrossRef] [PubMed]
  6. Charlton, D. Seasonal Farm Labor and COVID-19 Spread. Appl. Econ. Perspect. Policy 2021, forthcoming. [Google Scholar] [CrossRef] [PubMed]
  7. Arita, S.; Grant, J.; Sydow, S.; Beckman, J. Has Global Agricultural Trade Been Resilient Under Coronavirus (COVID-19)? Findings from an Economic Assessment of 2020. Food Policy 2022, 107, 102204. [Google Scholar] [CrossRef] [PubMed]
  8. Borchers, A.; Ifft, J.; Kuethe, T. Linking the Price of Agricultural Land to Use Values and Amenities. Am. J. Agric. Econ. 2014, 96, 1307–1320. [Google Scholar] [CrossRef]
  9. Zhang, W.; Duffy, M. Agricultural Professional Expect Lower Farmland Values Over the Next 18 Months. 2020. Available online: https://www.extension.iastate.edu/agdm/articles/zhang/ZhaJul20.html (accessed on 30 April 2021).
  10. Oppedahl, D. AgLetter: February 2021. Available online: https://www.chicagofed.org/publications/agletter/2020-2024/february-2021 (accessed on 30 April 2022).
  11. Lawley, C. Potential Impacts of COVID-19 on Canadian Farmland Markets. Can. J. Agric. Econ. 2020, 68, 245–250. [Google Scholar] [CrossRef]
  12. Lawley, C. COVID-19 and Canadian Farmland Markets in 2020. Can. J. Agric. Econ. 2021, 69, 291–298. [Google Scholar] [CrossRef]
  13. Choi, J.; Painter, G. Self-Reported Vs. Market Estimated House Values: Are Homeowners Misinformed or Are They Purposely Misreporting? Real Estate Econ. 2017, 46, 487–520. [Google Scholar] [CrossRef]
  14. Zhang, W. Outlook for Land Values in 2021 and Beyond: Results from the 2020 Iowa Land Value Survey. 2021. Available online: https://www.extension.iastate.edu/agdm/articles/zhang/ZhaJan21.html (accessed on 30 April 2021).
  15. Bureau of Agricultural Finance; Council of Agriculture; Executive Yuan in Taiwan. Measures for Handling Policy-Based Agricultural Project Loans. 2020. Available online: https://www.boaf.gov.tw/view.php?theme=agricultural_development&subtheme=&id=2 (accessed on 30 April 2022).
  16. Lee, T.-H.; Lee, B.; Su, Y.-J.; Chang, H.-H. Green Payment Programs and Farmland Prices—An Empirical Investigation. Agriculture 2022, 12, 207. [Google Scholar] [CrossRef]
  17. Tay, D.; Chou, C.; Li, S.; Tee, S.; Cheong, S. Bubbles are Departures from Equilibrium Housing Markets: Evidence from Singapore and Taiwan. PLoS ONE 2016, 11, e0166004. [Google Scholar] [CrossRef] [Green Version]
  18. Rosen, S. Hedonic Prices and Implicit Markets: Product Differentiation in Pure Competition. J. Politic Econ. 1974, 82, 34–55. [Google Scholar] [CrossRef]
  19. Plantinga, A.; Miller, D. Agricultural Land Values and Future Land Development. Land Econ. 2001, 77, 56–67. [Google Scholar] [CrossRef]
  20. Chen, Y.; Lee, C.; Chen, G.; Wang, C.; Chen, Y. Factors Causing Farmland Price-Value Distortion and the Implications for Peri-Urban Growth Management. Sustainability 2018, 10, 2701. [Google Scholar] [CrossRef] [Green Version]
  21. Fang, H.; Wang, L.; Yang, Y. Human Mobility Restrictions and the Spread of the Novel Coronavirus (2019-nCOV) in China. J. Public Econ. 2020, 191, 104272. [Google Scholar] [CrossRef]
  22. Rodríguez-Planas, N. COVID-19, College Academic Performance, and the Flexible Grading Policy: A Longitudinal Analysis. J. Public Econ. 2022, 207, 104606. [Google Scholar] [CrossRef]
  23. Barnard, C.; Whittaker, G.; Westenbarger, D.; Ahearn, M. Evidence of Capitalization of Direct Government Payments into U.S. Cropland Values. Am. J. Agric. Econ. 1997, 79, 1642–1650. [Google Scholar] [CrossRef]
  24. Latrouffe, L.; Mouel, C. Capitalization of Government Support in Agricultural Land Prices: What Do We Know? J. Econ. Surv. 2009, 23, 659–691. [Google Scholar] [CrossRef]
  25. Fairbairn, M. ‘Like Gold with Yield’: Evolving Intersections Between Farmland and Finance. J. Peasant Stud. 2014, 41, 777–795. [Google Scholar] [CrossRef]
  26. Stephenson, A. Omicron COVID-19 Variant Concerning for Canadian Food Production, Farm Groups Say. 2022. Available online: https://globalnews.ca/news/8495093/omicron-covid-19-variant-canadian-food-production-concerns/ (accessed on 30 April 2021).
  27. Hausman, C.; Auffhammer, M.; Berck, P. Farm Acreage Shocks and Crop Prices: A SVAR Approach to Understanding the Impacts of Biofuels. Environ. Resour. Econ. 2012, 53, 117–136. [Google Scholar] [CrossRef]
Figure 1. Monthly average farmland prices over time. Note: the Y-axis is farmland price (TWD/m2), and the X-axis is an indicator of month. Data are drawn from the Actual Price Registration System managed by the Ministry of Interior in Taiwan. The years of 2017 to 2019 report the average values of farmland prices for these three years, while the year of 2020 reports the averages for 2020.
Agriculture 12 02163 g001
Table 1. Sample statistics of farmland prices over time.
Panel A. Farmland Transaction DataPanel B. COVID-19 Data
Farmland Prices
(TWD/m2)
Number of TransactionsCumulated CasesGoogle Search #
Year20202017–201920202017–201920202020
Month(A)(B)(C)(D)(E)(F)
January68995989112913821048
February87256099155610043998
March10,775590320401572322100
April838361511614142942963
May844662181765157544222
June884661871695146144714
July801063521503146446712
August705461671299134148812
September89536389147912865148
Note: The average value between 2017 and 2019 is reported. # The peak in the number of keyword searches for COVID-19 in March 2020 is set to 100. Data are drawn from the administrative profile of farmland prices in Taiwan. Years 2017–2019 report the average values between 2017 and 2019. Year 2020 reports the average value in 2020.
Table 2. Sample statistics of the selected variables.
Full SamplePost = 1
& Treat = 1
Post = 0
& Treat = 1
Post = 1
& Treat = 0
Post = 0
& Treat = 0
N*T 51,624 13,106 34,607 975 2936
VariableDefinitionMeanS.DMeanS.DMeanS.DMeanS.DMeanS.D
PostIf year 2020 (=1).0.27 0.45 10001000
TreatIf after 22 January (=1).0.92 0.27 10100000
PricePrice of the transacted parcel of farmland (TWD/m2).6830 8753 8727 10,404 6196 8056 7049 8010 5763 7475
PaymentsGovernment payments in the township (TWD million/month).10.32 14.04 15.31 20.01 8.54 10.72 7.43 9.93 10.02 11.80
LandSize of the transacted parcel of farmland (1000 m2).2.00 2.53 2.032.291.992.621.962.182.002.56
UrbanIf in an urban area (=1).0.25 0.43 0.150.350.280.450.230.420.280.45
IrrigationClosest distance to the irrigation facility (m).0.25 0.51 0.210.410.270.530.240.440.260.57
CropIf in a crop production zone (=1).0.48 0.50 0.570.500.450.500.420.490.420.49
ProductivityLand productivity (1–10). The higher the score, the better the quality.2.74 1.87 2.551.832.801.872.631.802.831.90
Farm associationClosest distance to the nearby farm association (m).3.03 1.82 3.161.792.981.823.071.823.031.84
RailroadClosest distance to railroad (m).7.84 6.53 8.286.277.696.637.606.267.726.56
HighwayClosest distance to highway (=1).7.96 12.34 7.3711.598.1412.577.7412.028.4212.94
RoadClosest distance to major road (=1).1.55 1.64 1.541.551.551.671.491.501.621.68
D_COVIDIf during COVID-19 period (=1).0.25 0.44 10000000
COVID_caseNumber of cumulated confirmed cases of COVID-19 per day.36.50 117.62 143.78 197.67 000000
COVID_searchGoogle Trends Search Index for COVID-19 per month.12.00 27.28 43.7037.650048000
Food priceFood price index in month.96.80 3.12 95.932.7596.973.05103.60096.412.84
Interest rateAverage monthly interesting rate.2.60 0.06 2.520.082.630.002.6302.630.000
Stock priceMonth average stock price index (10,000).1.07 0.08 1.140.091.050.041.2001.000.07
Table 3. Estimation of the farmland price equations (in log).
Model AModel BModel C
VariableCoefficientS.ECoefficientS.ECoefficientS.E
D_COVID0.051 **0.018
COVID_case/1000 0.383 **0.151
COVID_search/1000 0.866 *0.464
Treat−0.037 0.021 −0.021 0.022 −0.018 0.022
Land−0.019 ***0.002 −0.019 ***0.002 −0.019 ***0.002
Urban0.514 ***0.010 0.509 ***0.010 0.508 ***0.010
Irrigation0.013 0.015 0.012 0.015 0.012 0.015
Crop0.095 ***0.005 0.099 ***0.005 0.101 ***0.005
Productivity0.025 ***0.002 0.025 ***0.002 0.025 ***0.002
Farm association−0.049 ***0.002 −0.049 ***0.002 −0.049 ***0.002
Railroad−0.013 ***0.001 −0.013 ***0.001 −0.013 ***0.001
Highway−0.013 ***0.002 −0.013 ***0.002 −0.012 ***0.002
Road−0.031 ***0.003 −0.031 ***0.003 −0.031 ***0.003
Food Price0.004 0.003 0.004 0.003 0.004 0.003
Interest rate−0.232 **0.115 −0.299 **0.115 −0.603 ***0.222
Stock price−0.220 *0.114 −0.268 **0.112 −0.216 *0.112
Constant8.341 ***0.020 8.357 ***0.020 8.339 ***0.020
Control for yearsYesYesYes
Control for monthsYesYesYes
Control townshipsYesYesYes
Adjusted R20.773 0.773 0.773
N51,624 51,624 51,624
Note: ***, **, and * indicate statistical significance at 1%, 5%, and 10% levels, respectively. Standard errors are clustered in townships.
Table 4. Estimation of the farmland price equations.
Panel A. Urban Farmland
Key VariableCoefficientS.ECoefficientS.ECoefficientS.E
D_COVID0.038 *0.021
COVID_case/1000 0.279 *0.141
COVID_search/1000 0.613 *0.316
Other variablesYesYesYes
Adjusted R20.071 0.071 0.071
N12,683 12,683 12,683
Panel B. Rural farmland
Key variableCoefficientS.ECoefficientS.ECoefficientS.E
D_COVID0.063 ***0.018
COVID_case/1000 0.490 **0.231
COVID_search/1000 0.913 *0.528
Other variablesYesYesYes
Adjusted R20.781 0.780 0.781
N38,919 38,919 38,919
Note: The dependent variable of the farmland price is in logarithm. The list of the other control variables, including the township fixed effects, can be found in Table 3. ***, **, and * indicate statistical significance at 1%, 5%, and 10% levels, respectively. Standard errors are clustered in townships.
Table 5. Falsification test of the DiD model.
Hypothetical ShockYear 2019Year 2018Year 2017
VariableCoefficientS.ECoefficientS.ECoefficientS.E
D_COVID0.003 0.012 −0.012 0.022 0.019 0.022
Treat−0.033 0.220 −0.025 0.020 −0.028 0.020
Other variables # YesYesYes
Adjusted R20.751 0.751 0.751
Note: We use the data in the Pre-COVID-19 period for 2017, 201,8 and 2019. # The list of the other control variables, including the township fixed effects, can be found in Table 3. Standard errors are clustered in townships.
Table 6. Estimation of the government payments equation.
Model AModel BModel C
Key VariableCoef.S.ECoef.S.ECoef.S.E
D_COVID2.7462 ***0.5472
COVID_case 0.0005 ***0.0008
COVID_search 0.0335 ***0.0118
Other variables #YesYesYes
Adjusted R20.477 0.476 0.476
N51,624 51,624 51,624
Note: # The list of the other control variables, including the township fixed effects, can be found in Table 3. *** indicates statistical significance at 1%. Standard errors are clustered in townships.
Publisher’s Note: MDPI stays neutral with regard to jurisdictional claims in published maps and institutional affiliations.

