Article

Assessing Drought, Flood, and High Temperature Disasters during Sugarcane Growth Stages in Southern China

1
School of Water Resources and Hydropower Engineering, Wuhan University, Wuhan 430072, China
2
School of Civil Engineering, Sun Yat-sen University, Guangzhou 510275, China
3
State Grid Shaanxi Electric Power Research Institute, Xi’an 710100, China
4
State Grid (Xi’an) Environmental Protection Technology Center Co., Ltd., Xi’an 710100, China
*
Author to whom correspondence should be addressed.
These authors contributed equally to this work.
Agriculture 2022, 12(12), 2117; https://doi.org/10.3390/agriculture12122117
Submission received: 21 October 2022 / Revised: 6 December 2022 / Accepted: 7 December 2022 / Published: 9 December 2022
(This article belongs to the Special Issue Modeling the Adaptations of Agricultural Production to Climate Change)

Abstract

:
As a globally important sugarcane-producing region, Southern China (SC) is severely affected by various agrometeorological disasters. This study aimed to comprehensively assess multiple sugarcane agrometeorological disasters with regards to sugarcane yield in SC. The standardized precipitation evapotranspiration index and the heat degree-days were employed to characterize drought, flood, and high temperature (HT) during sugarcane growth stages in three provinces in SC in the period 1970–2020. Moreover, the relationships between sugarcane climatic yield and disaster intensities were investigated. The results indicated that the most recent decade witnessed the most intensive sugarcane agrometeorological disasters; sugarcane drought and HT intensities significantly (p < 0.05) increased in one and two provinces, respectively. Central and western SC was most drought-prone, while eastern SC was most flood-prone; sugarcane HT was concentrated in southwestern SC. The mature stage exhibited the greatest monthly intensities of drought and flood; the most HT-prone growth stage varied with provinces. The relationships between drought/flood intensity and sugarcane climatic yield were significant in seven districts; the yield-reducing effect of sugarcane flood was more obvious than that of drought. In conclusion, this study provides references for agrometeorological disaster risk reduction for sugarcane in SC.

1. Introduction

Agriculture is sensitive to climatic environments, and the increasing levels of climate change are having profound effects on agricultural crops from various aspects. Sugarcane is one of the most important economic crops in the world; to date, its response and adaptation to climate change have been extensively investigated in different regions around the world [1,2]. Among the effects of climate change on sugarcane production, some are considered positive, such as elevated CO2 concentration and increased air temperature, which could benefit sugarcane yield [3,4]; however, some are negative and can severely restrict sugarcane production. Such negative effects mainly refer to extreme weather events, e.g., drought, flood, and high temperatures [2,5,6,7]. Due to the long life cycle of sugarcane [8], its growth and yields are objectively affected by drought and flooding stresses [9,10,11,12], as well as high temperatures [13,14]. Given these concepts, it is considered that the most challenging problems induced by climate change for sugarcane production are extreme meteorological disasters [2]. Hence, from the perspective of the sustainability of sugarcane production, it is meaningful to reveal the characteristics of agrometeorological disasters occurring during sugarcane growth stages.
China is the third largest sugarcane-producing country in the world, following Brazil and India [14,15]. In China, sugarcane-producing areas are concentrated in southern China (SC for short), since the warm climate in SC is suitable for the growth and development of such tropical plants. In SC, the growing seasons of sugarcane are generally from March to December; during this long life-cycle, typical meteorological disasters in SC—including drought, flood, and high temperature—frequently occur during sugarcane growing seasons. Drought and flood are extensively distributed abiotic stresses for most crops; for sugarcane crops, a series of sugarcane field experiments have demonstrated that soil water deficit and excessive water (induced by drought and flood) can significantly reduce the growth and yield of sugarcane [16,17]. In addition to flood and drought, HT is also common in summer in SC. Although sugarcane crops are relatively tolerant to HT, the growth and yield of sugarcane is affected when air temperatures are above the upper limit of its optimal temperature range [18,19,20]. In conclusion, for sugarcane in SC, it is necessary to study the impacts of drought, flood, and HT during sugarcane growth stages [21].
Currently, at the regional scale, meteorological indices are powerful tools for evaluating the impacts of agrometeorological disasters on crops. Moreover, many studies employing these tools have further examined the relationships between meteorological disaster intensities and crop yield fluctuations. For agricultural drought and flood, various precipitation-based indices, e.g., the renowned SPI and SPEI, have been employed to quantify the water conditions during crop growing seasons; moreover, the drought and flood intensities characterized by meteorological indices have been found to be significantly related to the climatic yield of various crops, including rice, corn, wheat, and cotton in different regions [22,23,24,25,26,27]. For HT, many temperature-based indices, such as heat degree-days, have been applied to study the impacts of HT on the yields of various crops, e.g., maize, rice, and wheat [28,29,30]. However, relevant exploration regarding sugarcane crops has been insufficiently performed. For sugarcane in SC, as drought is the most noticeable agrometeorological disaster, a previous study revealed the spatial-temporal variations of drought during sugarcane growth stages in Guangxi province (the largest sugarcane-producing province in SC) by using the SPEI [25]. However, in addition to drought, many other disasters—such as flood and HT—also severely threaten sugarcane yield in SC; so far, comprehensive assessment research accounting for multiple agrometeorological disasters during sugarcane growth stages in SC is still lacking. More importantly, the potential effects of drought, flood, and HT on sugarcane yield fluctuations have not been explored on a regional scale.
Given these concepts, the primary aims of the present work were to reveal the spatial-temporal characteristics of drought, flood, and HT during sugarcane growth stages in SC, and further, to investigate the relations between the disaster intensities and sugarcane yield fluctuations. The obtained results can provide guidance for guaranteeing a high yield of sugarcane in SC in future climates.

2. Materials and Methods

2.1. Study Region

The basic information on sugarcane production in China is illustrated in Figure 1. It is apparent that Southern China (SC) is the dominating sugarcane-producing region in the country. In particular, Guangxi, Guangdong, and Yunnan provinces, i.e., three major provinces in SC lying between 20–29° N and 97–117° E (Figure 2), produce approximately 90% of the total sugarcane yield in China [31]; in recent years, they have produced over one hundred million tons of sugarcane per annum. Thus, this study took these three provinces as the study regions. SC has tropical and subtropical climate characteristics; local water and heat resources are abundant, providing ideal conditions for the growth of tropical crops, such as sugarcane.

2.2. Data Collection
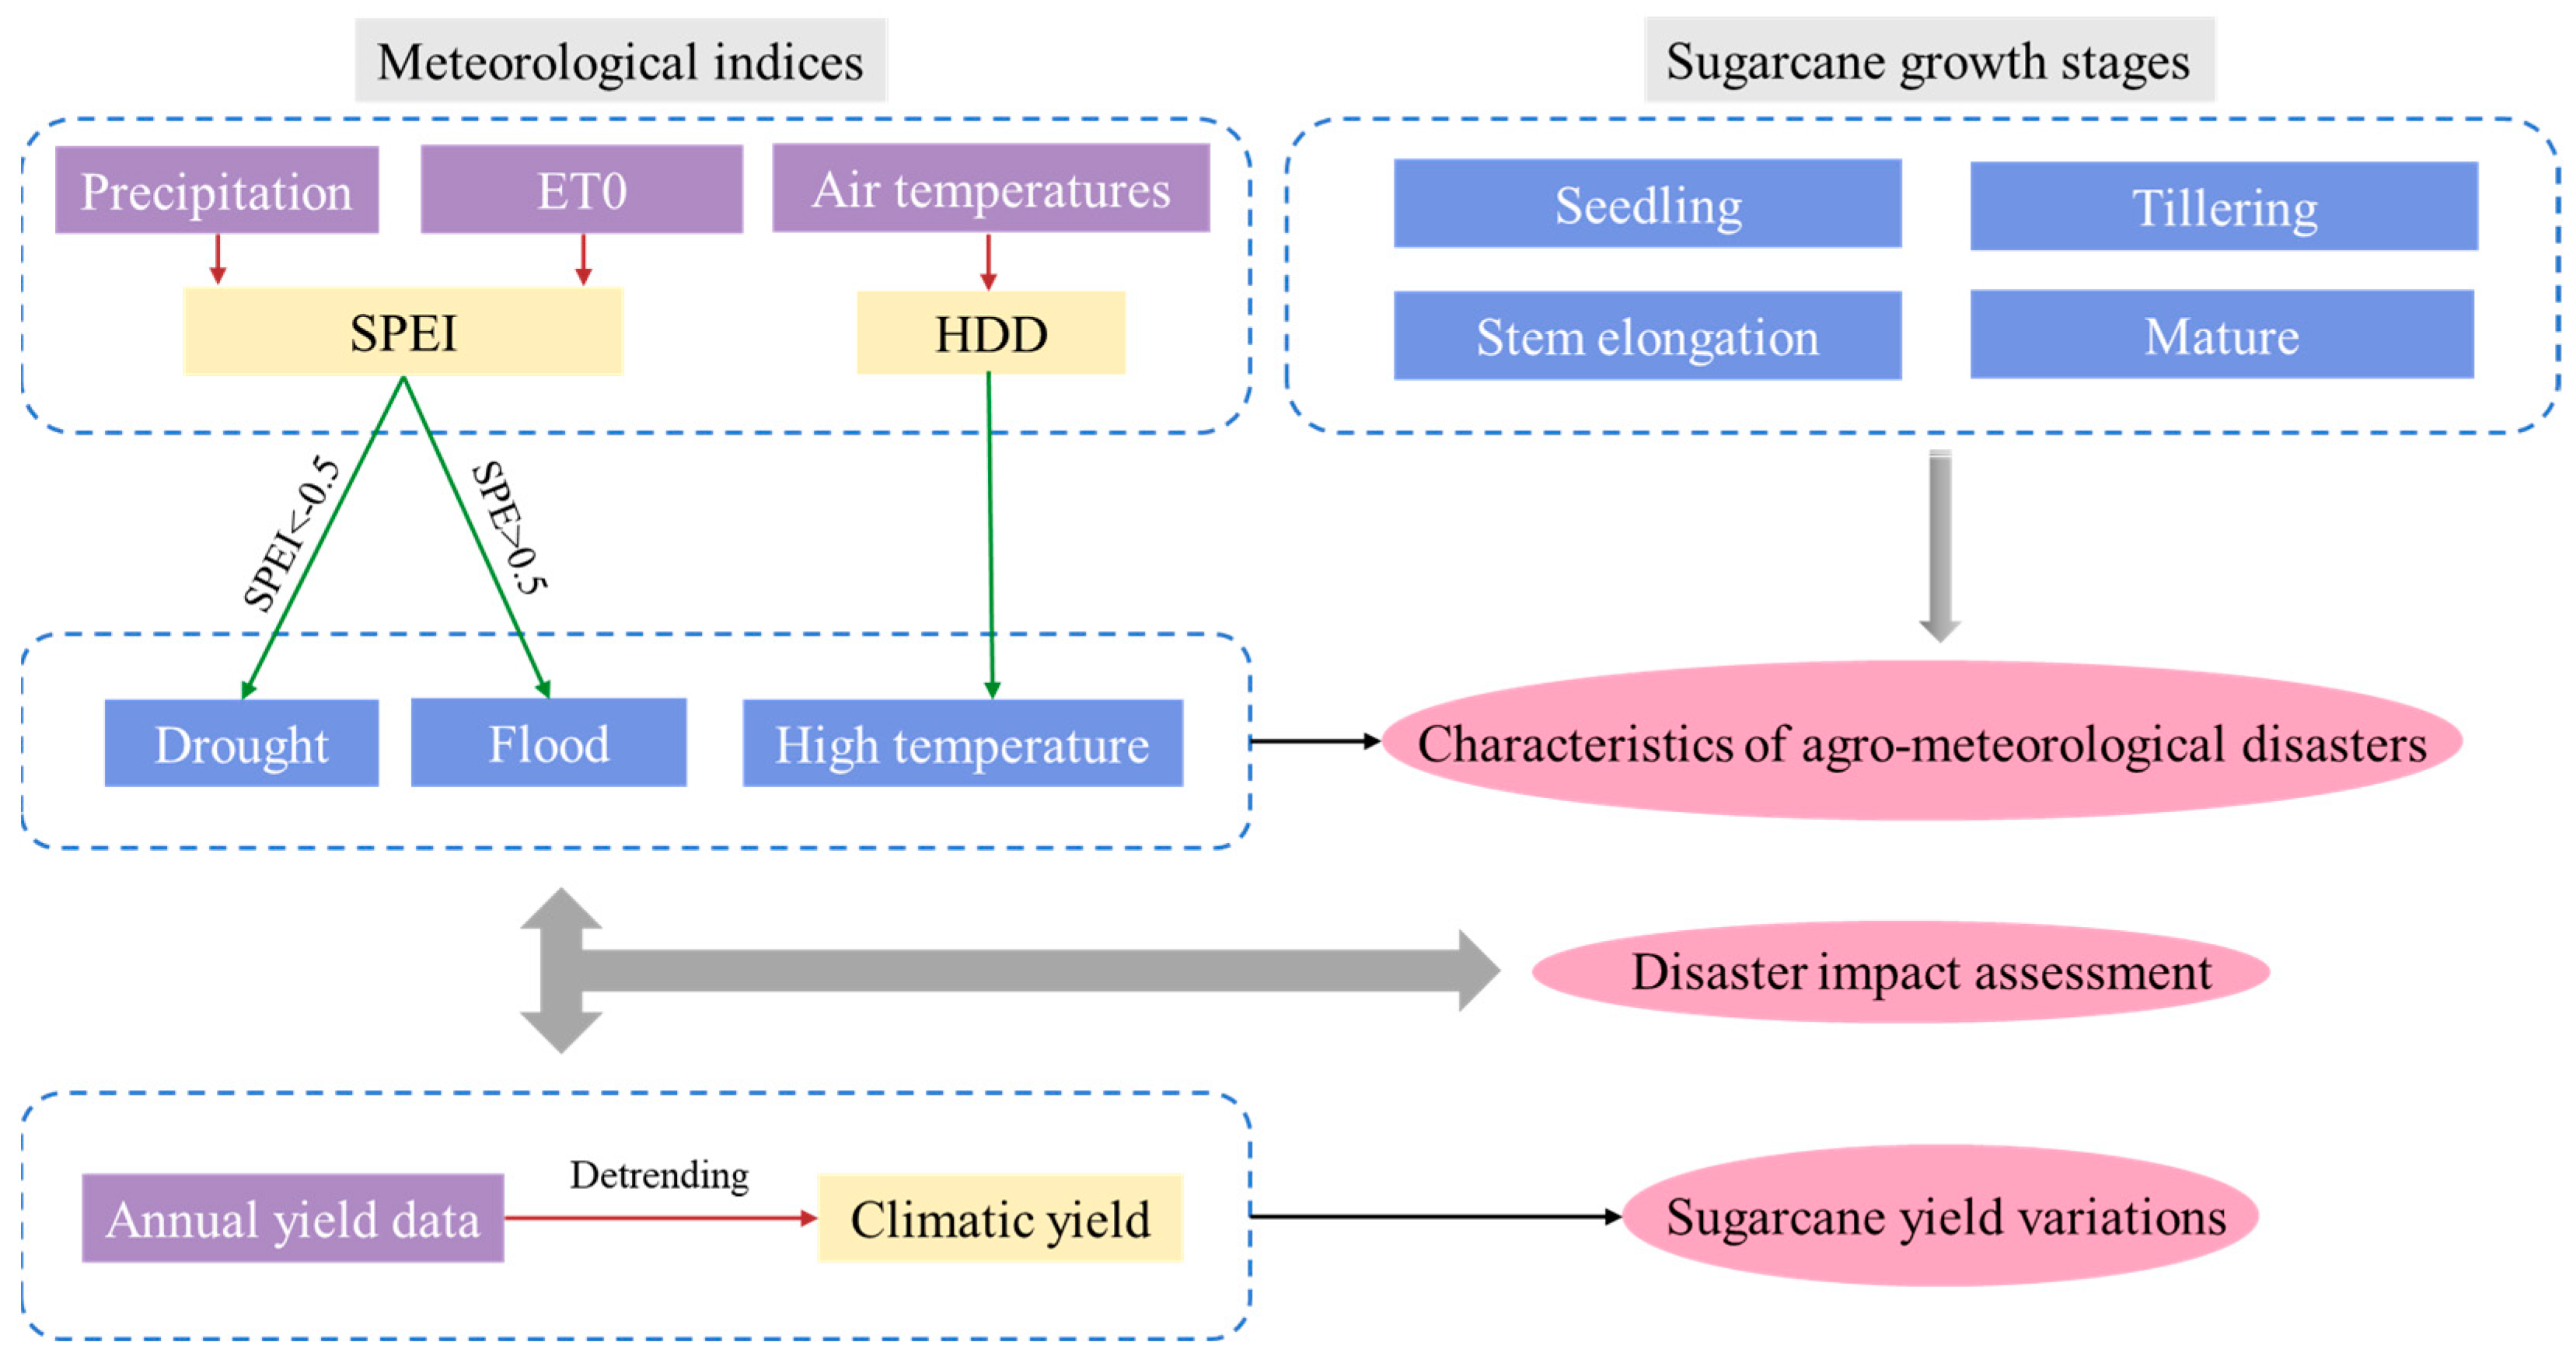
The study period was 1970–2020. The employed meteorological data, mainly including daily air temperature, precipitation, wind speed, and relative humidity from 1970 to 2020, were collected from the national meteorological state of China (http://data.cma.cn, accessed on 5 August 2021). Up to 81 national level meteorological stations distributed in SC that had consistent meteorological data were employed.
The whole growing season of sugarcane can be generally divided into four growth stages, i.e., seedling stage, tillering stage, stem elongation stage, and mature stage [25]. Since monthly indices were calculated to describe the drought and flood conditions at different sugarcane growth stages, the specific months for each growth stage were first determined. Depending on a series of existing reports concerning sugarcane in SC [25,32,33], the months of each sugarcane growth stage were determined in each province before computing the corresponding monthly SPEI. Resultingly, in Guangxi and Guangdong provinces, the seedling stage lasts from March to April, the tillering stage lasts from May to June, the stem elongation stage lasts from June to October, and the mature stage is from November to December. For Yunnan province, the seedling stage is from March to May, the tillering stage is from June to July, the stem elongation stage is from July to November, and the mature stage is in December.
The annual observed yield of sugarcane (kg/ha) in every district in SC was obtained from the provincial statistical materials that were accessible to us, including Guangdong rural year books (1992–2020), Guangxi year books (2001–2020), and Yunnan year books (1991–2020).

2.3. Study Method

The methodological diagram of this study is shown in Figure 3. First, basic meteorological data were employed to compute the drought and flood index (i.e., SPEI) and the heat index (i.e., HDD) in our study regions. Accordingly, the intensities of drought, flood, and high temperature disasters during four major sugarcane growth stages were quantified, and the spatial and temporal characteristics of these sugarcane agro-meteorological disasters were revealed. In addition, annual sugarcane yield data at different areas were collected; then, they were detrended, and the climatic yields of sugarcane were obtained. Afterwards, the variations in the actual sugarcane yield and the climatic yield were analyzed, respectively. Finally, to explore the potential impacts of agrometeorological disasters on sugarcane yield, the relationships between sugarcane climatic yield and the intensities of sugarcane drought, flood, and high temperature were examined.

2.3.1. Meteorological Indices for Drought, Flood, and HT

SPEI is a highly recognized index appropriate for agriculture drought and flood monitoring [22,23,26]. In essence, the SPEI describes water conditions based on the difference between precipitation and potential evapotranspiration. In accordance with actual requirements, the SPEI can be computed at month-scale, season-scale, and year-scale. In the present work, monthly SPEI was chosen to quantify the water conditions during each sugarcane growth stage.
First, the difference (D) between monthly precipitation P and monthly PET was computed:
D i = P i PET i
where Pi and PETi were precipitation (mm) and PET (mm) in month i, respectively. In this study, PET was calculated using the Penman–Monteith method, which was recommended by FAO due to its solid physical bases.
Afterwards, the Di series over the study period was fitted by the probability density distribution of three-parameter log-logistic function F(x). Finally, the monthly SPEI values were obtained from the standardized values of F(x). Detailed instructions for the theories and calculating processes of SPEI can be found in original documents [34]. According to a series of previous studies using the SPEI to identify agricultural drought and flood conditions [26,27,35,36,37], SPEI < −0.5 and SPEI > 0.5 were set as the criterion for identifying the drought and flood months, respectively. Since sugarcane growth stages last for several months, a growth stage often witnesses both sugarcane drought and flood conditions. To individually characterize sugarcane drought and flood intensities during the growth stages, we employed an accumulative index derived from a simple and commonly used waterlogging index named SEW30 (sum of excess water table within 30 cm soil profile) [38]. SEW30 accumulates the parts of excessive water tables over a crop growth period; accordingly, our employed accumulative index, called SESPEI (sum of excessive SPEI), accumulates the parts of excessive SPEI (relative to the drought and flood threshold) over a crop growth period. SESPEI was designed for evaluating regional drought and flood intensities during the crop growth stages [22,37].
(1)
For sugarcane drought:
SESPEI DR = { i = 1 n ( | SPEI i | 0.5 )           SPEI i < 0.5 0                                                                         SPEI i 0.5
(2)
For sugarcane flood:
SESPEI FL = { i = 1 n ( SPEI i 0.5 )           SPEI i > 0.5 0                                                                     SPEI i 0.5
where SESPEIDR and SESPEIFL indicate drought and flood intensities over the calculation stage, respectively. n is the number of months across the calculation stage. SPEIi indicates the SPEI value in month i. The −0.5 and 0.5 refer to the thresholds value for drought and flood in the SPEI, respectively.
To quantify sugarcane HT, we employed the heat degree-days index (HDD), which is a simple heat index accounting for both heat duration and heat intensity over a given period [29]. In describing the overall impacts of disasters over a given period, the calculation considerations of the HDD are similar to that of the abovementioned SEWx; thus, the HDD was calculated as:
HDD = { i = 1 n ( T max , i T h )                     T maxi , i > T h 0                                                                               T maxi , i T h
where Tmax,i is the daily maximum temperature on day i, Th is the threshold temperature for crop HT stress. n is the number of days of the calculation stage. Since sugarcane is a tropical crop, the upper temperature threshold for its normal growth is higher than that for many other crops, e.g., 30~35 °C [27,39]. Resultingly, in this paper, the Th of sugarcane was set to 38 ℃ based on previous research regarding sugarcane heat stress [18,40].
It Is noted that the length of the growth stages influenced the accumulative intensities of drought/flood/HT over the given growth stages. Hence, when comparing the disaster intensities at different growth stages in this study, the accumulative disaster intensity of each growth stage was divided by the months of this growth stage. In this way, the disaster intensities (i.e., monthly intensity of disasters) between different growth stages were compared more fairly.

2.3.2. Spatial-Temporal Characteristics of Sugarcane Agrometeorological Disasters

The linear trend method was performed to detect the changing tendency of the intensity of different agrometeorological disasters:
y = kx + b
where y indicates the years of calculation period, x is the examined disaster intensity index, e.g., SESPEI. K is the regression coefficient which represents the climate inclination rate of the disaster. K > 0 and k < 0 indicate the upward and downward trends, respectively. A significant regression result (p < 0.05) indicated that the disaster intensity significantly changed over the years.
For the spatial characteristic analysis, the ArcGIS software (version 10.2; ESRI, Redlands, CA, USA) was applied to illustrate the spatial distribution of the intensities of sugarcane drought, flood, and HT during different sugarcane growth stages. The disaster intensity indices, including SESPEIDR, SESPEIFL, and HDD, were first calculated yearly for each station and then averaged over the study period (1970–2020); afterwards, these results were spatially interpolated for the whole study region for the spatial analysis. The kriging method was used for interpolation, and the spatial resolution of computations was 4.2 km × 4.2 km.

2.3.3. Sugarcane Climatic Yield and Its Relations to Meteorological Disaster Intensities

The time series of crop yield can be primarily divided into two parts, i.e., trend yield and detrended yield (also known as the crop-restricting climatic yield—climatic yield for short in this study). The trend yield was determined by non-climatic factors, such as advances in agricultural technology and improvements in field management. Currently, there are various methods for detrending crop yield, but it should be noted that these methods cannot fully remove the influence of external factors. For the present work, detrending yield is not a research issue. Hence, we selected the quadratic polynomial [22,23,26] to detrend sugarcane yield, since this commonly used method can capture the non-linear trend of the time series of a crop yield. On the other hand, the climatic yield was determined by climatic factors, such as precipitation (relevant to drought and flood disasters) and air temperatures (relevant to high temperature disasters). Hence, the climatic yield of sugarcane (Ycl, kg/ha) was calculated as the difference between the actual sugarcane yield (Yact, kg/ha, which refers to the abovementioned annual observed yield derived from provincial year books), and the trend yield (Ytr, kg/ha)
Y cl = Y act Y tr
When the sugarcane climatic yield was obtained, its relations to the intensities of sugarcane drought, flood, and HT were investigated by performing a Pearson correlation analysis. Considering that the final sugarcane yield was affected by the combined impacts from the agrometeorological disasters occurring during various growth stages, we related the sugarcane climatic yield to the accumulative SESPEIDR/SESPEIFL/HDD over the whole sugarcane growth period. It should be noted that the calculation data were preprocessed to be more representative before the correlation analysis was performed. In particular, both sugarcane drought and flood disasters are common in SC; hence, when investigating the relationships between drought intensity (or flood intensity) and sugarcane climatic yield, it is meaningful to minimize the influence of flood (or drought). According to a previous drought-relevant paper [23], we considered calculating the years with the middle 40 percent of SESPEIDR/SESPEIFL/HDD values as “near-normal conditions”; as a result, the years with the lowest 30 percent of the index values were excluded to reduce the influence of other influential factors. Taking drought as an example, the years with the top 30 percent and the middle 40 percent of SESPEIDR values referred to “dry conditions” and “near normal conditions”, respectively; thus, the remaining years (with the lowest 30 percent of SESPEIDR) were excluded from correlation analysis because they were relatively flood-prone.

3. Results

3.1. Spatial-Temporal Characteristics of Sugarcane Drought, Flood, and HT

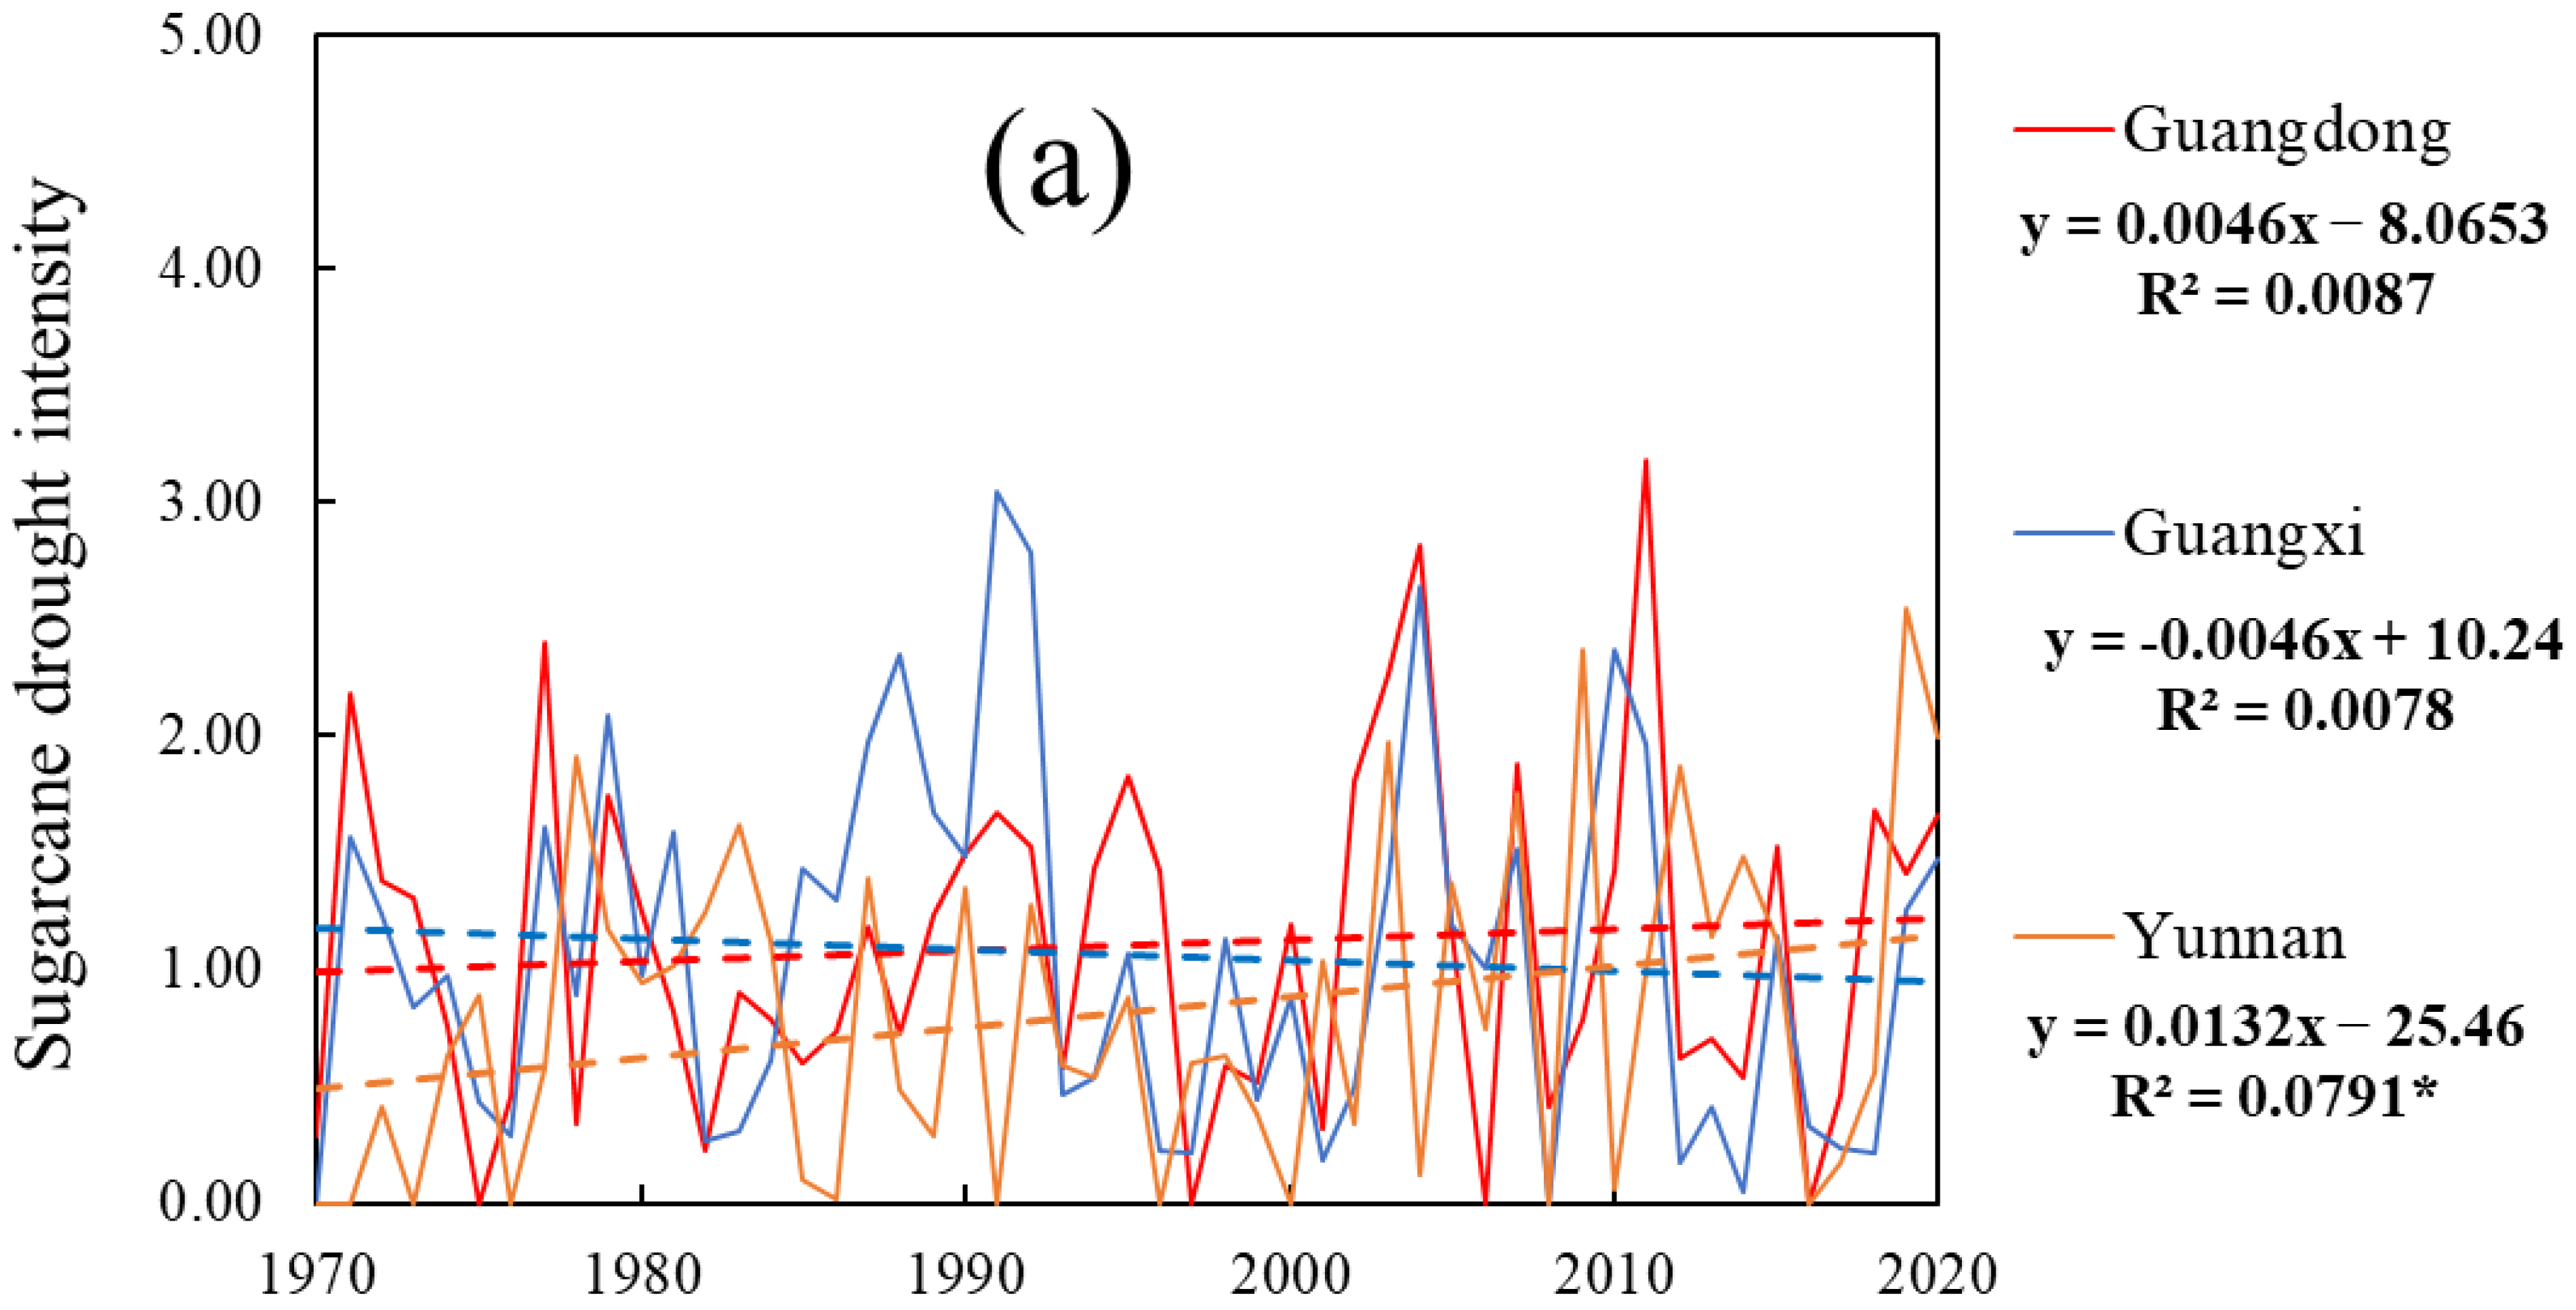
3.1.1. Temporal Trends

As displayed in Figure 4a, over the past five decades, the intensities of sugarcane drought have increased in Yunnan and Guangdong but decreased in Guangxi; more importantly, a significant (p < 0.05) increasing trend of drought intensity was detected in Yunnan (the SESPEIDR increased by 0.132 per decade). For sugarcane flood (Figure 4b), the intensities did not show significant trends in any province; additionally, the flood intensity in Guangdong was slightly higher than that in the other provinces. Compared with sugarcane drought and flood, sugarcane HT’s intensity exhibited a more obviously increasing trend (Figure 4c). HT intensities in Yunnan and Guangdong significantly increased; in particular, Yunnan saw an obvious increase in sugarcane HT (the HDD increased by 0.466 per decade). In general, the temporal trends of sugarcane drought and flood were relatively unobvious, except a significant increasing trend of drought intensity in Yunnan. In contrast, the sugarcane HT showed obvious increasing trends, and it was the most enhanced agrometeorological disaster over the past five decades in SC.

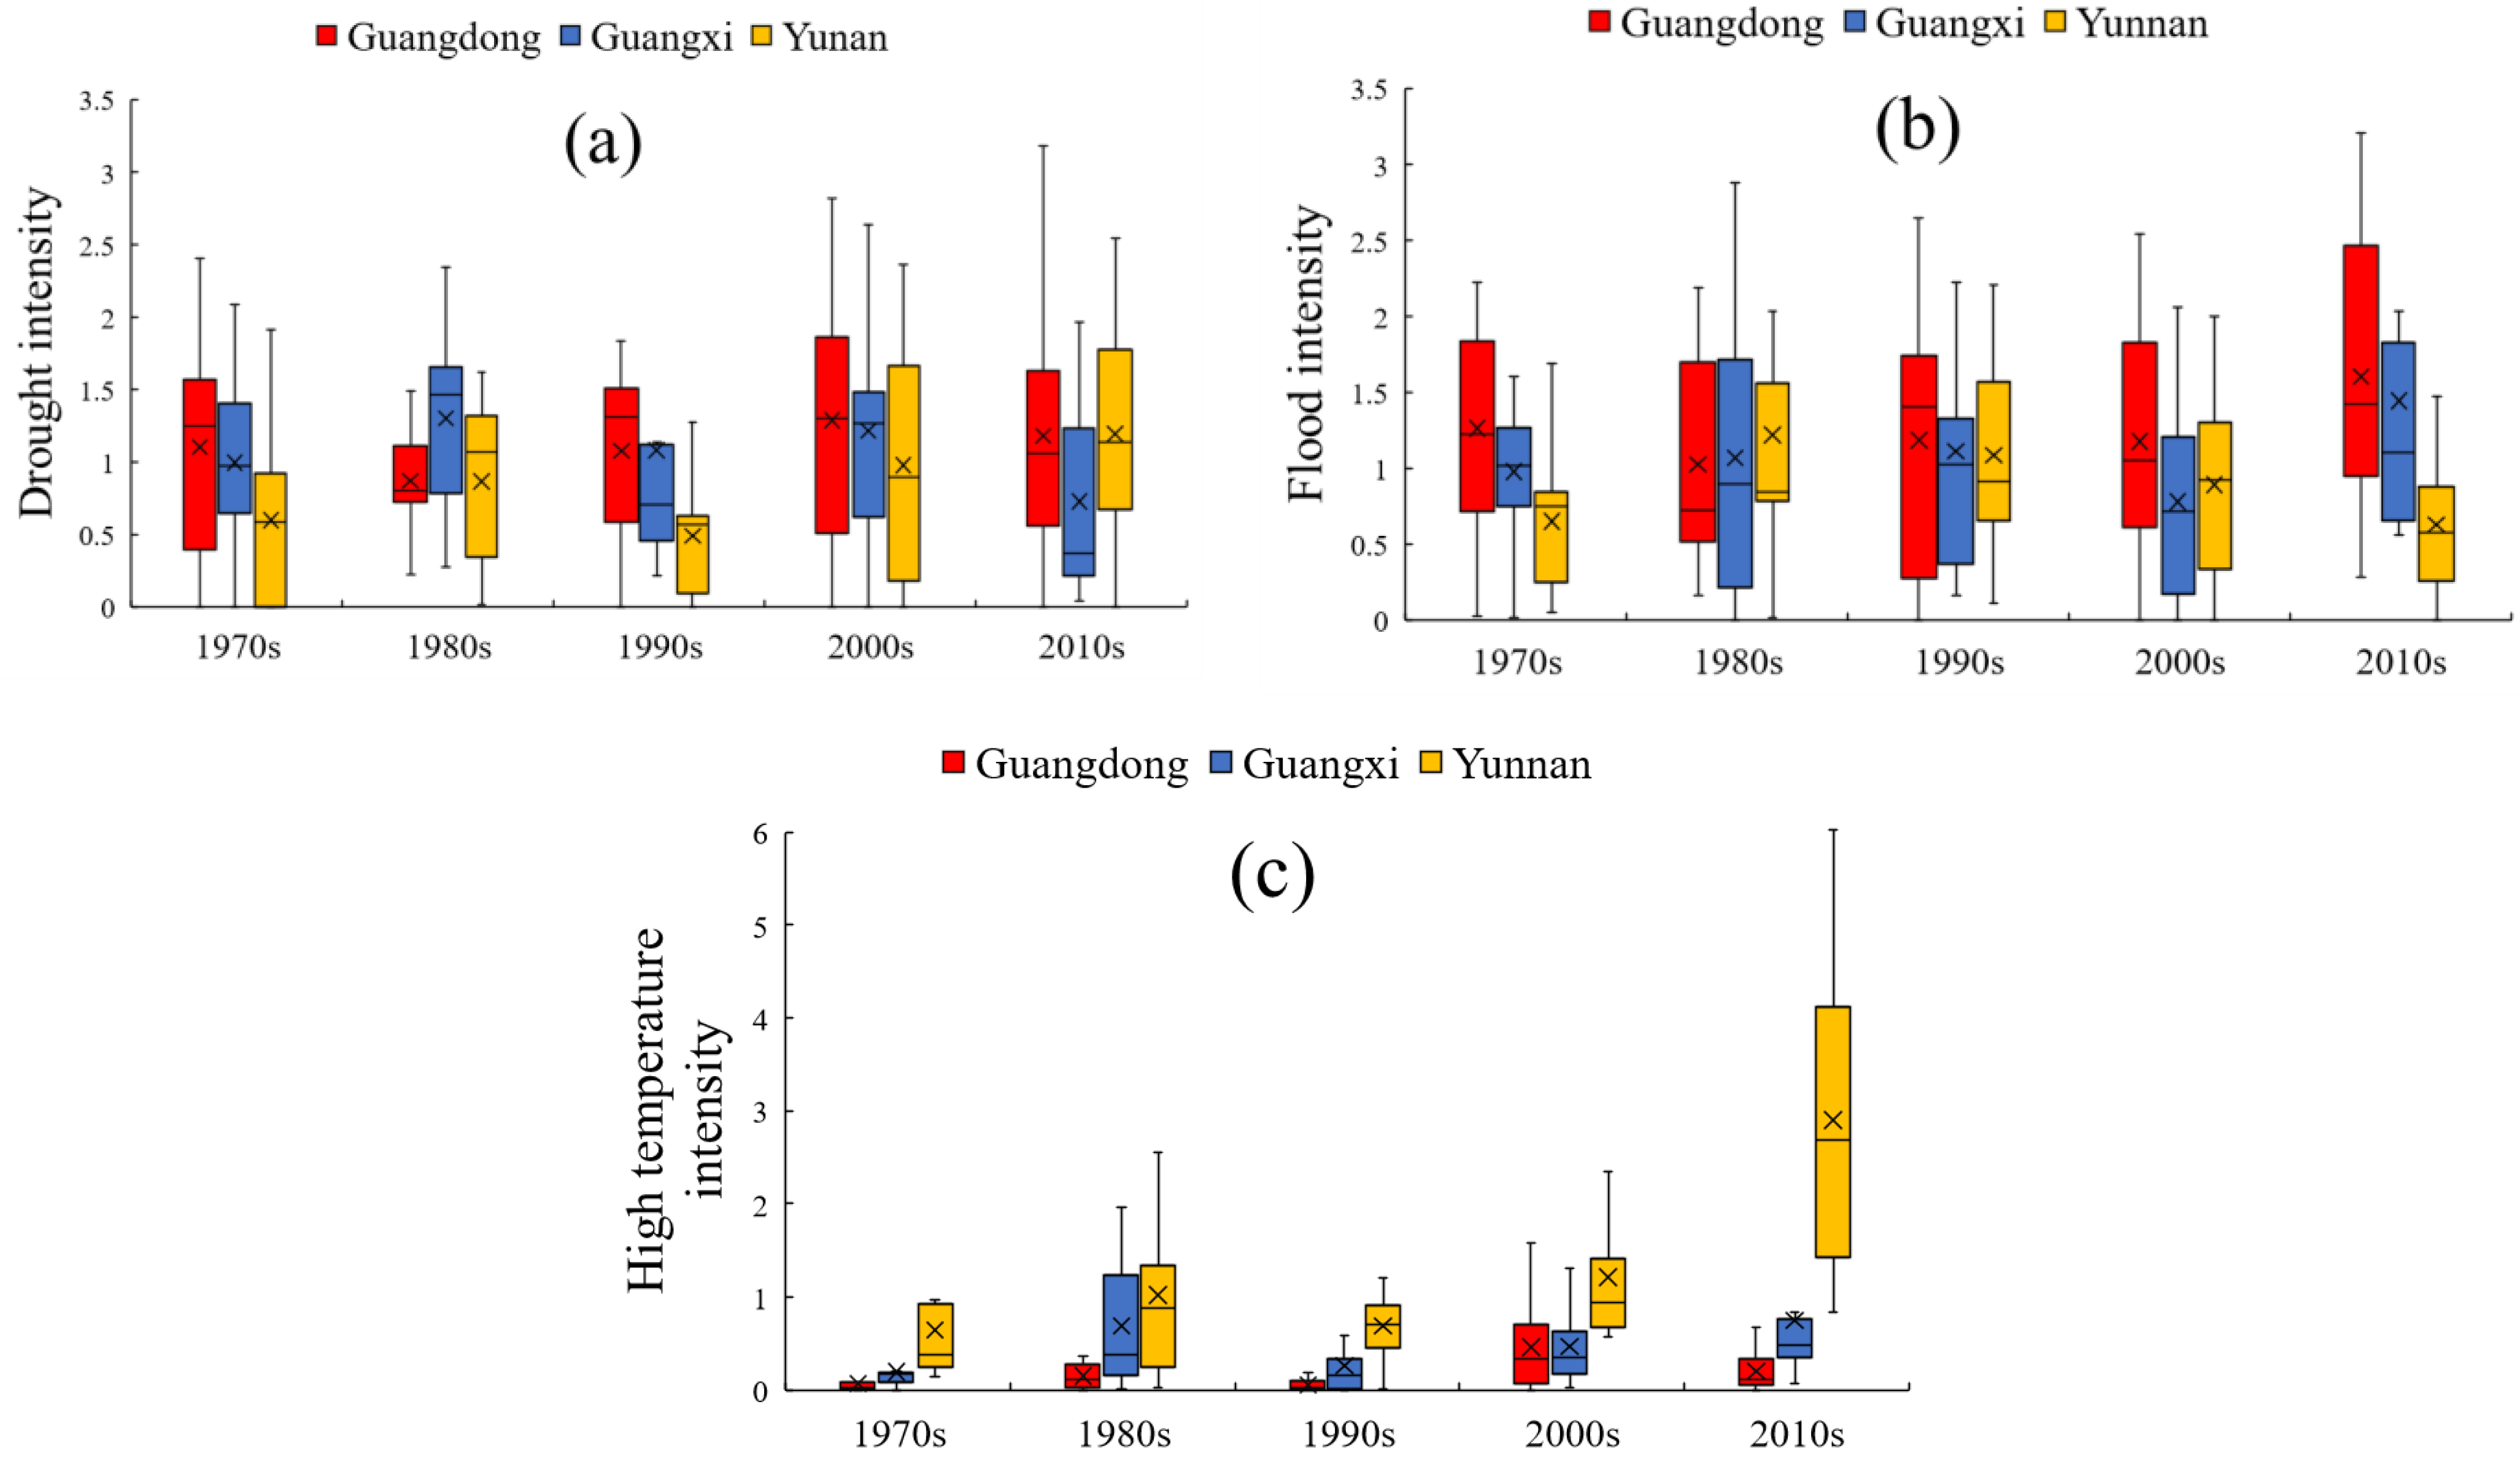
3.1.2. Interdecadal Analysis

The intensities of sugarcane drought, flood, and HT during different decades are displayed in Figure 5. Regarding sugarcane drought, the most recent two decades, i.e., the 2000s and 2010s, witnessed more intensive droughts than before. In the 2000s, sugarcane drought was intensive in Guangdong and Guangxi; additionally, in the 2010s, drought intensity in Yunnan reached a historic high. Generally, the most sugarcane drought-prone decade in SC was the 2000s. For sugarcane flood, the most recent decade (2010s) was apparently the most flood-prone decade for Guangdong and Guangxi. However, in the 2010s, the sugarcane flood intensity in Yunnan was at a historic low; therefore, for Yunnan, the most recent decade was severely affected by drought (Figure 5a) and slightly affected by flood (Figure 5b). Finally, for sugarcane HT, the most recent decade was the most HT-prone decade, which was in accordance with previous temporal trend results (Figure 5c). In particular, Yunnan showed a dramatically increasing tendency of sugarcane HT. In conclusion, taking drought, flood, and HT into overall consideration, the most recent decade was most affected by agrometeorological disasters for sugarcane in SC.

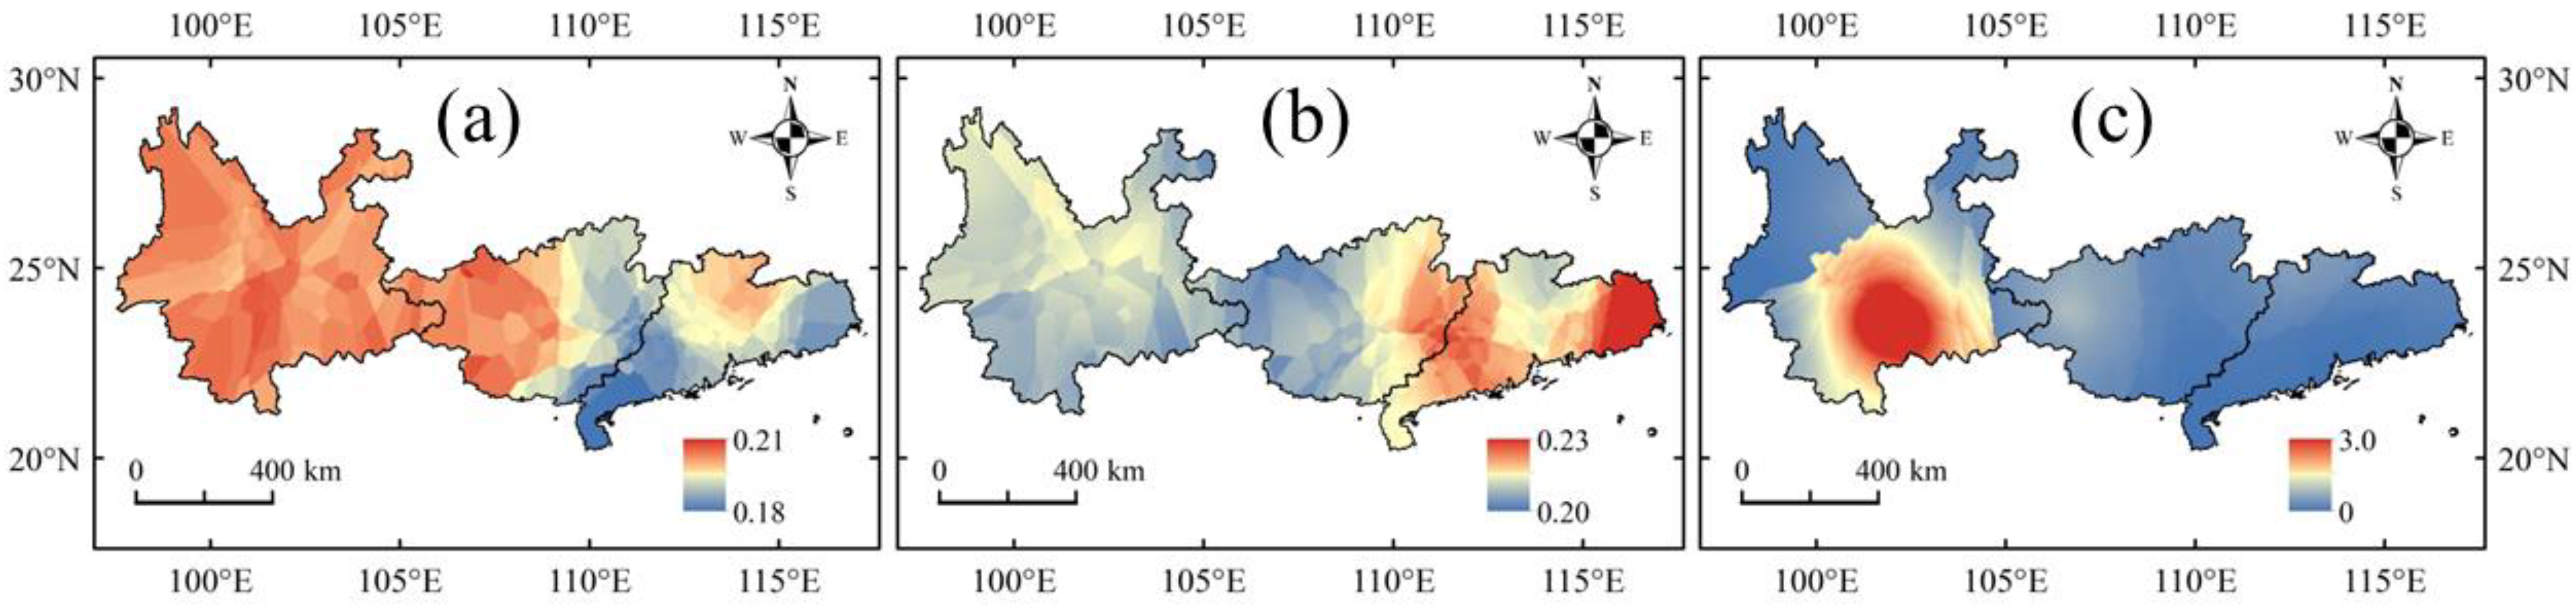
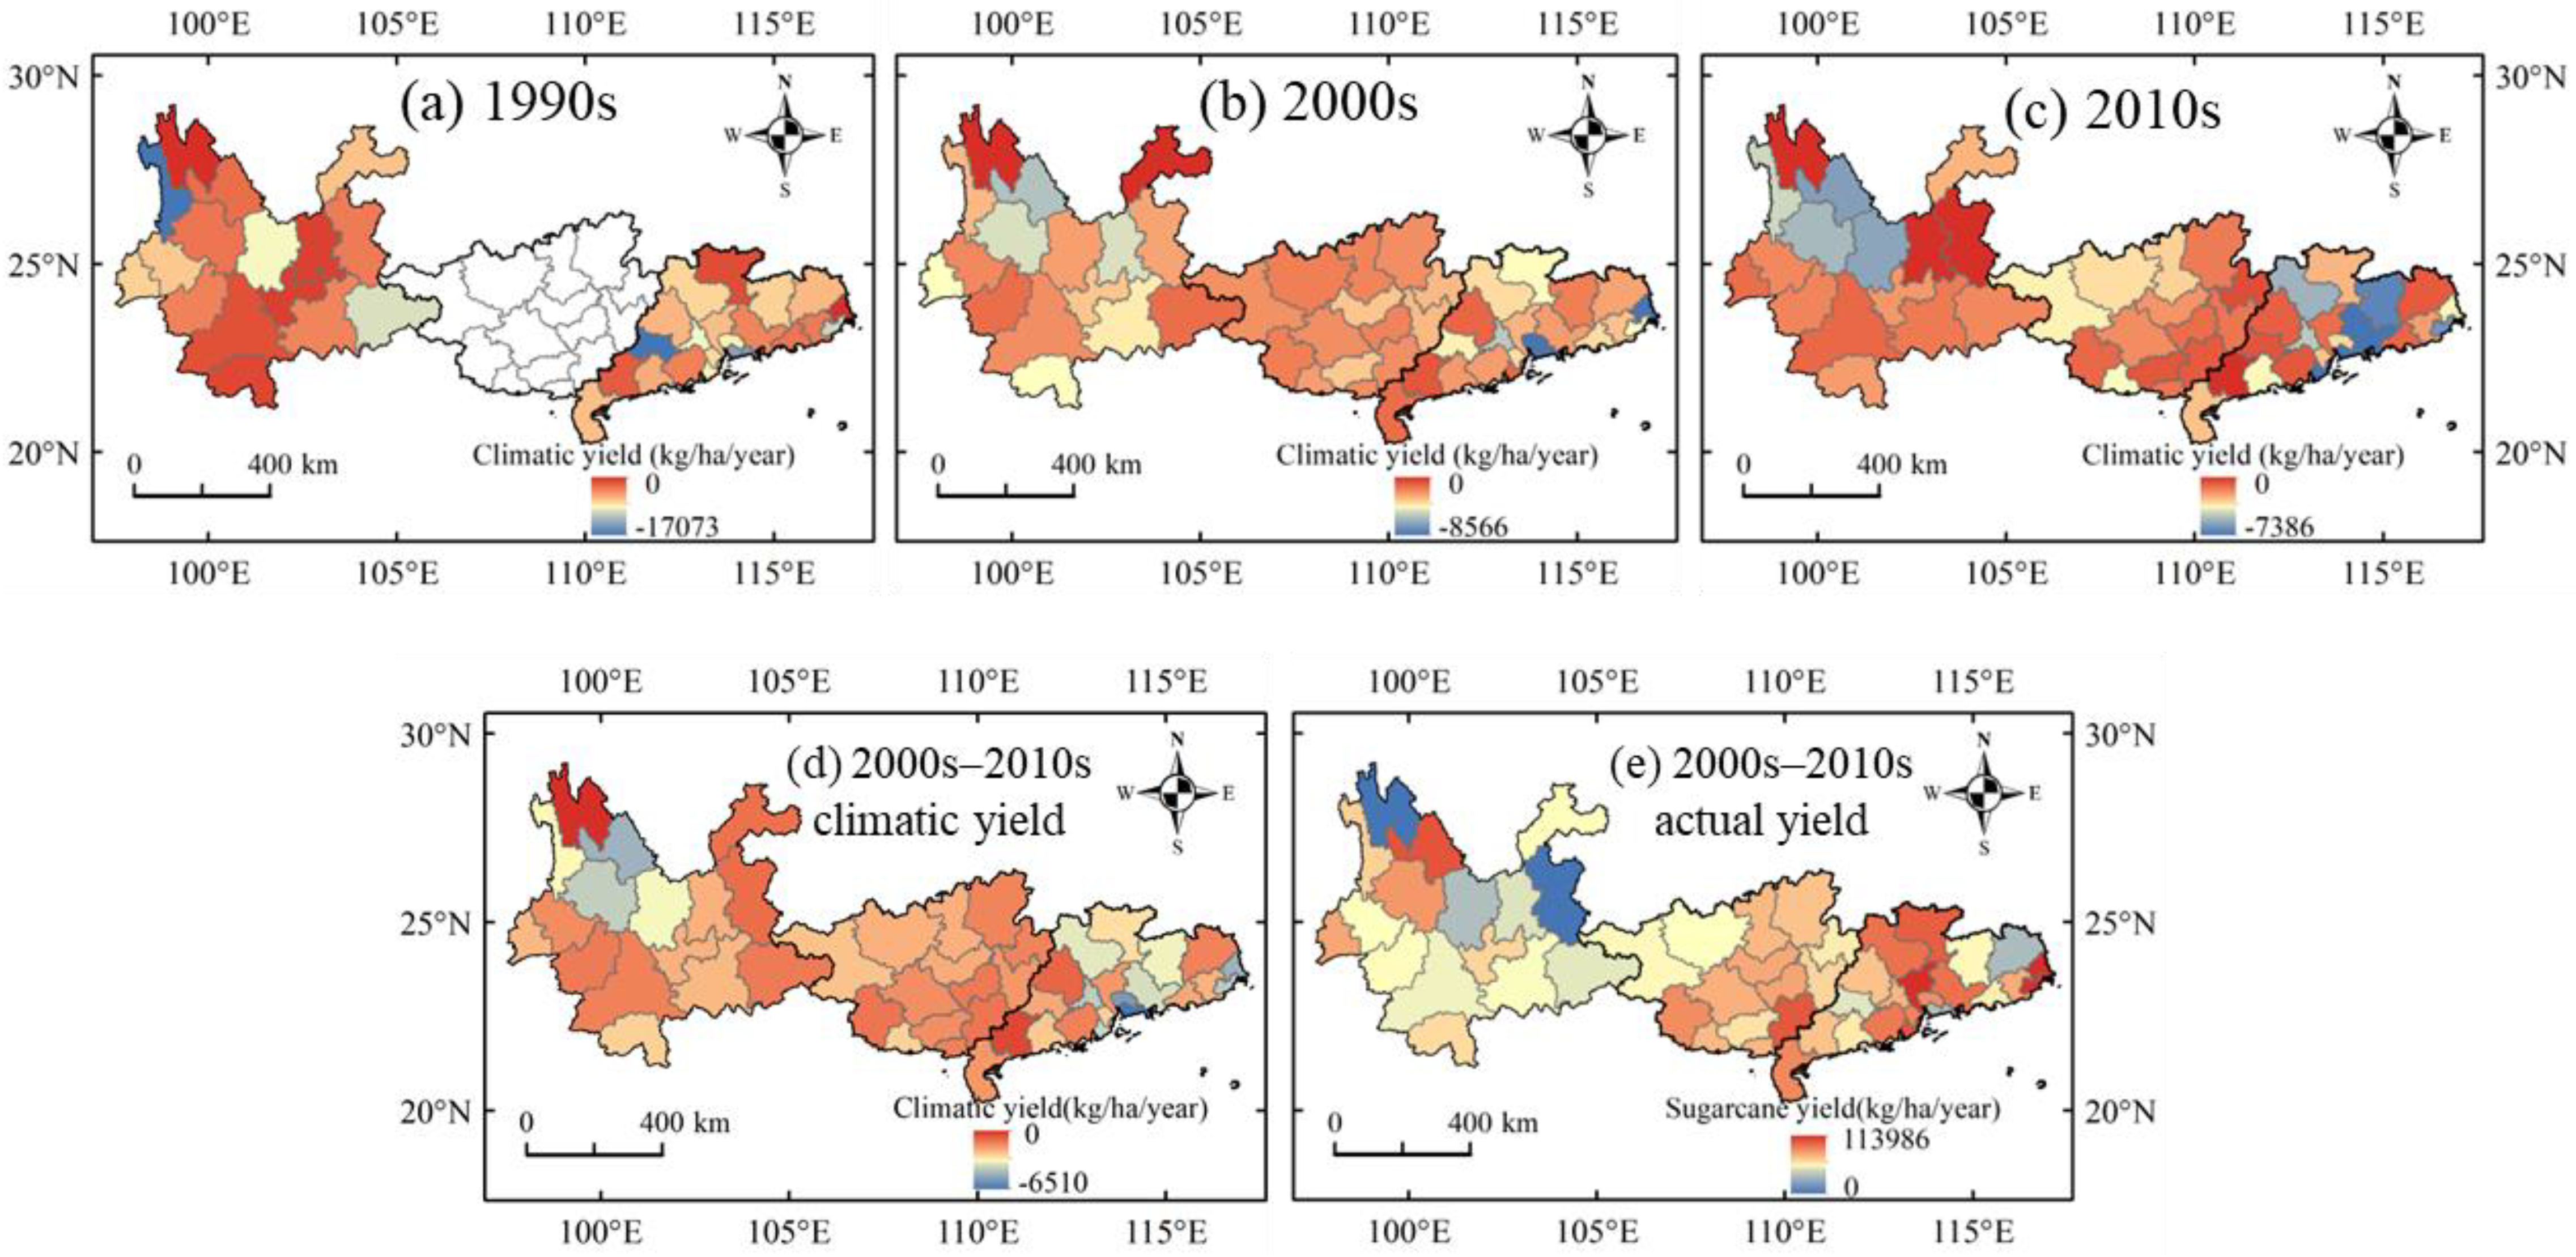
3.1.3. Spatial Characteristic Analysis

As depicted in Figure 6, at the seedling stage, drought-prone areas were concentrated in southwestern SC, i.e., Yunnan. Afterwards, during the following stage (i.e., tillering stage), the high-prone areas gradually expanded to all the three provinces, including western SC (Yunnan), central SC (western Guangxi) and eastern SC (eastern Guangdong). During the stem elongation stage, the high-prone areas were central SC (western Guangxi) and eastern SC (central Guangdong). Finally, at the mature stage, the high-prone area became northwestern SC (northern Yunnan). Hence, the drought-prone areas varied greatly with the growth stages. For sugarcane flood (Figure 6b1–b4), the high-prone areas at the initial stage were in eastern SC (Yunnan), which was generally similar to the drought-prone areas during this period. Nevertheless, during the remaining three growth stages, the distribution of flood-prone areas (Figure 6b2–b4) was totally different from that of drought-prone areas (Figure 6a2–a4). As for sugarcane HT (Figure 6c1–c4), during the first two growth stages, the high-prone areas were concentrated in southern Yunnan (Figure 6c1,c2). Then, at the stem elongation stage (Figure 6c3), the intensity of sugarcane HT reduced but the HT-prone areas became extensive, covering most parts of Yunnan and Guangxi, and northern Guangdong. At the mature growth stage, which corresponded to local winter seasons, HT did not occur.
In summary, the spatial distribution of the drought-prone and flood-prone areas varied greatly with the sugarcane growth stages; during critical growth stages, the drought-prone and flood-prone areas were quite different. Additionally, HT-prone areas were consistently concentrated in southern Yunnan during different growth stages.
Figure 7 illustrates the spatial distribution of sugarcane drought, flood, and HT over the entire sugarcane growing season. The spatial distributions of sugarcane drought (Figure 7a) and flood conditions (Figure 7b) were quite different; this sharp difference was also found in Figure 6. The former was concentrated in western and central SC, including Yunnan and western Guangxi; the latter was concentrated in eastern SC, including eastern Guangdong. For sugarcane HT, the most affected areas were concentrated in Yunnan.

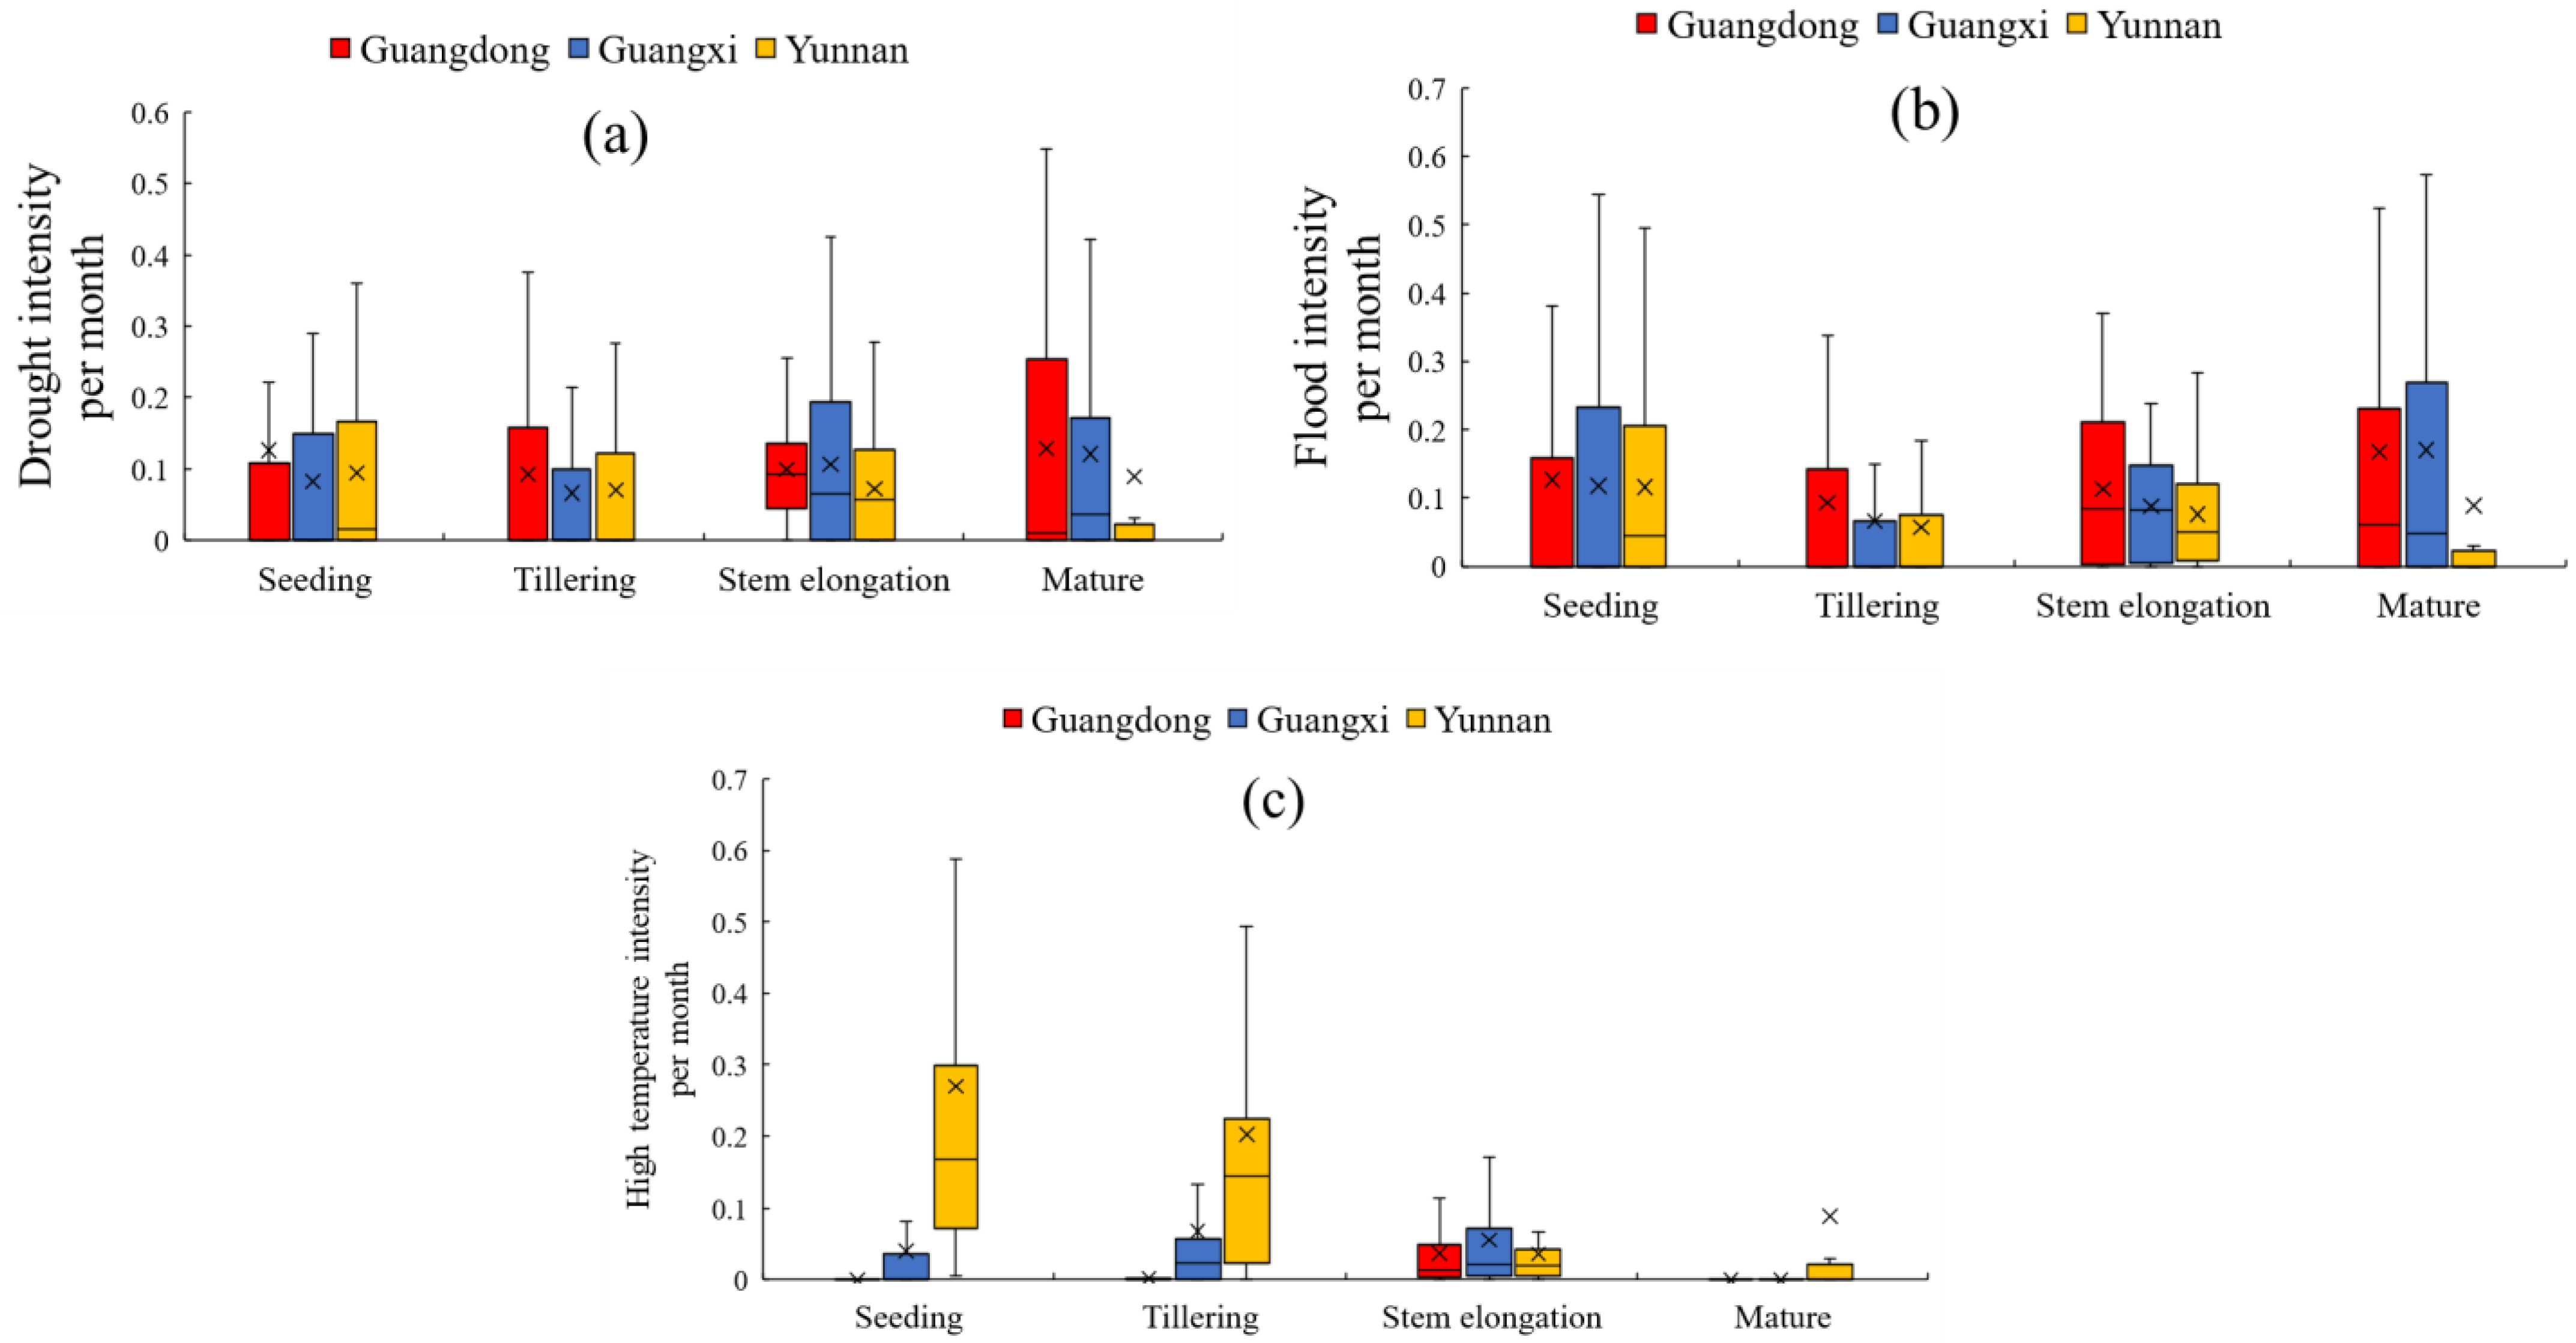
3.1.4. Inter-Growth-Stage Distribution of Sugarcane Drought, Flood, and HT

The comparison of the monthly intensities of disasters at different growth stages is illustrated in Figure 8. It was found that the mature stage was the period most affected by drought and flood (Figure 8a,b) in Guangdong and Guangxi. Meanwhile, in these two provinces, the tillering stage had the lowest monthly intensities of drought and flood. Finally, for sugarcane HT, the greatest monthly intensity in Guangdong and Guangxi was found at the stem elongation stage. In comparison, sugarcane HT was most intensive at the seedling stage in Yunnan (Figure 8c) which was mainly because a few HT-intensive places in Yunnan (i.e., Huaping station and Yuanjiang station) suffered severe HT during the seedling stage.

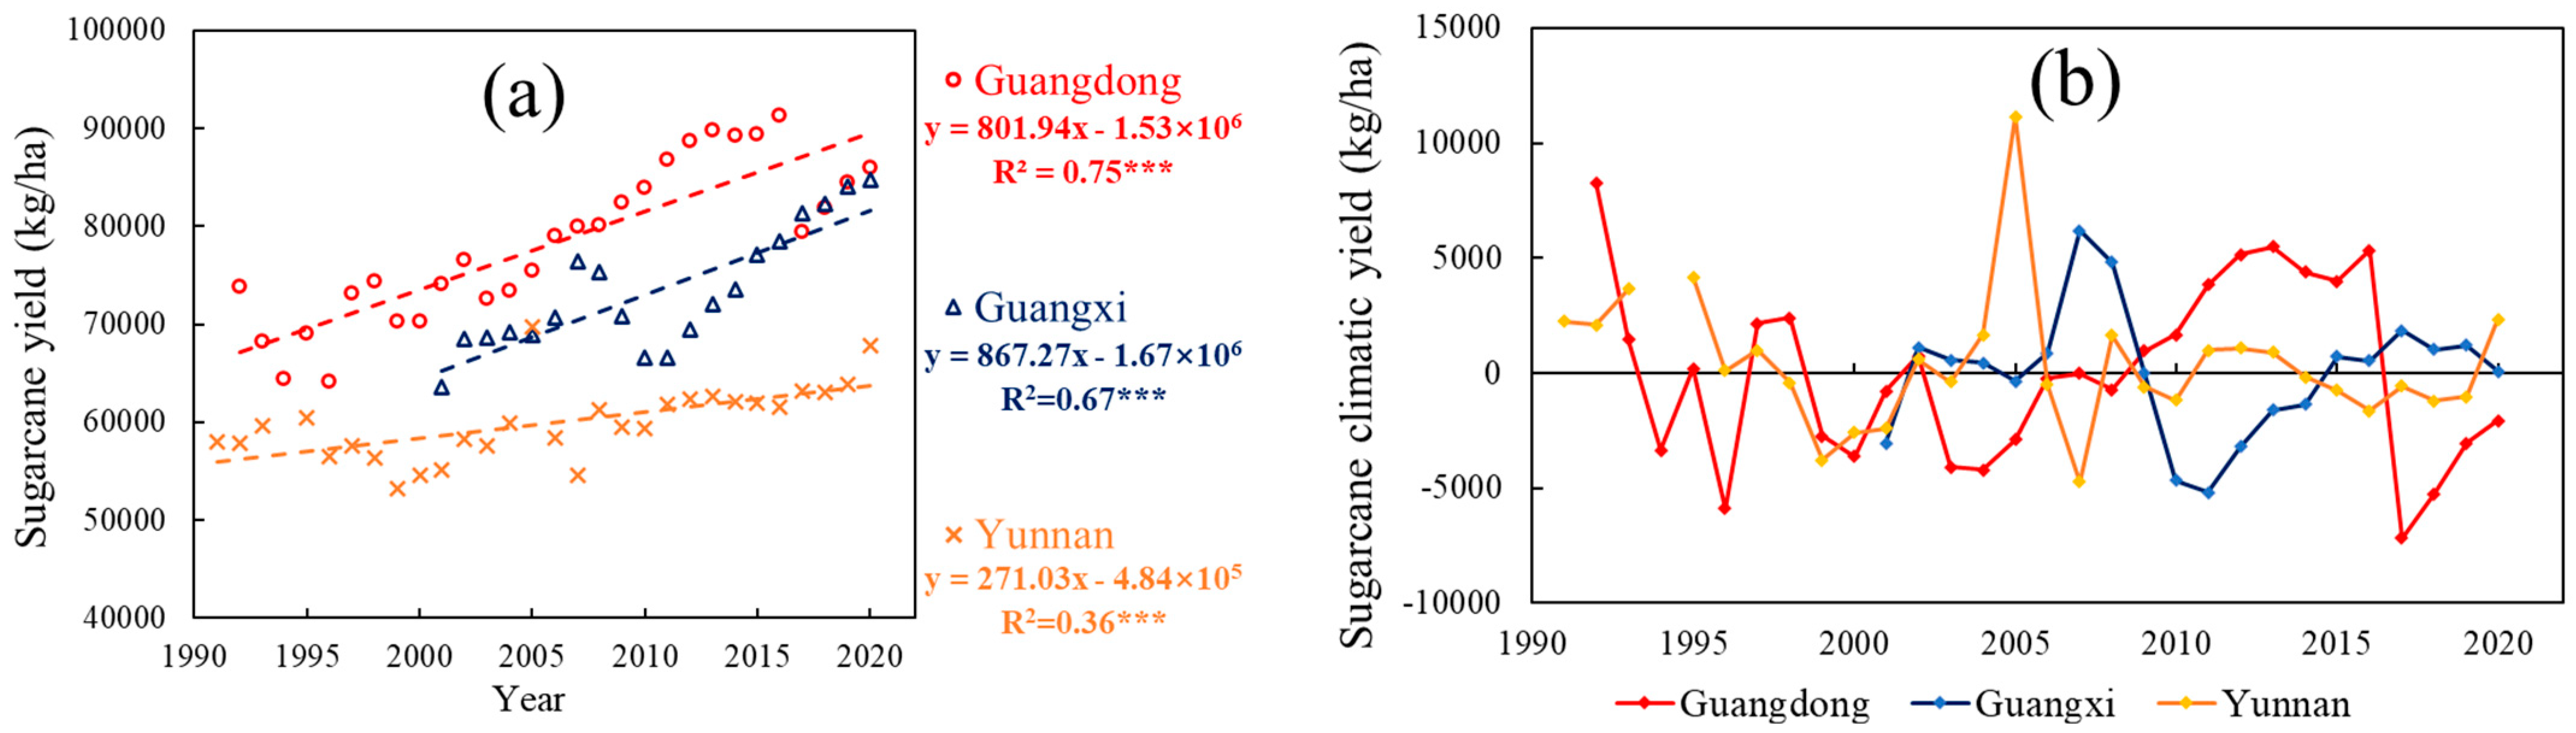
3.2. Sugarcane Yield Variations over the Past Few Decades

Figure 9a displays the variations in sugarcane yield (kg/ha) in the three provinces in SC. It is obvious that over the past few decades, sugarcane yield in SC has increased significantly (p < 0.001). In particular, Guangdong and Guangxi have witnessed a highly increasing rate of sugarcane yield (increased 801.94 and 867.27 kg/ha per year). These results suggest that sugarcane yield in SC maintained a sustainable increase. The obtained sugarcane climatic yield after detrending the sugarcane yield is displayed in Figure 9b. As illustrated by the negative values of the sugarcane climatic yield, the periods witnessing the most severe sugarcane yield losses in the three provinces were different; most severe sugarcane yield losses in Guangdong, Guangxi, and Yunnan occurred around the years 2017, 2011, and 2006, respectively. In terms of SC, the years around 2000 were the only period during which all three provinces simultaneously suffered severe losses in sugarcane yield. According to Figure 5b, around 2000, sugarcane flood intensity in SC reached a high level, contributing to severe sugarcane yield losses during that period. During the most recent decade, sugarcane climatic yield varied greatly among the three provinces. In Yunnan, sugarcane climatic yield was always near zero, indicating that the sugarcane yield was slightly influenced by agrometeorological disasters. In Guangxi, the sugarcane climate yield reached a historic low in the 2010s and then continued to increase. However, an opposite trend was found in Guangdong; its sugarcane climatic yield was high during 2010–2015, but then decreased sharply and continued to maintain low levels.
To analyze the spatial characteristic of sugarcane climatic yield in SC, the negative parts of sugarcane climatic yield, which describe yield losses, were calculated during the 1990s, 2000s, and 2010s (Figure 10a–d). It was noted that northwestern SC (including northern Yunnan) and eastern SC (including eastern Guangdong) were consistently low-climatic-yielding regions in different decades; thus, sugarcane yields in these regions were greatly affected by agrometeorological disasters (Figure 10d). In addition, the differences of climatic yield between districts were greater in Guangdong than in the other two provinces. We also mapped the spatial distribution of the actual yield of sugarcane per year (kg/ha/year), and the result is shown in Figure 10e. It was found that high-yielding areas were concentrated in eastern SC, mainly including eastern Guangxi and western Guangdong. Moreover, in most high-yielding areas, the corresponding climatic yield was also generally high, implying strong risk-resistant abilities.

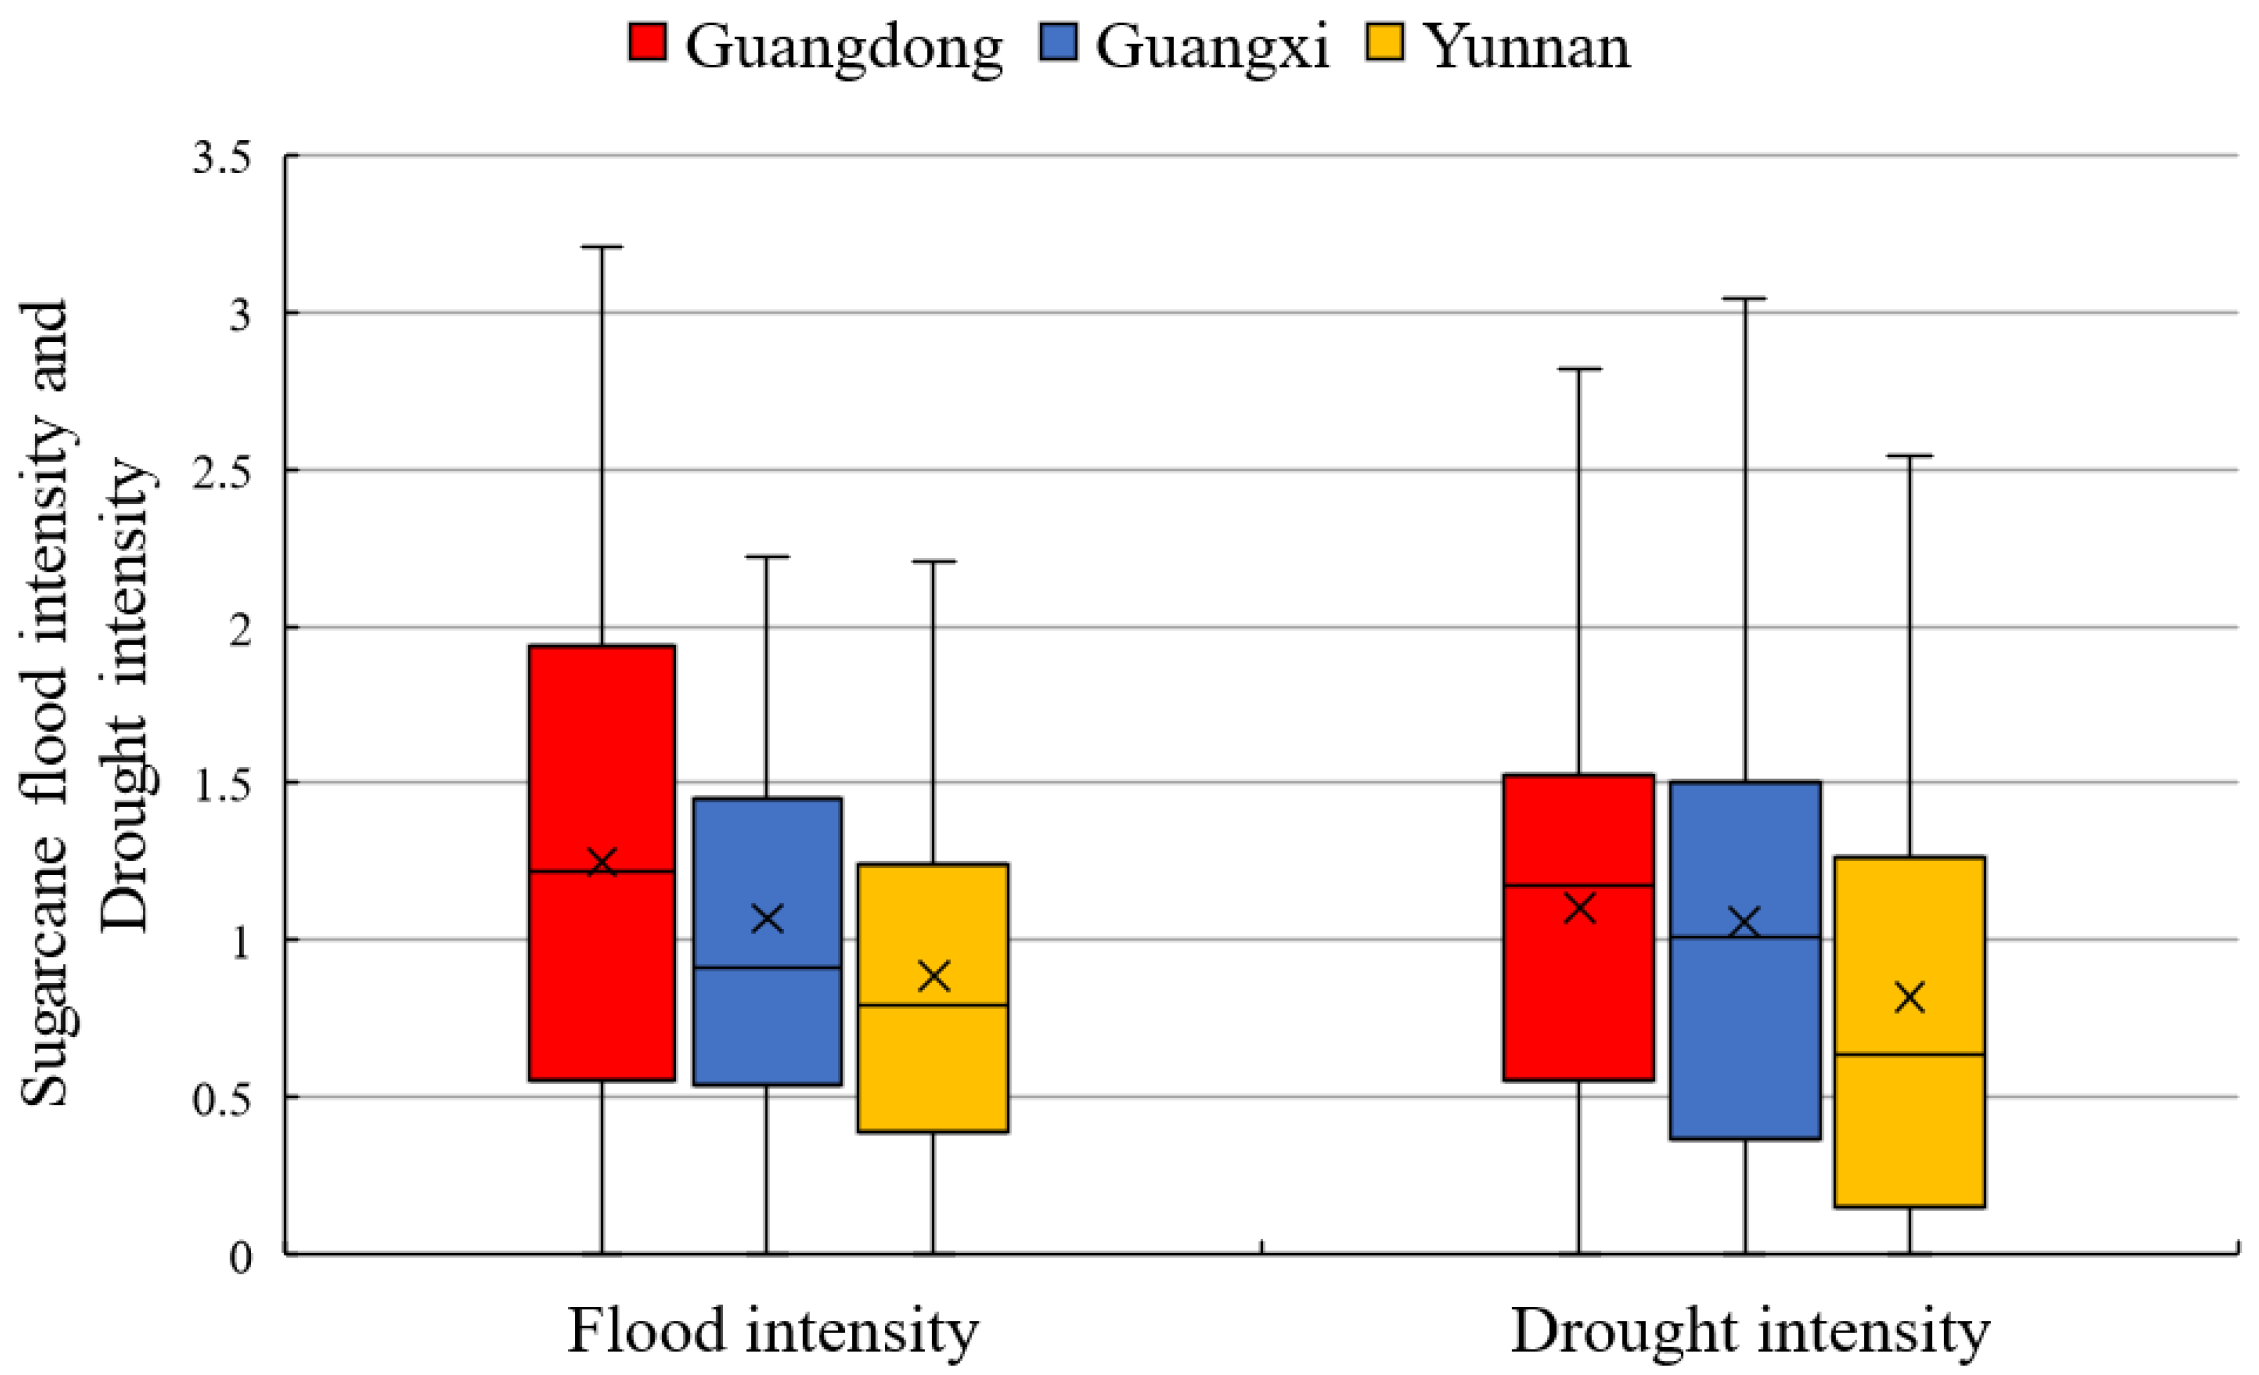
3.3. The Relationships between Sugarcane Climatic Yield and Agrometeorological Disaster Intensity

As shown in Figure 11a, for sugarcane drought, the relationships between drought intensity and sugarcane climatic yield were found to be significant in four districts (i.e., Meizhou and Dongguan in Guangdong, and Beihai and Laibin in Yunnan). Two of them (in Dongguan and Laibin) were negative and reached the significance of p < 0.01, indicating a yield-reducing effect of sugarcane drought. However, the remaining two significant results were positive (in Meizhou and Beihai), implying positive relationships between sugar drought intensity and climatic yield. In Guangxi and Yunnan, the number of negative correlations was more common than positive correlations; however, more positive results existed in Guangdong. Therefore, the effects of drought on sugarcane yield were not simply negative at the reginal scale. Differing from sugarcane drought, sugarcane flood intensity was majorly negatively related to sugarcane climatic yield in all the three provinces (Figure 11b). Moreover, there were three significant results (Huizhou, Puer, and Beihai; Beihai was significant at p < 0.01)—all of them negative—which demonstrated the obvious yield-reducing effect of sugarcane flood. For sugarcane HT (Figure 11c), the relationships of HT intensity vs. sugarcane climatic yield were generally weak, and no significant relationships were found.

4. Discussion

4.1. Spatial-Temporal Characteristics of Sugarcane Drought and Flood in SC

Drought and flood are widely distributed agrometeorological disasters with severe impacts on agricultural crops. Our results (Figure 4a) indicated that over the past five decades in SC, the only significant trend of sugarcane drought and flood was an upward trend in Yunnan. This result is consistent with a previous report [41], in which a noticeable drying trend was found in Yunnan over the past six decades. In addition, our results (Figure 7a) also pointed out that Yunnan was obviously the most drought-prone region in SC. Following Yunnan, western and central Guangxi were also at a relatively high risk of sugarcane drought. These spatial characteristics generally matched with a drought risk map constructed in a previous drought-relevant report in SC [42].
From the perspective of interdecadal difference, our results (Figure 5a) suggested that the 2000s witnessed more severe sugarcane drought than the other decades in SC. This finding is consistent with a previous study concerning agricultural drought in SC [43]; in that work, agricultural drought was found to be more intensive in the 2000s than in the other decades. Moreover, our results of sugarcane climatic yield (Figure 9b) showed that the 2000s was the only historic period during which all the provinces in SC suffered severe sugarcane yield losses (as demonstrated by low climatic yield), which can be explained by intensive flooding (Figure 5b) during this decade.
In terms of the sugarcane growth stages, the stem elongation stage was found to be the period during which sugarcane drought and flood were most intensive in a year. A similar finding was observed in another study on soil droughts in Guangxi [44]; that report indicated that soil droughts occurred frequently during autumn and winter seasons in Guangxi, which mainly corresponded to the stem elongation stage. However, when the influences of growth stage length were considered, the mature stage had the greatest probability of drought and flood occurrence per month; by contrast, the tillering stage had the minimum probability, which has been reported in a relevant study that focused on sugarcane drought in Guangxi [25].
Since drought and flood were quantified by the same standardized index (i.e., SPEI) in this paper, the SPEI-based drought intensity (SPEI < −0.5) and flood intensity (SPEI > 0.5) for sugarcane were comparable, and the results are displayed in Figure 12. Sugarcane flood intensity was found to be greater than drought intensity during the sugarcane growth stages in Guangdong and Yunnan. In a previous investigation on drought and flood disasters in Yunnan [45], it was concluded that flood frequency was slightly higher than drought frequency in Yunnan over the past 620 years. Furthermore, Guangdong was usually considered as having a very humid climate, but Zhang et al. [46] suggested that the impacts of drought disasters in Guangdong increased and became non-negligible.
Finally, it should be noted that in the present work, only the months during the sugarcane growth stages (from March to December) were considered in computing sugarcane drought and flood. However, as Wang and Yan [47] pointed out in an investigation concerning drought in SC, although drought events occurred throughout the entire year, January and February were among the most drought-prone months. Therefore, the difference in the calculation months may result in a few of our findings differing from previous investigations regarding drought and flood in SC.

4.2. Spatial-Temporal Characteristics of Sugarcane HT in SC

In addition to drought and flood, HT is also an extensively distributed agrometeorological disaster. Although sugarcane growth requires warm conditions, HT is regarded as a threat to sugarcane crop in future climates due to global warming [13]. As concluded by Zhang et al. [42], air temperatures in SC exhibited significant increasing trends, and annual air temperatures were expected to increase in the future (2020–2050). Correspondingly, in our results (Figure 4c), the intensity of sugarcane HT increased in all three provinces in SC; moreover, the increasing trend was highly significant (p < 0.01) in Yunnan and significant (p < 0.05) in Guangdong. We found that the increasing rate of HT intensity was greater in Yunnan than in Guangdong and Guangxi (Figure 4c). This finding was fairly consistent with a relevant study by Zu et al. [21]; they found that the temperature during the sugarcane growing seasons obviously increased during 1970–2014, and Yunnan exhibited the greatest increase. Moreover, this finding was also in accordance with previous literature concerning extreme weather in Yunnan [41], in which the extreme temperatures were found to increase over the past six decades. Finally, in our results (Figure 4c), Guangdong, following Yunnan, also witnessed a significant increase in sugarcane HT intensity; this finding was in line with a conclusion drawn by Yuan et al. [48]: all cities in Guangdong had significant warming trends during 1958–2016.

4.3. Relationships between Sugarcane Climatic Yield and Agrometeorological Disasters

To date, the relationships between the intensity of drought/flood/HT and the yields of various crops have been widely investigated. These relationships can be used to assess the impacts of agrometeorological disasters on crop yield fluctuation; for many crops, such as rice, cotton, corn, and wheat, the significant relationships of disaster intensity vs. yield fluctuation have been established in a wide range of reports [23,26,28,29,49,50]. To the best of our knowledge, such relations concerning sugarcane have not yet been investigated. Accordingly, in the present work, we examined the relationships between sugarcane climatic yield and the intensities of drought, flood, and HT in SC; however, no significant relationships were obtained at the provincial scale (Figure 11) and only a few districts had significant relationships of drought/flood intensity vs. sugarcane climatic yield. A probable reason is the relatively strong tolerance of sugarcane to waterlogging and drought stresses. For example, short-term waterlogging treatments can significantly reduce cotton and wheat yields [22,51]; however, in most waterlogging stress experiments using sugarcane, long-term waterlogging was performed, and some sugarcane clones can well adapt to short-term flooding [17]. Nevertheless, the present findings provide evidence for the regional yield-reducing effects of sugarcane drought and flood (i.e., significantly negative correlation analysis results in a few districts), as well as a reference for future investigations into the impacts of drought and flood on sugarcane yield. In addition, a previous study [52] took Guangxi as the study area and found that the impact on crops from drought disasters was weaker than that from flood disasters. Consistent with that conclusion, we found that sugarcane flood impacts were more obvious than drought impacts in terms of yield-reducing effects (Figure 11a,b).
The relationships between HT and sugarcane climatic were not significant in any district (Figure 11c). Considering that sugarcane is a tropical plant, we adopted 38 °C, rather than the commonly-used 30 °C or 35 °C for other crops [27,39], as the threshold temperature of sugarcane HT; however, these air temperatures are not common in SC, resulting in a low level of HDD. In fact, the significantly negative impacts of HT on sugarcane yield have been detected in Australia [5] and northeastern Brazil [6]. Even so, we detected a significant increase in HT intensity (Figure 5c). This is a vigilant finding because the increasing sugarcane HT threats in SC probably induce unpredictable consequences. Similar to our findings, an increasing trend of air temperatures has also been detected in the largest sugarcane-producing country, i.e., Brazil [6]. Hence, under the context of global warming, sugarcane-growing regions may be confronted with higher air temperatures and more heat waves.

4.4. Implications for Future Sugarcane Irrigation and Drainage in SC

Irrigation and drainage are basic means for reducing the impacts of agricultural drought and flood disasters. Figure 7a,b displays the high-prone regions of sugarcane drought and flood in SC; in these regions, including the whole Yunnan and western Guangxi, timely irrigation is required to prevent sugarcane crops from drought stress. In comparison, sugarcane flood was concentrated in eastern Guangdong, where timely field drainage is important for eliminating sugarcane waterlogging stress. More importantly, according to our district-level results on the relationships between the intensities of drought/flood and sugarcane climatic yield (Figure 11), five districts (including Dongguan and Meizhou in Guangdong, Beihai and Laibin in Guangxi, and Puer in Yunnan) deserve special attention to be paid to irrigation and drainage for sugarcane, because sugarcane yield in these places was significantly and negatively affected by flood/drought over the past few decades. Furthermore, the impacts of sugarcane drought and flood were different. As discussed above, the yield-reducing effects of sugarcane flood were stronger than sugarcane drought (Figure 11). More importantly, in terms of near-term disaster characteristics, the interdecadal analysis results (Figure 5b) showed that sugarcane flood intensity in SC reached a historic high in the most recent decade. Therefore, high-efficient drainage in sugarcane fields is of great importance for improving sugarcane yield in SC; additionally, differing from sugarcane flood, sugarcane drought seems to be efficiently relieved by irrigation.
Although HT has no direct associations with irrigation and drainage, it can affect the consequences of sugarcane drought and flood. According to recent reports, the coupling of drought and HT, or of flood and HT, can result in more impacts on crop yields [27,39]. Hence, the occurrence of sugarcane HT will have indirect influences on sugarcane irrigation and drainage when HT becomes more intensive. Our results (Figure 4c) demonstrated that sugarcane HT intensity in SC has increased significantly over the past decades; increasing HT provides breeding grounds for the coupling events of drought/flood and HT. Similarly, Xu et al. [39] deduced that future sugarcane HT would be more severe and threaten sugarcane production in China. In conclusion, when making irrigation and drainage schedules for sugarcane in SC, we should be cautious with the increasing influences from HT.

4.5. Future Perspective and Research Limitations

The effect of climate change on sugarcane production in future climates is a complex and important issue. On the positive side, it is expected that due to increased air temperature and CO2 concentration, sugarcane yield may increase in future scenarios [3]. However, on the negative side, the most challenging problems arising from the increasing risk of extreme meteorological disasters [2] can dramatically restrict sugarcane yield. For SC, many studies have consistently demonstrated that the air temperatures and heat waves in SC will increase in the coming decades [21,41,53]. Although elevated air temperatures may benefit sugarcane growth, according to previous investigations in Brazil and Australia, sugarcane yield can be obviously reduced by HT [5,6]. Hence, HT disasters in SC will probably become more harmful and nonnegligible. In addition, being consistent with HT, drought intensity in SC is also likely to increase in the future [41]. Considering that water deficit stress can indubitably affect sugarcane yield, we should pay special attention to sugarcane drought disaster reduction in SC.
The present work attempted to make contributions to agrometeorological disaster assessment, but it also faces some limitations which are expected to be overcome in future work. First, the division of sugarcane growth stages in this study was spatially and temporally coarse. It is considered that the phenology stages of crops likely have strong variations on small geographic scales (e.g., districts). Hence, to obtain more reasonable disaster intensities, it is crucial to include more detailed and precise databases for the crop phenology stage in different districts; phenology simulation models may provide efficient support. In addition, it is crude to determine growth stages on a monthly scale, which renders the drought and flood results insufficiently specific for sugarcane crops. Therefore, in future investigations, more specific timings of growth stages are expected to be included; accordingly, daily scale indices are preferable to monthly scale indices, such as SPEI. Another limitation of this work lies in computing the special results of disaster intensities. We employed a traditional method to obtain spatial results, i.e., calculating SPEI based on station-specific weather data and then performing spatial interpolation. However, the results of this approach can be affected by some factors, such as the distribution of weather stations and the employed interpolation method. In comparison, if high-quality data in uniform grid cells are available, one can simply attach them to the targeted areas and obtains more accurate and stable spatial results.

5. Conclusions

SC is the dominating sugarcane-producing region in China, also playing an important role in global sugarcane industry. However, sugarcane crops in SC are severely affected by agrometeorological disasters, mainly including drought, flood, and HT. This work employed commonly used meteorological indices, i.e., SPEI and HDD, to characterize drought, flood, and HT during sugarcane growth stages in SC over the past five decades. Moreover, relationships between sugarcane climatic yield and disaster intensities were also examined. The main results are as following:
(1) During 1970–2020, the most recent decade witnessed the most severe agrometeorological disasters during sugarcane growth stages in SC. Sugarcane drought intensity significantly increased in Yunnan; in addition, sugarcane HT exhibited increasing trends in all three provinces, and the trends in Yunnan and Guangdong were significant (p < 0.05). In addition, in terms of the comparison between sugarcane drought and flood, flood intensity was considered slightly greater than drought intensity in Yunnan and Guangdong.
(2) In terms of the monthly intensity of sugarcane drought and flood disasters (i.e., disaster occurrence probability per month), the mature stage was more affected than the other growth stages. Additionally, the stem elongation was the most HT-prone period in Guangdong and Guangxi. However, for Yunnan, the seedling stage was the period most affected by sugarcane HT.
(3) The most drought-prone and flood-prone regions for sugarcane were western SC (i.e., Yunnan and western Guangxi) and eastern SC (i.e., eastern Guangdong), respectively. In addition, the high-prone regions of sugarcane HT were concentrated in southern Yunnan.
(4) Sugarcane yield in northwestern SC (i.e., northern Yunnan) and eastern SC (i.e., eastern Guangdong) was most affected by agrometeorological disasters, resulting in a lower climatic yield than other regions during different decades.
(5) The relationships between flood intensity and sugarcane climatic yield were majorly negative, and significant relationships were found in three districts, which demonstrates the yield-reducing effect of sugarcane flood. In comparison, sugarcane drought intensity had significant relations to climatic yield in four districts, but two of them were positive. In summary, for sugarcane in SC, the yield-reducing effect of flood was more obvious than drought. No significant effect of sugarcane HT on sugarcane climatic yield was detected.

Author Contributions

Conceptualization, L.Q.; methodology, L.Q. and P.Y.; software, P.Y. and Z.W.; validation, P.Y. and H.M.; formal analysis, P.Y.; investigation, P.Y., Z.W. and H.M.; resources, L.Q. and X.J.; data curation, L.Q.; writing—original draft preparation, P.Y. and L.Q. (equal contributions to draft preparation); writing—review and editing, L.Q. and X.J.; visualization, P.Y. and H.M.; supervision, L.Q.; project administration, L.Q.; funding acquisition, L.Q. All authors have read and agreed to the published version of the manuscript.

Funding

This research was funded by the National Natural Science Foundation of China, grant number 51909286; the Fundamental Research Funds for the Central Universities, grant number 2021qntd15. The APC was funded by the National Natural Science Foundation of China, grant number 51909286.

Data Availability Statement

Not applicable.

Conflicts of Interest

The authors declare no conflict of interest. The funders had no role in the design of the study; in the collection, analyses, or interpretation of data; in the writing of the manuscript; or in the decision to publish the results.

References

  1. Linnenluecke, M.K.; Nucifora, N.; Thompson, N. Implications of climate change for the sugarcane industry. WIREs Clim. Chang. 2018, 9, e498. [Google Scholar] [CrossRef]
  2. Zhao, D.; Li, Y.R. Climate change and sugarcane production: Potential impact and mitigation strategies. Int. J. Agon. 2015, 2015, 547386. [Google Scholar] [CrossRef] [Green Version]
  3. Santos, D.L.; Sentelhas, P.C. Climate change scenarios and their impact on water Balance and Sugarcane Yield in Southern Brazil. Sugar Tech 2014, 16, 356–365. [Google Scholar] [CrossRef]
  4. Gouvêa, J.R.F.; Sentelhas, P.C.; Gazzola, S.T.; Santos, M.C. Climate changes and technological advances: Impacts on sugarcane productivity in tropical southern Braizl. Sci. Agric. 2009, 66, 593–605. [Google Scholar] [CrossRef] [Green Version]
  5. Linnenluecke, M.K.; Zhou, C.; Smith, T.; Thompson, N.; Nucifora, N. The impact of climate change on the Australian sugarcane industry. J. Clean. Prod. 2020, 246, 118974. [Google Scholar] [CrossRef]
  6. Carvalho, A.L.; Menezes, R.S.C.; Nobrega, R.S.; Pinto, A.S.; Ometto, J.P.H.; Randow, C.; Giarolla, A. Impact of climate changes on potential sugarcane yield in Pernambuco, northeastern region of Brazil. Renew. Energy 2015, 78, 26–34. [Google Scholar] [CrossRef]
  7. Dias, H.B.; Sentelhas, P.C. Sugarcane yield gap analysis in Brazil—A multi-model approach for determining magnitudes and causes. Sci. Total Environ. 2018, 637–638, 1127–1136. [Google Scholar] [CrossRef]
  8. Kumar, D.; Malik, N.; Sengar, R.S. Physio-biochemical insights into sugarcane genotypes under water stress. Biol. Rhythm Res. 2021, 52, 92–115. [Google Scholar] [CrossRef]
  9. Berning, C.; Viljoen, M.; Du Plessis, L. Loss functions for sugar-cane: Depth and duration of inundation as determinants of extent of flood damage. Water SA 2000, 26, 527–530. [Google Scholar] [CrossRef] [Green Version]
  10. Misra, V.; Solomon, S.; Mall, A.K.; Prajapati, C.P.; Hashem, A.; Abd_Allah, E.F.; Ansari, M.I. Morphological assessment of water stressed sugarcane: A comparison of waterlogged and drought affected crop. Saudi J. Biol. Sci. 2020, 27, 1228–1236. [Google Scholar] [CrossRef]
  11. Bamrungrai, J.; Tubana, B.; Tre-loges, V.; Promkhambut, A.; Polthanee, A. Effects of water stress and auxin application on growth and yield of two sugarcane cultivars under greenhouse conditions. Agriculture 2021, 11, 613. [Google Scholar] [CrossRef]
  12. Jaiphong, T.; Tominaga, J.; Watanabe, K.; Nakabaru, M.; Takaragawa, H.; Suwa, R.; Ueno, M.; Kawamitsu, Y. Effects of duration and combination of drought and flood conditions on leaf photosynthesis, growth and sugar content in sugarcane. Plant Prod. Sci. 2016, 19, 427–437. [Google Scholar] [CrossRef]
  13. Castro-Nava, S.; Lopez-Rubio, E. Thermotolerance and physiological traits as fast tools to heat tolerance selection in experimental sugarcane genotypes. Agriculture 2019, 9, 251. [Google Scholar] [CrossRef] [Green Version]
  14. Moreira, B.R.D.; Viana, R.D.; de Figueiredo, P.A.M.; Lisboa, L.A.M.; Miasaki, C.T.; Magahaes, A.C.; Ramos, S.B.; Almeida Viana, C.R.D.; Trindade, V.D.R.; May, A. Glyphosate plus carboxylic compounds boost activity of free radical-scavenging enzymes in sugarcane. Agriculture 2020, 10, 106. [Google Scholar] [CrossRef] [Green Version]
  15. Li, Y.R.; Yang, L.T. Sugarcane agriculture and sugar industry in China. Sugar Tech 2015, 17, 1–8. [Google Scholar] [CrossRef]
  16. Ferreira, T.H.S.; Tsunada, M.S.; Bassi, D.; Araújo, P.; Mattiello, L.; Guidelli, G.V.; Righetto, G.L.; Gonçalves, V.R.; Lakshmanan, P.; Menossi, M. Sugarcane water stress tolerance mechanisms and its implications on developing biotechnology solutions. Front. Plant Sci. 2017, 8, 1077. [Google Scholar] [CrossRef] [Green Version]
  17. Gomathi, R.; Gururaja Rao, P.N.; Chandran, K.; Selvi, A. Adaptive responses of sugarcane to waterlogging stress: An over view. Sugar Tech 2015, 17, 325–338. [Google Scholar] [CrossRef]
  18. Nawae, W.; Shearman, J.R.; Tangphatsornruang, S.; Punpee, P.; Yoocha, T.; Sangsrakru, D.; Naktang, C.; Sonthirod, C.; Wirojsirasak, W.; Ukoskit, K.; et al. Differential expression between drought-tolerant and drought-sensitive sugarcane under mild and moderate water stress as revealed by a comparative analysis of leaf transcriptome. PeerJ 2020, 8, e9608. [Google Scholar] [CrossRef]
  19. Xu, C.H.; Li, C.J.; Su, H.S.; Lu, X.; Li, X.J.; Liu, H.B.; Lin, X.Q.; Mao, Y.; Zi, Y.Q.; Liu, X.L. Process in the studies on abiotic stress resistance of sugarcane (Saccharum spp.). J. Plant Genet. Resour. 2017, 18, 483–493. [Google Scholar] [CrossRef]
  20. Ebrahim, M.K.; Zingsheim, O.; EI-Shourbagy, M.N.; Moor, P.H.; Komor, E. Growth and sugar storage in sugarcane grown at temperatures below and above optimum. J. Plant Physiol. 1998, 153, 593–602. [Google Scholar] [CrossRef]
  21. Zu, Q.; Mi, C.R.; Liu, D.L.; He, L.; Kuang, Z.M.; Fang, Q.X.; Ramp, D.; Li, L.; Wang, B.; Chen, Y.L.; et al. Spatio-temporal distribution of sugarcane potential yields and yield gaps in Southern China. Eur. J. Agron. 2018, 92, 72–83. [Google Scholar] [CrossRef]
  22. Qian, L.; Chen, X.H.; Gao, Y.W.; Deng, K.N.; Wang, X.G.; Zeng, W.Z.; Luo, Y.Y. Quantifying the impacts of waterlogging on cotton at different growth stages: A case study in Hubei Province, China. Agron. J. 2021, 113, 1831–1851. [Google Scholar] [CrossRef]
  23. Tian, L.Y.; Yuan, S.S.; Quiring, S.M. Evaluation of six indices for monitoring agricultural drought in the southcentral United States. Agric. For. Meteorol. 2018, 249, 107–119. [Google Scholar] [CrossRef]
  24. Raja, R.; Nayak, A.K.; Panda, B.B.; Lal, B.; Tripathi, R.; Shahid, M.; Kumar, A.; Mohanty, S.; Samal, P.; Gautam, P.; et al. Monitoring of meteorological drought and its impact on rice (Oryza sativa L.) productivity in Odisha using standardized precipitation index. Arch. Agron. Soil Sci. 2014, 60, 1701–1715. [Google Scholar] [CrossRef]
  25. Chen, Y.L.; Meng, L.L.; Huang, X.H.; Mo, J.F.; Feng, L.P. Spatial and temporal evolution characteristics of drought in Guangxi during sugarcane growth period based on SPEI. Trans. Chin. Soc. Agric. Eng. 2019, 35, 149–158. [Google Scholar] [CrossRef]
  26. Gao, C.; Yin, Z.X.; Xu, Y. Space-time characteristics of drought and flood in main growing periods of winter wheat in Huaihe River Basin and its impact on yield. Trans. Chin. Soc. Agric. Eng. 2017, 33, 101–111. [Google Scholar] [CrossRef]
  27. Zhu, X.F.; Liu, T.T.; Xu, K.; Chen, C.X. The impacts of high temperature and drought stress on the yield of major staple crops in northern China. J. Environ. Manag. 2022, 314, 115092. [Google Scholar] [CrossRef]
  28. Sun, X.S.; Long, Z.W.; Song, G.S.; Chen, C.Q. High-temperature episodes with spatial-temporal variation impacted middle-season rice yield in China. Agron. J. 2018, 110, 961–969. [Google Scholar] [CrossRef]
  29. Liu, B.; Liu, L.L.; Tian, L.Y.; Cao, W.X.; Zhu, Y.; Asseng, S. Post-heading heat stress and yield impact in winter wheat of China. Glob. Chang. Biol. 2014, 20, 372–381. [Google Scholar] [CrossRef]
  30. Lobell, D.B.; Hammer, G.L.; McLean, G.; Messina, C.; Roberts, M.J.; Schlenker, W. The critical role of extreme heat for maize production in the United States. Nat. Clim. Chang. 2013, 3, 497–501. [Google Scholar] [CrossRef]
  31. Li, Y.R.; Song, X.P.; Wu, J.M.; Li, C.N.; Liang, Q.; Liu, X.H.; Wang, W.Z.; Tan, H.W.; Yang, L.T. Sugar Industry and Improved Sugarcane Farming Technologies in China. Sugar Tech 2016, 18, 603–611. [Google Scholar] [CrossRef]
  32. Zhong, C.; Zhou, C.; Xu, M.Y. Forecasting growth and development stage of sugarcane based on physiological development time. Sugar Crops China 2012, 2, 49–51. [Google Scholar]
  33. Sun, S.; Liu, L.L.; Hu, Z.W.; Yu, X. Inversion method of sugarcane plant height based on sentinel 1A dual-polarization time series data. Trans. Chin. Soc. Agric. Mach. 2022, 53, 186–194. [Google Scholar] [CrossRef]
  34. Vicente-Serrano, S.M.; Beguería, S.; López-Moreno, J.I. A multiscalar drought index sensitive to global warming: The standardized precipitation evapotranspiration index. J. Clim. 2010, 23, 1696–1718. [Google Scholar] [CrossRef] [Green Version]
  35. Yao, N.; Li, Y.; Liu, Q.Z.; Zhang, S.Y.; Chen, X.G.; Ji, Y.D.; Liu, F.G.; Pulatov, A.; Feng, P.Y. Response of wheat and maize growth-yields to meteorological and agricultural droughts based on standardized precipitation evapotranspiration indexes and soil moisture deficit indexe. Agric. Water Manag. 2022, 266, 107566. [Google Scholar] [CrossRef]
  36. Geng, G.P.; Yang, R.; Liu, L.Z. Downscaled solar-induced chlorophyll fluorescence has great potential for monitoring the response of vegetation to drought in the Yellow River Basin, China: Insights from an extreme event. Ecol. Indic. 2022, 138, 108801. [Google Scholar] [CrossRef]
  37. Meng, H.Y.; Wang, Z.L.; Yao, P.; Qian, L.; Chen, C.; Luo, Y.Y.; Ju, X.L. Comparative study of different meteorological yield separation methods in waterlogging disaster assessment. Chin. J. Eco-Agric. 2022, 30, 976–989. [Google Scholar] [CrossRef]
  38. Shaw, R.E.; Meyer, W.S. Improved empirical representation of plant responses to waterlogging for simulating crop yield. Agron. J. 2015, 107, 1711–1723. [Google Scholar] [CrossRef]
  39. Qian, L.; Wang, X.G.; Luo, Y.Y.; Sun, H.W.; Luo, W.B. Responses of cotton at different growth stages to aeration stress under the influence of high temperature. Crop Sci. 2018, 58, 342–353. [Google Scholar] [CrossRef]
  40. Selvarajan, D.; Mohan, C.; Dhandapan, V.; Nerkar, G.; Jayanarayanan, A.; Mohanan, M.V.; Murugan, N.; Kaur, L.; Chennappa, M.; Kumar, P.; et al. Differential gene expression profiling through transcriptome approach of Saccharum spontaneum L. under low temperature stress reveals genes potentially involved in cold acclimation. 3 Biotech 2018, 8, 195. [Google Scholar] [CrossRef]
  41. Yan, W.B.; He, Y.L.; Cai, Y.; Cui, X.L.; Qu, X.X. Analysis of spatiotemporal variability in extreme climate and potential driving factors on the Yunnan Plateau (Southwest China) during 1960–2019. Atmosphere 2021, 12, 1136. [Google Scholar] [CrossRef]
  42. Zhang, Q.; Yao, Y.B.; Wang, Y.; Wang, S.P.; Wang, J.S.; Yang, J.H.; Wang, J.; Li, Y.P.; Shang, J.L.; Li, W.J. Characteristics of drought in Southern China under climatic warming, the risk, and countermeasures for prevention and control. Theor. Appl. Climatol. 2019, 136, 1157–1173. [Google Scholar] [CrossRef]
  43. Wei, S.G.; Zhang, R.Q.; Li, L.; Zhang, S.L.; Zhang, Y.; Huang, F.N.; Li, J.D.; Liu, W. Assessment of agricultural drought based on reanalysis soil moisture in southern China. Land 2022, 11, 502. [Google Scholar] [CrossRef]
  44. Wu, W.X.; Li, R.H.; Shao, J.H. Assessment of regional spatiotemporal variations in drought from the perspective of soil moisture in Guangxi, China. Water 2022, 14, 289. [Google Scholar] [CrossRef]
  45. Niu, J.; Wang, L.M.; Yang, K.W.; Liu, S.Z.; Yin, J.Q.; Liang, Q.L.; Zhang, W.X. Spatial–temporal characteristics of drought and flood disasters in Yunnan Province on the margin of the Tibetan Plateau over the past 620 years. Int. J. Climatol. 2022, 42, 1388–1398. [Google Scholar] [CrossRef]
  46. Zhang, Q.; Zhang, W.; Chen, Y.D.; Jiang, T. Flood, drought and typhoon disasters during the last half-century in the Guangdong province, China. Nat. Hazards 2011, 57, 267–278. [Google Scholar] [CrossRef]
  47. Wang, Y.J.; Yan, F. Spatial and temporal variations of regional drought events in southern China. Meteorol. Appl. 2017, 24, 481–490. [Google Scholar] [CrossRef] [Green Version]
  48. Yuan, Z.J.; Liang, C.; Li, D.Q. Urban stormwater management based on an analysis of climate change: A case study of the Hebei and Guangdong provinces. Landsc. Urban Plan. 2018, 177, 217–226. [Google Scholar] [CrossRef]
  49. Chen, Y.Y.; Huang, J.F.; Song, X.D.; Gao, P.; Wan, S.Q.; Shi, L.; Wang, X.Z. Spatiotemporal characteristics of winter wheat waterlogging in the Middle and Lower Reaches of the Yangtze River, China. Adv. Meteorol. 2018, 2018, 3542103. [Google Scholar] [CrossRef] [Green Version]
  50. Zhang, Y.; Deng, K.N.; Gao, Y.W.; Qian, L.; Chen, C.; Huang, T.X. Using accumulative humidity index to estimate drought and flooding hazards in cotton growth season in Hubei Province. J. Irrig. Drain. 2021, 40, 57–65. [Google Scholar] [CrossRef]
  51. Malik, A.I.; Colmer, T.D.; Lambers, H.; Setter, T.L.; Schortemeyer, M. Short-term waterlogging has long-term effects on the growth and physiology of wheat. New Phytol. 2002, 153, 225–236. [Google Scholar] [CrossRef]
  52. Qin, N.X.; Wang, J.N.; Gao, L.; Hong, Y.; Huang, J.L.; Liu, Q.Q. Observed trends of different rainfall intensities and the associated spatiotemporal variations during 1958–2016 in Guangxi, China. Int. J. Climatol. 2021, 41, 2880–2895. [Google Scholar] [CrossRef]
  53. Luo, M.; Lau, N.C. Heat waves in Southern China: Synoptic behavior, long-term change, and urbanization effects. J. Clim. 2017, 30, 703–720. [Google Scholar] [CrossRef]
Figure 1. Basic information on Chinese sugarcane production over the last decade. (a,b) refer to sugarcane yield (10 kt) and planting areas (1000 ha), respectively.
Agriculture 12 02117 g001
Figure 2. Description of the study region. The colored area on the left-side subgraph indicates southern China, including Yunnan, Guangxi, and Guangdong provinces. The points on the right-side subgraph indicate the national level meteorological stations that were employed in this work.
Agriculture 12 02117 g002
Figure 3. Methodological diagram.
Agriculture 12 02117 g003
Figure 4. Temporal trends of drought (a), flood (b), and high temperatures (c) during sugarcane growth stages in Guangdong, Guangxi, and Yunnan provinces. The calculation sample size of every regression model is 51 (from 1971 to 2020). * and *** indicate p < 0.05 and p < 0.001. The regression model in Guangxi is significant at p < 0.10.
Agriculture 12 02117 g004aAgriculture 12 02117 g004b
Figure 5. The intensities of drought (a), flood (b), and high temperature (c) during sugarcane growth stages in Guangdong, Guangxi, and Yunnan provinces. × and — in the boxes represent the mean and median values, respectively.
Agriculture 12 02117 g005
Figure 6. Spatial distribution of the monthly intensities of drought (a1a4), flood (b1b4), and high temperatures (c1c4) during the seedling (a1,b1,c1), tillering (a2,b2,c2), stem elongation (a3,b3,c3), and mature stages (a4,b4,c4) of sugarcane in southern China. The intensities were averaged over 1970–2020 and displayed here for spatial analysis.
Agriculture 12 02117 g006
Figure 7. Spatial distribution of the monthly intensities of drought (a), flood (b), and high temperatures (c) during the entire sugarcane growing season in southern China. The intensities were averaged over 1970–2020 and displayed here for spatial analysis.
Agriculture 12 02117 g007
Figure 8. The monthly intensities of drought (a), flood (b), and HT (c) during different sugarcane growth stages in southern China. × and — in the boxes represent the mean and median values, respectively.
Agriculture 12 02117 g008
Figure 9. The actual yield (a) and climatic yield (b) of sugarcane in Guangdong, Guangxi, and Yunnan provinces. *** indicates p < 0.001.
Agriculture 12 02117 g009
Figure 10. Sugarcane climatic yield (kg/hg/year) during 1990s (a), 2000s (b), 2010s (c), and 2000s–2010s (d), as well as actual sugarcane yield during 2000s–2010s (e) in southern China. Negative values of sugarcane climatic yield were used here to describe sugarcane yield losses. Guangxi has no yield data in the 1990s, so only Yunnan and Guangdong were included in Figure 10a.
Agriculture 12 02117 g010
Figure 11. Correlation coefficients between sugarcane climatic yield and the intensities of drought (a), flood (b), and HT (c) in southern China. The black dotted boxes indicate p < 0.05. * and ** indicate p < 0.05 and p < 0.01, respectively.
Agriculture 12 02117 g011
Figure 12. The intensities of drought and flood during sugarcane growth stages in SC from 1970 to 2020. × and — in the boxes represent the mean and median values, respectively.
Agriculture 12 02117 g012
Publisher’s Note: MDPI stays neutral with regard to jurisdictional claims in published maps and institutional affiliations.

