

Assessing the Representativeness of Irrigation Adoption Studies: A Meta-Study of Global Research

Abstract
:1. Introduction
1.1. Why Irrigation?
1.2. Technology Adoption and Related Theories
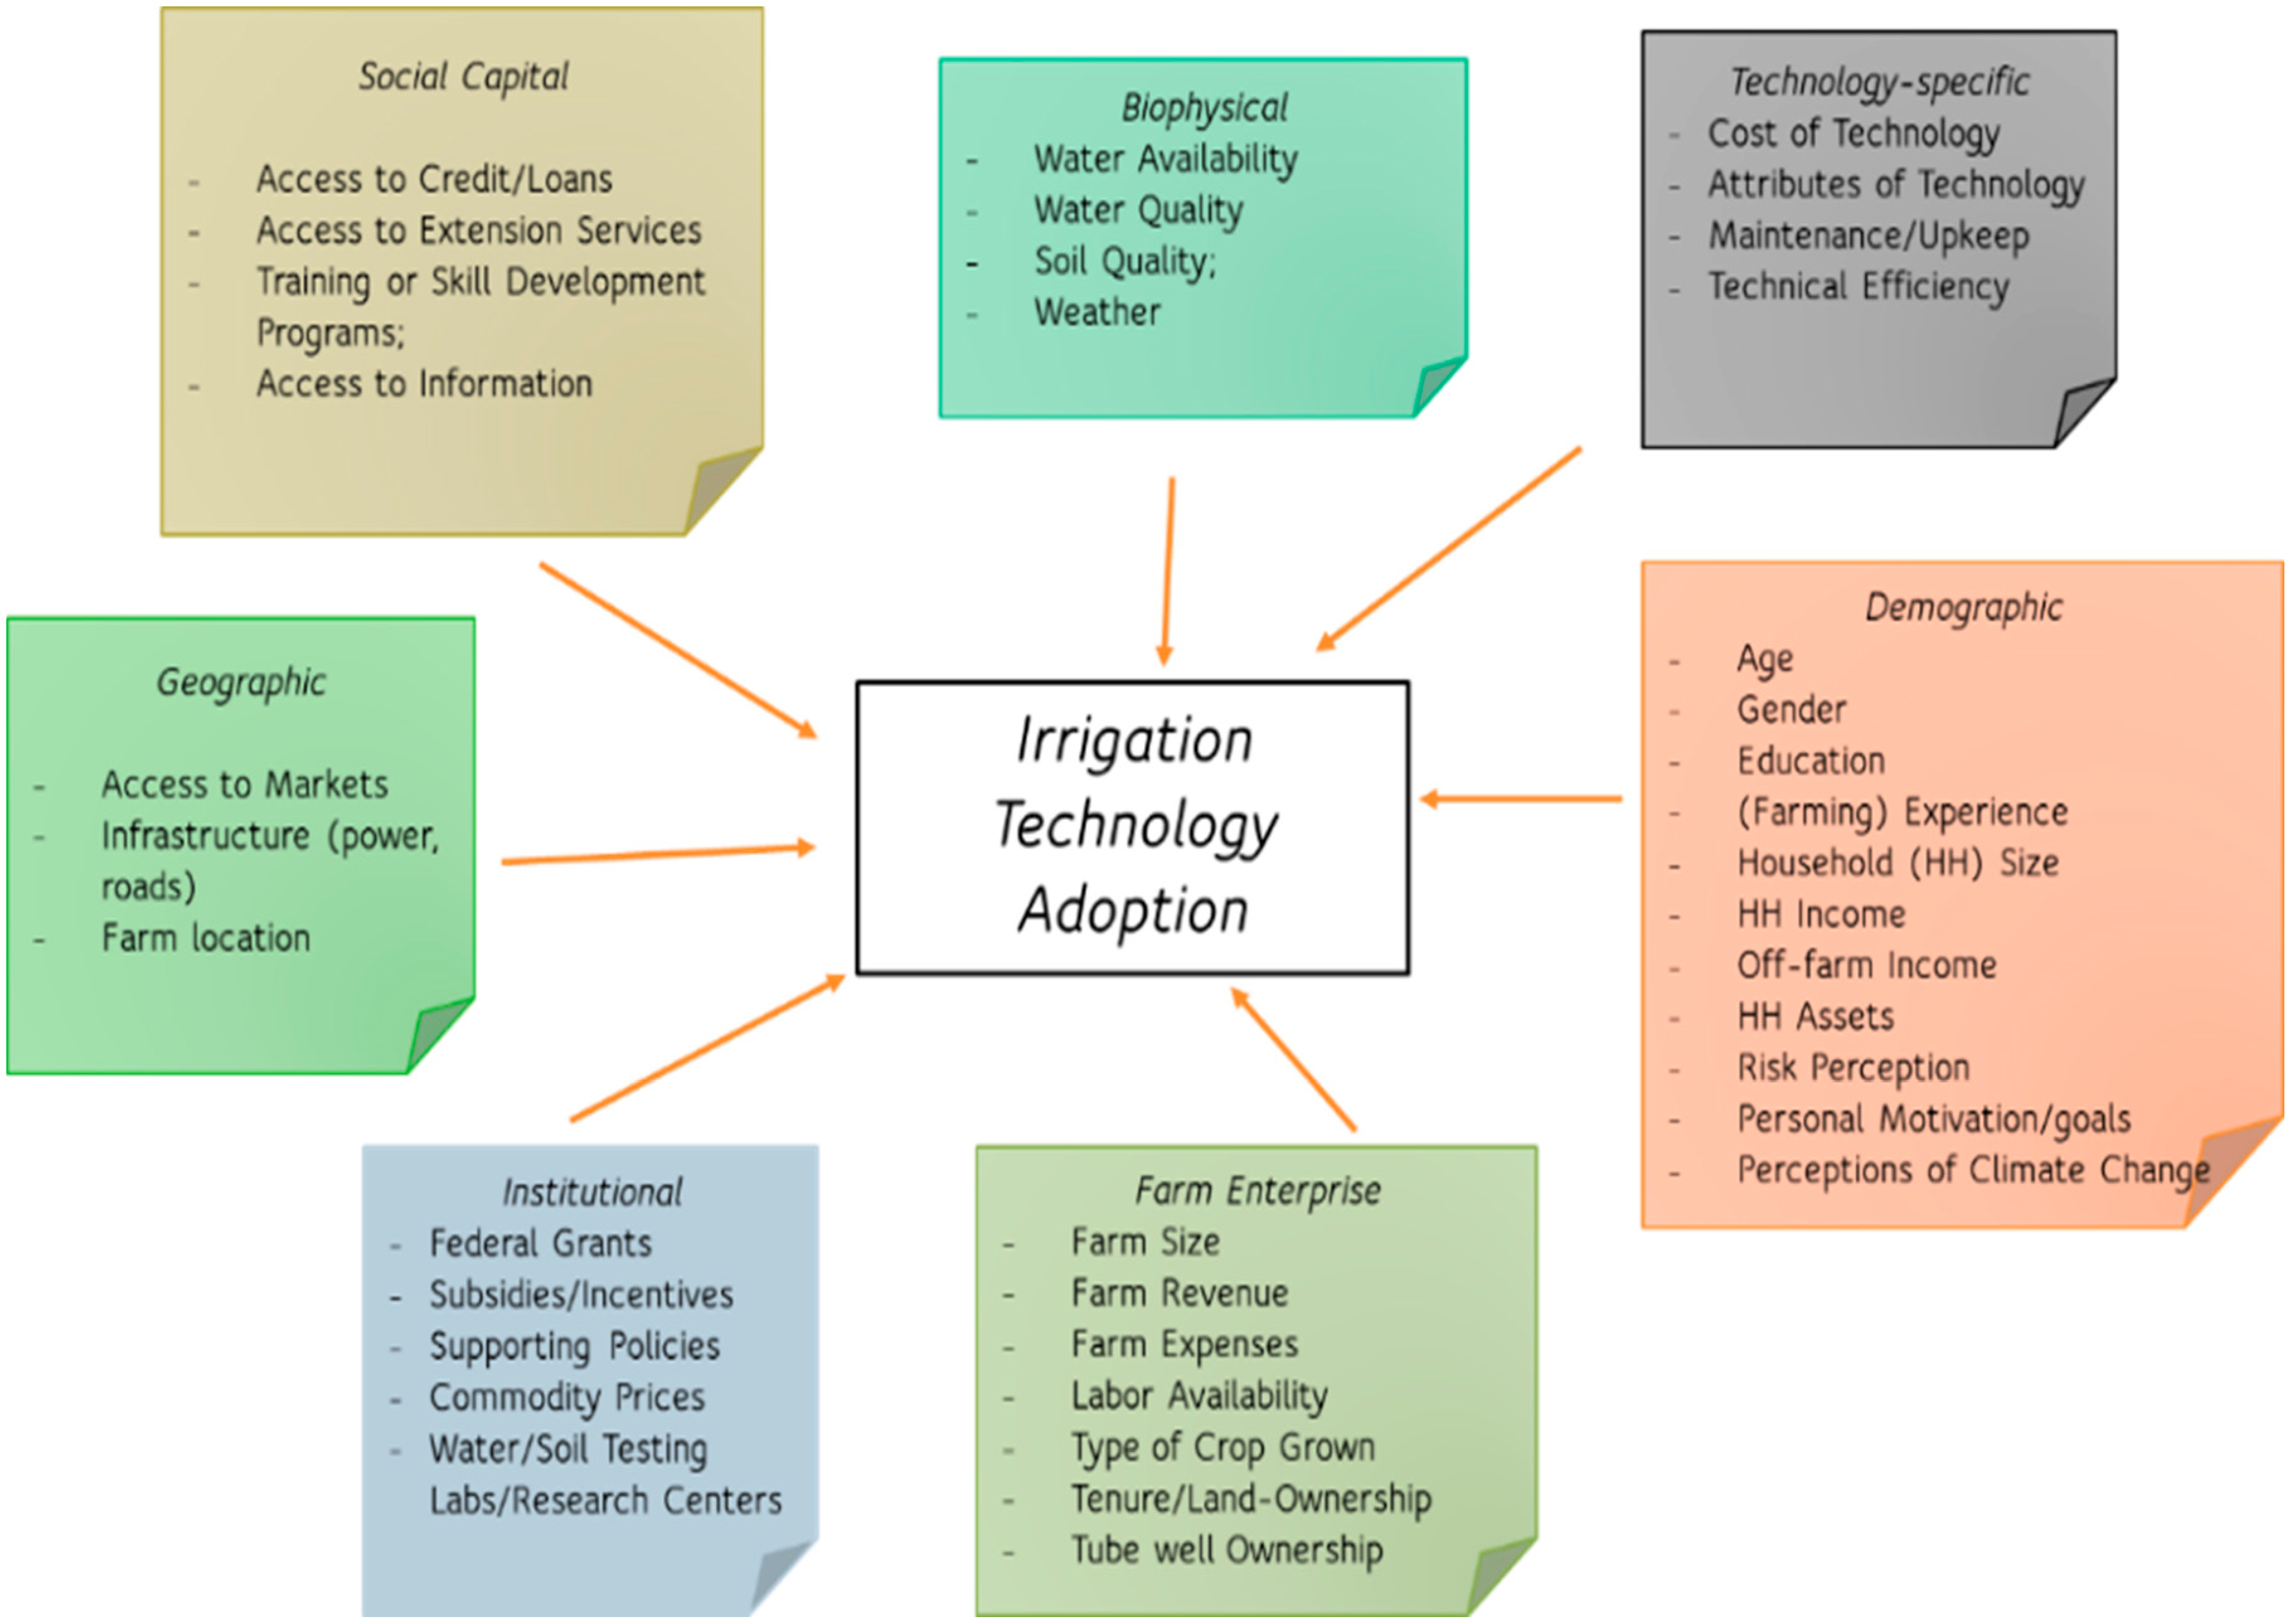
1.3. Factors Affecting Irrigation Adoption
2. Materials and Methods
2.1. Data Collection
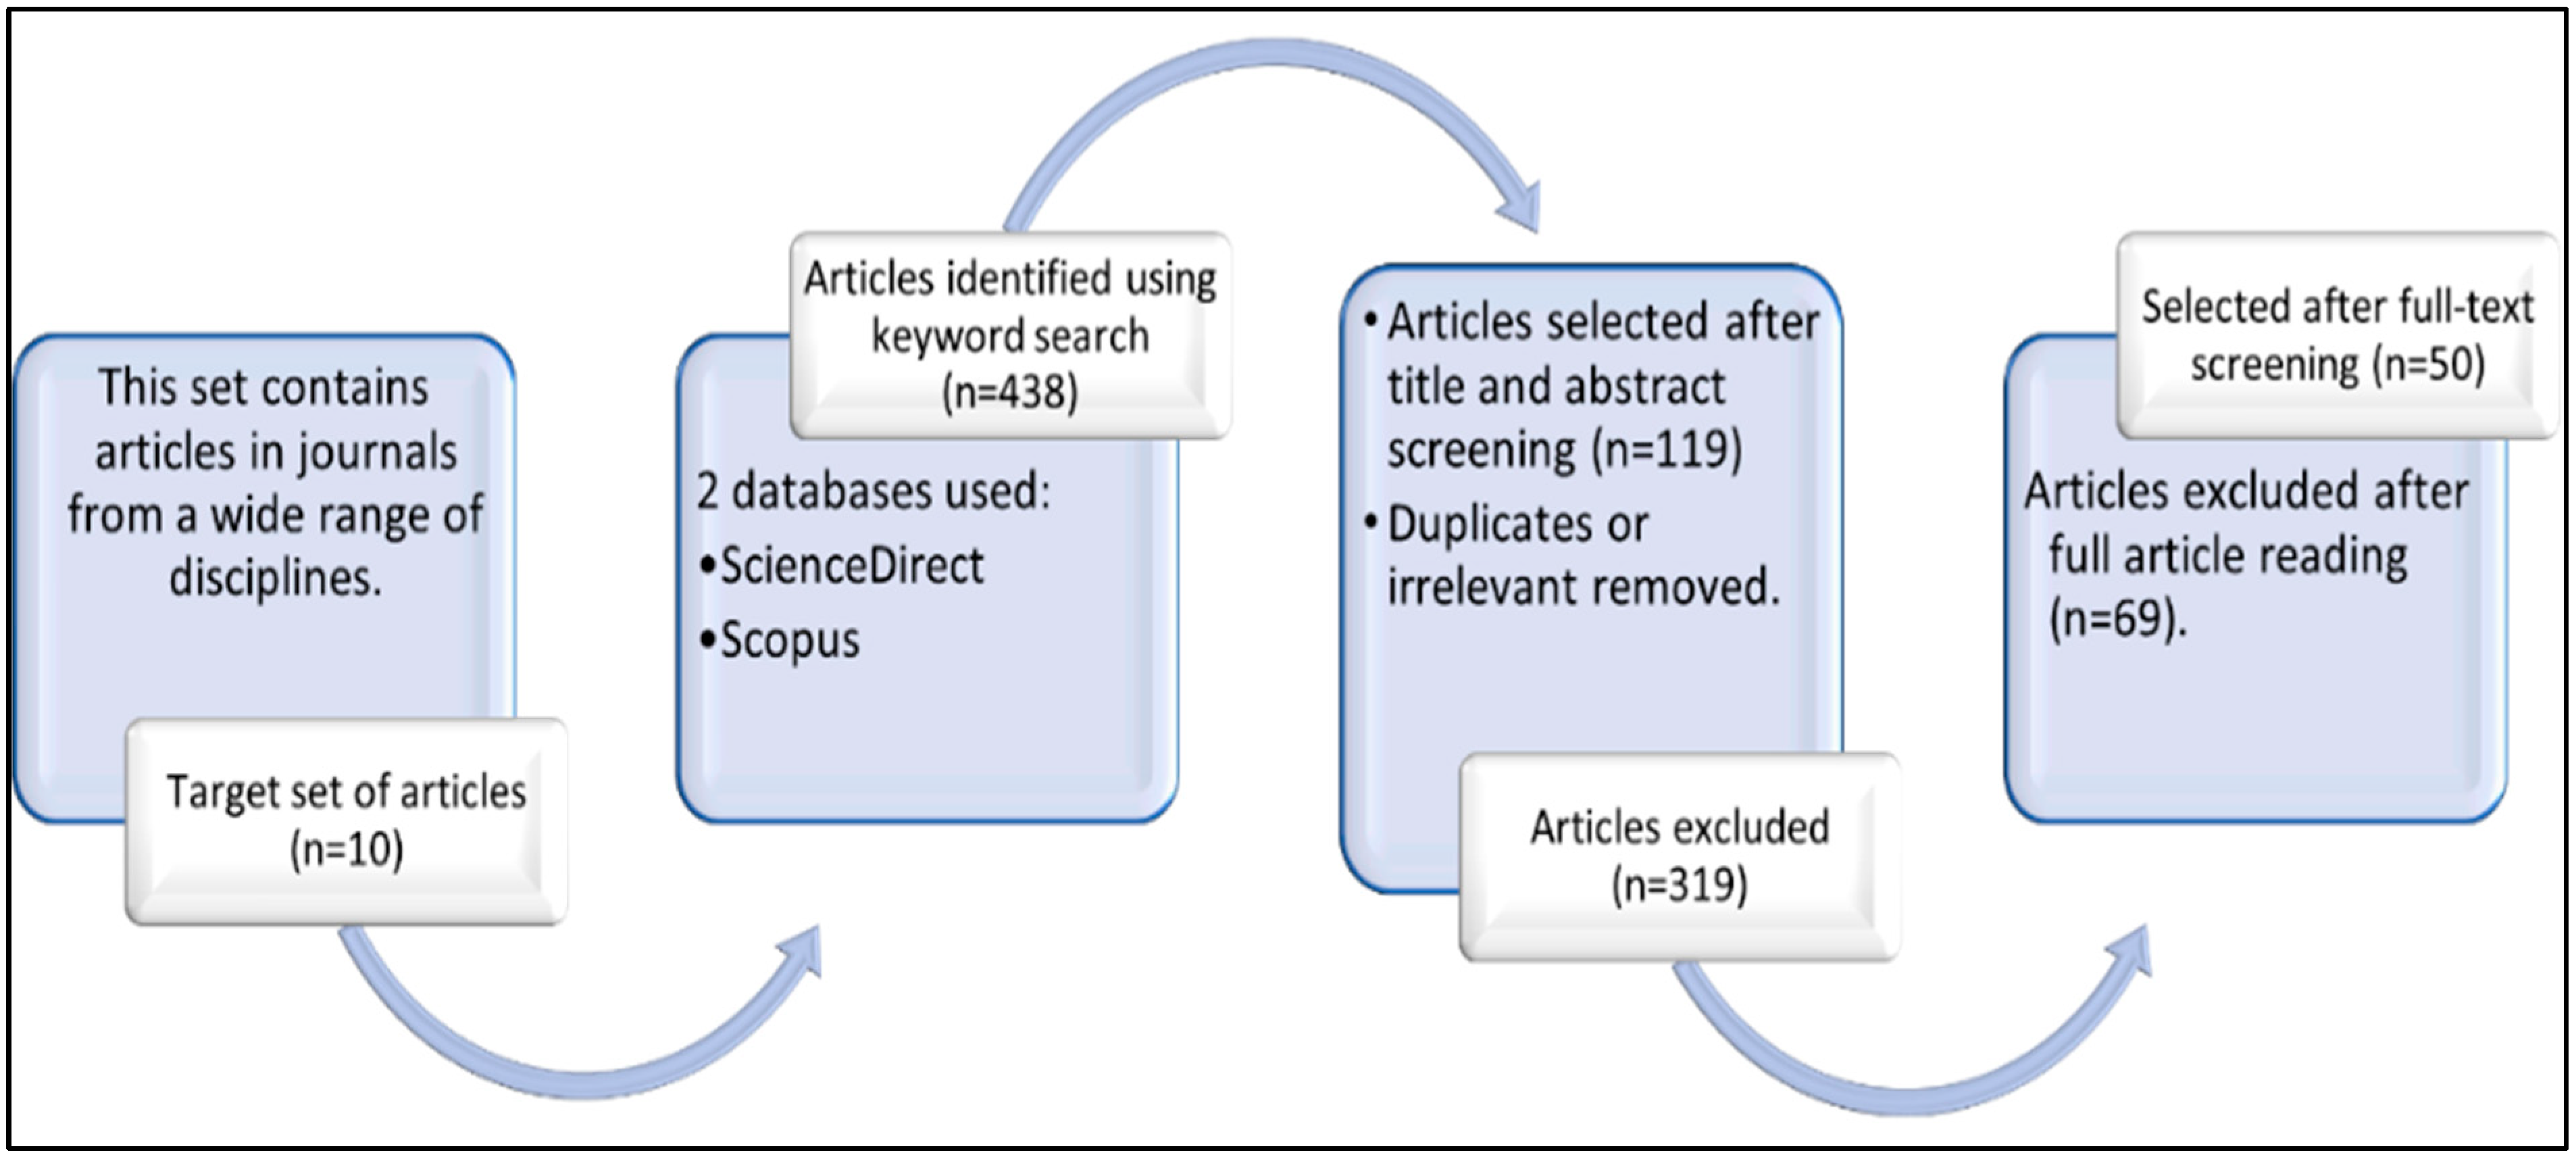
2.1.1. Literature Search Strategy
2.1.2. Selection of Case Studies
2.2. Data Analysis
−(1 − p) if fe(gv) > fo(gv)
(1 − p) if fe(gv) ≤ fo(gv)
undefined if fe(gv) = 0 ∧ fo ≠ 0
3. Results
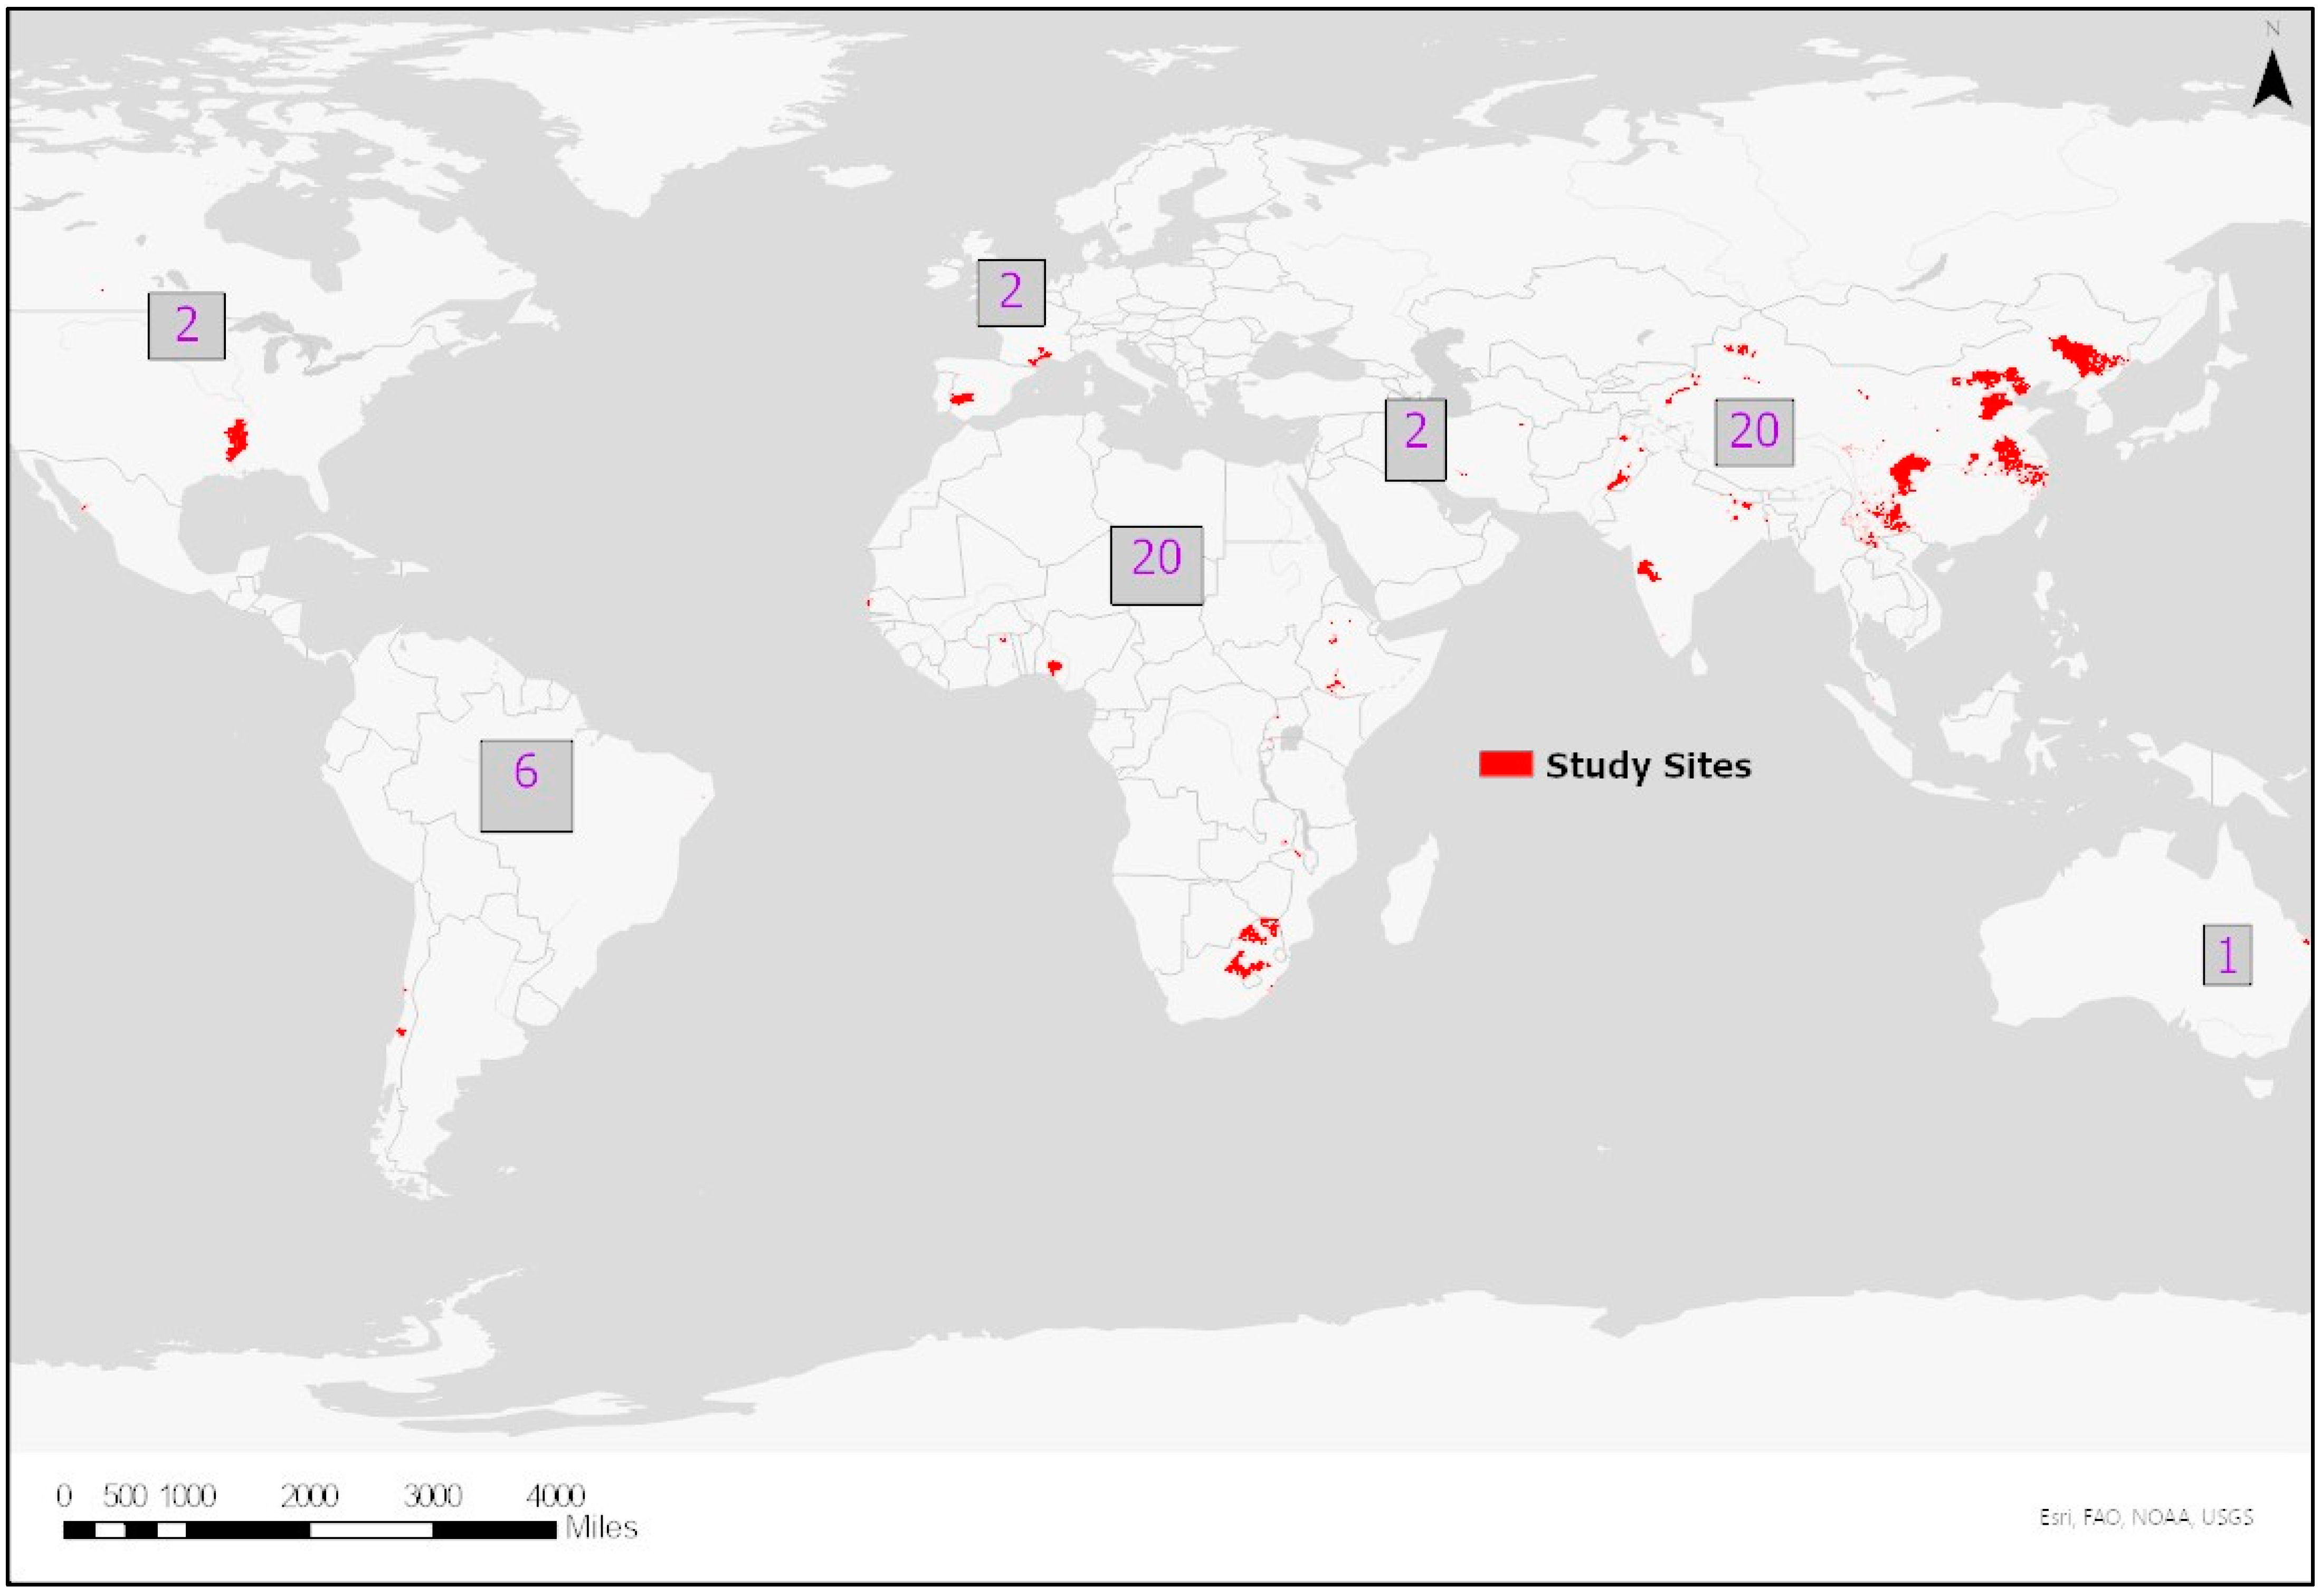
3.1. Geographic Representativeness of Irrigation Adoption Studies
3.2. Similarity of Irrigation Adoption Factors across Geographic Contexts
4. Discussion
5. Conclusions
Author Contributions
Funding
Institutional Review Board Statement
Data Availability Statement
Conflicts of Interest
Appendix A
- A1 Target Set
- Alcon, F., Tapsuwan, S., Martínez-Paz, J. M., Brouwer, R., & de Miguel, M. D. (2014). Forecasting deficit irrigation adoption using a mixed stakeholder assessment methodology. Technological Forecasting and Social Change, 83(1), 183–193. https://doi.org/10.1016/j.techfore.2013.07.003.
- Asfaw, A., Simane, B., Bantider, A., & Hassen, A. (2019). Determinants in the adoption of climate change adaptation strategies: evidence from rainfed-dependent smallholder farmers in north-central Ethiopia (Woleka sub-basin). Environment, Development and Sustainability, 21, 2535–2565.
- Chandran, K. M., & Surendran, U. (2016). ﻫﺎى ﮐﺎرﮔﺎه آﻣﻮزﺷﻰ ﺳﺮوﯾﺲ ﺗﺨﺼﺼﻰ ﺗﺮﺟﻤﻪ STRS ﻫﺎى ﺳﺮوﯾﺲ وﯾﮋه ﺑﻼگ ﻋﻠﻤﻰ اﻃﻼﻋﺎت ﻣﺮﮐﺰ ﻫﺎى ﻓﯿﻠﻢ آﻣﻮزﺷﻰ ﻋﻀﻮﯾﺖ درﺧﺒﺮﻧﺎﻣﻪ ﻣﻔﯿﺪ ﻫﺎى ﻟﯿﻨﮏ Study on factors influencing the adoption of drip irrigation by farmers in humid tropical Kerala, India. In International Journal of Plant Production (Vol. 10, Issue 3). www.SID.ir
- Esham, M., & Garforth, C. (2013). Agricultural adaptation to climate change_ insights from a farming community in Sri Lanka. Mitigation and Adaptation Strategies for Global Change, 18, 535–549.
- Fan, Y., & McCann, L. (2020). Adoption of pressure irrigation systems and scientific irrigation scheduling practices by U.S. farmers: An application of multilevel models. Journal of Agricultural and Resource Economics, 45(2), 352–375. https://doi.org/10.22004/ag.econ.302459
- Greenland, S., Levin, E., Dalrymple, J. F., & O’Mahony, B. (2019). Sustainable innovation adoption barriers: water sustainability, food production and drip irrigation in Australia. Social Responsibility Journal, 15(6), 727–741. https://doi.org/10.1108/SRJ-07-2018-0181
- Huang, Q., Xu, Y., Kovacs, K., & West, G. (2017). ANALYSIS OF FACTORS THAT INFLUENCE THE USE OF IRRIGATION TECHNOLOGIES AND WATER MANAGEMENT PRACTICES IN ARKANSAS. Journal of Agricultural and Applied Economics, 49(2), 159–185.
- Mase, A. S., Gramig, B. M., & Prokopy, L. S. (2017). Climate change beliefs, risk perceptions, and adaptation behavior among Midwestern U.S. crop farmers. Climate Risk Management, 15, 8–17. https://doi.org/10.1016/j.crm.2016.11.004
- Mesfin, A. H., & Bekele, A. (2018). Farmers Perception on Climate Change and Determinants of Adaptation Strategies in Benishangul-Gumuz Regional State of Ethiopia. International Journal on Food System Dynamics, 9(5), 453–469.
- Ngigi, M. W., Mueller, U., & Birner, R. (2017). Gender Differences in Climate Change Adaptation Strategies and Participation in Group-based Approaches: An Intra-household Analysis From Rural Kenya. Ecological Economics, 138, 99–108. https://doi.org/10.1016/j.ecolecon.2017.03.019.
- A2 Shortlisted Case Studies
- Abid, M., Scheffran, J., Schneider, U. A., & Ashfaq, M. (2015). Farmers’ perceptions of and adaptation strategies to climate change and their determinants: the case of Punjab Province, Pakistan. Earth System Dynamics, 6, 225–243.
- Akrofi, N. A., Sarpong, D. B., Somuah, H. A. S., & Osei-Owusu, Y. (2019). Paying for privately installed irrigation services in Northern Ghana: The case of the smallholder Bhungroo Irrigation Technology. Agricultural Water Management, 216, 284–293. https://doi.org/10.1016/j.agwat.2019.02.010
- Alam, K. (2015). Farmers’ adaptation to water scarcity in drought-prone environments: A case study of Rajshahi District, Bangladesh. Agricultural Water Management, 148, 196–206. https://doi.org/10.1016/j.agwat.2014.10.011
- Alauddin, M., Rashid Sarker, M. A., Islam, Z., & Tisdell, C. (2020). Adoption of alternate wetting and drying (AWD) irrigation as a water-saving technology in Bangladesh: Economic and environmental considerations. Land Use Policy, 91. https://doi.org/10.1016/j.landusepol.2019.104430
- Ali, S., Ying, L., Nazir, A., Abdullah, Ishaq, M., Shah, T., Ye, X., Ilyas, A., & Tariq, A. (2021). Rural farmers perception and coping strategies towards climate change and their determinants: Evidence from Khyber Pakhtunkhwa province, Pakistan. Journal of Cleaner Production, 291. https://doi.org/10.1016/j.jclepro.2020.125250
- Below, T. B., Mutabazi, K. D., Kirschke, D., Franke, C., Sieber, S., Siebert, R., & Tscherning, K. (2012). Can farmers’ adaptation to climate change be explained by socio-economic household-level variables? Global Environmental Change, 22(1), 223–235. https://doi.org/10.1016/j.gloenvcha.2011.11.012
- Budhathoki, N. K., Paton, D., A. Lassa, J., & Zander, K. K. (2020). Assessing farmers’ preparedness to cope with the impacts of multiple climate change-related hazards in the Terai lowlands of Nepal. International Journal of Disaster Risk Reduction, 49. https://doi.org/10.1016/j.ijdrr.2020.101656
- Bukchin, S., & Kerret, D. (2020). Character strengths and sustainable technology adoption by smallholder farmers. Heliyon, 6(8). https://doi.org/10.1016/j.heliyon.2020.e04694
- Burnham, M., & Ma, Z. (2018). Multi-Scalar Pathways to Smallholder Adaptation. World Development, 108, 249–262. https://doi.org/10.1016/j.worlddev.2017.08.005
- Chen, H., Wang, J., & Huang, J. (2014). Policy support, social capital, and farmers’ adaptation to drought in China. Global Environmental Change, 24(1), 193–202. https://doi.org/10.1016/j.gloenvcha.2013.11.010
- Chuchird, R., Sasaki, N., & Abe, I. (2017). Influencing factors of the adoption of agricultural irrigation technologies and the economic returns: A case study in Chaiyaphum Province, Thailand. Sustainability (Switzerland), 9(9). https://doi.org/10.3390/su9091524
- Danso-Abbeam, G., Ojo, T. O., Baiyegunhi, L. J. S., & Ogundeji, A. A. (2021). Climate change adaptation strategies by smallholder farmers in Nigeria: does non-farm employment play any role? Heliyon, 7(6). https://doi.org/10.1016/j.heliyon.2021.e07162
- Ebi, K., Padgham, J., Doumbia, M., Kergna, A., Smith, J., Butt, T., & McCarl, B. (2011). Smallholders adaptation to climate change in Mali. Climatic Change, 108, 423–436.
- Esfandiari, M., Mirzaei Khalilabad, H. R., Boshrabadi, H. M., & Mehrjerdi, M. R. Z. (2020). Factors influencing the use of adaptation strategies to climate change in paddy lands of Kamfiruz, Iran. Land Use Policy, 95. https://doi.org/10.1016/j.landusepol.2020.104628
- Esteve, P., Varela-Ortega, C., & Downing, T. (2018). A stakeholder-based assessment of barriers to climate change adaptation in a water-scarce basin in Spain. Regional Environmental Change, 18, 2505–2517.
- Fagariba, C. J., Song, S., & Baoro, S. K. G. S. (2018). Climate change in Upper East Region of Ghana; Challenges existing in farming practices and new mitigation policies. Open Agriculture, 3(1), 524–536. https://doi.org/10.1515/opag-2018-0057
- Fahad, S., Inayat, T., Wang, J., Dong, L., Hu, G., Khan, S., & Khan, A. (2020). Farmers’ awareness level and their perceptions of climate change: A case of Khyber Pakhtunkhwa province, Pakistan. Land Use Policy, 96. https://doi.org/10.1016/j.landusepol.2020.104669
- Funk, C., Raghavan Sathyan, A., Winker, P., & Breuer, L. (2020). Changing climate - Changing livelihood: Smallholder’s perceptions and adaption strategies. Journal of Environmental Management, 259. https://doi.org/10.1016/j.jenvman.2019.109702
- Graveline, N., & Grémont, M. (2021). The role of perceptions, goals and characteristics of wine growers on irrigation adoption in the context of climate change. Agricultural Water Management, 250. https://doi.org/10.1016/j.agwat.2021.106837
- Herwehe, L., & Scott, C. A. (2017). Drought adaptation and development: small-scale irrigated agriculture in northeast Brazil. Climate and Development, 10(4), 337–346.
- Jamil, I., Jun, W., Mughal, B., Raza, M. H., Imran, M. A., & Waheed, A. (2021). Does the adaptation of climate-smart agricultural practices increase farmers’ resilience to climate change? Environmental Science and Pollution Research, 28, 27238–27249.
- Jha, C. K., & Gupta, V. (2021). Farmer’s perception and factors determining the adaptation decisions to cope with climate change: An evidence from rural India. Environmental and Sustainability Indicators, 10. https://doi.org/10.1016/j.indic.2021.100112
- Kabir, M. J., Cramb, R., Alauddin, M., Roth, C., & Crimp, S. (2017). Farmers’ perceptions of and responses to environmental change in southwest coastal Bangladesh. Asia Pacific Viewpoint, 58(3), 362–378.
- Kalele, D. N., Ogara, W. O., Oludhe, C., & Onono, J. O. (2021). Climate change impacts and relevance of smallholder farmers’ response in arid and semi-arid lands in Kenya. Scientific African, 12. https://doi.org/10.1016/j.sciaf.2021.e00814
- Kephe, P. N., Ayisi, K. K., & Petja, B. M. (2020). A decision support system for institutional support to farmers in the face of climate change challenges in Limpopo province. Heliyon, 6(11). https://doi.org/10.1016/j.heliyon.2020.e04989
- Keshavarz, M., & Moqadas, R. S. (2021). Assessing rural households’ resilience and adaptation strategies to climate variability and change. Journal of Arid Environments, 184. https://doi.org/10.1016/j.jaridenv.2020.104323
- Khanal, U., Wilson, C., Hoang, V. N., & Lee, B. (2018). Farmers’ Adaptation to Climate Change, Its Determinants and Impacts on Rice Yield in Nepal. Ecological Economics, 144, 139–147. https://doi.org/10.1016/j.ecolecon.2017.08.006
- Knapp, T., & Huang, Q. (2017). Do climate factors matter for producers’ irrigation practices decisions? Journal of Hydrology, 552, 81–91. https://doi.org/10.1016/j.jhydrol.2017.06.037
- Koech, R., Haase, M., Grima, B., & Taylor, B. (2020). Barriers and measures to improve adoption of irrigation technologies: A case study from the Bundaberg region in Queensland, Australia.
- Kumasi, T. C., Antwi-Agyei, P., & Obiri-Danso, K. (2019). Small-holder farmers’ climate change adaptation practices in the Upper east region of Ghana. Environment, Development and Sustainability, 21, 745–762.
- Leroy, D. (2019). Farmers’ Perceptions of and Adaptations to Water Scarcity in Colombian and Venezuelan Paramos in the Context of Climate Change. Mountain Research and Development, 39.
- Li, S., An, P. L., Pan, Z. H., Wang, F. T., Li, X. M., & Liu, Y. (2015). Farmers’ initiative on adaptation to climate change in the Northern Agro-pastoral Ecotone. International Journal of Disaster Risk Reduction, 12, 278–284. https://doi.org/10.1016/j.ijdrr.2015.02.002
- Li, W., Ruiz-Menjivar, J., Zhang, L., & Zhang, J. (2021). Climate change perceptions and the adoption of low-carbon agricultural technologies: Evidence from rice production systems in the Yangtze River Basin. Science of the Total Environment, 759. https://doi.org/10.1016/j.scitotenv.2020.143554
- Mango, N., Makate, C., Tamene, L., Mponela, P., & Ndengu, G. (2018). Adoption of small-scale irrigation farming as a climate-smart agriculture practice and its influence on household income in the Chinyanja Triangle, Southern Africa. Land, 7(2). https://doi.org/10.3390/land7020049
- Marie, M., Yirga, F., Haile, M., & Tquabo, F. (2020). Farmers’ choices and factors affecting adoption of climate change adaptation strategies: evidence from northwestern Ethiopia. Heliyon, 6(4). https://doi.org/10.1016/j.heliyon.2020.e03867
- Masud, M. M., Azam, M. N., Mohiuddin, M., Banna, H., Akhtar, R., Alam, A. S. A. F., & Begum, H. (2017). Adaptation barriers and strategies towards climate change: Challenges in the agricultural sector. Journal of Cleaner Production, 156, 698–706. https://doi.org/10.1016/j.jclepro.2017.04.060
- Matewos, T. (2020). The state of local adaptive capacity to climate change in drought-prone districts of rural Sidama, southern Ethiopia. Climate Risk Management, 27. https://doi.org/10.1016/j.crm.2019.100209
- Mi, Q., Li, X., Li, X., Yu, G., & Gao, J. (2021). Cotton farmers’ adaptation to arid climates: Waiting times to adopt water-saving technology. Agricultural Water Management, 244. https://doi.org/10.1016/j.agwat.2020.106596
- NGANGO, J., & HONG, S. (2021). Adoption of small-scale irrigation technologies and its impact on land productivity: Evidence from Rwanda. Journal of Integrative Agriculture, 20(8), 2302–2312. https://doi.org/10.1016/S2095-3119(20)63417-7
- Nguyen, N., & Drakou, E. G. (2021). Farmers intention to adopt sustainable agriculture hinges on climate awareness: The case of Vietnamese coffee. Journal of Cleaner Production, 303. https://doi.org/10.1016/j.jclepro.2021.126828
- Nigussie, Y., van der Werf, E., Zhu, X., Simane, B., & van Ierland, E. C. (2018). Evaluation of Climate Change Adaptation Alternatives for Smallholder Farmers in the Upper Blue-Nile Basin. Ecological Economics, 151, 142–150. https://doi.org/10.1016/j.ecolecon.2018.05.006
- Nyang’au, J. O., Mohamed, J. H., Mango, N., Makate, C., & Wangeci, A. N. (2021). Smallholder farmers’ perception of climate change and adoption of climate smart agriculture practices in Masaba South Sub-county, Kisii, Kenya. Heliyon, 7(4). https://doi.org/10.1016/j.heliyon.2021.e06789
- Ojo, T. O., Adetoro, A. A., Ogundeji, A. A., & Belle, J. A. (2021). Quantifying the determinants of climate change adaptation strategies and farmers’ access to credit in South Africa. Science of the Total Environment, 792. https://doi.org/10.1016/j.scitotenv.2021.148499
- Orduño Torres, M. A., Kallas, Z., & Ornelas Herrera, S. I. (2020). Farmers’ environmental perceptions and preferences regarding climate change adaptation and mitigation actions; towards a sustainable agricultural system in México. Land Use Policy, 99. https://doi.org/10.1016/j.landusepol.2020.105031
- Pittman, J., Wittrock, V., Kulshreshtha, S., & Wheaton, E. (2011). Vulnerability to climate change in rural Saskatchewan: Case study of the Rural Municipality of Rudy No. 284. Journal of Rural Studies, 27(1), 83–94. https://doi.org/10.1016/j.jrurstud.2010.07.004
- Rico, L., Poblete, D., Meza, F., & Kerrigan, G. (2016). Farmers’ Options to Address Water Scarcity in a Changing Climate: Case Studies from two Basins in Mediterranean Chile. Environmental Management, 109, 958–971.
- Sertse, S. F., Khan, N. A., Shah, A. A., Liu, Y., & Naqvi, S. A. A. (2021). Farm households’ perceptions and adaptation strategies to climate change risks and their determinants: Evidence from Raya Azebo district, Ethiopia. International Journal of Disaster Risk Reduction, 60. https://doi.org/10.1016/j.ijdrr.2021.102255
- Shikuku, K. M., Winowiecki, L., Twyman, J., Eitzinger, A., Perez, J. G., Mwongera, C., & Läderach, P. (2017). Smallholder farmers’ attitudes and determinants of adaptation to climate risks in East Africa. Climate Risk Management, 16, 234–245. https://doi.org/10.1016/j.crm.2017.03.001
- Udmale, P., Ichikawa, Y., Manandhar, S., Ishidaira, H., & Kiem, A. S. (2014). Farmers’ perception of drought impacts, local adaptation and administrative mitigation measures in Maharashtra State, India. International Journal of Disaster Risk Reduction, 10(PA), 250–269. https://doi.org/10.1016/j.ijdrr.2014.09.011
- Zizinga, A., Kangalawe, R. Y. M., Ainslie, A., Tenywa, M. M., Majaliwa, J., Saronga, N. J., & Amoako, E. E. (2017). Analysis of Farmer’s Choices for Climate Change Adaptation Practices in South-Western Uganda, 1980-2009. Climate, 5(4), 89.
References
- Sauer, T.; Havlik, P.; Schneider, U.; Schmid, E.; Kindermann, G.E.; Obersteiner, M. Agriculture and resource availability in a changing world: The role of irrigation. Water Resour. Res. 2010, 46, W06503. [Google Scholar] [CrossRef] [Green Version]
- Yadav, P.; Jaiswal, D.K.; Sinha, R.K. Climate change. In Global Climate Change; Elsevier: Amsterdam, The Netherlands, 2021; pp. 151–174. [Google Scholar] [CrossRef]
- Kurukulasuriya, P.; Rosenthal, S. Climate Change and Agriculture A Review of Impacts and Adaptations; World Bank: Washington, DC, USA, 2003. [Google Scholar]
- Smit, B.; Skinner, M.W. Adaptation Options in Agriculture to Climate Change: A Typology. Mitig. Adapt. Strateg. Glob. Chang. 2002, 7, 85–114. [Google Scholar] [CrossRef]
- Allouche, J. The sustainability and resilience of global water and food systems: Political analysis of the interplay between security, resource scarcity, political systems and global trade. Food Policy 2011, 36, S3–S8. [Google Scholar] [CrossRef]
- Kogo, B.K.; Kumar, L.; Richard, K. Climate change and variability in Kenya: A review of impacts on agriculture and food security. Environ. Dev. Sustain. 2021, 23, 23–43. [Google Scholar] [CrossRef]
- Cassman, K.G.; Dobermann, A.; Walters, D.T.; Yang, H. Meeting cereal demand while protecting natural resources and improving environmental quality. Annu. Rev. Environ. Resour. 2003, 28, 315–358. [Google Scholar] [CrossRef] [Green Version]
- Sakschewski, B.; Von Bloh, W.; Huber, V.; Müller, C.; Bondeau, A. Feeding 10 billion people under climate change: How large is the production gap of current agricultural systems? Ecol. Modell. 2014, 288, 103–111. [Google Scholar] [CrossRef]
- Calzadilla, A.; Rehdanz, K.; Betts, R.; Falloon, P.; Wiltshire, A.; Tol, R. Climate change impacts on global agriculture. Clim. Change 2013, 120, 357–374. [Google Scholar] [CrossRef]
- Shiferaw, B.; Tesfaye, K.; Kassie, M.; Abate, T.; Prasanna, B.; Menkir, A. Managing vulnerability to drought and enhancing livelihood resilience in sub-Saharan Africa: Technological, institutional and policy options. Weather Clim. Extrem. 2014, 3, 67–79. [Google Scholar] [CrossRef] [Green Version]
- Wilson, R.S.; Herziger, A.; Hamilton, M.; Brooks, J.S. From incremental to transformative adaptation in individual responses to climate-exacerbated hazards. Nat. Clim. Change 2020, 10, 200–208. [Google Scholar] [CrossRef]
- Intergovernmental Panel on Climate Change. Adaptation Needs and Options. In Climate Change 2014—Impacts, Adaptation and Vulnerability: Part A: Global and Sectoral Aspects: Working Group II Contribution to the IPCC Fifth Assessment Report: Volume 1: Global and Sectoral Aspects; Intergovernmental Panel on Climate Change, Ed.; Cambridge University Press: Cambridge, UK, 2014; Volume 1, pp. 833–868. [Google Scholar]
- Tack, J.; Barkley, A.; Hendricks, N. Irrigation offsets wheat yield reductions from warming temperatures. Environ. Res. Lett. 2017, 12, 114027. [Google Scholar] [CrossRef]
- Troy, T.J.; Kipgen, C.; Pal, I. The impact of climate extremes and irrigation on US crop yields. Environ. Res. Lett. 2015, 10, 54013. [Google Scholar] [CrossRef] [Green Version]
- Hejazi, M.I.; Edmonds, J.A.; Chaturvedi, V. Global Irrigation Demand? A Holistic Approach. Irrig. Drain. Syst. Eng. 2012, 1, 2–5. [Google Scholar] [CrossRef] [Green Version]
- Angelakιs, A.N.; Zaccaria, D.; Krasilnikoff, J.; Salgot, M.; Bazza, M.; Roccaro, P.; Jimenez, B.; Kumar, A.; Yinghua, W.; Baba, A.; et al. Irrigation of world agricultural lands: Evolution through the Millennia. Water 2020, 12, 1285. [Google Scholar] [CrossRef]
- Hussain, I.; Hanjra, M.A. Irrigation and poverty alleviation: Review of the empirical evidence. Irrig. Drain. 2004, 53, 1–15. [Google Scholar] [CrossRef]
- International Commission on Irrigation & Drainage. ICID Database—World Irrigated Area. 2021. Available online: https://icid-ciid.org/Knowledge/world_irrigated_area (accessed on 30 March 2022).
- Knoema. Total Area Equipped for Irrigation. 2019. Available online: https://knoema.com/atlas/topics/Land-Use/Area/Total-area-equipped-for-irrigation?type=maps (accessed on 18 March 2022).
- Mottaleb, K.A. Perception and adoption of a new agricultural technology: Evidence from a developing country. Technol. Soc. 2018, 55, 126–135. [Google Scholar] [CrossRef]
- McDonald, R.I.; Girvetz, E.H. Two Challenges for U.S. Irrigation Due to Climate Change: Increasing Irrigated Area in Wet States and Increasing Irrigation Rates in Dry States. PLoS ONE 2013, 8, e65589. [Google Scholar] [CrossRef]
- United States Government Accountability Office (US GAO). Irrigated Agriculture; Science, Technology Assessment, and Analytics, Natural Resources and Environment, Report to Congressional Requesters, Technologies, Practices, and Implications for Water Scarcity; US GAO: Washington, DC, USA, 2019. [Google Scholar]
- Combs, P. Evaluation of Factors Influencing Irrigation Adoption among Farmers in the Southeast. In All Theses; Clemson University: Clemson, SC, USA, 2019. [Google Scholar]
- Patle, G.T.; Kumar, M.; Khanna, M. Climate-smart water technologies for sustainable agriculture: A review. J. Water Clim. Chang. 2019, 11, 1455–1466. [Google Scholar] [CrossRef]
- Mbuli, C.S.; Fonjong, L.N.; Fletcher, A.J. Climate Change and Small Farmers’ Vulnerability to Food Insecurity in Cameroon. Sustainability 2021, 13, 1523. [Google Scholar] [CrossRef]
- Giannakis, E.; Bruggeman, A.; Djuma, H.; Kozyra, J.; Hammer, J. Water pricing and irrigation across Europe: Opportunities and constraints for adopting irrigation scheduling decision support systems. Water Sci. Technol. Water Supply 2016, 16, 245–252. [Google Scholar] [CrossRef]
- Esham, M.; Garforth, C. Agricultural adaptation to climate change: Insights from a farming community in Sri Lanka. Mitig. Adapt. Strateg. Glob. Chang. 2013, 18, 535–549. [Google Scholar] [CrossRef]
- Asare-Baah, L.; Zabawa, R.; Findlay, H.J.; Findlay, H. Participation in Selected USDA Programs by Socially Disadvantaged Farmers in Selected Black Belt Counties in Georgia. J. Rural. Soc. Sci. 2018, 33, 2. [Google Scholar]
- Ruzzante, S.; Labarta, R.; Bilton, A. Adoption of agricultural technology in the developing world: A meta-analysis of the empirical literature. World Dev. 2021, 146, 105599. [Google Scholar] [CrossRef]
- Martin, L.; Blossey, B.; Ellis, E. Mapping where ecologists work: Biases in the global distribution of terrestrial ecological observations. Front. Ecol. Environ. 2012, 10, 195–201. [Google Scholar] [CrossRef] [PubMed] [Green Version]
- Prokopy, L.S.; Floress, K.; Klotthor-Weinkauf, D.; Baumgart-Getz, A. Determinants of agricultural best management practice adoption: Evidence from the literature. J. Soil Water Conserv. 2008, 63, 300–311. Available online: www.swcs.org (accessed on 15 November 2022).
- Da Cunha, D.A.; Coelho, A.B.; Féres, J.G. Irrigation as an adaptive strategy to climate change: An economic perspective on Brazilian agriculture. Environ. Dev. Econ. 2015, 20, 57–79. [Google Scholar] [CrossRef] [Green Version]
- Trapolino, M. Irrigation Technology in Agriculture: How New Technologies Overcome Challenges. 2019. Available online: https://www.agritechtomorrow.com/article/2019/01/top-article-from-2019-irrigation-technology-in-agriculture-how-new-technologies-overcome-challenges/11230 (accessed on 3 May 2021).
- USDA Economic Research Service. Irrigation & Water Use. 2022. Available online: https://www.ers.usda.gov/topics/farm-practices-management/irrigation-water-use/ (accessed on 1 May 2022).
- USGS. Irrigation Methods. 2018. Available online: https://www.usgs.gov/special-topics/water-science-school/science/irrigation-methods-quick-look (accessed on 1 May 2022).
- Barta, R.; Broner, I.; Schneekloth, J.; Waskom, R. Farm Irrigation Systems. 2015. Available online: https://irrigazette.com/en/news/farm-irrigation-systems (accessed on 9 May 2022).
- Michael, C.H.; Charles, H.U.; James, R.E.; Stefan, S.O.; Graham, V.M. World Atlas of Desertification, Publication Office of the European Union. 2018. Available online: https://wad.jrc.ec.europa.eu/ (accessed on 30 March 2022).
- Rosegrant, M.W.; Ringler, C.; Zhu, T. Water for Agriculture: Maintaining Food Security under Growing Scarcity. Annu. Rev. Environ. Resour. 2009, 34, 205–222. [Google Scholar] [CrossRef]
- Turral, H.; Svendsen, M.; Faures, J.M. Turral—Investing in Irrigation_Reviewing the past and looking to the future. Agric. Water Manag. 2010, 97, 551–560. [Google Scholar] [CrossRef]
- FAO. The Irrigation Challenge. 2003. Available online: https://www.fao.org/publications/card/en/c/c72fbe14-0a6f-52d1-92b5-f29eea8e2ab7/ (accessed on 30 March 2022).
- Khan, S.; Tariq, R.; Yuanlai, C.; Blackwell, J. Can irrigation be sustainable? In Agricultural Water Management; Elsevier: Amsterdam, The Netherlands, 2006; Volume 80, pp. 87–99. [Google Scholar]
- Gibson, K.E.; Yang, H.S.; Franz, T.; Eisenhauer, D.; Gates, J.B.; Nasta, P.; Farmaha, B.S.; Grassini, P. Assessing explanatory factors for variation in on-farm irrigation in US maize-soybean systems. Agric. Water Manag. 2018, 197, 34–40. [Google Scholar] [CrossRef]
- Grassini, P.; van Bussel, L.G.; Van Wart, J.; Wolf, J.; Claessens, L.; Yang, H.; Boogaard, H.; de Groot, H.; van Ittersum, M.K.; Cassman, K.G. How good is good enough? Data requirements for reliable crop yield simulations and yield-gap analysis. Field Crop. Res. 2015, 177, 49–63. [Google Scholar] [CrossRef] [Green Version]
- Agriculture Victoria. Irrigation Management. 2022. Available online: https://agriculture.vic.gov.au/farm-management/water/irrigation/irrigation-management (accessed on 18 March 2022).
- Lauer, S.; Sanderson, M. Irrigated agriculture and human development: A county-level analysis 1980–2010. Environ. Dev. Sustain. 2020, 22, 4407–4423. [Google Scholar] [CrossRef]
- Mpanga, I.K.; Idowu, O.J. A decade of irrigation water use trends in Southwest USA: The role of irrigation technology, best management practices, and outreach education programs. Agric. Water Manag. 2021, 243, 106438. [Google Scholar] [CrossRef]
- Evans, R.G.; Sadler, E.J. Methods and technologies to improve efficiency of water use. Water Resour. Res. 2008, 44. [Google Scholar] [CrossRef]
- Fraiture, C.; Wichelns, D.C. Satisfying future water demands for agriculture. Agric. Water Manag. 2010, 97, 502–511. [Google Scholar] [CrossRef]
- Zaveri, E.; Lobell, D.B. The role of irrigation in changing wheat yields and heat sensitivity in India. Nat. Commun. 2019, 10, 4144. [Google Scholar] [CrossRef] [PubMed] [Green Version]
- Bhattarai, M.; Barker, R.; Narayanamoorthy, A. Who benefits from irrigation development in India? Implication of irrigation multipliers for irrigation financing. Irrig. Drain. 2007, 56, 207–225. [Google Scholar] [CrossRef]
- Rogers, E.M. Diffusion of Innovations, 3rd ed.; Free Press: New York, NY, USA, 1962. [Google Scholar]
- Kee, K.F. Adoption and Diffusion. In The International Encyclopedia of Organizational Communication; John Wiley & Sons, Inc.: Hoboken, NJ, USA, 2017; Volume 1, pp. 41–54. [Google Scholar]
- Driessen, P.H.; Hillebrand, B. Adoption and Diffusion of Green Innovations. In Marketing for Sustainability: Towards Transactional Policy-Making; Bartels, G.C., Nelissen, W.J.A., Eds.; IOS Press: Amsterdam, The Netherlands, 2002; pp. 343–355. Available online: https://ssrn.com/abstract=2363527 (accessed on 5 April 2022).
- Sunding, D.; Zilberman, D. The Agricultural Innovation Process: Research and Technology Adoption in a Changing Agricultural Sector. In Handbook of Agricultural Economics; Elsevier: Amsterdam, The Netherlands, 1999. [Google Scholar]
- Straub, E.T. Understanding technology adoption: Theory and future directions for informal learning. Rev. Educ. Res. 2009, 79, 625–649. [Google Scholar] [CrossRef] [Green Version]
- Kapoor, K.; Dwivedi, Y.; Williams, M. Innovation adoption attributes: A review and synthesis of research findings. Eur. J. Innov. Manag. 2015, 17, 327–348. [Google Scholar] [CrossRef] [Green Version]
- Mwangi, M.; Kariuki, S. Factors determining adoption of new agricultural technology by smallholder farmers in developing countries. J. Econ. Sustain. Dev. 2015, 6, 208–217. [Google Scholar]
- Feder, G.; Umali, D.L. The Adoption of Agricultural Innovations A Review. Technol. Forecast. Soc. Chang. 1993, 43, 215–239. [Google Scholar] [CrossRef]
- Pham, H.-G.; Chuah, S.-H.; Feeny, S. Factors affecting the adoption of sustainable agricultural practices: Findings from panel data for Vietnam. Ecol. Econ. 2021, 184, 107000. [Google Scholar] [CrossRef]
- Li, J.; Feng, S.; Luo, T.; Guan, Z. What drives the adoption of sustainable production technology? Evidence from the large scale farming sector in East China. J. Clean. Prod. 2020, 257, 120611. [Google Scholar] [CrossRef]
- Meijer, S.S.; Catacutan, D.; Ajayi, O.C.; Sileshi, G.W.; Nieuwenhuis, M. The role of knowledge, attitudes and perceptions in the uptake of agricultural and agroforestry innovations among smallholder farmers in sub-Saharan Africa. Int. J. Agric. Sustain. 2015, 13, 40–54. [Google Scholar] [CrossRef]
- Herrero, M.; Thornton, P.K.; Mason-D’Croz, D.; Palmer, J.; Benton, T.G.; Bodirsky, B.L.; Bogard, J.R.; Hall, A.; Lee, B.; Nyborg, K.; et al. Innovation can accelerate the transition towards a sustainable food system. Nat. Food 2020, 1, 266–272. [Google Scholar] [CrossRef]
- Woltering, L.; Fehlenberg, K.; Gerard, B.; Ubels, J.; Cooley, L. Scaling—From “reaching many” to sustainable systems change at scale: A critical shift in mindset. Agric. Syst. 2019, 176, 102652. [Google Scholar] [CrossRef]
- Genius, M.; Koundouri, P.; Nauges, C.; Tzouvelekas, V. Information transmission in irrigation technology adoption and diffusion: Social learning, extension services, and spatial effects. Am. J. Agric. Econ. 2013, 96, 328–344. [Google Scholar] [CrossRef] [Green Version]
- Chen, H.; Wang, J.; Huang, J. Policy support, social capital, and farmers’ adaptation to drought in China. Glob. Environ. Chang. 2014, 24, 193–202. [Google Scholar] [CrossRef]
- Wossen, T.; Berger, T.; Di Falco, S. Social capital, risk preference and adoption of improved farm land management practices in Ethiopia. Agric. Econ. 2015, 46, 81–97. [Google Scholar] [CrossRef]
- Hunecke, C.; Engler, A.; Jara-Rojas, R.; Poortvliet, P.M. Understanding the role of social capital in adoption decisions: An application to irrigation technology. Agric. Syst. 2017, 153, 221–231. [Google Scholar] [CrossRef]
- Wang, J.; Klein, K.K.; Bjornlund, H.; Zhang, L.; Zhang, W. Adoption of improved irrigation scheduling methods in Alberta: An empirical analysis. Can. Water Resour. J. Rev. Can. Des. Ressour. Hydr. 2015, 40, 47–61. [Google Scholar] [CrossRef]
- Chavas, J.P.; Nauges, C. Uncertainty, Learning, and Technology Adoption in Agriculture. Appl. Econ. Perspect. Policy 2020, 42, 42–53. [Google Scholar] [CrossRef] [Green Version]
- Luu, T.D. Factors Influencing Farmers’ Adoption of Climate-Smart Agriculture in Rice Production in Vietnam’s Mekong Delta. Asian J. Agric. Dev. 2020, 17, 109–124. [Google Scholar] [CrossRef]
- Amadu, F.O.; McNamara, P.E.; Miller, D.C. Understanding the adoption of climate-smart agriculture: A farm-level typology with empirical evidence from southern Malawi. World Dev. 2020, 126, 104692. [Google Scholar] [CrossRef]
- de Witt, M.; de Clercq, W.P.; Velazquez, F.J.B.; Altobelli, F.; Marta, A.D. An in-depth evaluation of personal barriers to technology adoption in irrigated agriculture in South Africa. Outlook Agric. 2021, 50, 259–268. [Google Scholar] [CrossRef]
- Hamdy, A.; Ragab, R.; Scarascia-Mugnozza, E. Coping with water scarcity: Water saving and increasing water productivity. Irrig. Drain. 2003, 52, 3–20. [Google Scholar] [CrossRef]
- Annandale, J.G.; Stirzaker, R.J.; Singels, A.; van der Laan, M.; Laker, M.C. Irrigation scheduling research: South African experiences and future prospects. Water SA 2011, 37, 751–764. [Google Scholar] [CrossRef] [Green Version]
- Garb, Y.; Friedlander, L. From transfer to translation: Using systemic understandings of technology to understand drip irrigation uptake. Agric. Syst. 2014, 128, 13–24. [Google Scholar] [CrossRef]
- Zongo, B.; Diarra, A.; Barbier, B.; Zorom, M.; Yacouba, H.; Dogot, T. Farmers’ Practices and Willingness to Adopt Supplemental Irrigation in Burkina Faso. Int. J. Food Agric. Econ. 2015, 3, 101–117. [Google Scholar]
- Afrakhteh, H.; Armand, M.; Bozayeh, F. Analysis of Factors Affecting Adoption and Application of Sprinkler Irrigation by Farmers in Famenin County, Iran. Int. J. Agric. Manag. Dev. 2015, 5, 89–99. [Google Scholar] [CrossRef]
- Salazar, C.; Rand, J. Production risk and adoption of irrigation technology: Evidence from small-scale farmers in Chile. Lat. Am. Econ. Rev. 2016, 25, 2. [Google Scholar] [CrossRef] [Green Version]
- Zhai, S.-Y.; Song, G.-X.; Qin, Y.-C.; Ye, X.-Y.; Leipnik, M. Climate change and Chinese farmers: Perceptions and determinants of adaptive strategies. J. Integr. Agric. 2018, 17, 949–963. [Google Scholar] [CrossRef] [Green Version]
- Hall, B.H.; Khan, B. Adoption of New Technology. 2003. Available online: http://www.nber.org/papers/w9730 (accessed on 5 August 2021).
- Freydank, K.; Siebert, S. Towards Mapping the Extent of Irrigation in the Last Century: Time Series of Irrigated Area per Country. 2008. Available online: http://photogallery.nrcs.usda.gov/Index.asp (accessed on 29 April 2021).
- GADM. GADM Maps and Data. 2022. Available online: https://gadm.org/data.html (accessed on 19 April 2021).
- Willmott, C.; Matsuura, K. Terrestrial Air Temperature and Precipitation: Monthly and Annual Climatologies. 2001. Available online: http://climate.geog.udel.edu/~climate/html_pages/README.ghcn_clim2.html (accessed on 9 May 2022).
- Klein Goldewijk, K.; Beusen, A.; Van Drecht, G.; De Vos, M. The HYDE 3.1 spatially explicit database of human-induced global land-use change over the past 12,000 years. Glob. Ecol. Biogeogr. 2011, 20, 73–86. [Google Scholar] [CrossRef]
- Verburg, P.H.; Ellis, E.C.; Letourneau, A. A global assessment of market accessibility and market influence for global environmental change studies. Environ. Res. Lett. 2011, 6, 034019. [Google Scholar] [CrossRef]
- Siebert, S.; Döll, P.; Hoogeveen, J.; Faures, J.-M.; Frenken, K.; Feick, S. Development and validation of the global map of irrigation areas. Hydrol. Earth Syst. Sci. 2005, 9, 535–547. [Google Scholar] [CrossRef]
- Abebaw, D.; Haile, M.G. The impact of cooperatives on agricultural technology adoption: Empirical evidence from Ethiopia. Food Policy 2013, 38, 82–91. [Google Scholar] [CrossRef]
- Abdulai, A.N.; Abdul-Rahaman, A.; Issahaku, G. Adoption and diffusion of conservation agriculture technology in Zambia: The role of social and institutional networks. Environ. Econ. Policy Stud. 2021, 23, 761–780. [Google Scholar] [CrossRef]
- Abegunde, V.O.; Sibanda, M.; Obi, A. Determinants of the adoption of climate-smart agricultural practices by small-scale farming households in King Cetshwayo district municipality, South Africa. Sustainability 2020, 12, 195. [Google Scholar] [CrossRef] [Green Version]
- Mase, A.S.; Gramig, B.M.; Prokopy, L.S. Climate change beliefs, risk perceptions, and adaptation behavior among Midwestern U.S. crop farmers. Clim. Risk Manag. 2017, 15, 8–17. [Google Scholar] [CrossRef]
- Hassan, R.; Nhemachena, C.; Hassan, R.; Nhemachena, C. Determinants of African farmers’ strategies for adapting to climate change: Multinomial choice analysis. Afr. J. Agric. Resour. Econ. 2008, 2, 83–104. Available online: http://ageconsearch.umn.edu (accessed on 15 November 2022).
- Wheeler, S.; Zuo, A.; Bjornlund, H. Farmers’ climate change beliefs and adaptation strategies for a water scarce future in Australia. Glob. Environ. Chang. 2013, 23, 537–547. [Google Scholar] [CrossRef]
- Ortiz, R.; Sayre, K.D.; Govaerts, B.; Gupta, R.; Subbarao, G.V.; Ban, T.; Hodson, D.; Dixon, J.M.; Ortiz-Monasterio, J.I.; Reynolds, M. Climate change: Can wheat beat the heat? Agric. Ecosyst. Environ. 2008, 126, 46–58. [Google Scholar] [CrossRef]
- Saadi, S.; Todorovic, M.; Tanasijevic, L.; Pereira, L.S.; Pizzigalli, C.; Lionello, P. Climate change and Mediterranean agriculture: Impacts on winter wheat and tomato crop evapotranspiration, irrigation requirements and yield. Agric. Water Manag. 2015, 147, 103–115. [Google Scholar] [CrossRef]
- Zilberman, D.; Zhao, J.; Heiman, A. Adoption versus adaptation, with Emphasis on climate change. Annu. Rev. Resour. Econ. 2012, 4, 27–53. [Google Scholar] [CrossRef] [Green Version]
- Schmill, M.D.; Gordon, L.M.; Magliocca, N.R.; Ellis, E.C.; Oates, T. GLOBE: Analytics for assessing global representativeness. In Proceedings of the 5th International Conference on Computing for Geospatial Research and Application, Washington, DC, USA, 25 September 2014. [Google Scholar] [CrossRef] [Green Version]
- GLOBE. Global Representativeness Analysis. 2012. Available online: http://globe.umbc.edu/documentation-overview/representativeness/ (accessed on 4 March 2021).
- Olson, D.M.; Dinerstein, E.; Wikramanayake, E.D.; Burgess, N.D.; Powell, G.V.; Underwood, E.C.; D’amico, J.A.; Itoua, I.; Strand, H.E.; Morrison, J.C.; et al. Terrestrial Ecoregions of the World: A New Map of Life on Earth: A new global map of terrestrial ecoregions provides an innovative tool for conserving biodiversity. Bioscience 2001, 51, 933–938. [Google Scholar] [CrossRef]
- IIASA Global Agro-Ecological Zones (GAEZ). Slope Suitability Classes. 2001. Available online: https://gaez.fao.org/ (accessed on 9 May 2022).
- Kabacoff, R. Correspondence Analysis. 2017. Available online: https://www.statmethods.net/advstats/ca.html (accessed on 29 August 2022).
- TIBCO Software Inc. What Is Correspondence Analysis? 2022. Available online: https://www.tibco.com/reference-center/what-is-correspondence-analysis (accessed on 29 August 2022).
- Sourial, N.; Wolfson, C.; Zhu, B.; Quail, J.; Fletcher, J.; Karunananthan, S.; Bandeen-Roche, K.; Béland, F.; Bergman, H. Correspondence analysis is a useful tool to uncover the relationships among categorical variables. J. Clin. Epidemiol. 2010, 63, 638–646. [Google Scholar] [CrossRef] [Green Version]
- Bock, T. How Correspondence Analysis Works (A Simple Explanation). Available online: https://www.displayr.com/how-correspondence-analysis-works/ (accessed on 29 August 2022).
- Doey, L.; Kurta, J. Correspondence Analysis applied to psychological research. Tutor. Quant. Methods Psychol. 2011, 7, 5–14. [Google Scholar] [CrossRef]
- Pelletier, C.; Pousette, A.; Ward, K.; Fox, G. Exploring the perspectives of community members as research partners in rural and remote areas. Res. Involv. Engagem. 2020, 6, 3. [Google Scholar] [CrossRef] [PubMed] [Green Version]
- Mwangi, J.K.; Crewett, W. The impact of irrigation on small-scale African indigenous vegetable growers’ market access in peri-urban Kenya. Agric. Water Manag. 2019, 212, 295–305. [Google Scholar] [CrossRef]
- Dhawan, B. Impact of Irrigation on Farm Economy in High Rainfall Areas: The Kal Project. Econ. Polit. Wkly. 1988, 23, A173–A175 + A177–A180. [Google Scholar]
- Adeoti, A.I. Factors Influencing Irrigation Technology Adoption and its Impact on Household Poverty in Ghana. J. Agric. Rural. Dev. Trop. Subtrop. 2009, 109, 51–63. [Google Scholar]
- Fischer, J.; Abson, D.J.; Dorresteijn, I.; Hanspach, J.; Hartel, T.; Schultner, J.; Sherren, K. Using a leverage points perspective to compare social-ecological systems: A case study on rural landscapes. Ecosyst. People 2022, 18, 119–130. [Google Scholar] [CrossRef]
- Wozniak, G.D. Human Capital, Information, and the Early Adoption of New Technology. J. Hum. Resour. 1987, 22, 101–112. Available online: https://about.jstor.org/terms (accessed on 20 August 2022). [CrossRef]
- Diederen, P.; Van Meijl, H.; Wolters, A.; Bijak, K. Innovation Adoption in Agriculture: Innovators, Early Adopters and Laggards Innovation Adoption in Agriculture: Innovators, Early Adopters and Laggards. 2003. Available online: https://hal.archives-ouvertes.fr/hal-01201041 (accessed on 20 August 2022).
- Asfaw, S.; Shiferaw, B.; Simtowe, F.; Hagos, M. Agricultural technology adoption, seed access constraints and commercialization in Ethiopia. J. Dev. Agric. Econ. 2011, 3, 436–447. [Google Scholar]
- Teha, D.; Jianjun, L. Factors Affecting Adoption of Small Scale Irrigation Technology: Insights from Sire Woreda, Oromiya Region, Ethiopia. Am. J. Appl. Sci. Res. 2021, 7, 84–101. [Google Scholar] [CrossRef]
- Makate, C.; Makate, M.; Mutenje, M.; Mango, N.; Siziba, S. Synergistic impacts of agricultural credit and extension on adoption of climate-smartagricultural technologies in southern Africa. Environ. Dev. 2019, 32, 100458. [Google Scholar] [CrossRef]
- Ajayi, T.; Fatunbi, O.; Yemi, A. Strategies for Scaling Agricultural Technologies in Africa; FARA Africa: Accra, Ghana, 2018. [Google Scholar]
- Kim, J.; Shah, P.; Gaskell, J.C.; Prasann, A.; Luthra, A. Scaling up Disruptive Agricultural Technologies in Africa; The World Bank: Washington, DC, USA, 2020. [Google Scholar]
- Esteve, P.; Varela-Ortega, C.; Downing, T. A stakeholder-based assessment of barriers to climate change adaptation in a water-scarce basin in Spain. Reg. Environ. Chang. 2018, 18, 2505–2517. [Google Scholar] [CrossRef] [Green Version]
- Budhathoki, N.K.; Paton, D.; ALassa, J.; Zander, K.K. Assessing farmers’ preparedness to cope with the impacts of multiple climate change-related hazards in the Terai lowlands of Nepal. Int. J. Disaster Risk Reduct. 2020, 49, 101656. [Google Scholar] [CrossRef]
- Ray, D.K.; West, P.C.; Clark, M.; Gerber, J.S.; Prishchepov, A.V.; Chatterjee, S. Climate change has likely already affected global food production. PLoS ONE 2019, 14, e0217148. [Google Scholar] [CrossRef]
- Ranganathan, J.; Waite, R.; Searchinger, T.; Zionts, J. Regenerative Agriculture: Good for Soil Health, but Limited Potential to Mitigate Climate Change; WRI: Washington, DC, USA, 2020. [Google Scholar]
- Falkenmark, M.; Molden, D. Wake up to realities of river basin closure. Int. J. Water Resour. Dev. 2008, 24, 201–215. [Google Scholar] [CrossRef]
- Lankford, B.; Closas, A.; Dalton, J.; Gunn, E.L.; Hess, T.; Knox, J.W.; van der Kooij, S.; Lautze, J.; Molden, D.; Orr, S.; et al. A scale-based framework to understand the promises, pitfalls and paradoxes of irrigation efficiency to meet major water challenges. Glob. Environ. Chang. 2020, 65, 102182. [Google Scholar] [CrossRef]
- Graveline, N.; Grémont, M. The role of perceptions, goals and characteristics of wine growers on irrigation adoption in the context of climate change. Agric. Water Manag. 2021, 250, 106837. [Google Scholar] [CrossRef]
- Andersson, J.A.; D’Souza, S. From adoption claims to understanding farmers and contexts: A literature review of Conservation Agriculture (CA) adoption among smallholder farmers in southern Africa. Agric. Ecosyst. Environ. 2014, 187, 116–132. [Google Scholar] [CrossRef]


| Dataset Name | Description | Source |
|---|---|---|
| Global Administrative Areas (GADM) | A spatial database of the location of administrative areas of all countries, at all levels of sub-division. | GADM (2018–2022) [82] |
| GLOBE Land Units (GLUs) | GLUs are equal-area hexagonal cells that cover the Earth’s land surface and are based on the geodesic Discrete Global Grid (DGG) system of Kevin Sahr (2003). | GLOBE (2012) |
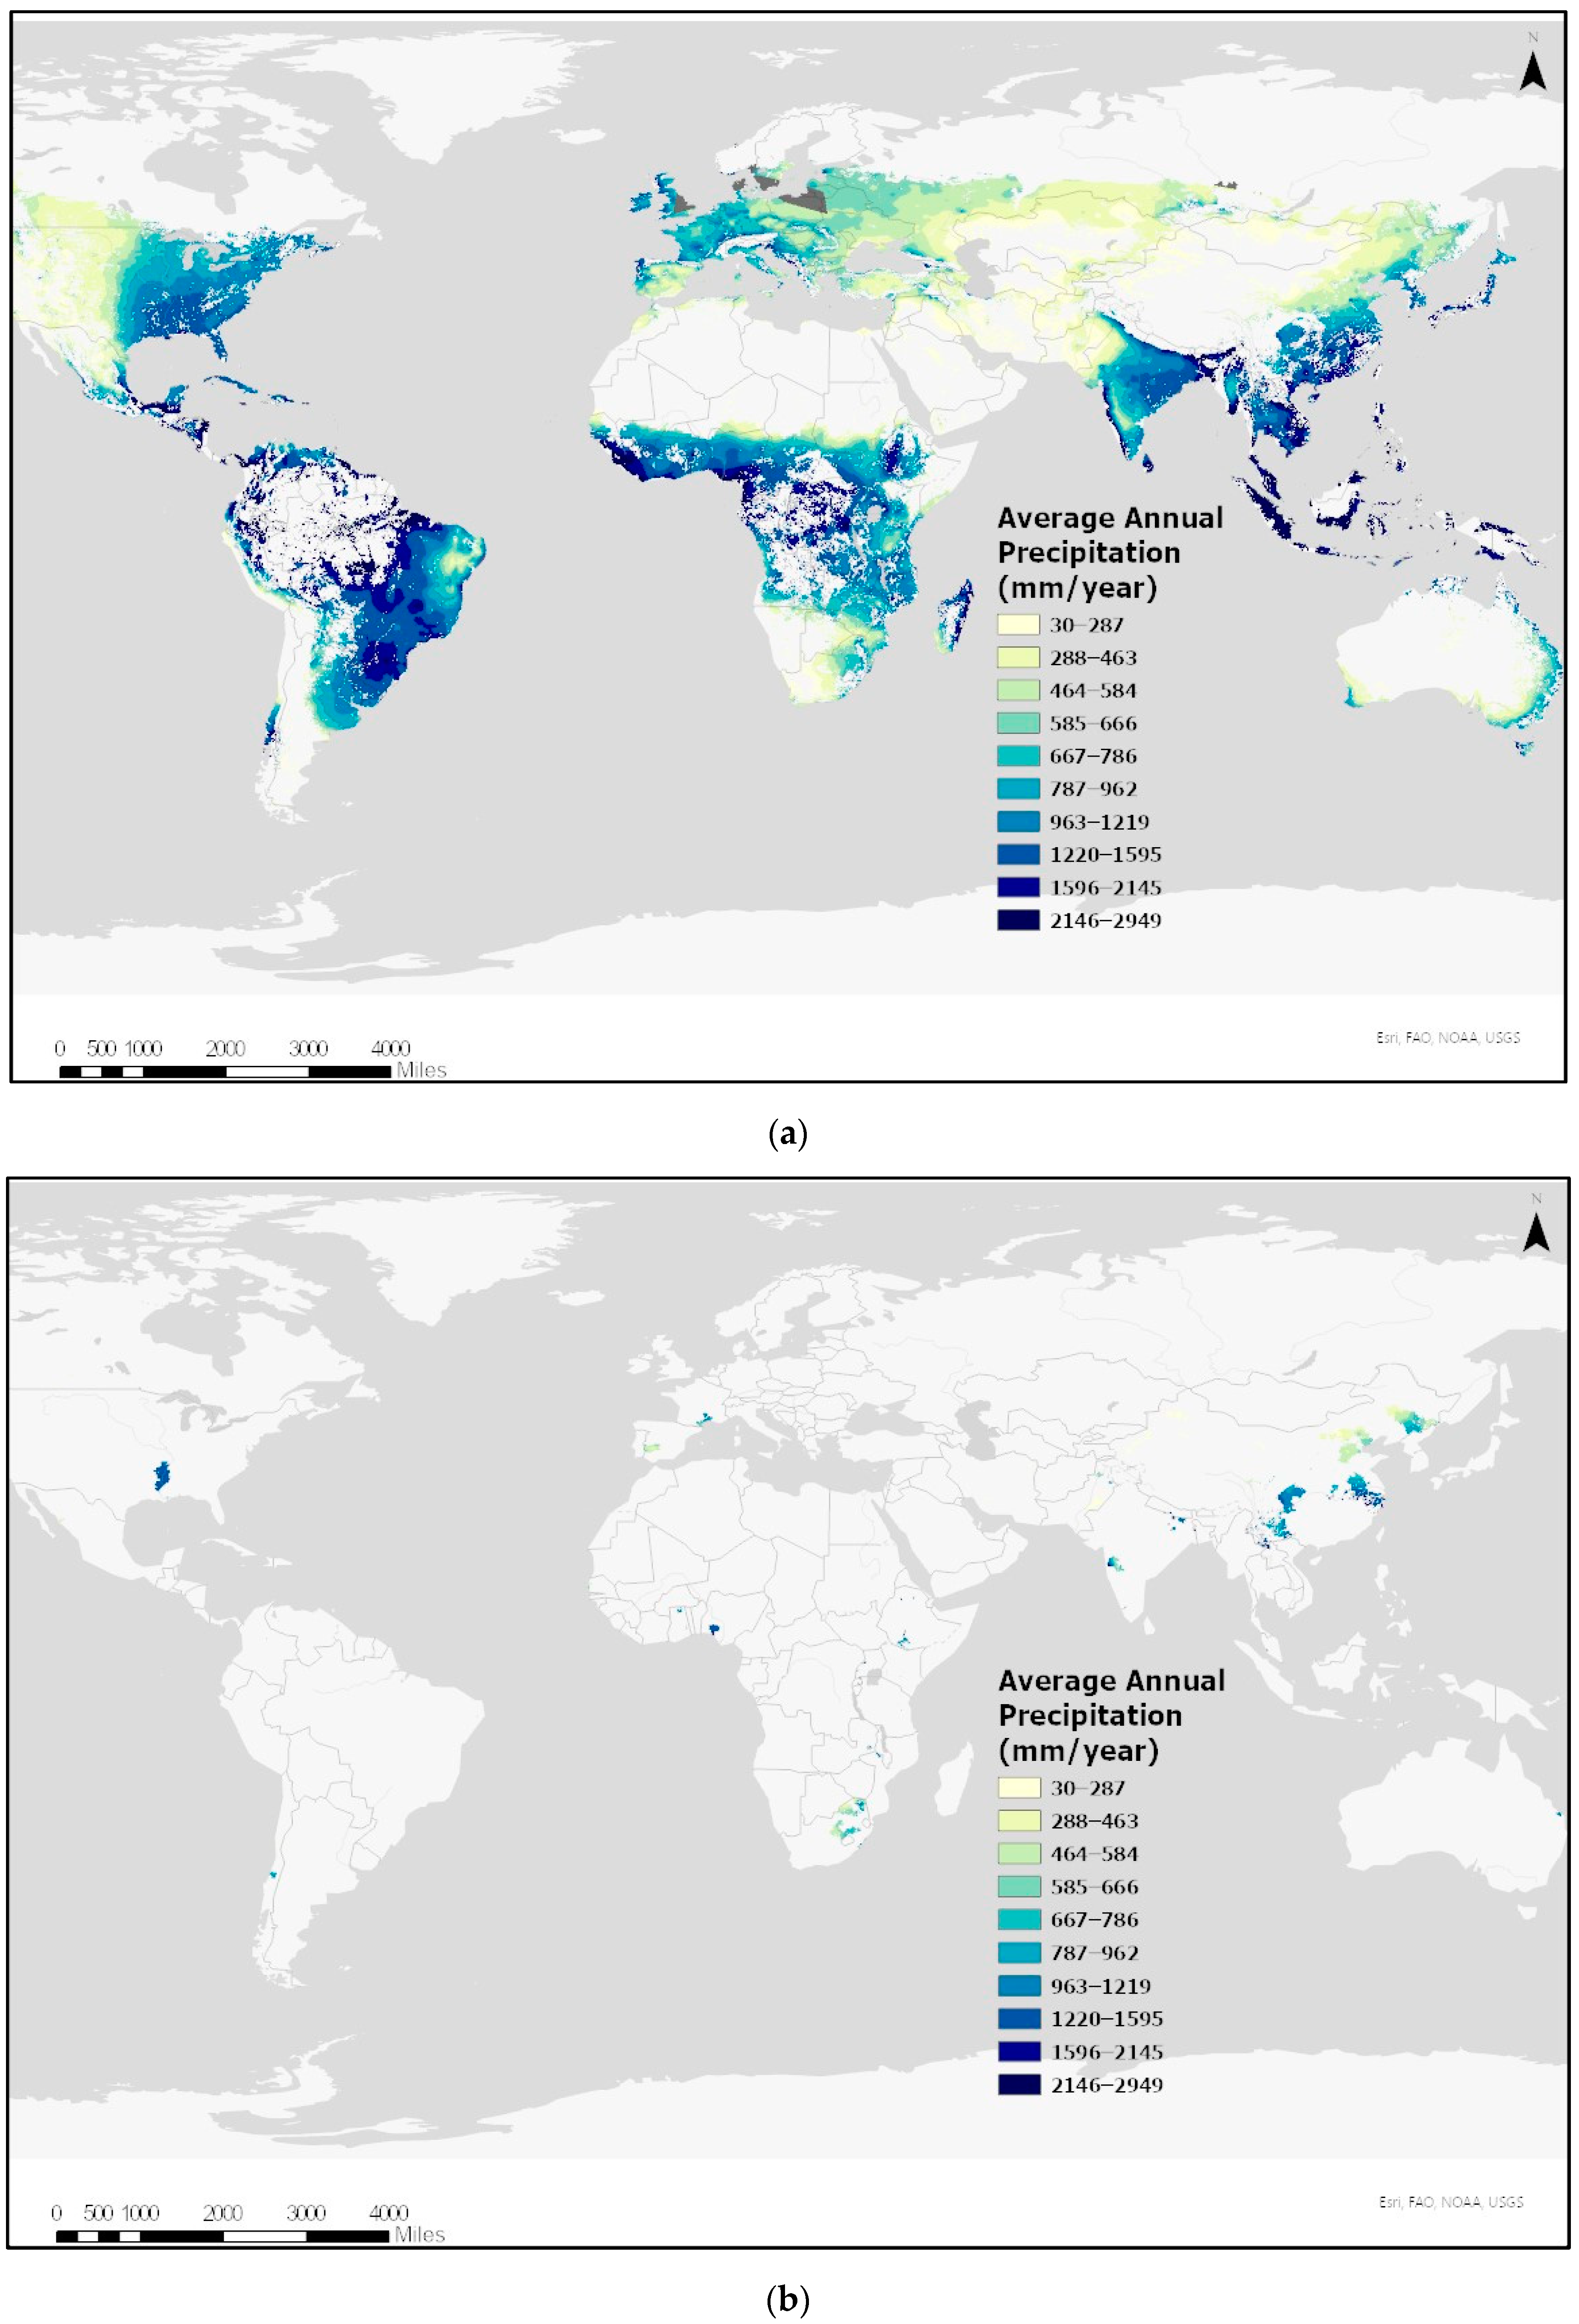
| Average Annual Precipitation | Average annual precipitation (mm/year) from 1950–1999. Native resolution is 30 arcminutes projected in Geographic Coordinate System WGS 1984. | Willmott & Matsuura (2001) [83] |
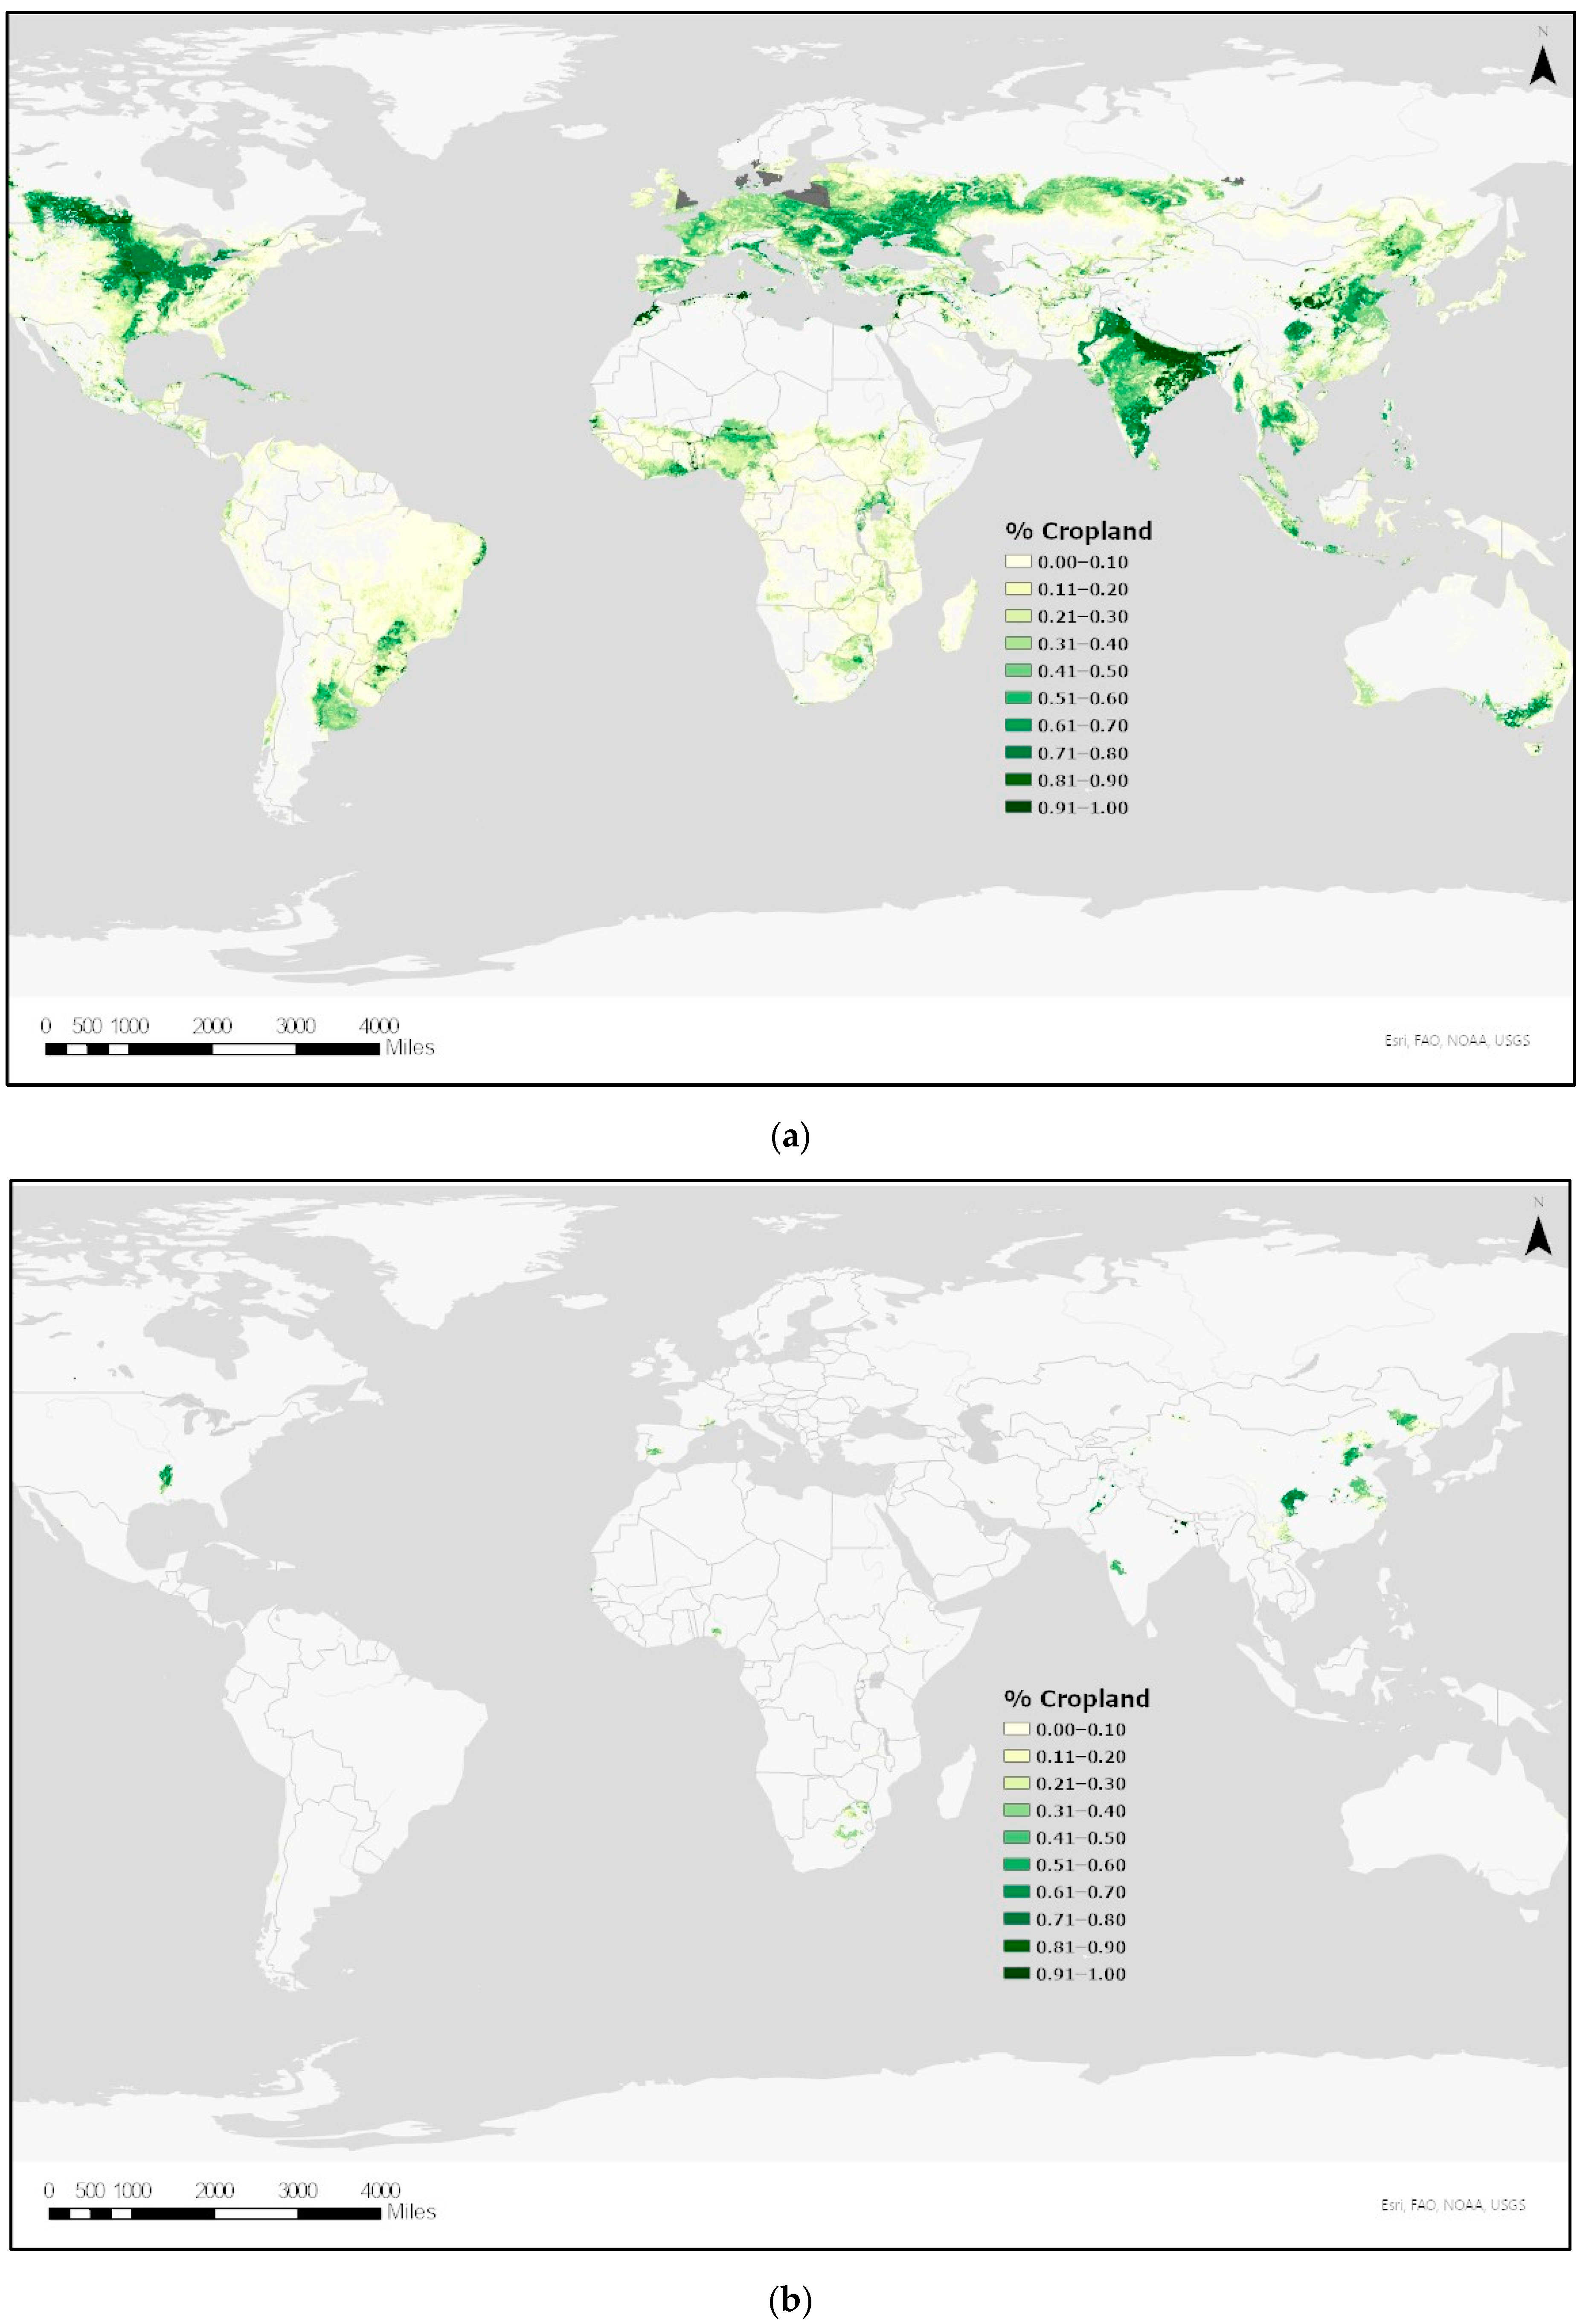
| Percent Crop Area | Percent crop land cover area per grid cell derived from HYDE (History Database of the Global Environment) land cover data. Native resolution is 0.5° projected in Geographic Coordinate System WGS 1984. | Klein Goldewijk et al. (2011) [84] |
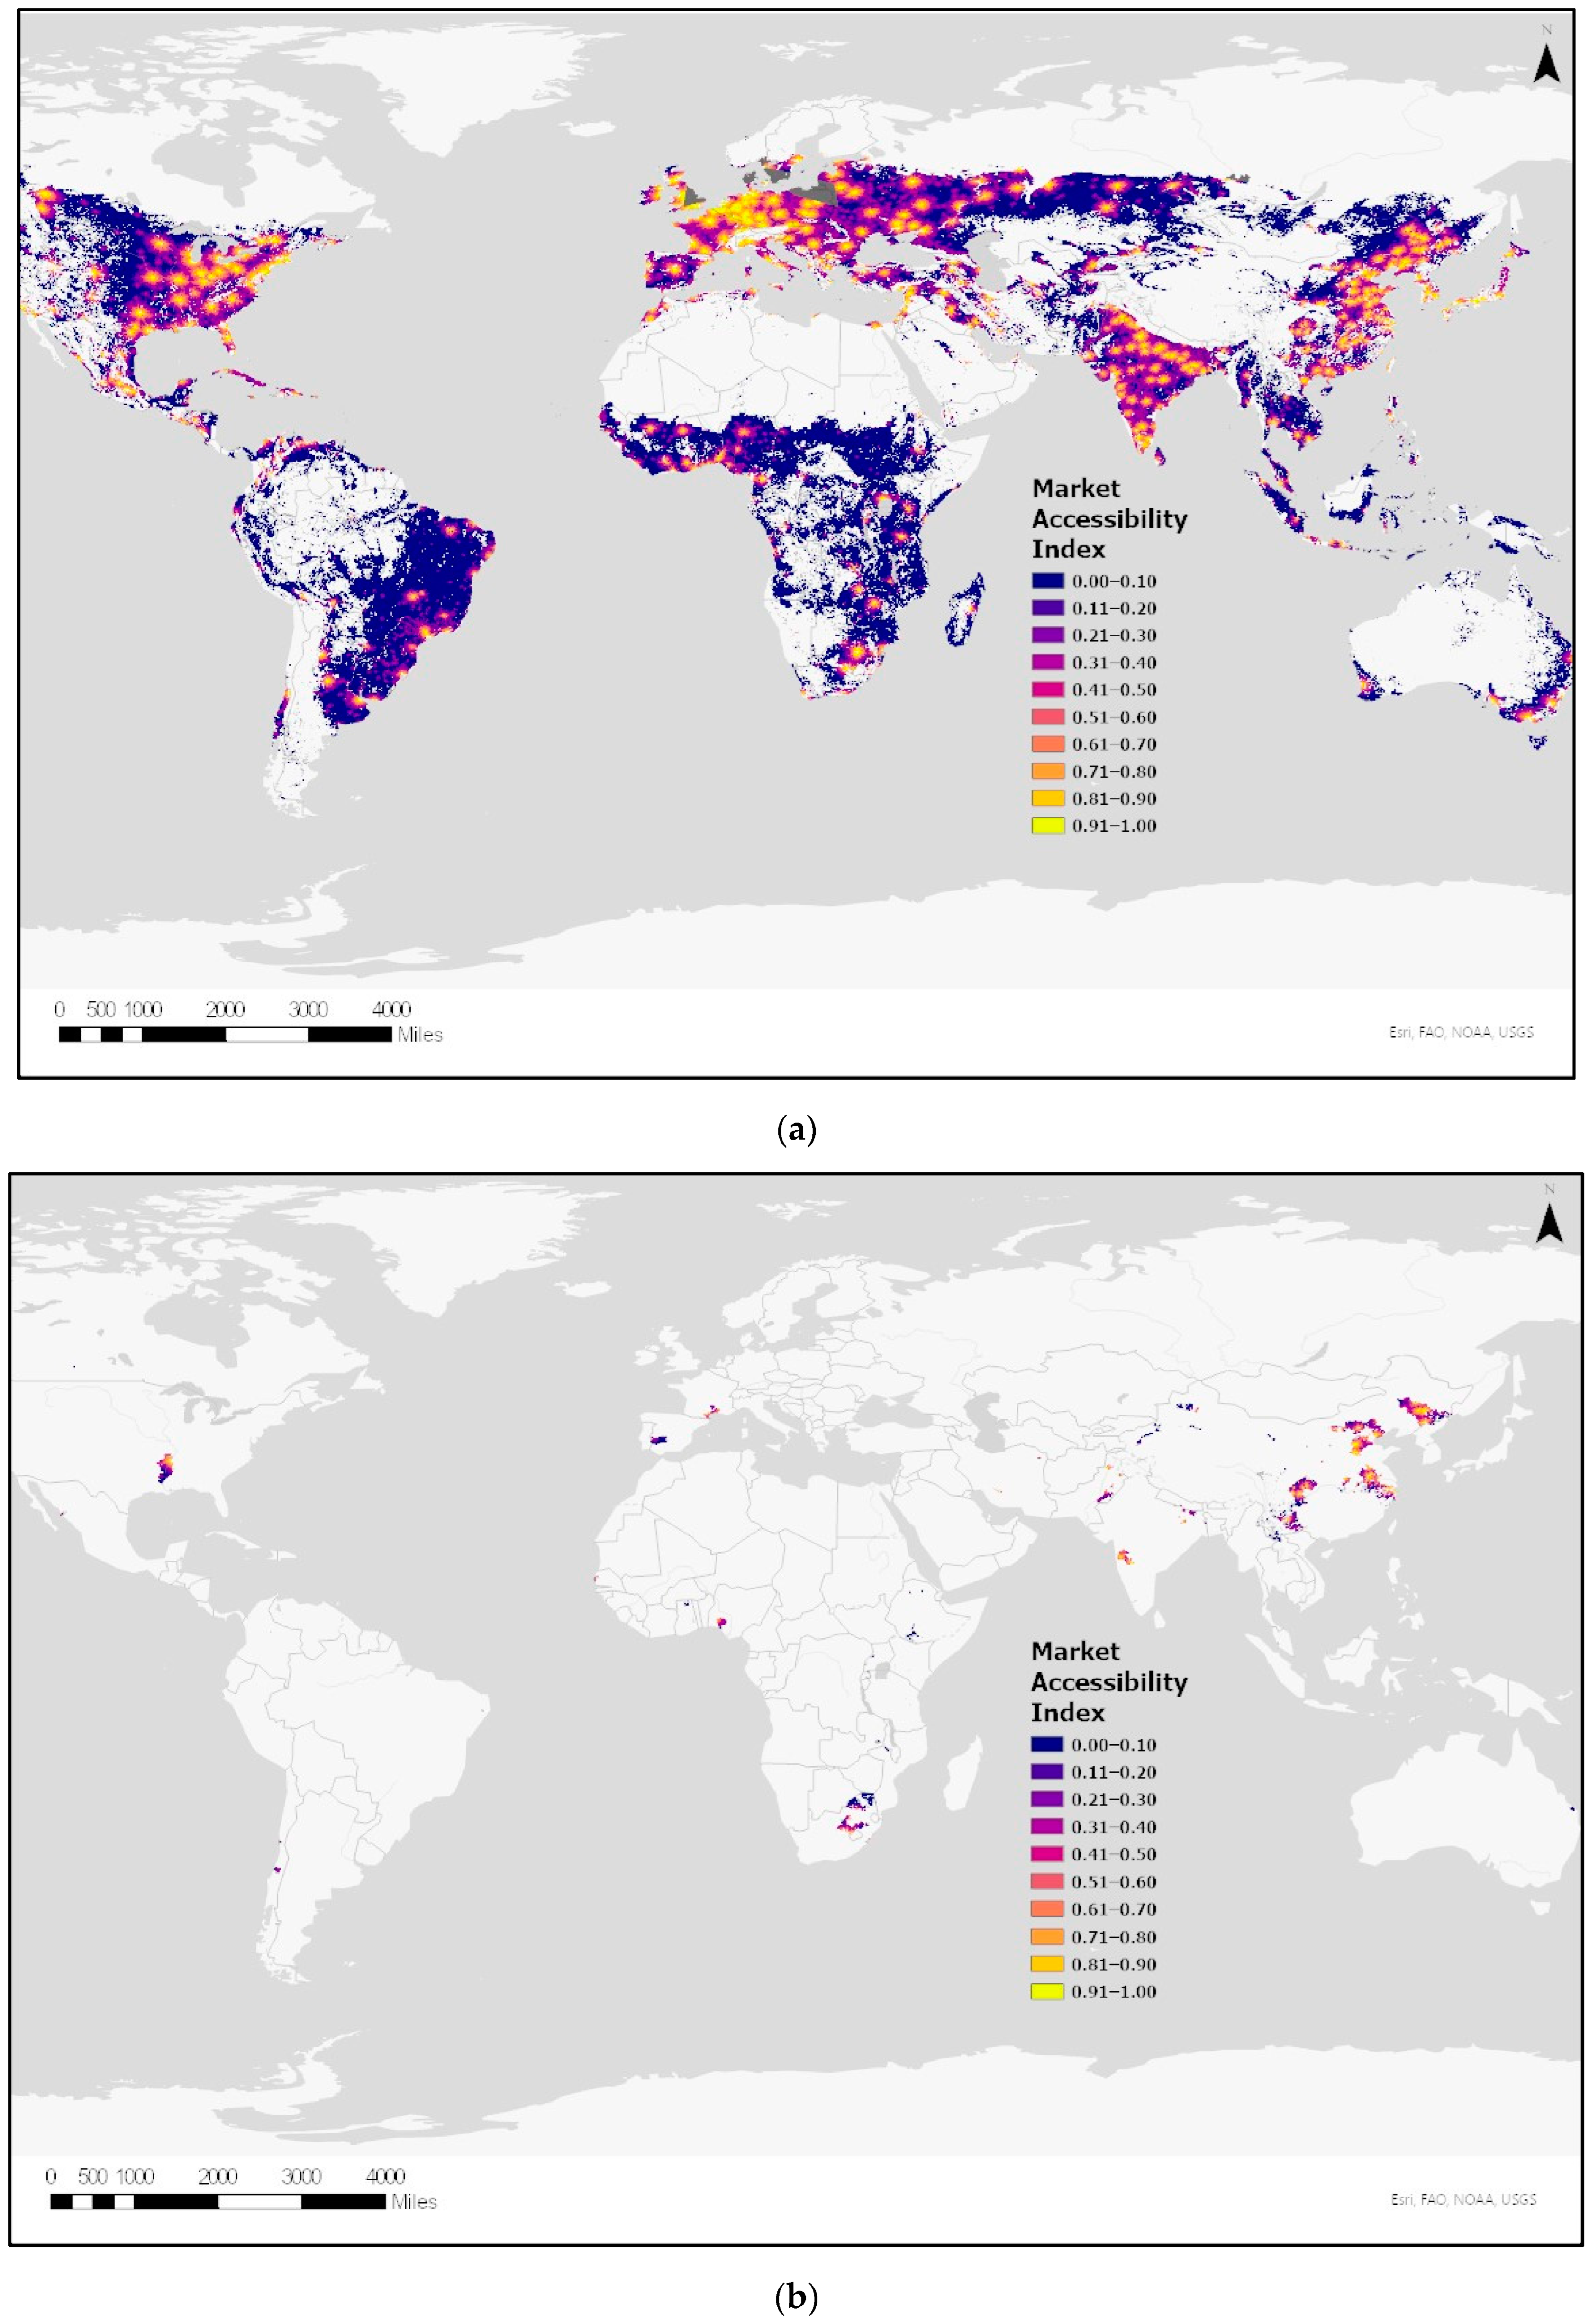
| Market Access Index | Global grid of a normalized market access index based on travel time to cities with populations of at least 50,000 and 750,000. | Verburg et al. (2011) [85] |
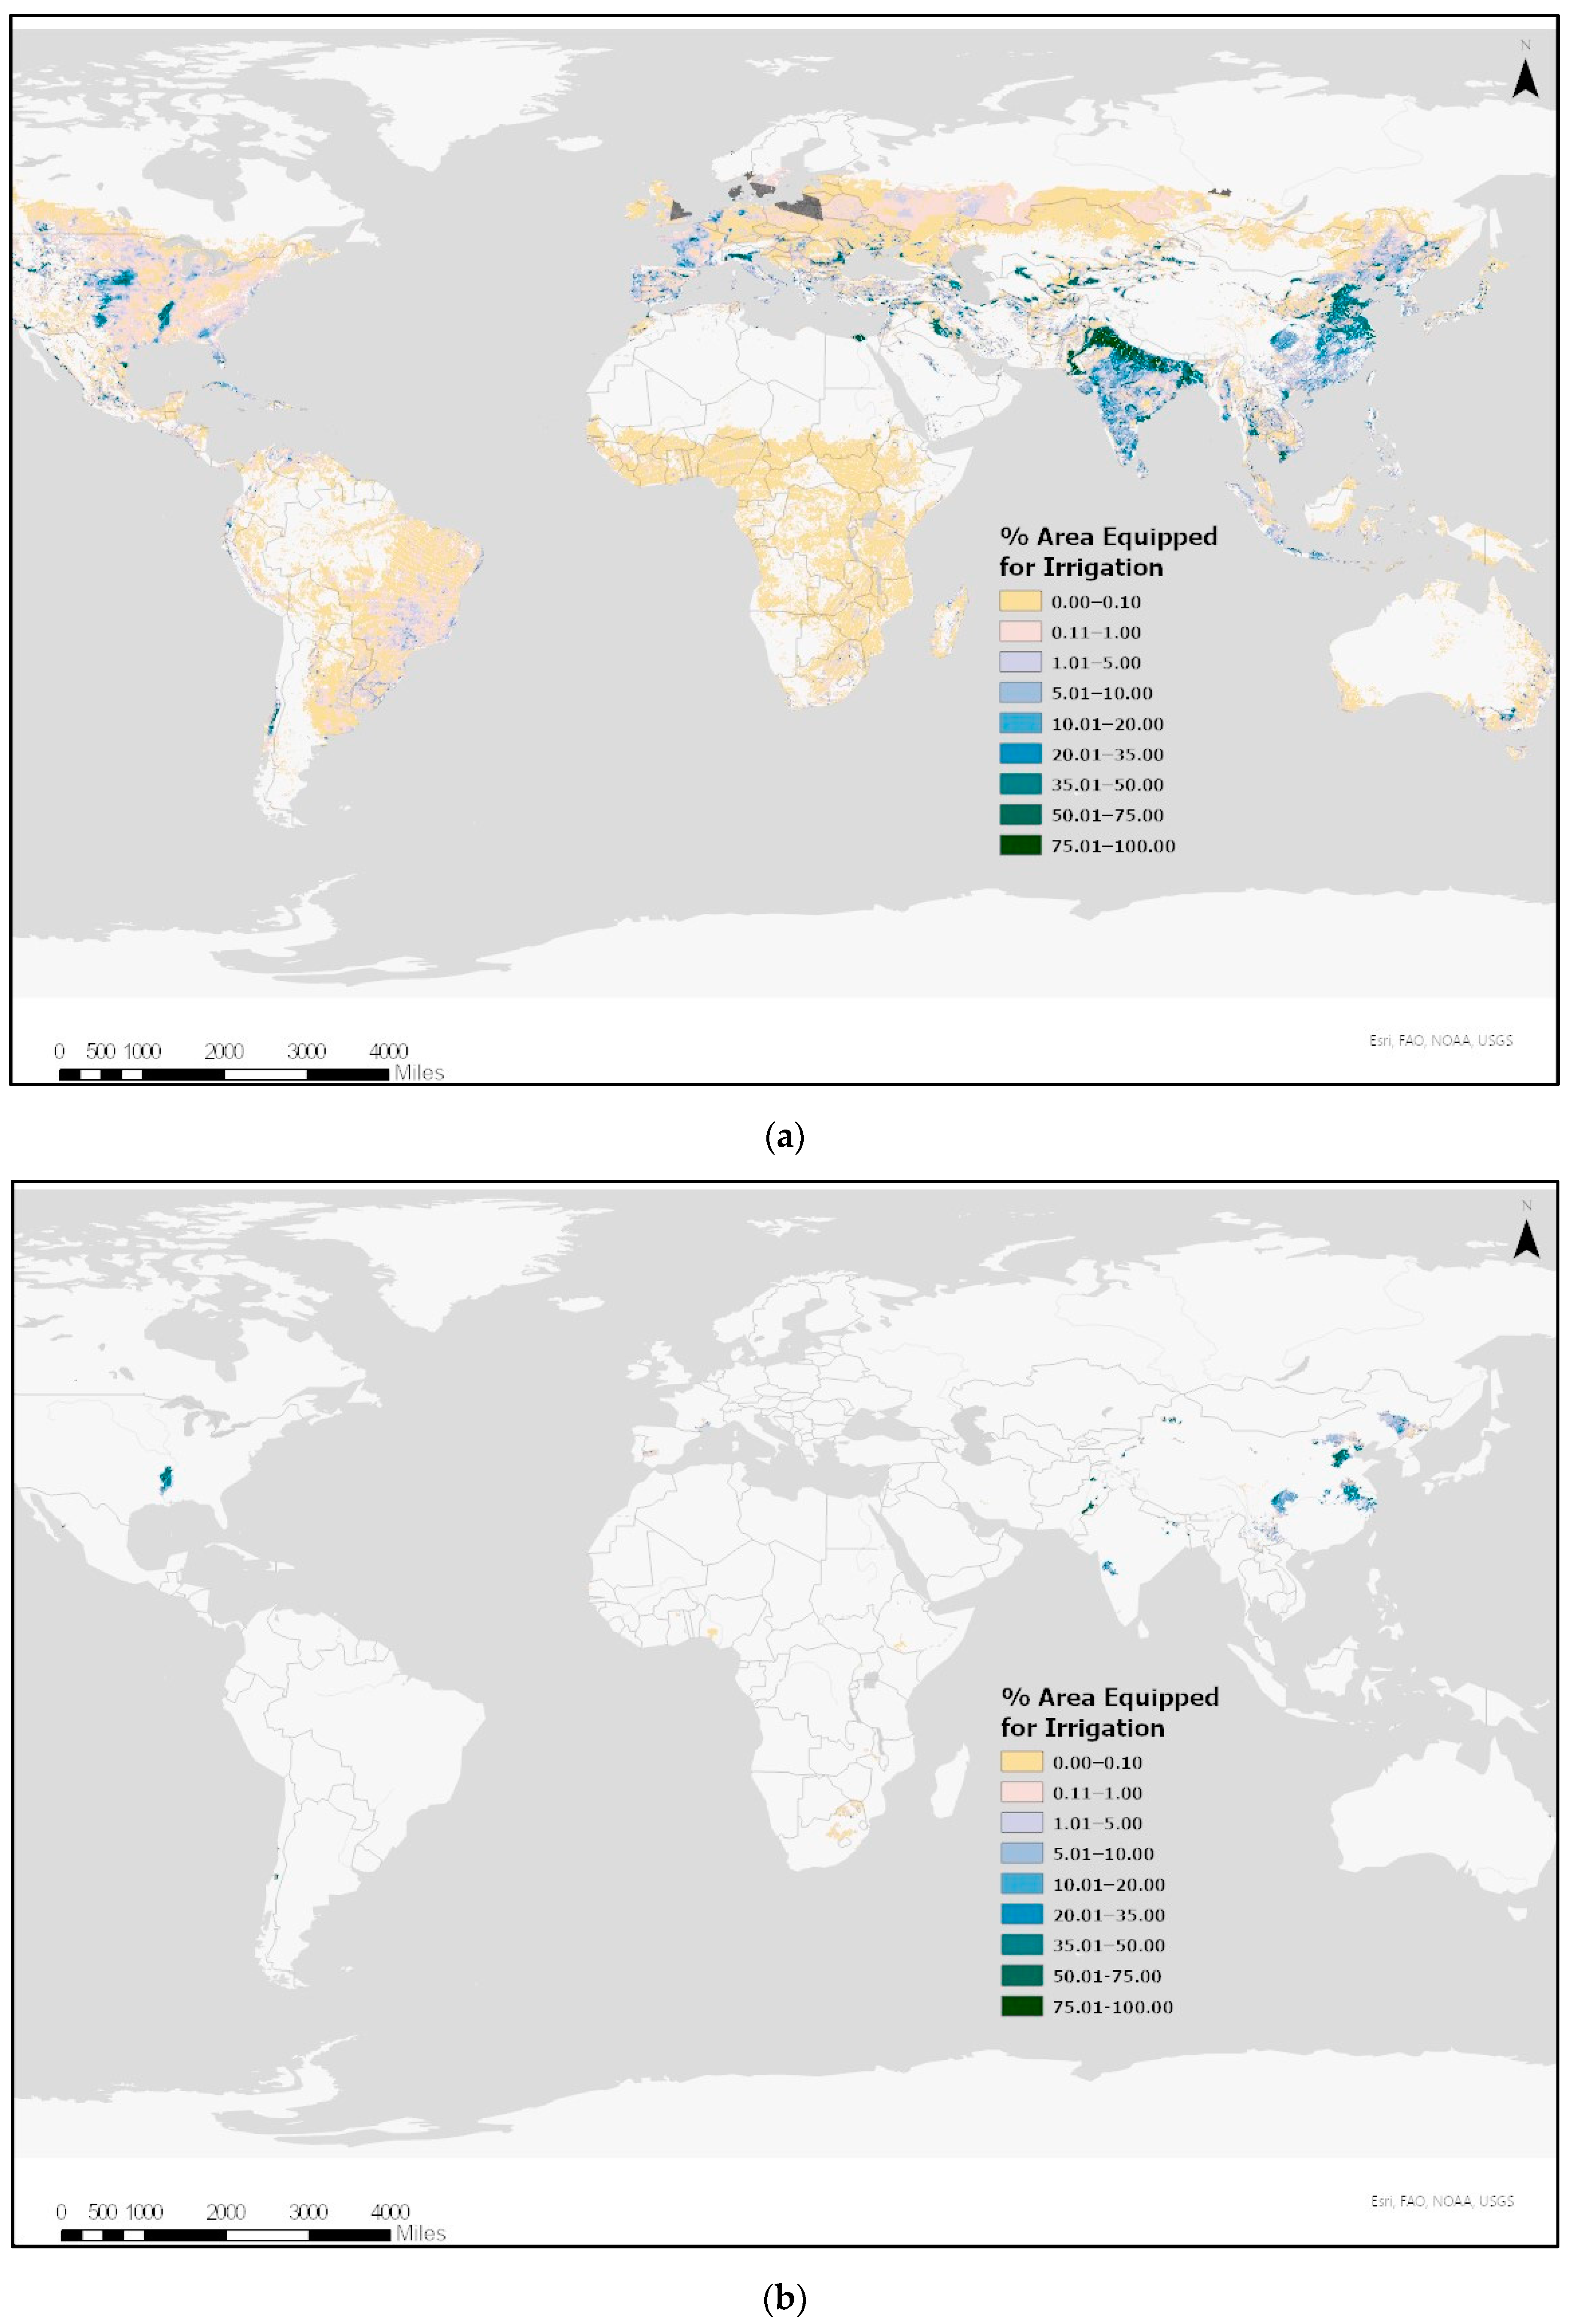
| Percent Area Equipped for Irrigation | Global map of irrigation areas showing the amount of area equipped for irrigation around the year 2000 in the percentage of the total area on a raster with a resolution of 5 min. | Siebert et al. (2005) [86] |
| Variable Name | Description and Source | Filter(s) Applied |
|---|---|---|
| Olson Biomes | Terrestrial ecoregions of the world defined by climate, geology, and evolutionary history from Olson et al. (2001) [98] | Biomes—Boreal forests and Tundra removed. |
| Average Annual Temperature | Average annual temperature (°C) from 1951–2002. Values range from −28 °C to 31 °C. See [97] for more details. | Values greater than 28.57 °C and less than −12.2058 °C removed. |
| Average Annual Precipitation | Average annual precipitation (mm yr−1) from 1950–1999 [83]. Values range from 0–10,572 mm/year. | Values greater than 2948.79 mm/yr and less than 30.0 mm/yr removed. |
| Population Density | Global model of population density from HYDE population model 2000 [84]. Values range from 0–62,018. | Values equal to ‘0’ removed. |
| Percent Land Area | Percentage of land area contained within each GLU cell based on LandScan 2007 by Oak Ridge National Laboratory (2008). See [97] for details. Values range from 0–100% | Values less than 1 removed. |
| Percent Crop Area | Percent crop land cover area per grid cell derived from HYDE land cover data (2000) [84]. Values range from 0–100% | Values equal to ‘0’ removed. |
| Slope Suitability Class | Global grid of land suitability for agriculture based on combined slope constraints [99]. Total 8 classes. | Classes 7 and 8 corresponding to ‘Very Frequent Severe Constraints’ and ‘Unsuitable for Agriculture’, respectively, removed. |
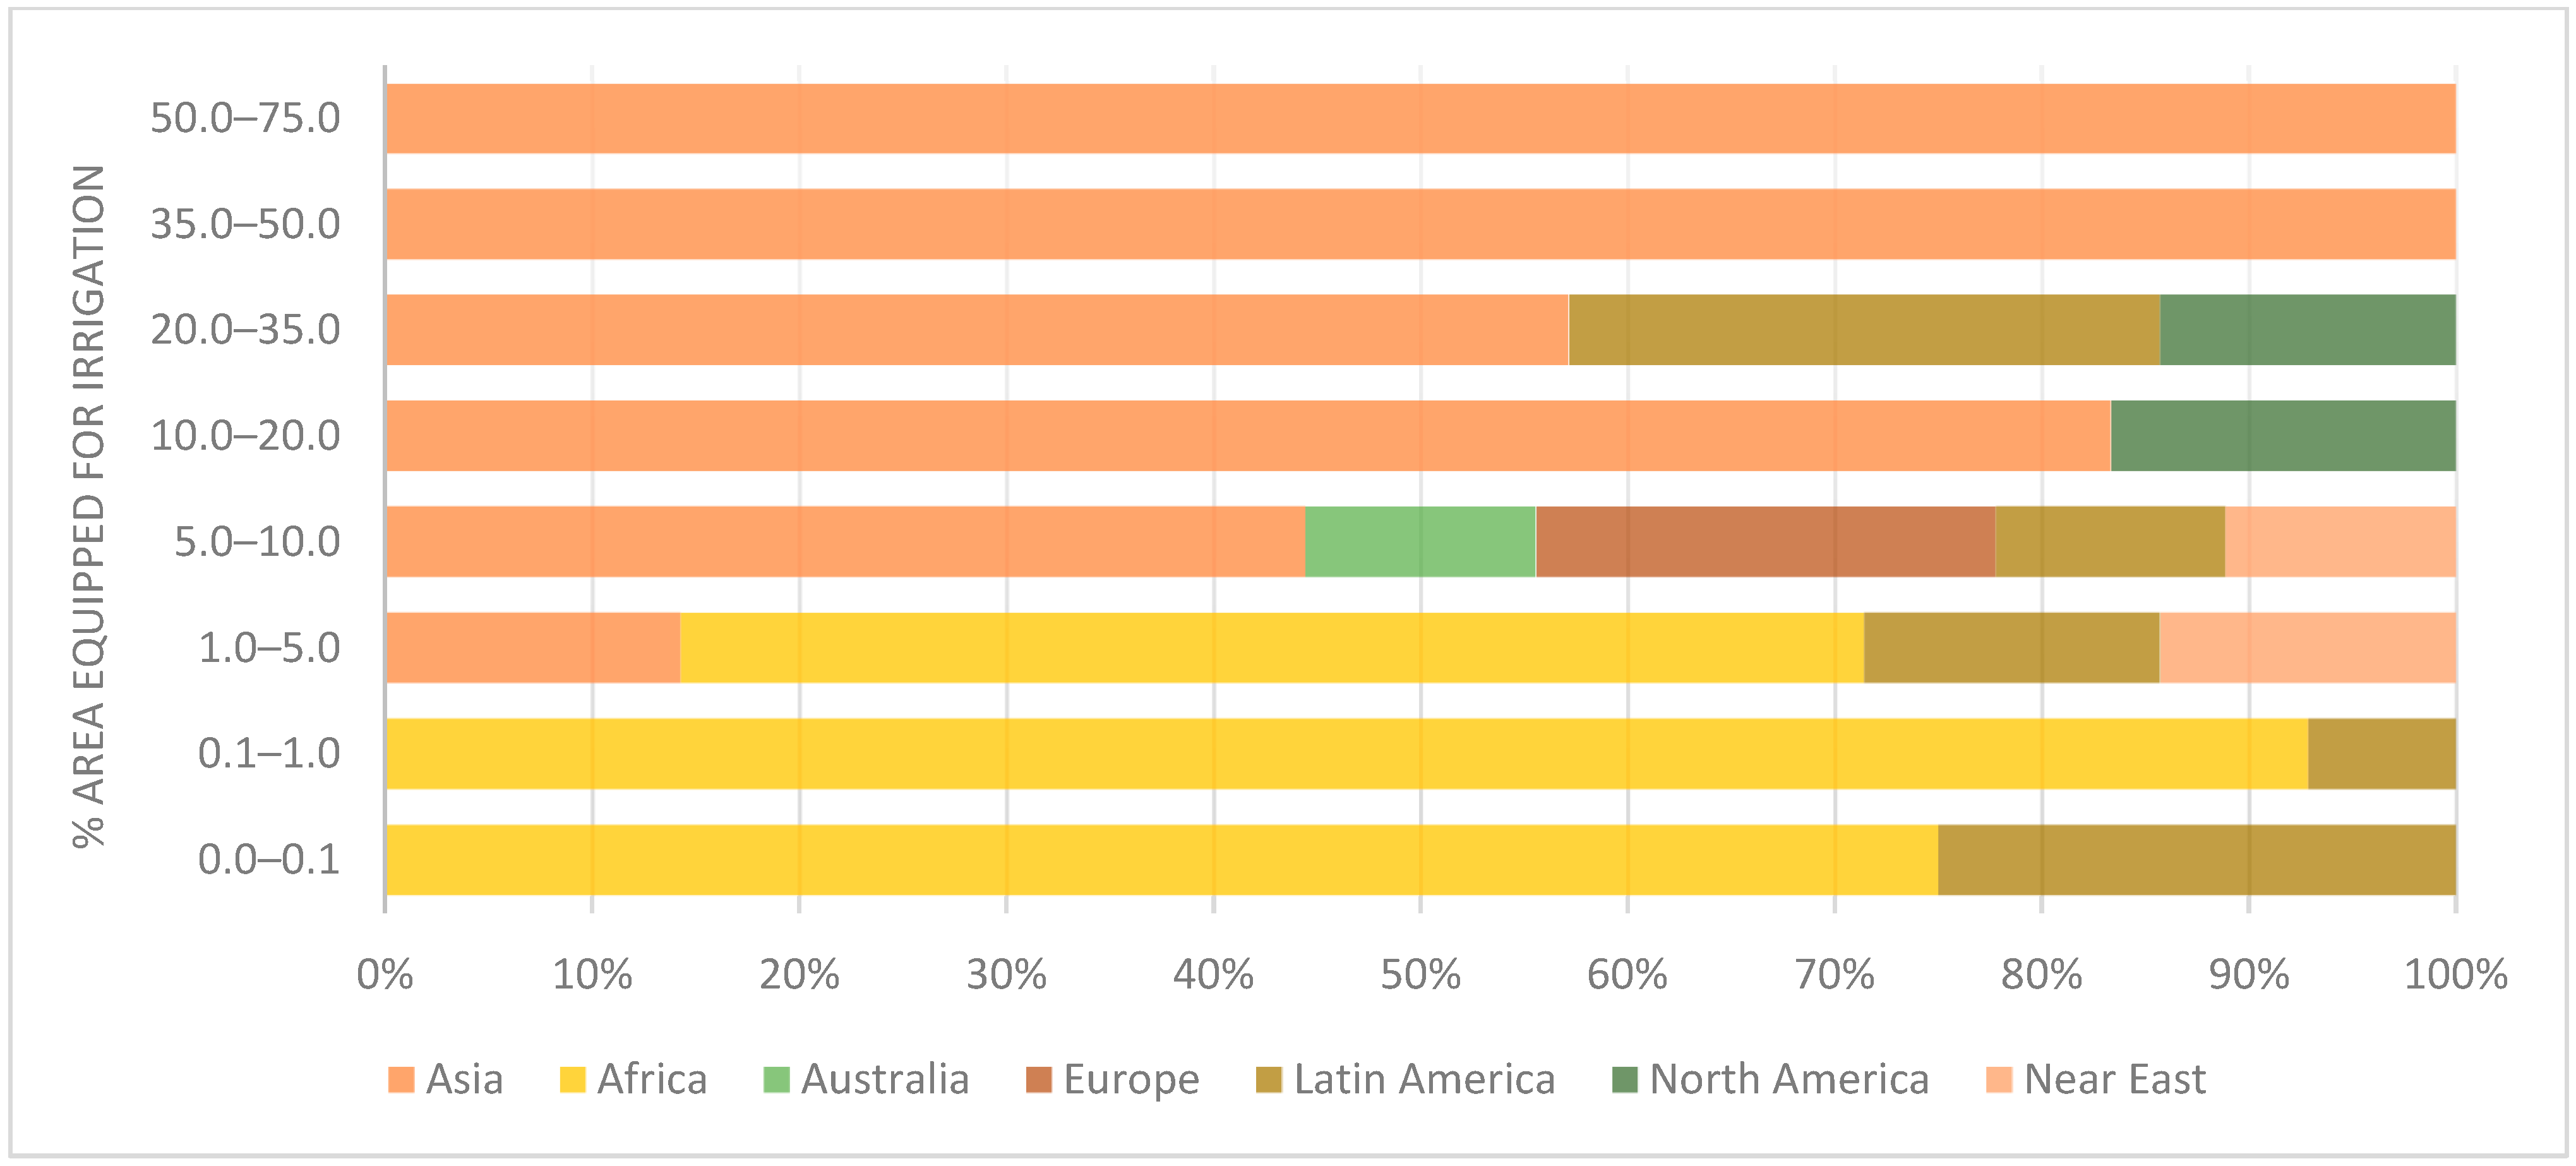
| Bins | Frequency | χ2 Statistic | p-Value * | Representedness Degree | ||
|---|---|---|---|---|---|---|
| Observed | Expected | r-Value ** | Representedness | |||
| 0.0–0.1 | 11469 | 20997 | 4951.870159 | 0.0 | −1 | Highly under |
| 0.1–1.0 | 3634 | 5705 | 524.5160253 | 4.41 × 10−116 | −1 | Highly under |
| 1.0–5.0 | 5375 | 4079 | 203.1462568 | 4.30 × 10−46 | 1 | Highly over |
| 5.0–10.0 | 3571 | 1769 | 654.2752213 | 2.63 × 10−144 | 1 | Highly over |
| 10.0–20.0 | 3875 | 1710 | 906.3700068 | 4.05 × 10−199 | 1 | Highly over |
| 20.0–35.0 | 3589 | 1236 | 1225.836112 | 1.48 × 10−268 | 1 | Highly over |
| 35.0–50.0 | 2482 | 719 | 1013.405549 | 2.19 × 10−222 | 1 | Highly over |
| 50.0–75.0 | 2536 | 694 | 1096.828508 | 1.62 × 10−240 | 1 | Highly over |
| 75.0–100 | 749 | 369 | 130.4361647 | 3.29 × 10⁻³⁰ | 1 | Highly over |
| Total Frequency | 37280 | 37280 | Dist.χ2= 24137.36522 | Dist. p-value = 0.0 | Diagnosis: Highly biased | |
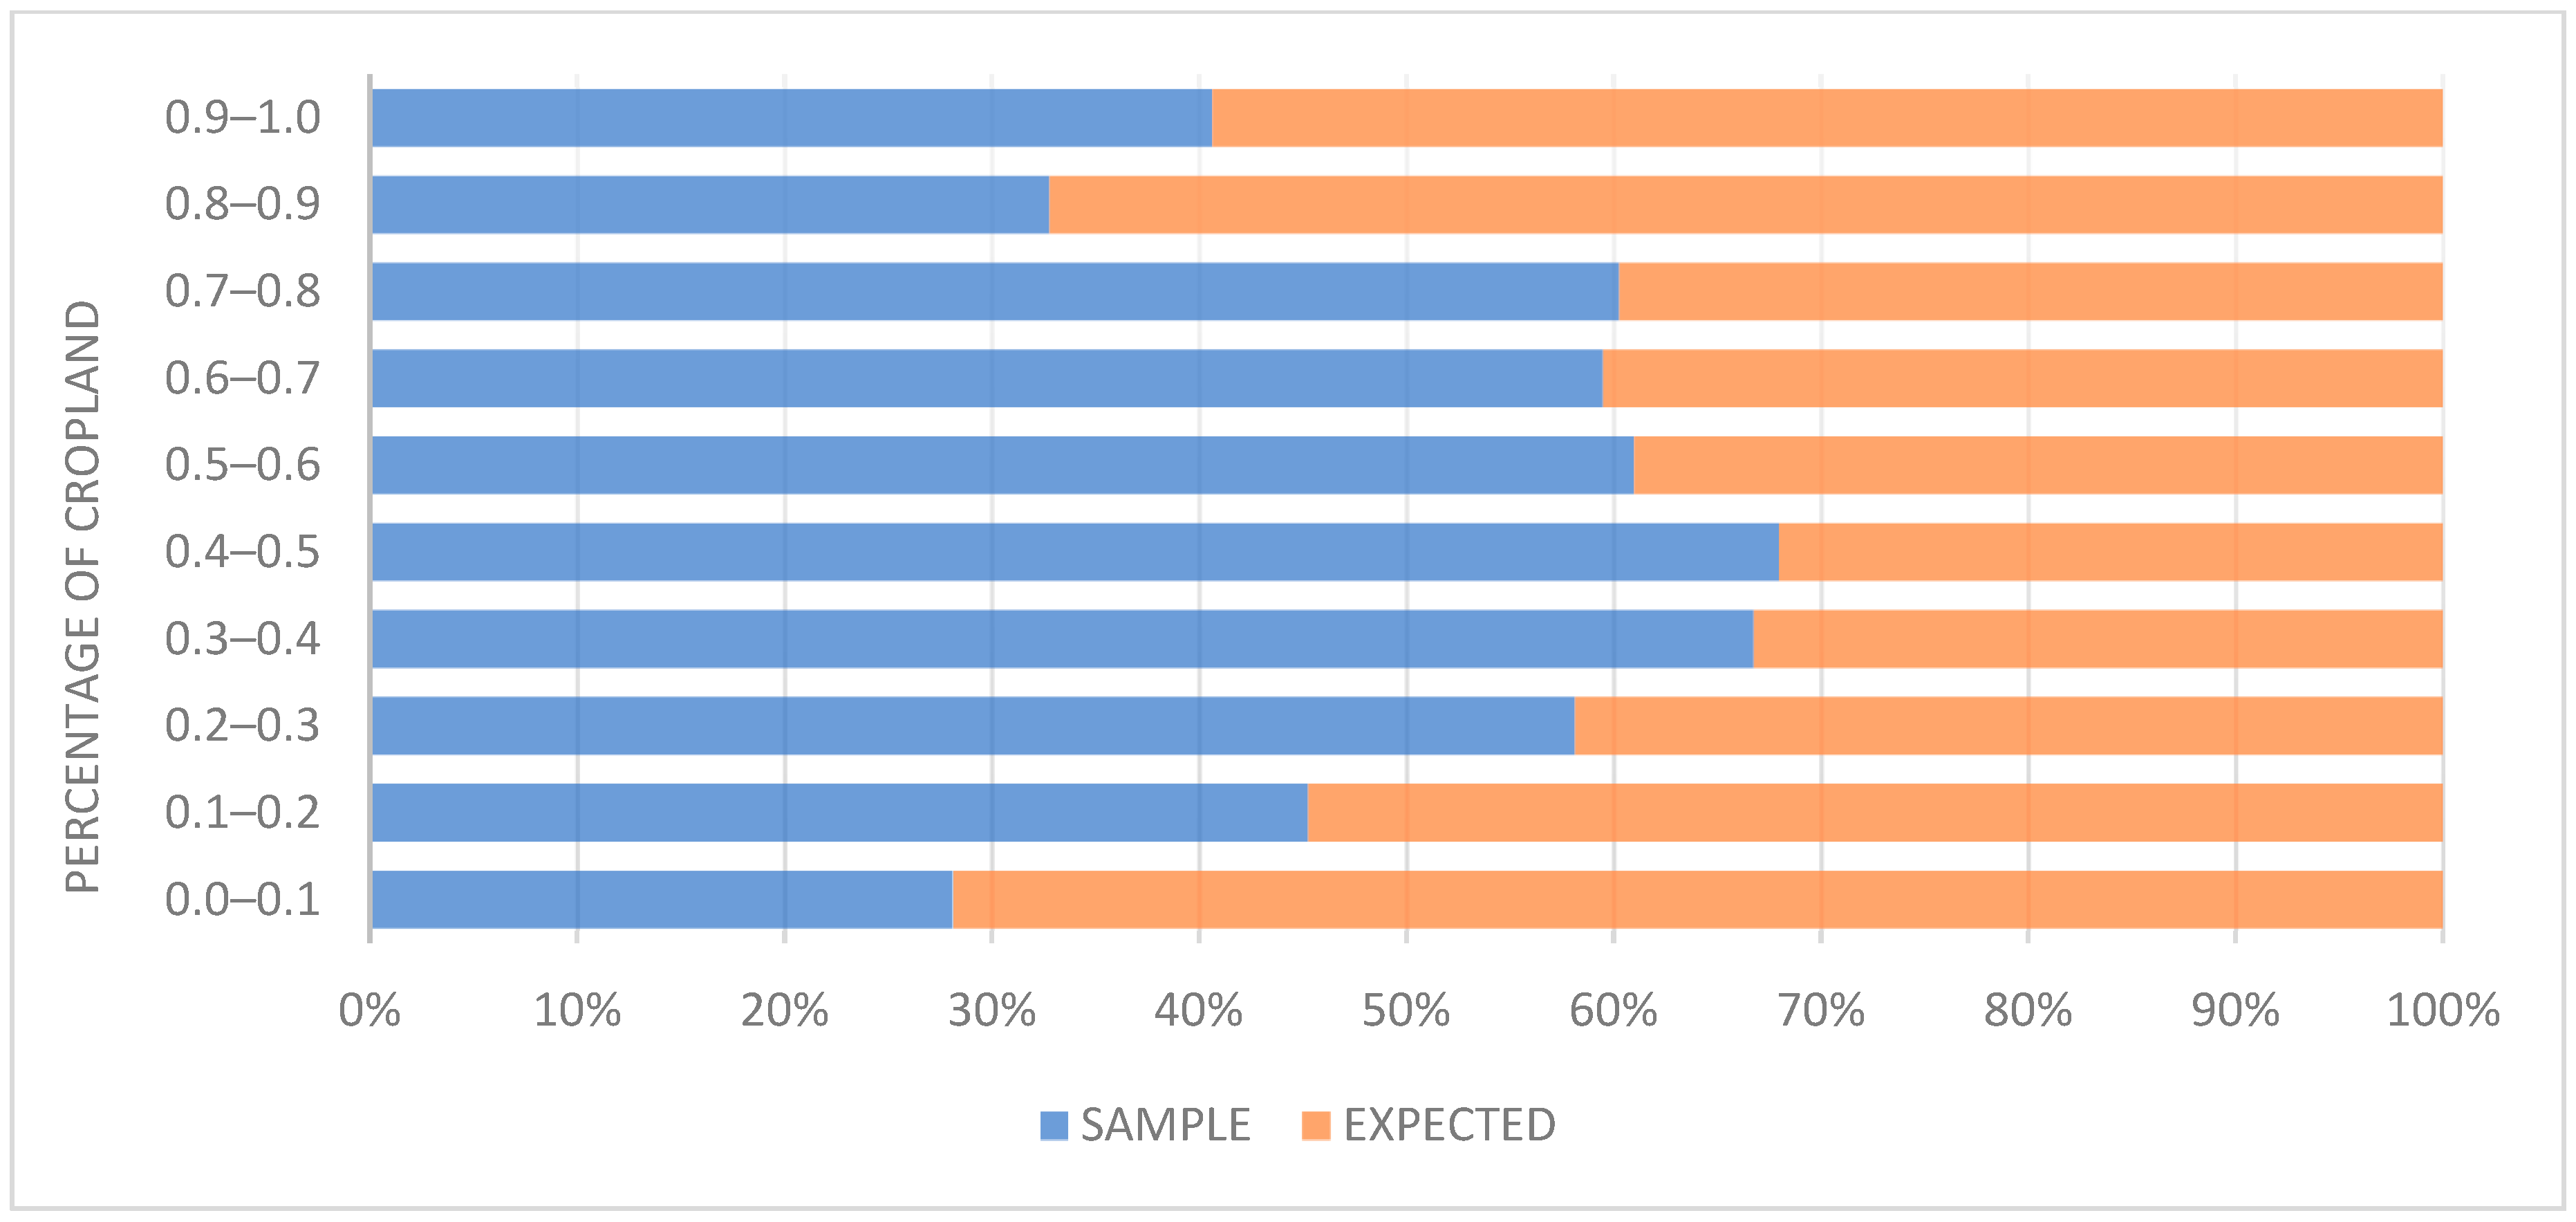
| Bins | Frequency | χ2 Statistic | p-Value * | Representedness Degree | ||
|---|---|---|---|---|---|---|
| Observed | Expected | r-Value ** | Representedness | |||
| 0.0–0.1 | 6219 | 15900 | 5962.41 | 0.0 | −1 | Highly under |
| 0.1–0.2 | 4595 | 5556 | 104.6993983 | 1.42 × 10⁻²⁴ | −1 | Highly under |
| 0.2–0.3 | 5366 | 3863 | 278.0312679 | 2.02 × 10−62 | 1 | Highly over |
| 0.3–0.4 | 6522 | 3245 | 1259.874418 | 5.93 × 10−276 | 1 | Highly over |
| 0.4–0.5 | 6063 | 2856 | 1304.727198 | 1.06 × 10−285 | 1 | Highly over |
| 0.5–0.6 | 3990 | 2551 | 345.7343162 | 3.60 × 10−77 | 1 | Highly over |
| 0.6–0.7 | 2870 | 1954 | 185.2504582 | 3.46 × 10−42 | 1 | Highly over |
| 0.7–0.8 | 2002 | 1319 | 146.4197305 | 1.05 × 10⁻³³ | 1 | Highly over |
| 0.8–0.9 | 203 | 416 | 73.20047746 | 1.17 × 10⁻¹⁷ | −1 | Highly under |
| 0.9–1.0 | 372 | 543 | 31.96753669 | 1.57 × 10−08 | −1 | Highly under |
| Total Frequency | 38202 | 38202 | Dist.χ2= 15313.11155 | Dist. p-value = 0.0 | Diagnosis: Highly biased | |
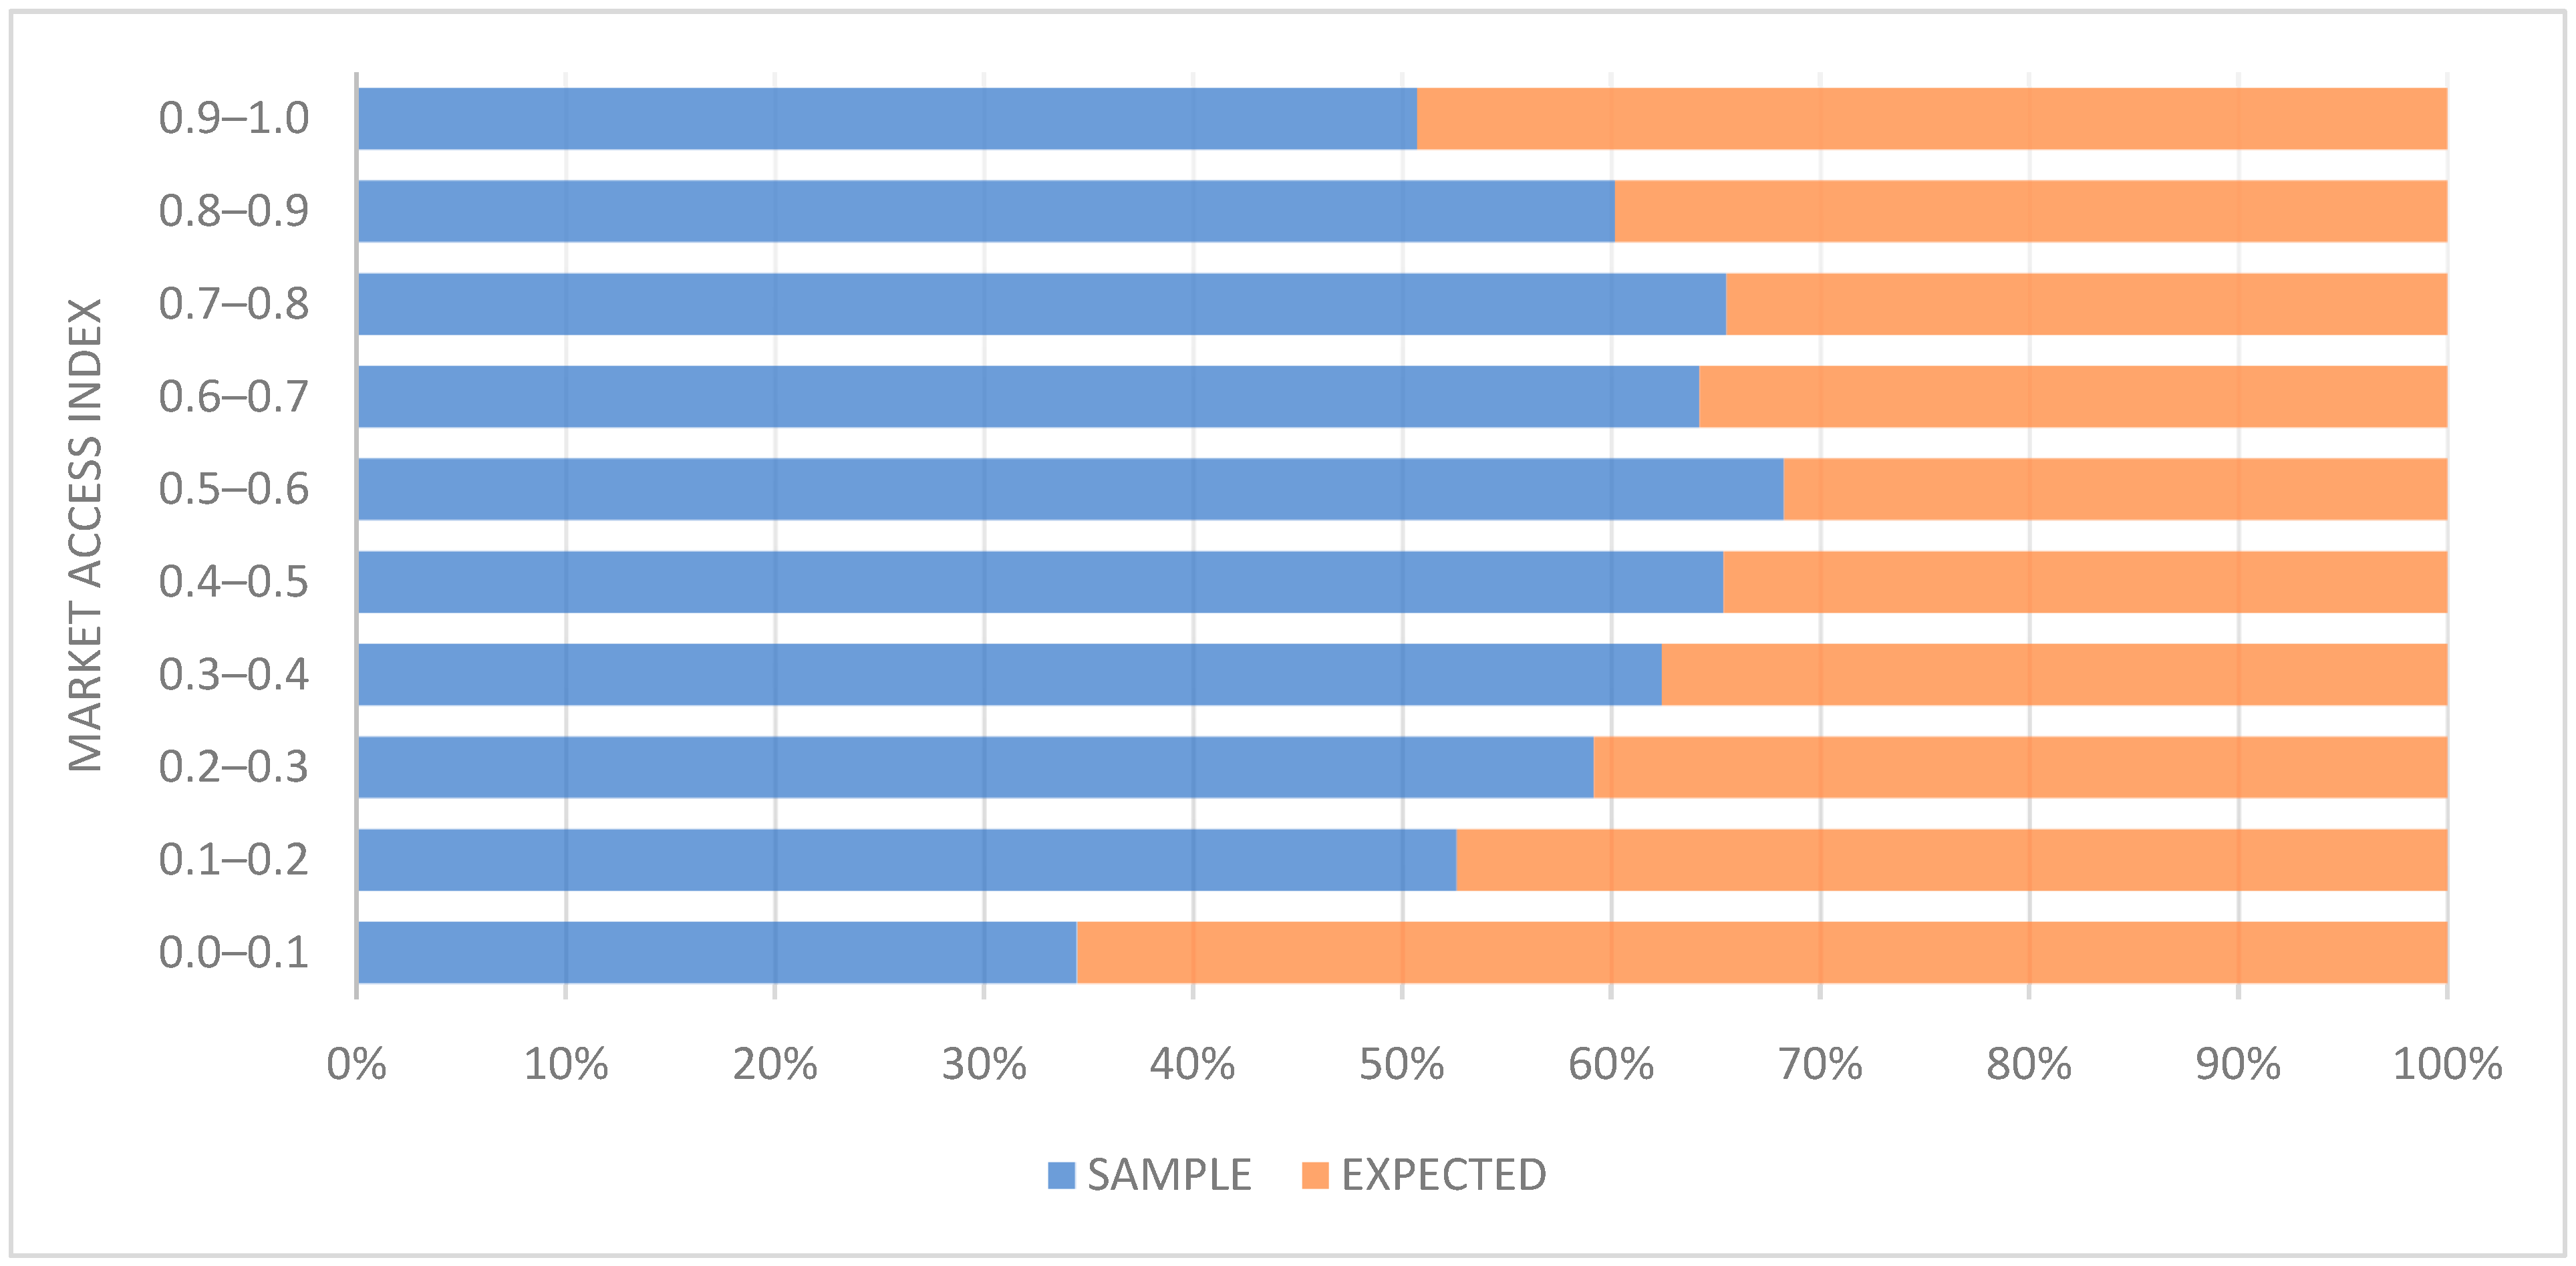
| Bins | Frequency | χ2 Statistic | p-Value * | Representedness Degree | ||
|---|---|---|---|---|---|---|
| Observed | Expected | r-Value ** | Representedness | |||
| 0.0–0.1 | 10902 | 20736 | 5215.919285 | 0.0 | −1 | Highly under |
| 0.1–0.2 | 4340 | 3907 | 25.36746844 | 4.74 × 10−07 | 1 | Highly over |
| 0.2–0.3 | 4618 | 3186 | 292.2496414 | 1.61 × 10−65 | 1 | Highly over |
| 0.3–0.4 | 4448 | 2677 | 484.9267588 | 1.81 × 10−107 | 1 | Highly over |
| 0.4–0.5 | 3919 | 2075 | 614.9158442 | 9.54 × 10−136 | 1 | Highly over |
| 0.5–0.6 | 3187 | 1481 | 663.2799333 | 2.89 × 10−146 | 1 | Highly over |
| 0.6–0.7 | 2398 | 1335 | 317.6479106 | 4.71 × 10−71 | 1 | Highly over |
| 0.7–0.8 | 2228 | 1172 | 342.6063765 | 1.73 × 10−76 | 1 | Highly over |
| 0.8–0.9 | 1503 | 994 | 106.8413592 | 4.82 × 10⁻²⁵ | 1 | Highly over |
| 0.9–1.0 | 659 | 640 | 0.253736593 | 0.61 | 0.4 | Well-represented |
| Total Frequency | 38202 | 38202 | Dist.χ2 = 12191.37033 | Dist. p-value = 0.0 | Diagnosis: Highly biased | |
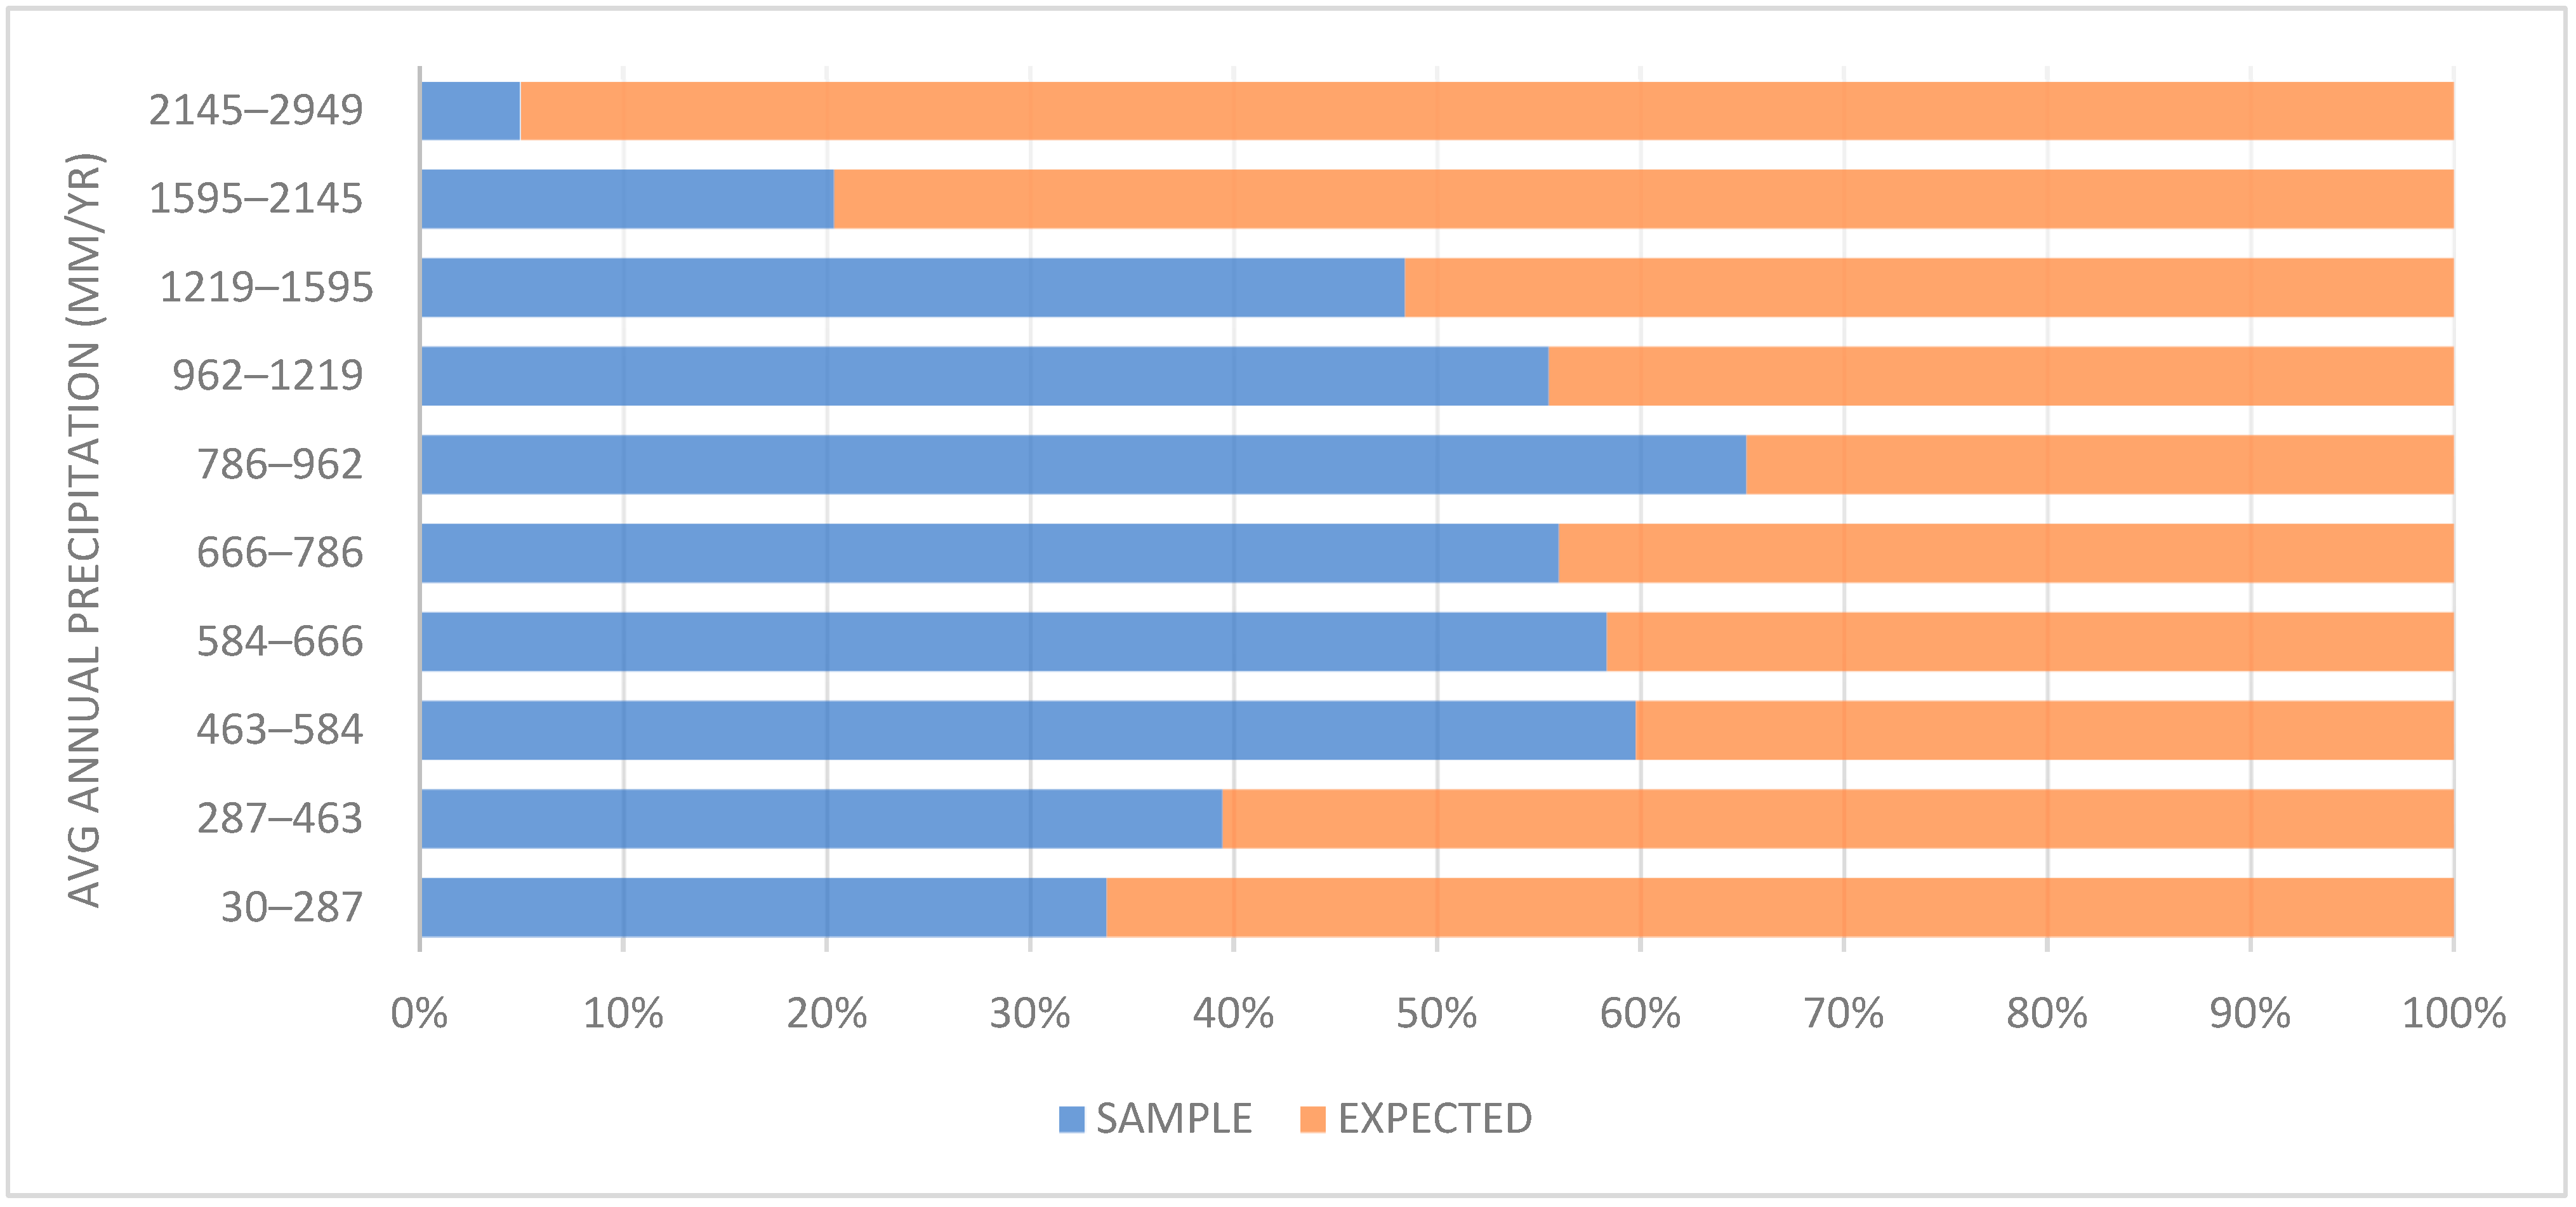
| Bins | Frequency | χ2 Statistic | p-Value * | Representedness Degree | ||
|---|---|---|---|---|---|---|
| Observed | Expected | r-Value ** | Representedness | |||
| 30–287 | 1680 | 3293 | 558.91 | 1.45 × 10−123 | −1 | Highly under |
| 287–463 | 3449 | 5289 | 437.02 | 4.83 × 10−97 | −1 | Highly under |
| 463–584 | 6537 | 4397 | 488.33 | 3.28 × 10−108 | 1 | Highly over |
| 584–666 | 3444 | 2457 | 178.54 | 1.01 × 10−40 | 1 | Highly over |
| 666–786 | 3819 | 2999 | 108.02 | 2.66 × 10⁻²⁵ | 1 | Highly over |
| 786–962 | 6864 | 3658 | 1132.16 | 3.39 × 10−248 | 1 | Highly over |
| 962–1219 | 6137 | 4917 | 157.17 | 4.71 × 10−36 | 1 | Highly over |
| 1219–1595 | 5319 | 5660 | 12.30 | 4.54 × 10−04 | −1 | Highly under |
| 1595–2145 | 835 | 3261 | 1517.03 | 0.0 | −1 | Highly under |
| 2145–2949 | 118 | 2270 | 2000.03 | 0.0 | −1 | Highly under |
| Total Frequency | 38202 | 38202 | Dist.χ2= 10070.33756 | Dist. p-value = 0.0 | Diagnosis: Highly biased | |
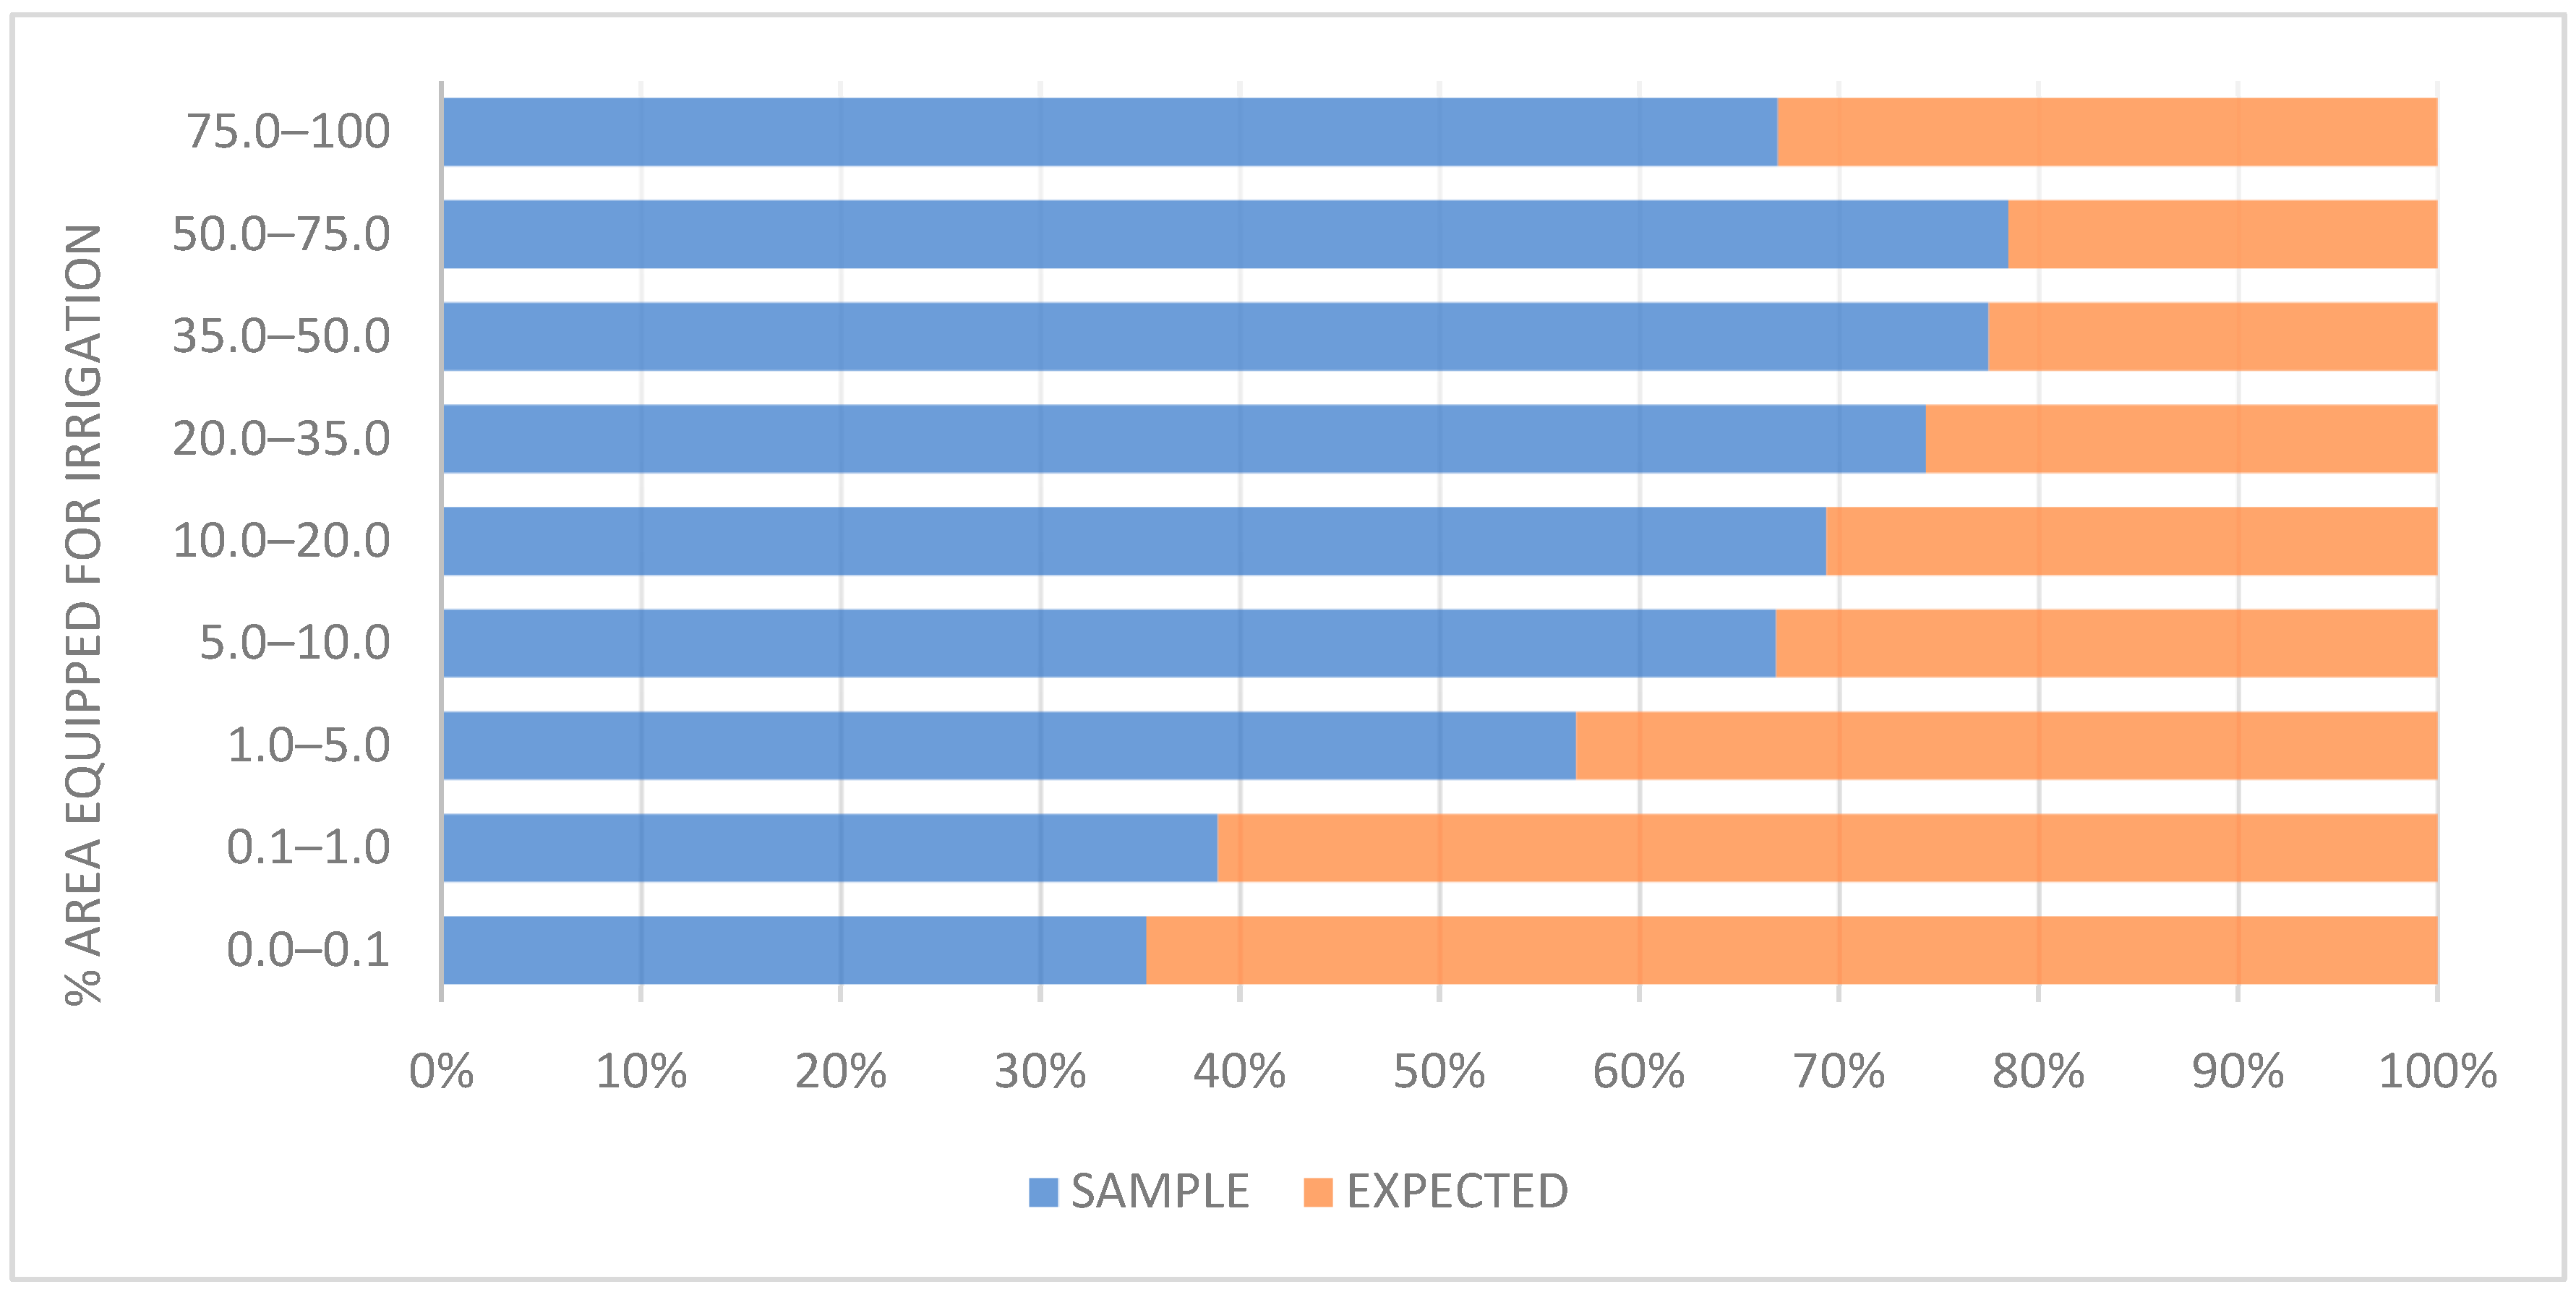
| Percentage of Irrigation | No. of Cases | Degree of Representedness |
|---|---|---|
| 0.0–0.1 | 4 | Highly under |
| 0.1–1.0 | 14 | Highly under |
| 1.0–5.0 | 7 | Highly over |
| 5.0–10.0 | 9 | Highly over |
| 10.0–20.0 | 6 | Highly over |
| 20.0–35.0 | 7 | Highly over |
| 35.0–50.0 | 2 | Highly over |
| 50.0–75.0 | 4 | Highly over |
| Study Sites | Asia (n = 20) | Africa (n = 20) | Australia (n = 1) | Europe (n = 2) | Latin America (n = 6) | North America (n = 2) | Near East (n = 2) | All Cases (n = 53) | |
|---|---|---|---|---|---|---|---|---|---|
| Factors | |||||||||
| SINGLE-FACTOR | |||||||||
| B | 0 | 1 | 0 | 0 | 0 | 0 | 0 | 1 | |
| D | 1 | 0 | 0 | 0 | 0 | 0 | 0 | 1 | |
| TWO FACTORS | |||||||||
| B, I | 0 | 1 | 0 | 0 | 0 | 0 | 0 | 1 | |
| D, S | 2 | 1 | 0 | 0 | 0 | 0 | 0 | 3 | |
| B, D | 1 | 0 | 0 | 0 | 0 | 0 | 0 | 1 | |
| THREE FACTORS | |||||||||
| D, S, T | 0 | 0 | 0 | 1 | 0 | 0 | 0 | 1 | |
| B, D, G | 0 | 1 | 0 | 0 | 0 | 0 | 0 | 1 | |
| I, S, T | 0 | 1 | 0 | 1 | 0 | 0 | 0 | 2 | |
| B, D, F | 0 | 0 | 0 | 0 | 1 | 0 | 0 | 1 | |
| D, F, S | 1 | 0 | 0 | 0 | 0 | 0 | 1 | 2 | |
| B, D, T | 0 | 1 | 0 | 0 | 1 | 0 | 0 | 2 | |
| B, S, T | 0 | 1 | 0 | 0 | 0 | 0 | 0 | 1 | |
| D, G, S | 1 | 0 | 0 | 0 | 0 | 0 | 0 | 1 | |
| B, D, S | 1 | 0 | 0 | 0 | 1 | 0 | 0 | 2 | |
| FOUR FACTORS | |||||||||
| B, D, F, S | 3 | 2 | 0 | 0 | 0 | 0 | 1 | 6 | |
| B, D, F, G | 1 | 0 | 0 | 0 | 0 | 0 | 0 | 1 | |
| B, D, I, S | 0 | 0 | 0 | 0 | 0 | 1 | 0 | 1 | |
| D, G, I, S | 0 | 1 | 0 | 0 | 0 | 0 | 0 | 1 | |
| D, G, S, T | 0 | 1 | 0 | 0 | 0 | 0 | 0 | 1 | |
| B, F, G, S | 0 | 1 | 0 | 0 | 0 | 0 | 0 | 1 | |
| D, F, I, S | 0 | 1 | 0 | 0 | 0 | 0 | 0 | 1 | |
| D, F, S, T | 0 | 0 | 1 | 0 | 1 | 0 | 0 | 2 | |
| B, D, G, T | 0 | 1 | 0 | 0 | 0 | 0 | 0 | 1 | |
| D, F, G, S | 1 | 1 | 0 | 0 | 1 | 0 | 0 | 3 | |
| FIVE FACTORS | |||||||||
| B, D, G, I, S | 0 | 1 | 0 | 0 | 0 | 0 | 0 | 1 | |
| B, D, F, I, S | 2 | 2 | 0 | 0 | 0 | 1 | 0 | 5 | |
| B, D, F, G, S | 2 | 0 | 0 | 0 | 1 | 0 | 0 | 3 | |
| B, D, G, S, T | 0 | 1 | 0 | 0 | 0 | 0 | 0 | 1 | |
| B, F, G, I, S | 0 | 1 | 0 | 0 | 0 | 0 | 0 | 1 | |
| B, D, F, G, T | 1 | 0 | 0 | 0 | 0 | 0 | 0 | 1 | |
| SIX FACTORS | |||||||||
| B, D, F, G, I, S | 3 | 0 | 0 | 0 | 0 | 0 | 0 | 3 | |
| TOTAL CASES | 20 | 20 | 1 | 2 | 6 | 2 | 2 | 53 | |
Publisher’s Note: MDPI stays neutral with regard to jurisdictional claims in published maps and institutional affiliations. |
© 2022 by the authors. Licensee MDPI, Basel, Switzerland. This article is an open access article distributed under the terms and conditions of the Creative Commons Attribution (CC BY) license (https://creativecommons.org/licenses/by/4.0/).
Share and Cite
Pathak, R.; Magliocca, N.R. Assessing the Representativeness of Irrigation Adoption Studies: A Meta-Study of Global Research. Agriculture 2022, 12, 2105. https://doi.org/10.3390/agriculture12122105
Pathak R, Magliocca NR. Assessing the Representativeness of Irrigation Adoption Studies: A Meta-Study of Global Research. Agriculture. 2022; 12(12):2105. https://doi.org/10.3390/agriculture12122105
Chicago/Turabian StylePathak, Ruchie, and Nicholas R. Magliocca. 2022. "Assessing the Representativeness of Irrigation Adoption Studies: A Meta-Study of Global Research" Agriculture 12, no. 12: 2105. https://doi.org/10.3390/agriculture12122105