Article

Can the Sorghum Planting Industry in Less-Favoured Areas Promote the Income Increase of Farmers? An Empirical Study of Survey Data from 901 Samples in Luquan County

1
School of Economics, Yunnan University of Finance and Economics, Kunming 650221, China
2
Institute of Land & Resources and Sustainable Development, Yunnan University of Finance and Economics, Kunming 650221, China
3
Institute of Targeted Poverty Alleviation and Development, Yunnan University of Finance and Economics, Kunming 650221, China
*
Author to whom correspondence should be addressed.
Agriculture 2022, 12(12), 2107; https://doi.org/10.3390/agriculture12122107
Submission received: 11 November 2022 / Revised: 4 December 2022 / Accepted: 6 December 2022 / Published: 8 December 2022
(This article belongs to the Special Issue Agricultural Development Strategies for Less-Favoured Areas)

Abstract

:
Poverty alleviation is the basic requirement of human social development. However, there is still a lack of quantitative research on the poverty alleviation effect of regional, characteristic industries. Few studies have focused on the increase of micro individual income and used more advanced policy evaluation tools for comparative analysis based on a quasi-experimental perspective. In addition, the existing research ignores the critical question: can characteristic industries really achieve sustainable development goals while bringing poverty alleviation results? We studied regional, characteristic industries from a new perspective, taking into account the poverty alleviation effect and regional sustainable development. Based on the survey data of 901 households of representative village committees of Tanglang and Dache in Luquan Yi and Miao Autonomous County, this study quantitatively analyzed the poverty alleviation effect of the sorghum planting industry by using the Propensity Score Matching Difference-in-Differences (PSM-DID) model. The adoption of the industrial alleviation policy has significantly increased the per capita net income of rural households in Tanglang and Dache village committees, by 2171.64 CNY and 1945.06 CNY, respectively. The estimation results of the whole sample show that the effect of the policy to the per capita net income of households is 1726.87 CNY. The development of the sorghum planting poverty alleviation industry in Luquan County has promoted income increase of households significantly, creating economic, social and ecological sustainability, and can provide a reference for less-favoured areas.

1. Introduction

Poverty is a serious challenge in the world today, and restricts local sustainable development to a great extent. Poverty alleviation is a basic requirement of human social development [1,2]. In September 2015, the United Nations proposed to eliminate poverty in all forms and manifestations in the world by 2030 [3,4,5]. However, there are still many impoverished people in the world who have insufficient food and clothing. How can absolute poverty be completely eliminated? As one of the largest developing countries in the world, China shoulders a heavy responsibility in fighting poverty. Since the reform and opening up, China has had problems such as unclear poverty alleviation strategies and unclear poverty alleviation targets, leading to the existence of a large number of impoverished people in a long period of time. To ensure that no one falls behind on the road to building a moderately prosperous society in all respects, China urgently needs targeted poverty alleviation [6]. Since 2014, the targeted poverty alleviation policy implemented by China has effectively changed this situation. The targeted poverty alleviation policy requires the “six elements of targeted poverty alleviation” in poverty alleviation, implements “five-pronged poverty alleviation measures”, solves the “four key issues”, and becomes a Chinese solution of poverty reduction in the world.
China’s targeted poverty alleviation policy has attracted worldwide attention. Many scholars have studied China’s poverty reduction from different perspectives. For example, Xu Guoyin et al. (2022) studied the effect of e-commerce in China’s region and its spillover effect on poverty alleviation from the perspective of sustainable development [7]. In addition, Zou Qi et al. (2019) analyzed the effects of poverty reduction policy on health services utilization among the rural poor by a quasi-experimental study [8]. Zou Cunming et al. (2019) took Tongyu County as an example to analyze the effect of poverty alleviation in different places [9]. Although there are various perspectives to study the effectiveness of poverty alleviation, industrial poverty alleviation plays a decisive role [10,11,12], ranking first among the “five-pronged poverty alleviation measures” [13,14,15]. It is urgent to make an accurate and scientific assessment of how much poverty alleviation effect the development of poverty alleviation industries may bring. This is because developing rural industries is not only an important measure to develop production and increase income in rural areas, but also an important path to achieve sustainable development in less-favoured areas and achieve the primary goal of “industrial prosperity” in the Rural Revitalization Strategy. In depth analysis of the poverty alleviation effects brought by local characteristic industries can not only provide useful references for clarifying the implementation effect of China’s targeted poverty alleviation policy, but also draw on the experience of implementing the Rural Revitalization Strategy and formulate more specific and thorough policies for industrial prosperity. Practice has proven that the development of rural characteristic industries is not only a path for impoverished households in mountainous areas to get rid of poverty and become well-off, but also an inexhaustible driving force for promoting industrial prosperity and rural revitalization. It is of greater significance to study the poverty alleviation effect of local characteristic industries [16].
However, through a literature review, we can found there is still a lack of research on the poverty alleviation effect of local characteristic industries, and scholars have conducted research on local characteristic industries from other perspectives. For example, Guo Xiaoming et al. (2018) took Cangxi County, Sichuan Province as an example to analyze the kiwifruit industry for poverty alleviation and advantages [17]. Lu Hanwen (2016) analyzed the development paths of characteristic agriculture in eastern China from the cross perspective of the industrial chain and stakeholders [18]. Although some scholars also tried to analyze the poverty alleviation effect brought by industrial development, most of them conducted qualitative analysis, and it is difficult to quantitatively evaluate the poverty alleviation effect brought by these characteristic industries. For example, Ma Nan (2016) analyzed the targeted poverty alleviation effect of specific industries in ethnic areas, with the development of Chinese herbal medicine as an example [19]. Through a literature search, we found that more and more scholars are also trying to solve the problem by quantitative analysis. For example, Wu Junqian et al. (2021) used a spatial econometric model to analyze the effect of industrial clusters on rural poverty alleviation [20]. Liu Mingyue et al. (2021) analyzed the effect of poverty-alleviation-based industry on improving farmers’ livelihood and capital [21]. Hu Lian et al. (2017) discussed the effect of targeted poverty alleviation based on the survey data of 12 counties in Anhui Province [22]. Wang Lijun et al. (2018) analyzed the poverty alleviation effect of the bamboo industry [23]. Zhang Dongli et al. (2020) studied the impact of rural land consolidation on poverty alleviation and income increase under different modes [24]. Scholars from other countries are also trying to quantitatively analyze the impact of industrial development on poverty alleviation, with substantial research results. Motsi, Hamond et al. studied the adaptability of sweet sorghum and applied it to poverty alleviation [25]. Mwangi, Backson et al. evaluated the impact of improved sorghum varieties on poverty reduction in Kenya [26]. Fikadu, Mitiku et al. analyzed the poverty alleviation effect of different coffee certification schemes in Ethiopia [27].
Although the existing studies have achieved substantial results, there are still some fields that need to be improved. First, although many studies have analyzed the poverty alleviation effect brought about by characteristic industries, some studies only focus on the reduction of the impoverished population by the characteristic industries, or the improvement of product output, and do not focus on the increase of household income. In addition, many scholars have studied the macro results brought by the development of characteristic industries within a large region, and have not focused on micro individuals. Even though there are still a small number of studies focusing on the income of individual households, there is no advanced policy evaluation tool based on a quasi-experimental perspective to divide individual households into the control group and the treatment group for comparative analysis. More importantly, the existing research ignores a critical question: can characteristic industries really achieve sustainable development while bringing poverty alleviation effects? In other words, the existing research has not developed an alternative perspective to focus on the poverty alleviation effect and sustainable development brought about by characteristic industries.
Although scholars from other countries have studied similar problems and made some progress, China’s national conditions cannot be ignored. Protecting cultivated land, preventing non-grain production (NGP) on cultivated land, and ensuring food security are also China’s major strategies [28,29]. How to effectively solve the low comparative benefits of grain planting, improve the enthusiasm of households to grow grain, make the development of rural characteristic industries and the prevention non-grain production on cultivated land more “compatible” or even “win-win”, so as to truly achieve “multi-dimensional” sustainable development, requires a strategic development perspective. There are 88 poverty-stricken counties in Yunnan Province; the highest number in China. Luquan Yi and Miao Autonomous County (hereinafter referred to as Luquan County) is one of them, located in the dry-hot valley of Jinsha River in the upper reaches of the Yangtze River [1,30]. Based on many field investigations, it was found that Luquan County’s promotion of the sorghum planting industry on poverty alleviation in the dry-hot valley area of the Jinsha River since 2017 initially had the dual objectives of developing characteristic industries to promote income growth and preventing non-grain production on cultivated land. Therefore, this study analyzed the poverty alleviation effect of promoting the sorghum planting industry in typical villages of Luquan County from the perspective of sustainable development. The research contribution of this study lies in studying regional characteristic industries from a new perspective, and taking into account the poverty alleviation effect of characteristic industries and regional sustainable development goals.

2. Analysis on Theory, Study Area and Poverty Alleviation Mode

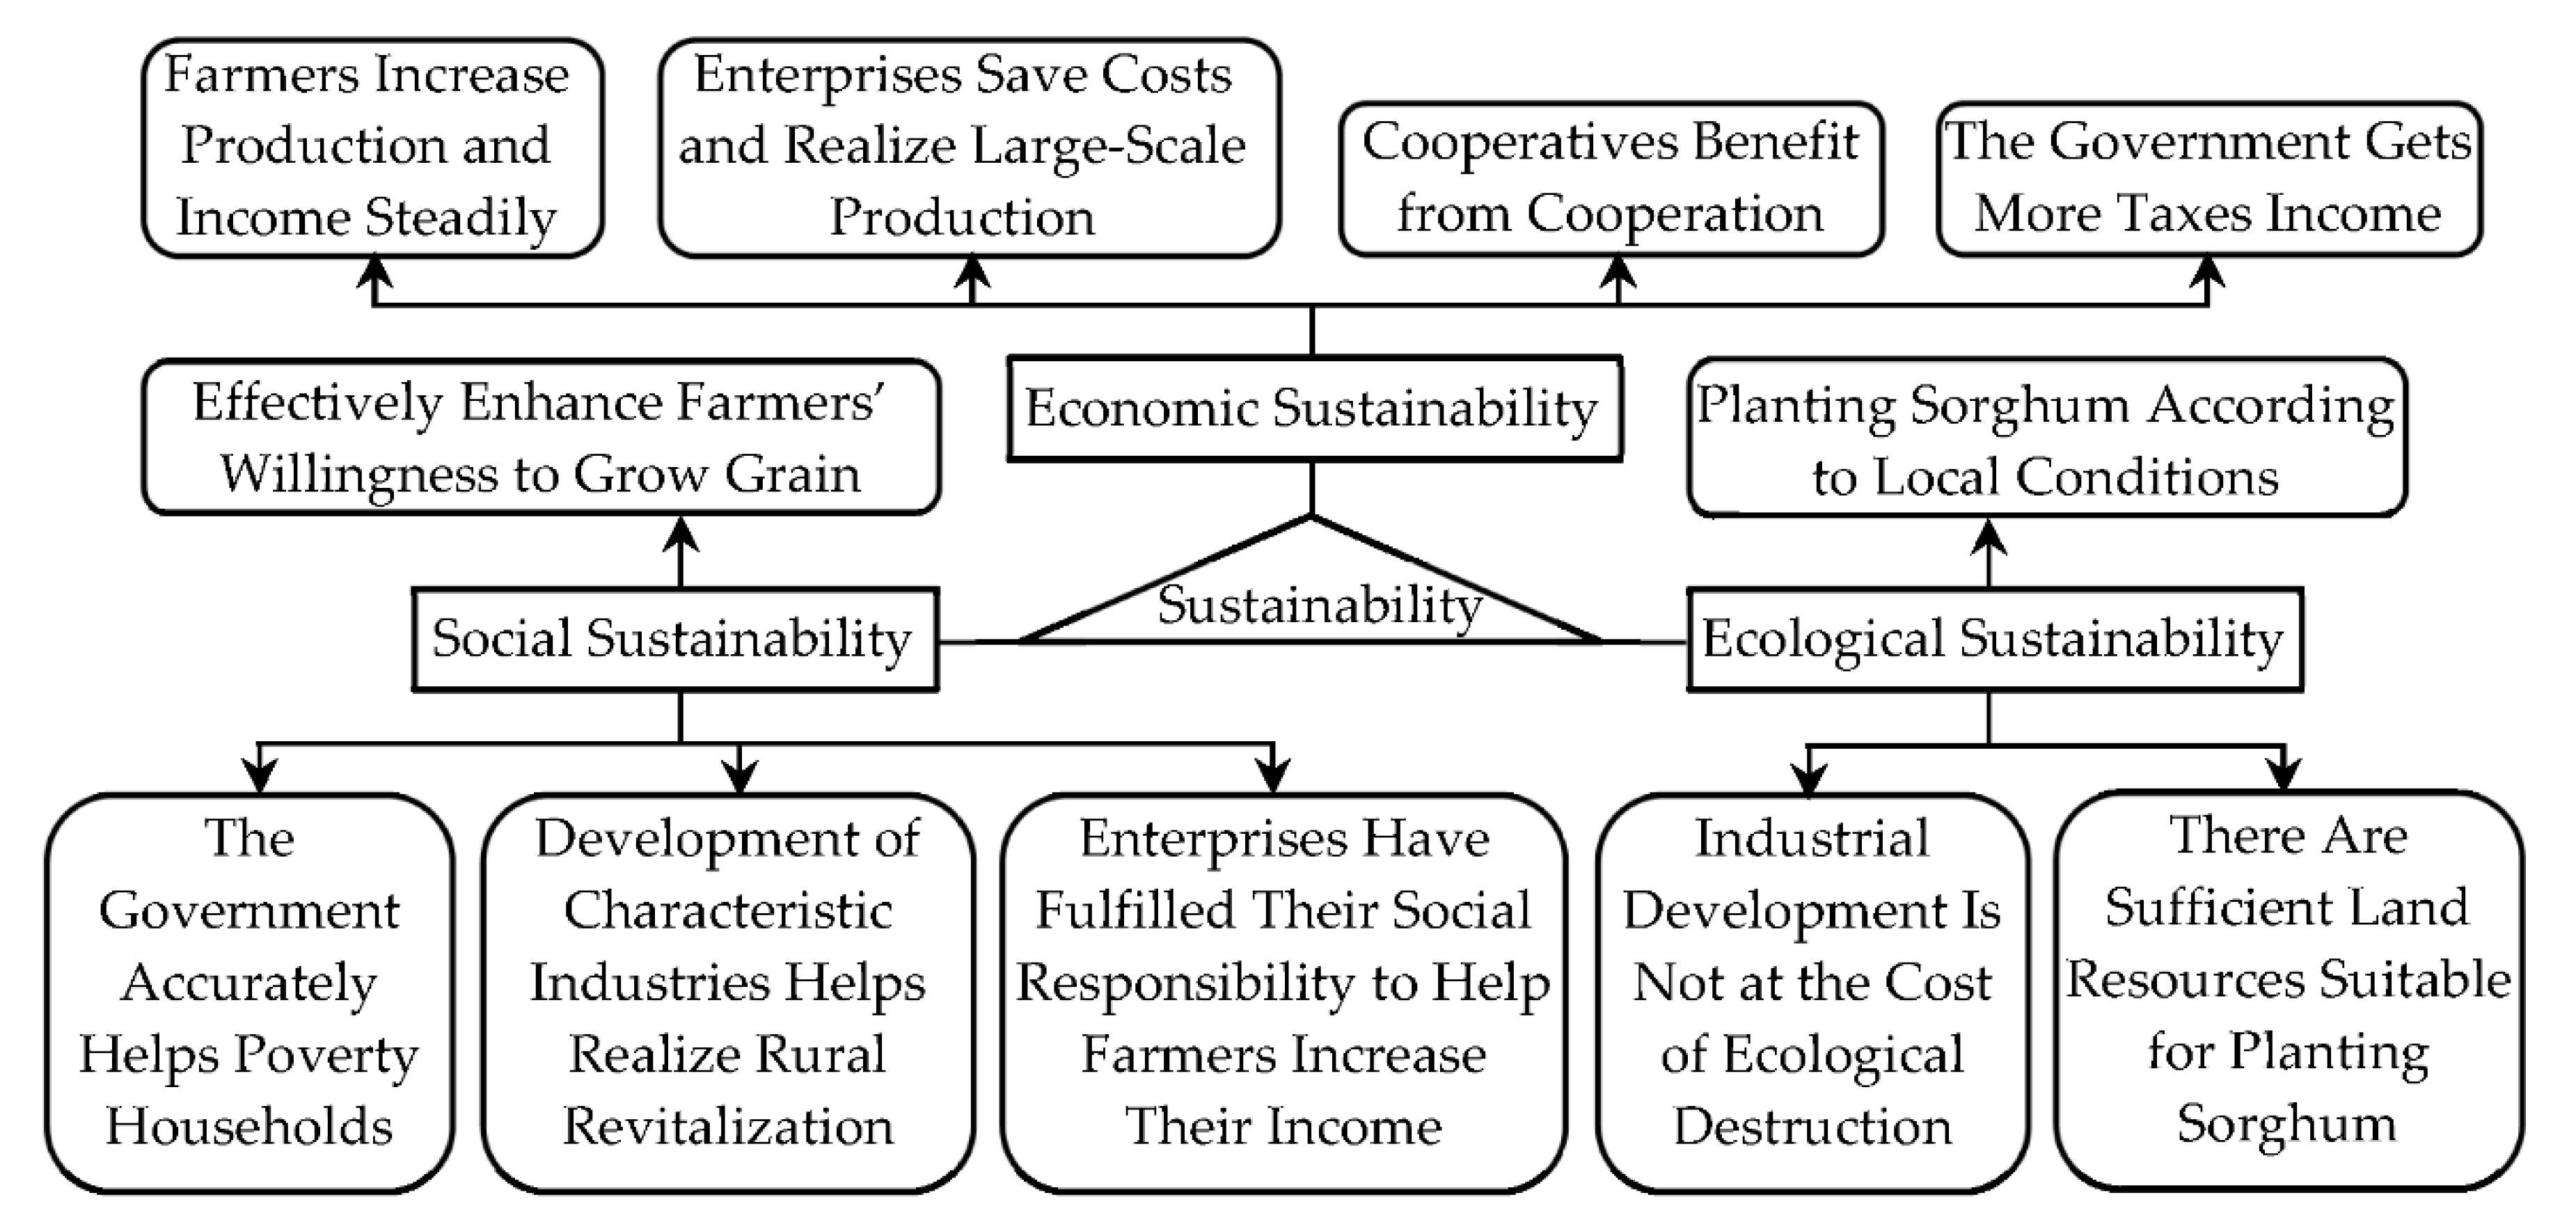
2.1. Theoretical Analysis

Many famous economists have put forward the theory of poverty from the perspective of poverty formation. Ragnar Nurkse (1953) believes that the reason why developing countries are poor is that there is a vicious circle between demand and supply [31]. In 1956, the economist Richard R. Nelson proposed a famous theory: the low-level equilibrium trap [32]. Gunnar Myrdal (1957) proposed the theory of circular accumulation causality [33]. However, how should poverty be eliminated after its formation? Albert Otto Hirschman proposed the “Trickle-down effect” theory. He believed that with the passage of time, developed countries would have positive effects on developing countries to narrow the gap and eliminate poverty [34]. Amartya Sen proposed the anti-poverty theory of equal rights [35]. Gunnar Myrdal also tried to discuss anti-poverty from the perspective of institutional reform.
After famous economists had put forward anti-poverty theories, many Chinese scholars added Chinese elements to the classic anti-poverty theories based on concrete practices, thus gradually forming a series of anti-poverty theories and modes that conform to China’s national conditions. Yan Kun et al. (2013) found that many scholars have studied China’s anti-poverty problem from the practical level and refined the anti-poverty theoretical modes from the practical perspective [36]. For example, according to China’s actual situation, Zhang Yansong (2004) divided anti-poverty into ten modes: regional development, infrastructure construction, production development, development of characteristic economy, poverty alleviation through science and technology, labor export, relocation and development in other places, microcredit, mobilization of social forces, and foreign capital assistance [37]. Fan Xiaojian found that China has formed six effective poverty alleviation modes: whole village promotion, the rain dew plan, the industrialization poverty alleviation, the continuous development, the immigrant poverty alleviation, and the comprehensive management of extremely poor areas [38]. Zhao Changwen et al. (2000) summarized and compared various poverty alleviation modes, and evaluated in detail the development-based poverty alleviation mode, the micro credit poverty alleviation mode, the remote development poverty alleviation mode, the counterpart poverty alleviation mode and the enterprise poverty alleviation mode, pointing out that poverty alleviation and development work should select suitable poverty alleviation modes according to the different characteristics of less-favoured areas [39].
Theoretical research shows that developing the economy and increasing income is one of the main lines of China’s anti-poverty modes [40]. There is a complex relationship between anti-poverty and economic development. Theoretical research shows that in the initial stage of economic development, the income gap will expand, and the effect of economic development on anti-poverty is not very obvious, because the social income gap is still expanding [41]. However, with the further development of the economy, the role of economic development in fighting poverty has become increasingly prominent. Economic development is diverse, and industrial development is an important aspect. Industrial poverty alleviation plays a decisive role, and is the key route that must be taken, ranking first among the “five-pronged poverty alleviation measures”. Practice has proved that the development of characteristic poverty alleviation industries plays a decisive role in driving households to increase their income and promoting transformation from “blood transfusion poverty alleviation” to “hematopoiesis poverty alleviation”. The anti-poverty mechanism of industrial development mainly plays a role by establishing leading industries, supporting leading enterprises, providing policies that benefit the people, and establishing production bases. It also increases the income of impoverished groups, profits of enterprises in cooperation, and tax revenue of the government. Promoting poverty alleviation through industrial development requires the government to take leading enterprises as the main carriers and implement policies such as credit poverty alleviation, tax preference, land use, social assistance and financial discounts. Leading enterprises can form a risk-sharing community with impoverished households through share dividends, agriculture, cooperation and mutual benefit, to obtain greater benefits while providing employment and opportunities of increasing income for impoverished households, and promote the adjustment of the industrial structure and the development of leading industries in less-favoured areas.
For assessment of targeted poverty alleviation, the authors have gone to impoverished mountain areas in more than 10 counties and learned about their industrial development modes. For example, Debao County in Guangxi has built a poverty alleviation chain through production and marketing integration, and promoted the large-scale development of industries such as navel oranges, hawthorn and silkworms [42]. Midu County, Yunnan Province, has taken advantage of its unique natural conditions to develop the vegetable industry, and strives to expand the sales market, forming a poverty alleviation mode for the vegetable industry [42]. The main poverty alleviation industries in typical villages and towns of Xundian Hui and Yi Autonomous County in Yunnan Province include cantaloupe, pork, and morel mushrooms, and have formed a unique industrial development mode [43]. In general, many poverty-stricken counties use their unique resource endowments to develop their own characteristic industries in line with local conditions, forming a unique industrial development mode. However, there are some aspects worth thinking about in many existing industrial poverty alleviaton modes. For example, to develop characteristic industries and increase household income, most of the cultivated land for long-term planting of traditional food crops such as corn has been replaced with cash crops with higher output value, such as fruits and seedlings [44]. Although the economic benefits are significant, there has also been a trend of non-grain production on cultivated land. Can the industrial development mode of introducing the “Langzhitang” distillery and promoting sorghum planting to households in Luquan County effectively increase households’ income and achieve the goals of sustainable development on the premise of effectively ensuring the planting of traditional food crops on cultivated land? This needs to be tested using the empirical methods.

2.2. Overview of the Study Area

In the dry-hot valley of the Jinsha River in China, there are many poverty-stricken counties; Luquan County is one of them. Luquan County is one of the counties under the jurisdiction of Kunming, Yunnan Province. The layout of Luquan County is similar to a leaf, narrow on the left and right, long on the top and bottom. The maximum horizontal distance between the east and west is about 70 km, and the maximum vertical distance between the south and north is about 105 km, with a land area of 4233.91 km2. Luquan County has jurisdiction over 16 townships, namely: Pingshan, Cuihua, Jiulong, Zhuanlong, Wumeng, Zhongping, Xueshan, Tuanjie, Sayingpan, Zehei, Maoshan, Yunlong, Jiaopingdu, Malutang, Wudongde and Tanglang. Luquan County has many mountains and little flat land. The terrain is generally high in the northeast and low in the southwest. The altitude differences between regions are large, showing very obvious characteristic of a three-dimensional climate.
According to the statistics of Luquan County, by the end of 2020, the total population of the county reached more than 487,000 people, including a large agricultural population of more than 371,000 people (about three-quarters of the total population) and a non-agricultural population of more than 116,000 people (about one quarter of the total population). In addition, the population of 23 ethnic minorities in Luquan County, including Yi, Lisu and Miao, accounts for about 33%. In 2020, the GDP of the county reached 14.65 billion CNY, of which the output values of the primary industry, secondary industry and tertiary industry were 4.164 billion, 2.204 billion and 8.282 billion CNY, respectively. The output value ratio of the three types of industries is about 2:1:4. In 2020, the county’s per capita GDP reached about 38,600 CNY, ranking 83rd among 129 counties (cities and districts) in Yunnan province. In 2020, the total output value of agriculture, forestry, animal husbandry and fishery reached 6.574 billion CNY, and the total agricultural output value will reach 3.121 billion CNY.
Luquan County is a typical national poverty-stricken county in the upper reaches of the Yangtze River and the middle reaches of the Jinsha River (which has gotten rid of poverty). It is characterized by a large proportion of mountains, steep terrain, significant poverty, and a large number of ethnic minorities [2]. Its economic development is relatively backward, with a wide range of rural poverty. The per capita disposable income of rural residents has always been at a low level in Yunnan province (Table 1), and in 2020 it was only 10,553 CNY, ranking 113th among 129 counties (cities and districts) in Yunnan Province. In addition, the cumulative number of the officially registered poverty-stricken people in the county reached 91,586 people (26,083 households) over the years from 2015 to 2020. Luquan County, as a key county included in the national plan for poverty alleviation through development, had a poverty incidence rate of 22.21% in 2014 (Table 2). Xueshan Township having the highest poverty incidence rate of 45.00%.
From the perspective of climate conditions, the temperature difference in the dry-hot valley of Jinsha River is minor in four seasons, with an annual rainfall of 850~1200 mm, but the dry and wet are distinct in four seasons. It has a subtropical monsoon climate, which is suitable for planting sorghum. Sorghum is one of the traditional “five grains”, favouring temperature and light. Optimum temperature for the growth period is 20~30 °C, and it is mainly distributed in areas with higher temperature and lower latitude. Sorghum rice can be used for brewing Baijiu and making sugar [45].

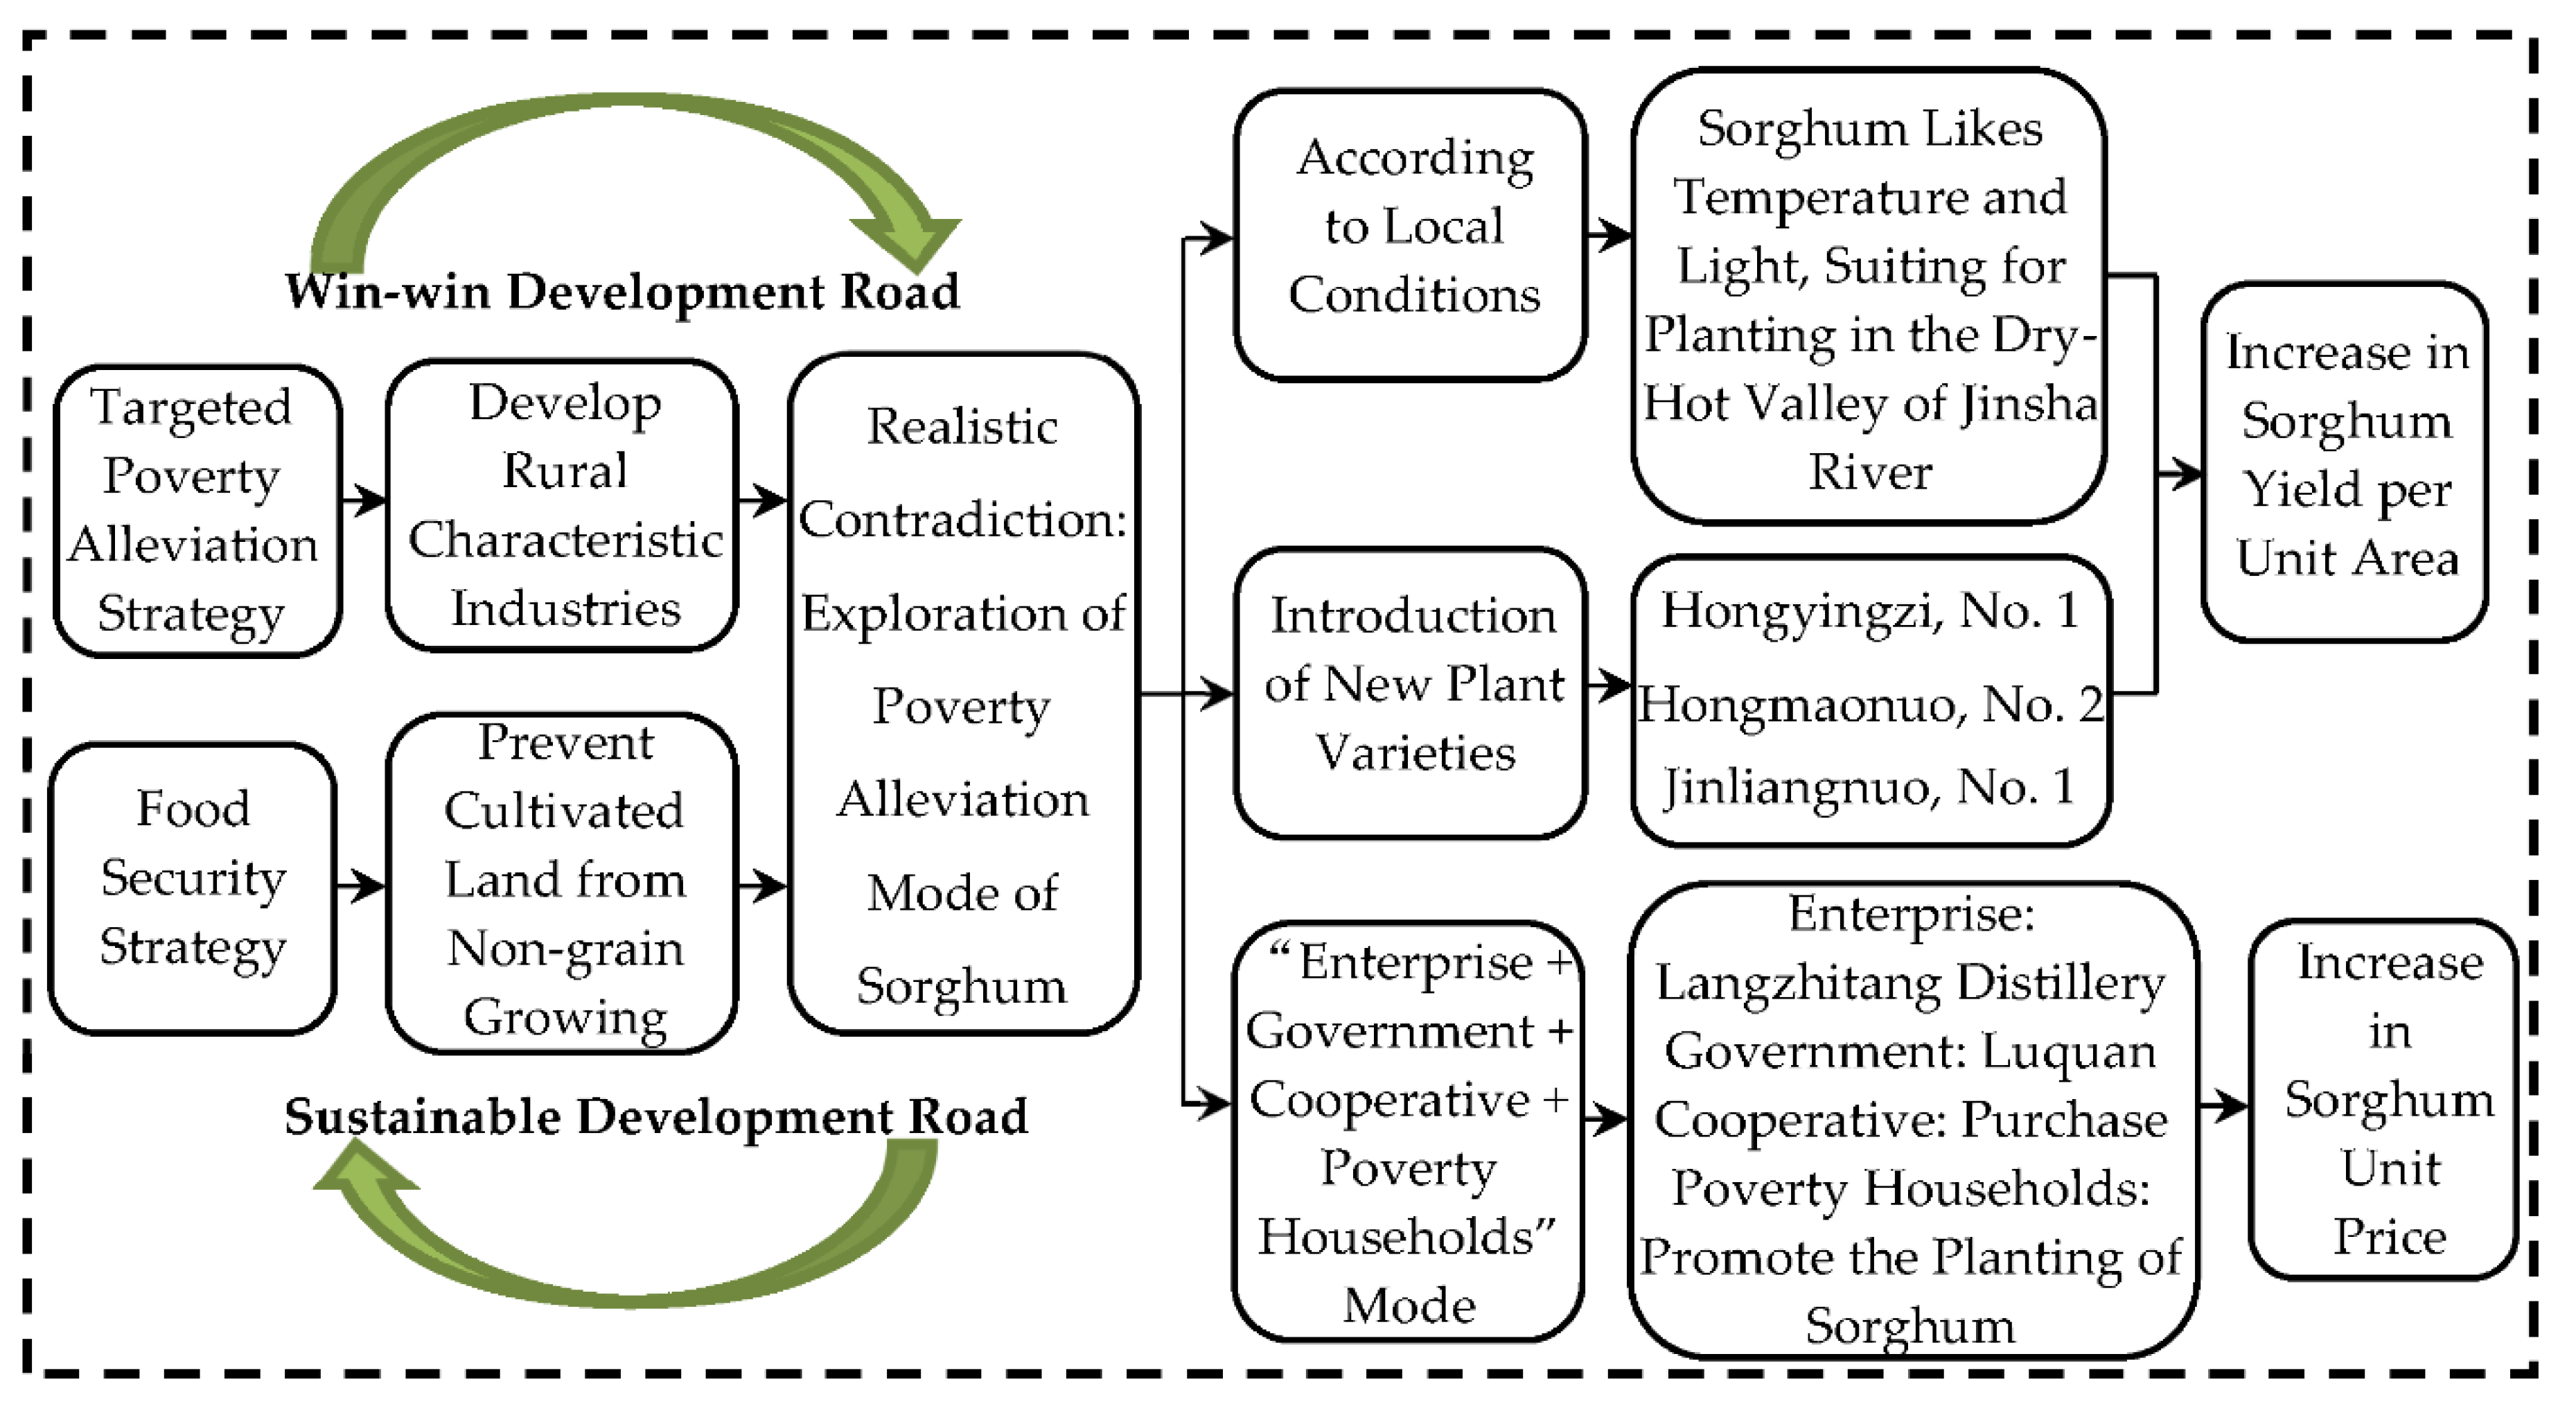
2.3. Sustainable Mode of Sorghum Planting Industry Leading Poverty to Alleviation in the Dry-Hot Valley of Jinsha River in Luquan County

In order to win the battle against poverty, Luquan County, in accordance with the general requirements of “one-pronged poverty alleviation measures by developing industry”, took industrial poverty alleviation as the primary goal, and made every effort to develop a characteristic planting industry to promote increase of farmers’ income and poverty alleviation. In combination with the climatic characteristics of the Jinsha River Valley in Luquan and the previous experience of small-scale planting, Luquan County has introduced new sorghum varieties such as Hongyingzi, No. 1, Hongmaonuo, No. 2 and Jinliangnuo, No. 1 into the dry-hot river valley since 2017. Focusing on the fundamental path of poverty alleviation, sorghum planting has been regarded as a key industrial poverty alleviation project. The implementation plan for the development of high-quality sorghum industry in Luquan Yi and Miao Autonomous County (2018–2020) was formulated and issued. In the form of ”enterprise + government + cooperative + poverty households“, the Langzhitang distillery was built in Luquan, and Luquan County was developing large-scale, industrialized and characteristic sorghum planting, and adopting policies of protect price purchasing sorghum from households to promote households (especially poverty-stricken households) to increase production and income. Figure 1 shows the sustainable mode of sorghum planting industry in Luquan County.
There is an obvious contradiction between the development of characteristic industries and the prevention of non-grain production on cultivated land. How to solve this from a sustainable perspective? It can be seen from Figure 1 that Luquan County did not choose to avoid this contradiction, nor did it choose to develop fruit, vegetables and breeding industries to drive household income increase as in other regions, but considered non-grain production on cultivated land, and chose to develop sorghum as its own characteristic industry. Although ordinary grain crops do not have high value, Luquan County Government highlighted the industrial characteristics from at least three aspects, improving the value of grain crops, and achieving sustainable production. (1) Growing crops according to local conditions. Sorghum favours higher temperature and light, while most areas of Luquan County are distributed in the dry-hot valley of Jinsha River. The perennial high temperature makes it very suitable for planting sorghum. The practice of planting sorghum according to local conditions can significantly increase unit yield. (2) Introducing new varieties. Luquan County has introduced new sorghum varieties in the dry-hot valley since 2017. These varieties of sorghum have the characteristics of short growth cycle, high yield and adaptability to a variety of climates. (3) Adopting the form of ”enterprise + government + cooperative + poverty households“. Although the above method can increase the output of sorghum, if there is no market, the produced sorghum would be difficult to sell. Luquan County’s practice is quite ingenious: the introduction of the Langzhitang distillery factory in Luquan, and the development of large-scale, industrialized and characteristic sorghum planting. Luquan County has invited enterprises to set up distilleries by attracting investment and recruiting high-level winemakers. Through the efforts of Luquan County government and cooperatives, the sorghum planting pilot project has been carried out in many places in Luquan County. Farmers have signed contracts to stipulate that the Langzhitang distillery will purchase sorghum planted by farmers at a guaranteed price.
It can be seen that this development mode can significantly enhance the enthusiasm of farmers to grow grain, which has certain significance for protecting cultivated land and preventing non-grain production on cultivated land, and initially has social sustainability. However, we paid more attention to the economic sustainability of this development mode. In other words, does this mode really promote the increased farmers’ income, especially in impoverished households? How much effect has the development of sorghum planting industry in Luquan County brought to farmers’ income? This is because only by accurately evaluating the poverty alleviation effect brought by this development mode can we better recognize the actual effect of this development mode, so as to provide reference for the industrial development of other regions. Therefore, we adopted the method of a questionnaire survey to collect the relevant data of households who planted sorghum, and households that did not plant sorghum, and then calculated the poverty alleviation effect brought by the promotion of sorghum to households by comparing the differences between the two.

3. Materials and Methods

3.1. Household Investigation Scheme of the Poverty Alleviation Effect of Sorghum Planting

After consulting the opinions and suggestions of leaders and cadres of relevant industry departments of Luquan County, Tanglang and Dache village committee, which are typical areas of sorghum planting industry, are selected sample villages committee for household investigation.
Since Luquan County has introduced new varieties of sorghum in the dry-hot valley since 2017, and adopted protected price to purchase sorghum, we adopted a questionnaire investigation method of comparisons between typical households that planted sorghum and households that did not plant sorghum, and divided the households’ samples into two groups, namely, the treatment group (sorghum planting was promoted in 2017~2019) and the control group (sorghum planting was not promoted). The reason why this study selected households who did not plant sorghum, and those who planted sorghum in 2017~2019, as the control group and the treatment group, respectively, is that the study more conveniently compare the impact of the policy of promoting sorghum planting and purchasing sorghum from households at protective prices. In the experimental design, to study the implementation effect of a policy or a measure, it is usually necessary to compare the gap of the experimental results between the group not included in the policy experiment and the group included in the policy experiment. By ensuring that external factors controlled as far as possible and other relevant conditions and factors are not significantly different between the two groups, the gap of the results between the group affected by the policy and the group not affected by the policy is the actual effect of the policy. The Difference-In-Differences (DID) model is based on this idea. By controlling the influence of external interference and other variables, it uses rigorous mathematical logic and exact calculation to obtain the net effect of the policy (see the following for details). Based on this, we designed a questionnaire according to the limits and requirements of the DID model for data collection, and selected the households that did not grow sorghum as the control group, and the households that grew sorghum in 2017~2019 as the treatment group for analysis and study. For comparative analysis, the household survey data in this study was divided into two time limits, namely 2016 and 2020. The year 2016 was the year before the promotion of sorghum planting in Luquan County, and 2020 was the year of China’s poverty elimination and after the promotion of sorghum planting. With the coordination of relevant leaders and cadres in Luquan County, and the assistance of the Tanglang village committee in Tanglang and the Dache village committee, we carefully carried out household surveys and obtained survey data of 901 effective samples (Table 3).
Considering the benefit of sorghum planting is affected by family situation, population structure, planting area and other factors (local governments might be more likely to promote sorghum planting to households with impoverished family conditions, more labor force, larger contracted land area and other characteristics), the survey included three aspects, namely: per capita net income of households, basic family situation, sorghum planting and income status. The survey indicators of the basic family situation mainly included the number of family populations, the labor force (aged 18–65), the area of contracted land, and the category of households (poverty-stricken households or ordinary households). Sorghum planting and income status were investigated and included indicators such as sorghum planting area, sorghum planting net income, the proportion of sorghum planting net income in the total household net income, and we calculated the variable indicators according to the survey results (Table 4). Table A1 shows the statistical description of each variable.

3.2. Model Introduction and Selection

Since 2017, Luquan County has focused on the path of industrial poverty alleviation, taken sorghum planting as a key industrial poverty alleviation project, relied on the establishment of the Langzhitang distillery, vigorously promoted sorghum planting and adopted a protective price purchasing policy to promote households (especially poverty-stricken households) to increase production and income. Whether this measure can significantly increase household income, and how much it can drive household income increase, need to be answered by empirical analysis. Therefore, we used the Propensity Score Matching Difference-In-Differences (PSM-DID) model to analyze the poverty alleviation effect of the industrial policy.
In recent years, the Difference-In-Differences (DID) model has been widely used to quantitatively analyze the net effect of an issued policy and the actual effect of a project [46]. The DID model divides the variables into the control group and the treatment group. It requires that both groups have a parallel trend before the policy experiment, and the policy experiment is only for the treatment group. By comparing the differences before and after the experiment, we can analyze and calculate the net effect of the implementation of a policy. For two phases of panel data, its setting form is as follows:
i n c o m e i t = β 0 + β 1 · t i m e × t r e a t + β 2 · t i m e + β 3 · t r e a t + j = 1 m δ j · c o n t r o l j + ε i t
where controlj represents each control variable in Table 4, β and δ are the parameters to be estimated, and εit is the disturbance term. β1 indicates the net effect of the policy, which is the most important parameter of this study (Table 5).
Table 5 shows why the intersection terms of time and treat are the policy effect. Because the above method uses the twice difference approach, this model is also called Difference-In-Differences model. However, for the promotion of sorghum planting industry, the government may be more willing to promote it among the poverty-stricken households to help them get rid of poverty. In addition, the promotion of sorghum planting varies from household to household, and households who work less may be more willing to plant sorghum. On the whole, the government is more likely to promote sorghum planting to households with low income, with the planting industry as the main income, resulting in certain differences between the samples of the treatment group and the control group. Therefore, the simple use of DID model may have some shortcomings because DID model ignores selection deviation.
If an individual chooses to plant sorghum, we cannot estimate the income of the same individual who does not choose to plant sorghum. Assuming that the per capita net income of the household after choosing to plant sorghum on a large scale is income1i, and the per capita net income after not choosing to plant sorghum on a large scale is income0i, we can only observe one of these values, which is actually a “data loss” [47]. Therefore, it is necessary to match the two groups of samples in the estimation, matching the values of variables such as the officially registered poverty-stricken households or not, the income level of breeding, the income level of working, and select similar samples of households for estimation, to better avoid the problems of selective deviation. The Average Treatment Effect on the Treated (ATT) calculated by PSM method is the net effect of the policy. ATT can be expressed as [48]:
τ A T T P S M = 1 n i I 1 S P Y 1 i j I 0 S P W i , j Y 0 j
where, I1 and I0 represent the treatment group and the control group, respectively, n represents the number of samples falling into the control group, y0j and y1i represent the per capita net income of households in the control group and the treatment group, and W represents the weight. The weights are calculated according to different matching methods.
Propensity Score Matching (PSM) can be done by several methods, such as Markov Matching, K-order Nearest Neighbor Matching, Caliper Matching, and Kernel Matching. In this study, various matching methods in PSM were used to estimate the income increasing effect of sorghum planting on farmers in two sample villages. However, the above Propensity Score Matching (PSM) estimators all rely on the assumption of negligibility, and are not applicable to the case of selection according to unmeasurable variables. For the observed data, if it was suspected there was selection according to unmeasurable variables, it was better to use the Propensity Score Matching Difference-in-Differences Estimator. The Propensity Score Matching Difference-in-Differences model can be abbreviated as PSM-DID model, which was proposed by Heckman et al. in 1998. It is applicable to two phases of the panel data. The establishment of the PSM-DID model is based on the following negligible assumptions:
E Y 0 t Y 0 t x , D = 1 = E Y 0 t Y 0 t x , D = 0
Thus, the ATT of the consistency estimation can be obtained as:
τ A T T P S M = 1 n i I 1 S P Y 1 t i Y 0 t i j I 0 S P W i , j Y 0 t j Y 0 t j
where Y1tiY0ti represents the change of individual i in the treatment group before and after the experiment, and Y1tjY0tj represents the change of individual j in the control group before and after the experiment. The rest is the same as in Formula (2).
In general, the method steps of PSM-DID model are as follows:
(1) Estimate propensity scores by using variables and covariates.
(2) For all the individuals in the treatment group, determine all the control group individuals matched with them.
(3) For all individuals in the treatment group, the changes of the outcome variables are calculated before and after.
(4) For all the individuals in the treatment group, calculate the changes before and after all the matched individuals in the control group.
(5) For the calculation results of (3) and (4), use the kernel matching method according to Formula (4) to obtain the estimated ATT.
The advantage of the PSM-DID model is that it can control the differences between groups that are not observable and do not change with time. For example, the fact that treatment group and the control group come from different regions can be solved by using the PSM-DID model. In general, the PSM-DID model is more advanced than DID and PSM. It combines the advantages of the PSM model and the DID model, avoids the shortcomings of the PSM model and DID model as much as possible, and has a better effect and credibility.
After obtaining the correct estimation results of these models, it is necessary to conduct various tests, such as a placebo test and robustness test.
(1) After using the PSM-DID model to estimate the results and analyze them, it is also necessary to conduct a robustness test. If the model is not robust, changing the estimation method will make the estimation results of the net effect of the policy significantly different and affect the credibility of the conclusion. Therefore, it is first necessary to ensure the robustness of the model when estimating.
(2) In addition, the placebo test is an indispensable and important step. “Placebo” usually refers to experimenters giving ordinary sugar pills (which have the same shape and taste as real drugs, but have no actual effect) to experimental subjects rather than effective pills. Its purpose is to eliminate the effects of unobservable factors such as psychological effects. The reason for the placebo test of our model was to exclude the interference of other unobservable factors on the model estimation results. If there are other policies implemented at the same time, and these other policies are closely related to the policy to be studied in this study, then the estimation results in this study will inevitably be affected, leading to estimation bias. Therefore, this paper used a placebo test to inspect this affect. If placebo test was passed, this means that there were no other unobservable factors causing major interference to the results and no major deviation in the results of the model.
Some software can estimate and calculate PSM, DID and the PSM-DID model, such as E-views, SPSS, and MATLAB. Stata software has some advantages over other software. It is not only more professional in the estimation of econometric models, but also simple to operate and very powerful. It is professional software specially designed for the estimation of econometric models. It can easily estimate and test various models by inputting different commands, and is very convenient and flexible to use. Therefore, this study used Stata 15 software to estimate and the calculate models.

4. Results

4.1. Statistical Description

We calculated the changes in the per capita net income of households in each sample group of Tanglang and Dache village committee from 2016 to 2020 (Table 6).
Table 6 shows that the income of the control group of Tanglang village committee increased by an average of 2325.14 CNY from 2016 to 2020, while the income of the treatment group increased by an average of 4370.49 CNY from 2016 to 2020, with a difference of 2045.35 CNY; this passed the significance level test of 1%. This shows that after Tanglang village committee promoted the planting of sorghum and adopting the policy of protection price purchasing, the per capita net income of households in the treatment group significantly increased. The average income of the control group of Dache village committee increased by 3158.30 CNY from 2016 to 2020, while the average income of the treatment group increased by 5283.67 CNY from 2016 to 2020. The difference between the two was 2125.38 CNY, and passed the significance level test of 1%. This also indicates that the policy increased household income in the treatment group significantly.
Figure 2 more intuitively reflects the changes of households planting sorghum and households not planting sorghum before and after the implementation of the policy (the red vertical dotted line is the sample mean value of the control group and the treatment group in Table 6 before and after the implementation of the policy). It can be seen from Figure 2 that not only the differences of distance of the red vertical dotted line in the samples of treatment group of Tanglang and Dache before and after the implementation of the policy is longer than that of the control group, but also the change of the nuclear density function of the treatment group after the implementation of the policy is more obvious than that of the control group (the nuclear density curve of the treatment group after the implementation of the policy is further apart than before compared with the control group).

4.2. Model Estimation Results and Analysis

The results in Table 6 and Figure 2 make a simple comparison. In reality, there are other factors that restrict the per capita net income of households. Once these factors change, the per capita net income of households may also change. Therefore, the results in Table 6 only preliminarily reflect the changes of per capita net income of the sorghum planting group (treatment group) and the non-sorghum planting group (control group) before and after the implementation of this policy, and it ignores the influence of other factors. Therefore, we used a DID model to analyze the impact of the policy on the per capita net income of households (see Table 7).
Table 7 shows that when the control variable is not added, the estimation results of the cross-multiplication term of time and treat are consistent with Table 6 (see columns (1) and (3) of the estimation results), but the clustering robust standard error estimation is used in Table 7, and the significance level of the estimation results changes.
Columns (2) and (4) of the estimation results in Table 7 consider the influence of other factors (control variables). From the estimation results, the control variables added changed greatly compared with the original, and the estimated results of time × treat are larger than when control variables are not added, and the estimated results are significant, indicating that after considering the impact of other important factors, the implementation of the policy still significantly increases the per capita net income of households of the treatment group.
However, there is still some deviation in the above results. As mentioned earlier, the government is likely not to treat all farmers equally in promoting the industry of sorghum planting. The government may be more willing to promote it among the poverty-stricken households. In addition, the government may be more willing to promote the sorghum industry policy to households with less workers or more land. This means the DID model ignores selection deviation. Therefore, households need to be matched in the estimation.
Table 8 shows the descriptive statistical results of control variables and the estimated results of the Probit model. It can be seen from Table 8 that there are obvious differences in most control variables between the treatment group and the control group, and the simple use of the DID model causes estimation bias. Therefore, it is necessary to use the Probit model to estimate whether the household is selected into the treatment group, and to match the two groups of samples according to the estimation results.
To more intuitively reflect the changes of various samples before and after matching, we considered the kernel density distribution of propensity scores before and after sample matching (see Figure 3).
Figure 3 shows that there are great differences in the kernel density function between the treatment group and the control group before the matching, but the distribution of the kernel density function tends to be similar after PSM. In the kernel density functions after matching, the treatment groups and the control groups have a common increasing and decreasing trend. It can be seen that using the PSM method to analyze the income benefits brought by the policy is more scientific and reasonable. According to the results of PSM, after removing some inappropriate samples, we used Kernel Matching, Five-nearest Neighbor Matching and Caliper Matching methods to calculate the Average Treatment Effect on the Treated (ATT) of promoting sorghum planting policies in two representative village committees (see Table 9).
Table 9 shows that the difference of ATT estimated by different methods was small. The results of Kernel Matching, Five-nearest Neighbor Matching and Caliper Matching methods showed that the effect brought by the promotion of sorghum planting and the purchase policy of protection price to the per capita net income of households in Tanglang village committee were 1591.90 CNY, 1364.19 CNY and 2181.96 CNY respectively, passing the significance level test of 1%. The average value of effect was 1712.68 CNY, equivalent to 42.82% of the national poverty alleviation standard line (4000 CNY/person) in 2020, indicating that the sorghum planting industrial policy significantly increased income of farmers in the Tanglang village committee. The results of the three methods for the Dache village committee were also very similar. The ATT calculated by Kernel Matching, Five-nearest Neighbor Matching and Caliper Matching method were 2168.75 CNY, 1986.16 CNY and 2320.51 CNY respectively, passing the significance level test of 5%, 10% and 1%, respectively. The average income increase value was 2158.47 CNY, equivalent to 53.96% of the national poverty eradication standard line (4000 CNY/person) in 2020. This shows that the sorghum planting industrial policy significantly increased income of households in the Dache village committee.
The significance level of the results of the Dache village committee was lower than that of the Tanglang village committee. The reason may be that the sample data size of the Tanglang village committee was larger (615 households after the Propensity Score Matching), while the sample size of the Dache village committee was 204 households after the Propensity Score Matching. Therefore, the robust standard error of the estimated results of the Dache village committee was higher, which reduced the significance level. Nevertheless, the results of the model still show that the policy of promoting sorghum planting significantly increased the per capita net income of rural households in Tanglang and Dache village committees.
However, the Propensity Score Matching (PSM) model relies on the assumption of negligibility, and is not applicable to the case of selecting according to unmeasurable variables. For the observed data, if it is suspected that there is selection according to unmeasurable variables, it is better to use the Propensity Score Matching Difference-in-Differences (PSM-DID) estimator. The advantage of PSM-DID model is that it can control the differences between groups that are not observable and do not change with time. It combines the advantages of PSM model and DID model, avoiding the shortcomings of PSM model and DID model as much as possible, and has better effect and credibility.
We estimated the average treatment effect on the treated (ATT) of the promotion of sorghum planting policy using the PSM-DID model (Table 10).
Table 10 shows that the ATT estimated by the PSM-DID model passed the significance level of 1%. The results show that the ATT brought to the per capita net income of households by the promotion of sorghum planting and purchase price guarantee policies of Tanglang and Dache village committee was 2171.64 CNY and 1945.06 CNY, respectively, equivalent to 54.29% and 48.63% of the national poverty alleviation standard line (4000 CNY/person) in 2020.
The results of all samples further show that the sorghum planting industrial policy increased the income of households. The advantage of the PSM-DID model is that it can control differences between groups that are not observable and do not change with time, for example, the treatment group and the control group are from different regions. The results of the whole sample show that the ATT of the policy of promoting sorghum planting in Luquan County to the per capita net income of households was 1726.87 CNY, which is equivalent to 43.17% of the national poverty alleviation standard line (4000 CNY/person) in 2020, significantly increasing the income level of rural households.

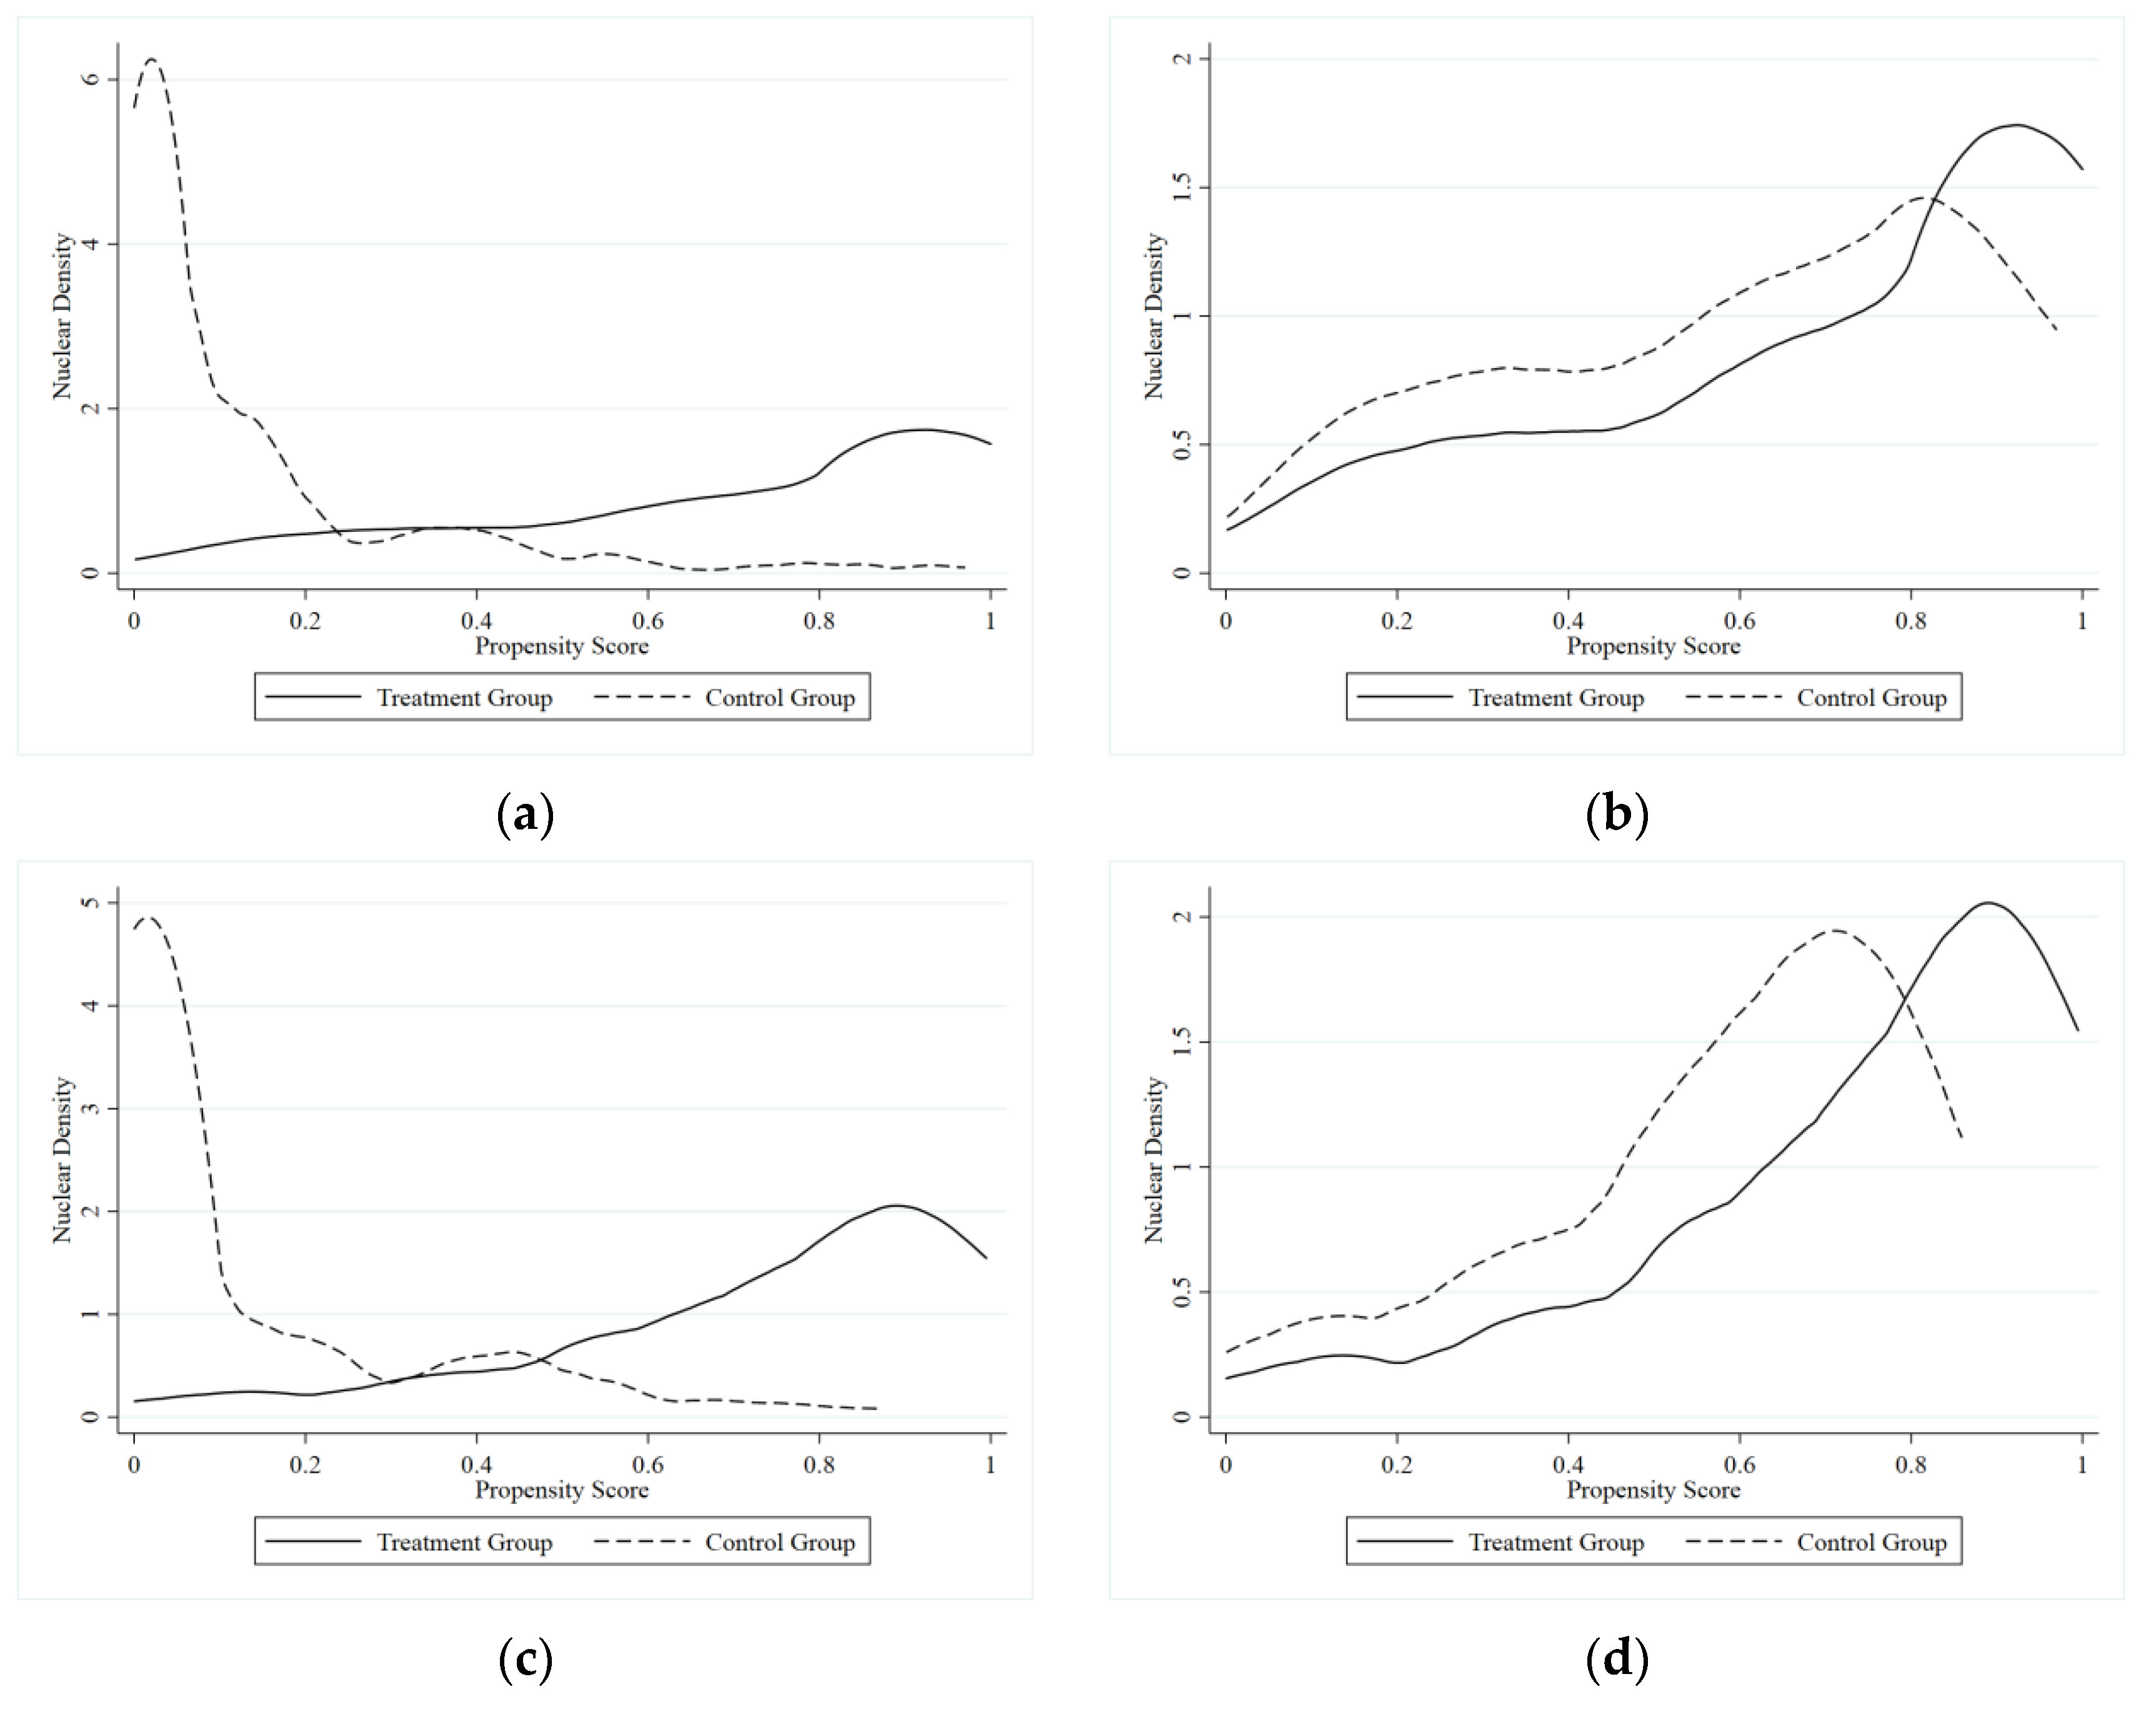
4.3. Test of Model Estimation Results

4.3.1. Robustness Test
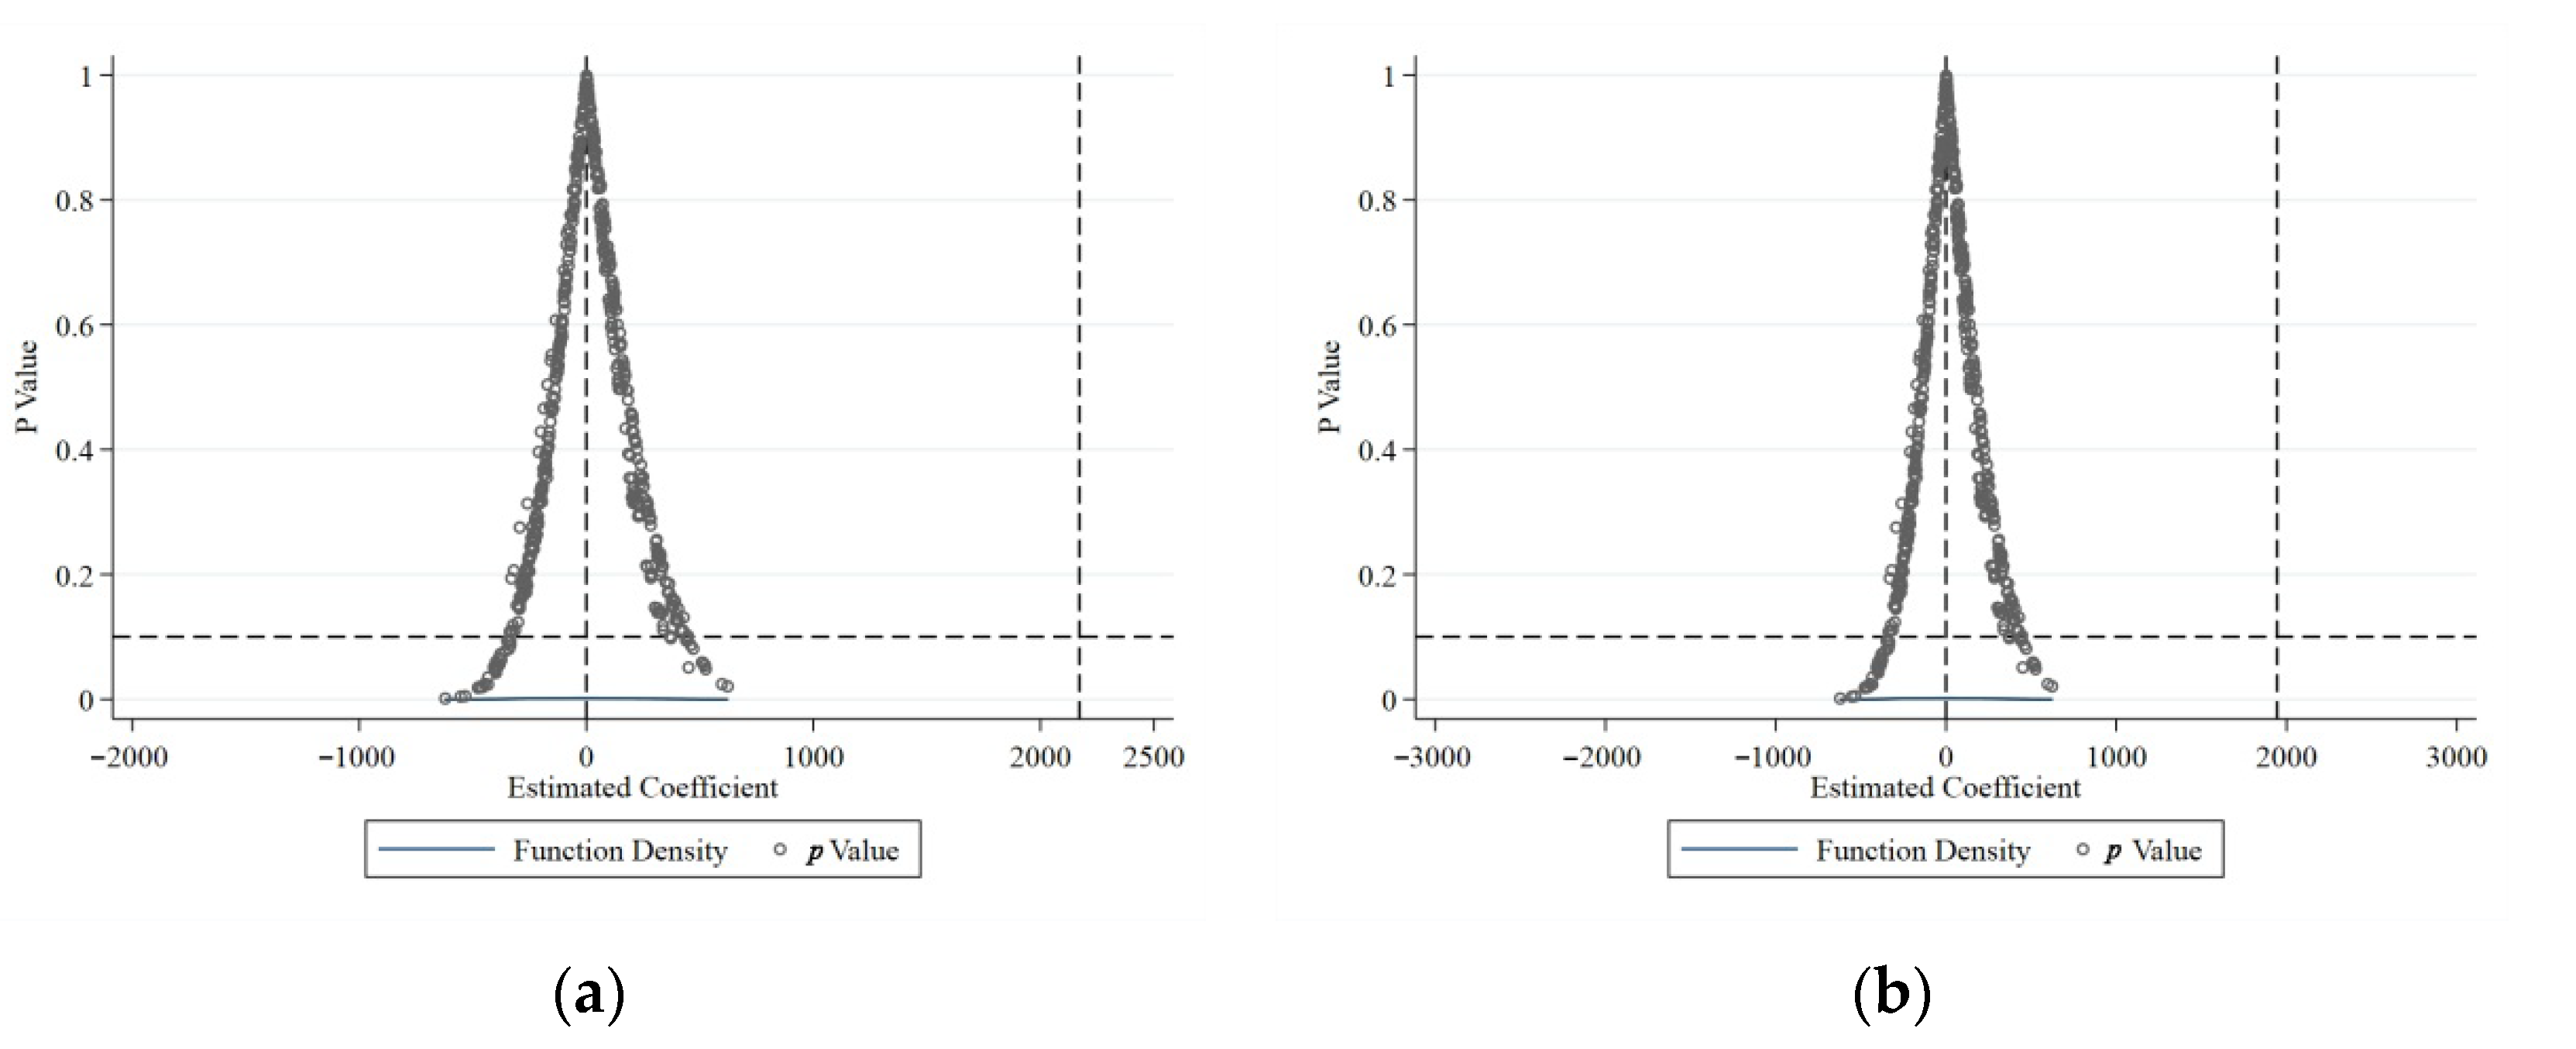
After using PSM-DID model to estimate the results and analyze them, it was first necessary to ensure the robustness of the model. Therefore, this study used the method of bilateral tail cutting to verify the robustness of the model. The results of two typical village committees were processed by 1.5%, 2.0% and 2.5% bilateral tail cutting respectively, and the average treatment effect on the treated (ATT) was obtained (Table 11).
Table 11 shows that after 1.5%, 2.0% and 2.5% bilateral tail cutting of the sample, the average treatment effect on the treated (ATT) results of the Tanglang village committee of Tanglang Township and Dache village committee of the Zehei Township both passed the significance level test of 1%, and the difference of estimation coefficients under different bilateral tail cutting was very small, which indicates that the model is robust.

4.3.2. Placebo Test

There are many methods for the placebo test, among which the most usual is to randomly set a control group and treatment group to test whether the experimental effects deviate significantly from other hypothetical results [49,50].
For samples from the Tanglang village committee, we randomly selected 200 samples from 666 samples as the treatment group, and the remaining 466 samples as the control group, added various control variables, and conducted random trials 500 times. Similarly, for the samples of the Dache village committee, 72 samples were randomly selected from 235 samples as the treatment group, and the remaining 163 samples were regarded as the control group. All control variables were added, and random trials were conducted 500 times. Figure 4 shows the placebo test results of the samples from the two village committees.
Taking the PSM-DID estimation results as an example, the ATT estimation results of the Tanglang village committee and Dache village committee were 2171.64 CNY and 1945.06 CNY, respectively. It can be seen from Figure 4 that the ATT estimation results were obviously abnormal values in each village committee, and the p values corresponding to 2171.64 CNY and 1945.06 CNY were far less than 0.10, which shows that the model passed the placebo test and was unlikely to be affected and driven by other factors.

5. Conclusions and Discussion

5.1. Conclusions

Poverty is a serious challenge facing the world today. As one of the largest developing countries in the world, China has a heavy responsibility in fighting poverty [44,50]. Since 2014, the targeted poverty alleviation policy implemented in China has effectively changed the poverty situation. Although there are various perspectives to study the effectiveness of poverty alleviation, industrial poverty alleviation plays a decisive role, ranking first among the “five-pronged poverty alleviation measures”. An in depth analysis of the poverty alleviation effects brought by local characteristic industries can not only provide useful references for clarifying the implementation effect of China’s targeted poverty alleviation policy, but can draw on the experience of implementing the Rural Revitalization Strategy, and formulate more specific and thorough policies for industrial prosperity. Based on the survey data of 901 households of representative village committee of Tanglang and Dache in Luquan Yi and Miao Autonomous County, this study quantitatively analyzed the poverty alleviation effect of the sorghum planting industry by using the Propensity Score Matching Difference-in-Differences (PSM-DID) model. In addition, this study developed an alternative perspective on poverty alleviation and sustainable development and supported empirically the Loewenstein-Bender model [51,52,53]. The results show that Luquan County’s industrial poverty alleviation policy of promoting sorghum planting and guaranteeing its purchase price effectively increased the income of households. The results of the PSM-DID model showed that the ATT of promoting sorghum planting and the guaranteed purchase price policy by Tanglang village committee of Tanglang Township and Dache village committee of Zehei township led to an increase in per capita net income of households of 2171.64 CNY and 1945.06 CNY, respectively, equivalent 54.29% and 48.63%, respectively, of the national poverty alleviation standard line (4000 CNY/person) in 2020. The estimation results of the whole sample show that the ATT of the policy to the per capita net income of households is 1726.87 CNY, which is equivalent to 43.17% of the national poverty alleviation standard line (4000 CNY/person) in 2020, which significantly promotes the income increase level of farmers. This has played an important role in improving the per capita net income of households and bringing about poverty alleviation of households. The effect of poverty alleviation is significant, and the model is robust and not affected by other factors in a great extent.

5.2. Discussion

Poverty is a serious challenge in the world today, restricting local sustainable development in a great extent. Poverty reduction is a basic requirement of human social development [44,50]. Yunnan Province is located in the southwest border of China, the ecological environment is relatively fragile, there are more mountains than flat land, and poverty is widespread [54,55,56]. Although existing research has provided useful data, there are aspects that need to be improved. First of all, many existing studies do not focus on the increase of farmers’ income. Second, some scholars have focused on macro results concerning the development of characteristic industries within a large region, rather than on individuals, nor did they use sophisticated policy evaluation models to divide individual households into control groups and treatment groups for comparative analysis. In addition, the existing research ignored a critical question: can the characteristic industries achieve sustainable development while bringing about poverty alleviation? In other words, the existing research has not developed an alternative perspective focusing on the poverty alleviation effect and sustainable development brought by characteristic industries.
Luquan County, located in Kunming, is one of 88 poverty-stricken counties in Yunnan Province, and is located in the dry and hot valley of the Jinsha River in the upper reaches of the Yangtze River. Based on field investigations, our study found that the practice of promoting sorghum planting industry in the Jinsha River dry and hot valley area has led to poverty alleviation in Luquan County since 2017, with the double goals of developing characteristic industries to increase income and preventing non-grain production on cultivated land [44]. Based on the survey data of 901 households of Tanglang Village Committee in Tanglang Township and Dache Village Committee in Zehei Township, which are typical of Luquan County, this study quantitatively analyzed the poverty alleviation effect of the sorghum planting industry using the Propensity Score Matching Difference-in-Differences (PSM-DID) model. The results show that the industrial poverty alleviation policy of promoting sorghum planting and guaranteeing its purchase price in Luquan County effectively increased the income of households. Luquan County, during the period of consolidating poverty alleviation and implementing the rural revitalization strategy promoted the brand and influence of the Langzhitang distillery, expanded the scale of the distillery, set up Langzhitang distillery tasting stores in Yunnan Province and other regions around Yunnan Province, and gradually promoted Langzhitang products, which expanded the scale of sorghum planting accordingly. On the basis of rational distribution of sorghum planting land according to local conditions, more households should master the technology and methods of sorghum planting, widely participate in the development of sorghum industry, and promote households to increase production and income, exploring a new mode and new path for enterprises to drive income growth of impoverished households and achieve sustainable development.
Developing characteristic industries is a requirement for poverty alleviation and rural revitalization, but preventing non-grain production on cultivated land is also a major national strategy. In recent years, the authors have visited impoverished areas in more than 10 counties to participate in third-party assessment of targeted poverty alleviation. According to field surveys and assessment, to develop characteristic industries and ensure increased income of farmers (especially those officially registered poverty-stricken households), most of the cultivated land for long-term planting of traditional food crops, such as corn, has been use to cultivated economic crops with higher output value, such as fruits, and even used for dug ponds to raise fish. Although the economic benefits are significant, there has also been a trend of non-grain production on cultivated land (some cultivated land is basic farmland), which is contrary to national policy. The contradiction between preventing non-grain production on cultivated land and developing characteristic industries (especially poverty alleviation industries) is major problem in rural revitalization, but it is not unsolvable. The conflict between the two needs to be resolved from a strategic perspective.
Sorghum planting in Luquan County shows that the selection of suitable crops, scientific development and planting in accordance with the principles of ecological suitability for suitable for planting and living, can not only prevent non-grain production on cultivated land, but also have economic benefits, create poverty alleviation and the requirements of the rural revitalization strategy for industrial support. This is an effective path to solving the problem of “What about grain?” by President Xi. Our results contribute to the development of characteristic industries in less-favoured areas, and to the exploration of a win-win path that takes into account the overall planning of developing characteristic industries to increase income, and preventing non-grain production on cultivated land, as well as the sustainable development of the economy, society and ecology.

6. Enlightenment

An in depth analysis of the poverty alleviation effects brought by local characteristic industries can not only provide useful references for clarifying the implementation effect of China’s targeted poverty alleviation policy, but also draw on the experience of implementing the Rural Revitalization Strategy and formulate more specific and thorough policies for industrial prosperity. However, there is still a lack of quantitative research on the poverty alleviation effect of regional characteristic industries. Few studies have focused on the increase of individual income or use advanced policy evaluation tools for comparative analysis based on a quasi-experimental perspective. In addition, the existing research ignores a critical question: can characteristic industries really achieve sustainable development while bringing about poverty alleviation effects? In view of the shortcomings and the aspects that need to be improved of the current research, we studied regional characteristic industries from a new perspective, and took into account the poverty alleviation effect of characteristic industries and regional sustainable development. The contribution of this study lies in studying regional characteristic industries from a new perspective, and taking into account the poverty alleviation effect of characteristic industries and regional sustainable development. Land suitability evaluation results show that there are sufficient land resources suitable for planting sorghum [44]. We found that the sorghum planting characteristic poverty alleviation industry in Luquan County has economic, social and ecological sustainability. Figure 5 clearly shows the sustainability characteristics of this industry.
Since the 14th five-year plan, China’s rural industrial development has entered a new development era. Although research on the effect of sorghum planting on poverty alleviation and development in the dry-hot valley of Jinsha River in Luquan County is preliminary attempt, it has achieved great results. At present, the sorghum planting industry in the dry-hot valley of the Jinsha River has been expanded to the surrounding counties in Sichuan Province and Yunnan Province, with a great development prospect.
The development of sorghum planting in Luquan County shows that reasonable selection of suitable crops and scientific development, and planting in accordance with ecological principles of “suitable for planting and living” can not only prevent non-grain production on cultivated land, but also produce economic benefits, and ensure the consolidation of the results of poverty alleviation and the requirements of the Rural Revitalization Strategy for industrial support.

Author Contributions

Conceptualization, R.Y. and Z.Y.; methodology, R.Y.; software, R.Y.; validation, Z.Y.; formal analysis, R.Y. and Z.Y.; investigation, R.Y.; resources, R.Y.; data curation, Z.Y.; writing—original draft preparation, R.Y.; writing—review and editing, Z.Y.; visualization, Z.Y.; supervision, Z.Y.; project administration, Z.Y.; funding acquisition, Z.Y. All authors have read and agreed to the published version of the manuscript.

Funding

This research was funded by the National Natural Science Foundation of China, grant number 41261018.

Institutional Review Board Statement

The study was conducted according to the guidelines of the Declaration of Helsinki, and approved by the Institutional Review Board of Institute of Targeted Poverty Alleviation and Development, Yunnan University of Finance and Economics (protocol code: ITPAD-Que-Mar-002 and date of approval: 18 March 2021).

Informed Consent Statement

Informed consent was obtained from all subjects involved in the study. Written informed consent has been obtained from the patients to publish this paper.

Data Availability Statement

The statistical data of Luquan County, Yunnan Province and the whole country can be obtained through the following links: “http://stats.yn.gov.cn/” or “https://www.epsnet.com.cn/index.html#/Index”. The questionnaire data of this study cannot be obtained because many questions involve the privacy of 901 households and they are unwilling to disclose their questionnaire results officially.

Acknowledgments

For field investigations and analysis, we thank Fenglian Liu, Bosheng Zhang, Qiuju Wu, Yingying Huang and Yongdong Zhang of the Institute of Land & Resources and Sustainable Development, Yunnan University of Finance and Economics, Kunming 650221, China. Furthermore, we would like to deeply thank Fenglian Liu, Bosheng Zhang and Qiuju Wu for their contributions to data processing and drawing figures, Fenglian Liu for her suggestions and help in writing the manuscript, Yingying Huang and Yongdong Zhang for their contribution to the grammar check of the manuscript. Finally, we sincerely thank Elkhan Richard Sadik-Zada for his support and affirmation of our manuscript.

Conflicts of Interest

The authors declare no conflict of interest.

Appendix A

Table A1 shows the statistical description of each variable:
Table A1. Statistical description of independent variables and the dependent variable.
Symbols of the VariablesVillage Committee NameYearMINMAXMEDSDCVP25P75
incomeTanglang20161275.0029,400.005629.002081.960.364732.836575.00
Tanglang20204666.6744,550.008316.952814.010.326897.149993.33
Dache20161609.1318,200.004100.002653.020.533106.516647.14
Dache20203744.7821,965.888244.793286.760.376409.1610,856.00
treatTanglang20160.001.000.000.461.530.001.00
Tanglang20200.001.000.000.461.530.001.00
Dache20160.001.000.000.461.510.001.00
Dache20200.001.000.000.461.510.001.00
povertyTanglang20160.001.000.000.481.300.001.00
Tanglang20200.001.000.000.481.300.001.00
Dache20160.001.001.000.320.361.001.00
Dache20200.001.001.000.320.361.001.00
perworkTanglang20160.0099.5262.5526.430.4937.9273.29
Tanglang20200.00100.0054.7823.910.4542.5267.81
Dache20160.00100.0027.9331.131.070.0049.24
Dache20200.00100.0054.4726.990.4935.9573.44
breedTanglang20160.00100.0023.9925.200.7714.0746.69
Tanglang20200.00100.0025.8220.690.6817.8437.02
Dache20160.00100.0039.0230.160.7019.7461.93
Dache20200.0093.2727.7323.830.826.0946.00
sorghumTanglang20200.0032.980.007.571.630.0010.55
Dache20200.0035.940.005.981.790.006.99
landTanglang20162.0024.008.004.250.496.0012.00
Tanglang20202.0024.008.004.250.496.0012.00
Dache20165.0015.009.002.680.307.0011.00
Dache20205.0015.009.002.680.307.0011.00
populationTanglang20160.00100.0080.0025.000.3260.00100.00
Tanglang20200.00100.0080.0025.000.3260.00100.00
Dache201616.67100.0080.0017.490.2171.43100.00
Dache202016.67100.0080.0017.490.2171.43100.00
MIN represents the minimum value of the statistical data; MAX represents the maximum value in the statistical data; MED stands for the median of statistical data; SD represents the standard deviation of the statistical data; CV is the coefficient of variation in the statistical data; P25 represents the value at 25% after sorting the statistical data from low to high; P75 represents the value at 75% after sorting the statistics from low to high.

Appendix B

Table A2 shows the questionnaire of Tanglang Village Committee in Tanglang Township and Dache Village Committee in Zehei Township:
Table A2. Sample of questionnaire of Tanglang Village Committee in Tanglang Township and Dache Village Committee in Zehei Township.
QuestionsFill in Instructions or Options
I. Basic information of the household
I-A. Name of the head of householdFill in Chinese characters.
I-B. Gender of the head of household(1) male (2) female
I-C. Contact information of the head of householdFill in mobile phone number or landline number.
I-D. Family populationFill in positive integer; unit: person.
I-E. Population aged 18–65Fill in positive integer; unit: person.
I-F. Did the household plant sorghum in 2016 or before?(1) Yes (2) No
Note: Considering the preciseness of the research design, it is necessary to find households who did not plant sorghum in 2016 or before to conduct a questionnaire survey.
I-G. Was the household promoted to plant sorghum from 2017 to 2019 and purchased sorghum at a protective price?(1) Yes (2) No
I-H. Was the household previously included in the officially registered poverty-stricken households? (1) Yes (2) No
II. Income level of the household
II-A. How much was the household’s income from planting industry in 2016?Unit: CNY.
II-B. How much was the household’s expenditure from planting industry in 2016?
II-C. How much was the household’s income from planting industry in 2020?
II-D. How much was the household’s expenditure from planting industry in 2020?
II-E. How much was the household’s income from planting sorghum in 2020?Unit: CNY; 0 if sorghum was not planted.
II-F. How much was the household’s expenditure from planting sorghum in 2020?
II-G. How much was the household’s income from the breeding industry in 2016?Unit: CNY.
II-H. How much was the household’s expenditure from the breeding industry in 2016?
II-I. How much was the household’s income from the breeding industry in 2020?
II-J. How much was the household’s expenditure from the breeding industry in 2020?
II-K. How much was the household’s other productive and operational income from business and other ways in 2016?Unit: CNY. Note: The income/expenditure of planting industry and the income/expenditure of breeding industry are included in the productive and operational income/expenditure. These statistical indicators here refer to other productive and operational income/expenditure except the income/expenditure of planting industry and the income/expenditure of breeding industry.
II-L. How much was the household’s other productive and operational expenditure from business and other ways in 2016?
II-M. How much was the household’s other productive and operational income from business and other ways in 2020?
II-N. How much was the household’s other productive and operational expenditure from business and other ways in 2020?
II-O. How much was the household’s wage income obtained from going out to work in 2016?Unit: CNY.
II-P. How much did the household’s spend on going out to work in 2016?
II-Q. How much was the household’s wage income obtained from going out to work in 2020?
II-R. How much did the household’s spend on going out to work in 2020?
II-S. How much was the household’s property income in 2016?Unit: CNY. Note: the property income includes land transfer, photovoltaic income, share dividend and other related income.
II-T. How much was the household’s property income in 2020?
II-U. How much was the household’s transfer income in 2016? Unit: CNY. Note: the transfer income includes the funds for guaranteeing a minimum standard of living (subsistence allowances), extreme poverty aid, various subsidies, child support and other related income.
II-V. How much was the household’s transfer income in 2020?
II-W. How much was the household’s net income in 2016?Unit: CNY. Note: the calculation method is all net income from production and operation in the current year (deducted the expenditure) + all net wage income obtained from going out to work in the current year (deducted the expenditure) + all property income in the current year + all transfer income in the current year.
II-X. How much was the household’s net income in 2020?
II-Y. How much was the per capita net income of the household in 2016?Unit: CNY. Note: the calculation method is: the household’s net income in the current year/total population of the household
II-Z. How much was the per capita net income of the household in 2020?
III. Other related questions
III-A. What was the contracted land area of the household in 2016? Unit: mu. Note: “mu” is an area unit commonly used in the questionnaire survey, and 1 hectare (ha) is equal to 15 mu. This means that 1 mu is about 0.067 ha.
III-B. What was the contracted land area of the household in 2020?

References

  1. Yang, Z.S.; Yang, R.Y.; Liu, F.L. Spatio-temporal Evolution and Influencing Factors of Urban-rural Income Gap in Yunnan Province Based on Poverty Classification. Geogr. Res. 2021, 40, 2252–2271. [Google Scholar]
  2. Yang, Z.S.; Liu, Z.; Lama, X.G.; Xiong, R.L.; Zhao, X.N. The Poverty Alleviation Model of Kunming in the Context of World Poverty Reduction, 1st ed.; Social Science Literature Press: Beijing, China, 2020. [Google Scholar]
  3. Wu, X.P.; Zhou, Z.F.; Zhu, M.; Huang, D.H.; Zhu, C.L.; Feng, Q.; Luo, W.L. Study on the Coupling Relationship between Relocation for Poverty Alleviation and Spatiotemporal Evolution of Rocky Desertification in Karst Areas of Southwest China. Sustainability 2022, 14, 8037. [Google Scholar] [CrossRef]
  4. Chansanam, W.; Li, C.Q. Scientometrics of Poverty Research for Sustainability Development: Trend Analysis of the 1964–2022 Data through Scopus. Sustainability 2022, 14, 5339. [Google Scholar] [CrossRef]
  5. The United Nations. Transforming Our World: The 2030 Agenda for Sustainable Development, General Assembly. Available online: http://www.un.org/zh/documents/view_doc.asp?symbol=A/RES/70/1 (accessed on 21 October 2015).
  6. Xi, J.P. To Win the Great Victory of Socialism with Chinese Characteristics in the New Era by Building a Well-Off Society in an All-Round Way: A Report at the Nineteenth National Congress of the Communist Party of China, 1st ed.; People’s Publishing House: Beijing, China, 2017. [Google Scholar]
  7. Xu, G.Y.; Zhao, T.; Wang, R. Research on the Efficiency Measurement and Spatial Spillover Effect of China’s Regional E-Commerce Poverty Alleviation from the Perspective of Sustainable Development. Sustainability 2022, 14, 8456. [Google Scholar] [CrossRef]
  8. Zou, Q.; He, X.Q.; Li, Z.; Xu, W.C.; Zhang, L. The effects of poverty reduction policy on health services utilization among the rural poor: A quasi-experimental study in central and western rural China. Int. J. Equity Health 2019, 16, 186. [Google Scholar] [CrossRef] [Green Version]
  9. Zou, C.M.; Liu, J.Z.; Liu, B.C.; Zheng, X.H.; Fang, Y.G. Evaluating Poverty Alleviation by Relocation under the Link Policy: A Case Study from Tongyu County, Jilin Province, China. Sustainability 2019, 11, 5061. [Google Scholar] [CrossRef] [Green Version]
  10. Zhang, N.; Zhang, X.X.; Li, P. The Temporal and Spatial Differentiation Characteristics of Three Industry Convergence Development in Deeply Impoverished Areas in China. Sustainability 2020, 12, 831. [Google Scholar] [CrossRef] [Green Version]
  11. Yang, R.Y.; Zhan, W.H.; Qian, Q.; Zhu, C.Q.; Li, Y.Z.; Huang, X.Y.; Yang, Z.S. The Model of Poverty Alleviation and Income Growth by Developing Plateau-characterized Agriculture and its Achievements Analysis in Yunnan Province: A Case Study in Midu County, Dali Bai Autonomous Prefecture. Agric. Sci. Technol. 2017, 18, 744–746, 752. [Google Scholar]
  12. Yang, Z.S.; Yang, R.Y.; Tian, K.B.; Dai, Z.H.; Pan, D.C.; Xiong, Y. Reconstruction Mode of Rural Dilapidated Houses in Alpine and Gorge Area of Southwest China—A Case Study of Scientific Identification and Precision Reconstruction of Rural Dilapidated Houses in Luquan County, Yunnan Province. Asian Agric. Res. 2019, 11, 57–64. [Google Scholar]
  13. Central Committee of the Communist Party of China, The State Council of the People’s Republic of China. Decision of the Central Committee of the Communist Party of China and the State Council of the People’s Republic of China on Winning the Battle against Poverty, 1st ed.; People’s Publishing House: Beijing, China, 2015.
  14. The State Council of the People’s Republic of China. The 13th Five Year Plan for Poverty Alleviation, 1st ed.; People’s Publishing House: Beijing, China, 2016.
  15. Xi, J.P. Selected and Edited Important Documents Since the 18th CPC National Congress (Part 2), 1st ed.; People’s Publishing House: Beijing, China, 2018. [Google Scholar]
  16. Chen, C.; Cheng, L.M. Research on the Effective Supply of Public Goods in Contiguous Poverty Areas Under the Goal of Industrial Poverty Alleviation. Issues Agric. Econ. 2017, 38, 44–51. [Google Scholar]
  17. Guo, X.M.; Yu, H. Innovation of industrial poverty alleviation model with regional characteristics and advantages: A case study of Cangxi County, Sichuan Province. Guizhou Soc. Sci. 2018, 341, 142–150. [Google Scholar]
  18. Lu, H.W. The development path of characteristic agriculture in eastern China and Its Enlightenment to targeted Poverty Alleviation: The cross perspective of industrial chain and stakeholders. Contemp. Rural. Financ. Econ. 2016, 21, 9–14. [Google Scholar]
  19. Ma, N. Research on targeted poverty alleviation through characteristic industries in Ethnic Areas: Taking the development industry of Chinese herbal medicines as an example. J. S. Cent. Univ. Natl. Humanit. Soc. Sci. 2016, 36, 128–132. [Google Scholar]
  20. Wu, J.Q.; Liu, X.Q.; Ruan, J.Q.; Qi, X.L.; Wang, C.A.; Fan, D. Space Power in Inclusive Development: Industrial Clusters and Rural Anti-Poverty. Int. J. Environ. Res. Public Health 2021, 18, 10943. [Google Scholar] [CrossRef]
  21. Liu, M.Y.; Feng, X.L.; Wang, S.G.; Zhong, Y. Does poverty-alleviation-based industry development improve farmers’ livelihood capital? J. Integr. Agric. 2021, 20, 915–926. [Google Scholar] [CrossRef]
  22. Hu, L.; Wang, Y.; Wang, S.G.; Shao, S.J. On the Effects of Targeted Poverty Alleviation Efforts: A Case Study Based on a Survey of 12 Counties (Areas) in Anhui Province. J. China Exec. Leadersh. Acad. Yan’an 2017, 10, 124–128. [Google Scholar]
  23. Wang, L.J.; Cheng, J.H.; Wang, J.J.; Yang, J. Practices and Discussions on Targeted Poverty Alleviation with Bamboo Industry: A Case Study of Lingxi Village in Wuyuan County, Jiangxi Province. World Bamboo Ratt. 2018, 16, 55–59. [Google Scholar]
  24. Zhang, D.L.; Wang, W.X.; Zhou, W.; Zhang, X.L.; Zuo, J. The effect on poverty alleviation and income increase of rural land consolidation in different models: A China study. Land Use Policy 2020, 99, 104989. [Google Scholar] [CrossRef]
  25. Motsi, H.; Molapo, M.; Phiri, E.E. A review on sweet sorghum adaptive capacity on improving food security and poverty alleviation in sub-Saharan Africa. S. Afr. J. Bot. 2022, 150, 323–329. [Google Scholar] [CrossRef]
  26. Mwangi, B.; Macharia, I.; Bett, E. Ex-post Impact Evaluation of Improved Sorghum Varieties on Poverty Reduction in Kenya: A Counterfactual Analysis. Soc. Indic. Res. 2021, 154, 447–467. [Google Scholar] [CrossRef]
  27. Mitiku, F.; Mey, Y.D.; Nyssen, J.; Maertens, M. Do Private Sustainability Standards Contribute to Income Growth and Poverty Alleviation? A Comparison of Different Coffee Certification Schemes in Ethiopia. Sustainability 2017, 9, 246. [Google Scholar] [CrossRef] [Green Version]
  28. Zhang, Z.X.; Meng, X.; Elahi, E. Protection of Cultivated Land Resources and Grain Supply Security in Main Grain-Producing Areas of China. Sustainability 2022, 14, 2808. [Google Scholar] [CrossRef]
  29. Sun, Y.; Chang, Y.Y.; Liu, J.N.; Ge, X.P.; Liu, G.J.; Chen, F. Spatial Differentiation of Non-Grain Production on Cultivated Land and Its Driving Factors in Coastal China. Sustainability 2021, 13, 13064. [Google Scholar] [CrossRef]
  30. Yang, R.Y.; Du, W.Y.; Yang, Z.S. Spatiotemporal Evolution and Influencing Factors of Urban Land Ecological Security in Yunnan Province. Sustainability 2021, 13, 2936. [Google Scholar] [CrossRef]
  31. Nurkse, R. Problems of Capital Formation in Underdeveloped Countries; The Commercial Press: Beijing, China, 1966. [Google Scholar]
  32. Nelson, R.R. A Theory of Low-Level Equilibrium Trap in Underdeveloped Economies. Am. Econ. Rev. 1956, 46, 894–908. [Google Scholar]
  33. Myrdal, G. Economic Theory and Under-Developed Regions; Gerald Duckworth & Co. Ltd.: London, UK, 1957. [Google Scholar]
  34. Hirschman, A.O. Economic Development Strategy; The Commercial Press: Beijing, China, 1991. [Google Scholar]
  35. Amartya, S. Development as Freedom; Anchor Books: New York, NY, USA, 2000. [Google Scholar]
  36. Yan, K.; Yu, S.Y. Theoretical Study on the Anti-poverty in China. J. Huazhong Norm. Univ. Humanit. Soc. Sci. 2013, 52, 1–11. [Google Scholar]
  37. Zhang, Y.S. Development and China’s Rural Anti-Poverty; China financial & Economic Publishing House: Beijing, China, 2004. [Google Scholar]
  38. Fan, X.J. Accurately grasp the new situation and strive to create a new situation. Old Area Constr. 2009, 24, 6–9. [Google Scholar]
  39. Zhao, C.W.; Guo, X.M. Comparison among Anti—Poverty Alternative Models. China Rural. Surv. 2000, 21, 65–71+79. [Google Scholar]
  40. Yan, K.; Liu, Y.F. Research on Anti-Poverty Theory and Practice with Chinese Characteristics, 1st ed.; China Social Sciences Press: Beijing, China, 2016. [Google Scholar]
  41. Kuznets, S. Economic growth and income inequality. Am. Econ. Rev. 1955, 45, 42–48. [Google Scholar]
  42. Yang, Z.S.; Wang, J.Y. The Typical Models of Targeted Poverty Alleviation in Central and Western Regions of China, 1st ed.; Social Science Literature Press: Beijing, China, 2020. [Google Scholar]
  43. Yang, Z.S.; Zhu, S.X. The Targeted Poverty Alleviation: A Research on the Innovative Poverty Reduction Model of Xundian Hui and Yi Autonomous County, 1st ed.; Social Science Literature Press: Beijing, China, 2019. [Google Scholar]
  44. Yang, R.Y.; Zhong, C.B. Land Suitability Evaluation of Sorghum Planting in Luquan County of Jinsha River Dry and Hot Valley Based on the Perspective of Sustainable Development of Characteristic Poverty Alleviation Industry. Agriculture 2022, 12, 1852. [Google Scholar] [CrossRef]
  45. Cheng, D.; Qiu, S.Y. Progress in Understanding the Effect of Sorghum on the Quality of Maotai-flavor Baijiu. Food Sci. 2022, 43, 356–364. [Google Scholar]
  46. Ye, F.; Wang, Y. Introduction and Application of Difference-in-Difference Model. Chin. J. Health Stat. 2013, 30, 131–134. [Google Scholar]
  47. Chen, Q. Advanced Econometrics and Stata Applications, 2nd ed.; Higher Education Press: Beijing, China, 2014. [Google Scholar]
  48. Jia, J.X.; Liang, X.; Ma, G.R. Political Hierarchy and Regional Economic Development: Evidence from a Spatial Discontinuity in China. J. Public Econ. 2021, 194, 104352. [Google Scholar] [CrossRef]
  49. Ren, S.G.; Zheng, J.J.; Liu, D.H.; Chen, X.H. Does Emissions Trading System Improve Firm’s Total Factor Productivity—Evidence from Chinese Listed Companies. China Ind. Econ. 2019, 35, 5–23. [Google Scholar]
  50. Yang, R.Y.; Zhong, C.B.; Yang, Z.S.; Wu, Q.J. Analysis on the Effect of the Targeted Poverty Alleviation Policy on Narrowing the Urban-Rural Income Gap: An Empirical Test Based on 124 Counties in Yunnan Province. Sustainability 2022, 14, 12560. [Google Scholar] [CrossRef]
  51. Loewenstein, W.; Bender, D. Labor Market Failure, Capital Accumulation, Growth and Poverty Dynamics in Partially Formalised Economies: Why Developing Countries’ Growth Patterns are Different. SSRN Electron. J. 2017. [Google Scholar] [CrossRef]
  52. Sadik-Zada, E.R. Distributional Bargaining and the Speed of Structural Change in the Petroleum Exporting Labor Surplus Economies. Eur. J. Dev. Res. 2020, 32, 51–98. [Google Scholar] [CrossRef]
  53. Sadik-Zada, E.R. Natural resources, technological progress, and economic modernization. Rev. Dev. Econ. 2021, 25, 381–404. [Google Scholar] [CrossRef]
  54. Wu, Q.J.; Yang, R.Y.; Yang, Z.S. A Study on the Rationality of Land Use Change in the Dianchi Basin during the Last 40 Years under the Background of Lake Revolution. Sustainability 2022, 14, 11479. [Google Scholar] [CrossRef]
  55. Yang, R.Y.; Wu, Q.J.; Yang, Z.S.; Yang, S.Q. Study on Spatio-Temporal Changes of Land Use Sustainability in Southwestern Border Mountainous Provinces in Recent 20 Years Based on Remote Sensing Interpretation: A Case Study in Yunnan Province, China. Land 2022, 11, 1957. [Google Scholar] [CrossRef]
  56. Yang, R.Y.; Zhong, C.B. Analysis on Spatio-Temporal Evolution and Influencing Factors of Air Quality Index (AQI) in China. Toxics 2022, 10, 712. [Google Scholar] [CrossRef]
Figure 1. Sustainable Mode of Sorghum Planting Industry Leading Poverty Alleviation in the Dry-Hot Valley Area of Jinsha River in Luquan County.
Agriculture 12 02107 g001
Figure 2. Nuclear Density of per Capita Net Income of Households in the Control Group and the Treat Group Before and After the Implementation of the Policy. (a) Tanglang Village Committee of Tanglang Township; (b) Dache Village Committee of Zehei Township.
Agriculture 12 02107 g002
Figure 3. Kernel Density Function of Propensity Score. (a) Samples before matching in Tanglang Village Committee of Tanglang Township; (b) Samples after matching in Tanglang Village Committee of Tanglang Township; (c) Samples before matching in Dache Village Committee of Zehei Township; (d) Samples after matching in Dache Village Committee of Zehei Township.
Agriculture 12 02107 g003
Figure 4. Placebo test results. (a) Samples in Tanglang Village Committee of Tanglang Township; (b) Samples in Dache Village Committee of Zehei Township.
Agriculture 12 02107 g004
Figure 5. Sustainability of Poverty Alleviation Characteristic Industry of Sorghum Planting in Luquan County.
Agriculture 12 02107 g005
Table 1. Rural Per Capita Disposable Income and Its Ranking in Luquan County from 2015 to 2020.
YearPer Capita Disposable Income of Rural Residents (Unit: CNY)Proportions Compared with Yunnan Province (Unit: %)Proportions Compared with the Whole Country (Unit: %)Ranking in 129 Counties (Cities, Districts) of Yunnan Province
2015659580.0257.74115
2016730180.9459.06114
2017804681.5959.90114
2018880281.7460.22114
2019969181.4260.49114
202010,55382.1861.60113
Table 2. Poverty Population and Poverty Incidence Rate in 2014 in Luquan County.
TownshipsThe Accumulative Number of the Officially Registered Poverty-Stricken People in 2014Number of Agricultural Registered Residence Population in 2014 (Unit: Person)Poverty Incidence Rate (Unit: %)
Number of Households (Unit: Household)Number of People (Unit: Person)
Pingshan1113393440,3739.74
Sayingpan1921624043,90314.21
Zhuanlong2305833534,22224.36
Maoshan1654556035,73415.56
Tuanjie509159824,2946.58
Yunlong7872492961725.91
Zhongping1521536518,00229.80
Jiaopingdu1558574021,67726.48
Tanglang1507545213,82039.45
Malutang1550501319,38725.86
Wudongde1957663015,77642.03
Zehei2074780427,61428.26
Cuihua2776957535,98926.61
Jiulong2310799242,48018.81
Wumeng1174454517,63325.78
Xueshan1367531111,80245.00
Total26,08391,586412,32322.21
Note: Data from the Poverty Alleviation and Development Office of Luquan County People’s Government.
Table 3. Sample Scale of Household Survey on Poverty Alleviation Effect of Sorghum Planting.
Name of Village CommitteeEffective Sample Size (Households)
Treatment Group Control Group Total
Tanglang Village Committee200466666
Dache Village Committee72163235
Total272629901
Note: the treatment group refers to the households who did not plant sorghum in 2016 but have planted sorghum since 2017. The control group refers to the households that did not plant sorghum during 2016 and 2020.
Table 4. Selection of Variables of Household Survey in 2016 and 2020.
VariablesSymbolsAttributeCalculation Formula or ExplanationUnit
Per capita net income of householdsincomeDependent VariableTotal household income/Total household populationCNY/person
Treatment group or control grouptreatDummy Variable0 means No, 1 means YesNone
Before or after the implementation of the policytimeDummy Variable0 means before, 1 means afterNone
Officially registered poverty-stricken households or notpovertyControl Variable0 means No, 1 means YesNone
Proportion of income from workper workControl VariableTotal income from work/Total household income × 100%%
Proportion of income from breedbreedControl VariableTotal income from breed/Total household income × 100%%
Proportion of income from sorghum plantingsorghumControl VariableTotal income from sorghum planting/Total household income × 100%%
Contracted land arealandControl VariableContracted land area of households Mu
Proportion of people aged 18~65populationControl VariableNumber of households aged 18–65/Total household population × 100%%
Note: “mu” is an area unit commonly used in the questionnaire survey, and 1 hectare (ha) is equal to 15 mu. This means that 1 mu is about 0.067 ha.
Table 5. Principle of Estimating Policy Effect by DID Model.
ItemsBefore Policy Implementation (Time = 0)After Policy Implementation (Time = 1)Difference
Households that Were Promoted to Plant Sorghum (treat = 1)β0 + β3β0 + β1 + β2 + β3β1 + β2
Households that were not Promoted to Plant Sorghum (treat = 0)β0β0 + β2β2
Differenceβ3β1 + β3β1
Table 6. Statistical Description of Household per Capita Net Income.
Village Committee NameYearMean Value (Standard Error in Brackets)Difference
Total SamplesTreatment GroupControl Group
Tanglang Village Committee of Tanglang Township2016 5843.87 ***
(80.67)
5877.61 ***
(210.47)
5829.38 ***
(71.87)
48.23
(176.12)
20208783.23 ***
(109.04)
10,248.10 ***
(263.82)
8154.52 ***
(93.21)
2093.58 ***
(223.76)
t2939.36 ***
(84.43)
4370.49 ***
(193.82)
2325.14 ***
(70.49)
2045.35 ***
(166.36)
Total666200466
Dache Village Committee of Zehei Township20165047.84 ***
(173.06)
5005.17 ***
(259.98)
5066.69 ***
(221.99)
−61.53
(376.20)
20208857.32 ***
(214.40)
10,288.84 ***
(432.90)
8224.99 ***
(226.70)
2063.85 ***
(446.05)
t3809.47 ***
(236.02)
5283.67 ***
(435.29)
3158.30 ***
(266.04)
2125.38 ***
(493.82)
Total23572163
Note: ∆t refers to the difference between the income in 2020 and income in 2016. *** indicates that the original hypothesis is rejected at the significance level of 1%.
Table 7. Impact of Promoting Sorghum Planting Policy on per Capita Net Income of Households: Estimation Results Based on DID Model.
VariableTanglang Village CommitteeDache Village Committee
(1)(2)(3)(4)
time × treat2045.35 ***
(206.14)
5469.26 ***
(1015.57)
2125.38 ***
(509.85)
3990.35 ***
(1022.18)
Control VariableNoYesNoYes
Sample666666235235
R20.31660.58890.32620.4189
Note: the robust standard errors of clustering at the individual level are in the brackets of the estimation results. *** indicates that the original hypothesis is rejected at the significance level of 1%.
Table 8. Descriptive Statistics of Control Variables and Probit Model Estimation Results in 2016.
Village Committee NameControl VariablesMean Value (Standard Error in Brackets)DifferenceProbit Model Estimation Results
Total SamplesTreatment GroupControl Group
Tanglang Village Committee of Tanglang Townshippoverty0.37 ***
(0.02)
0.53 ***
(0.04)
0.30 ***
(0.02)
0.23 ***
(0.04)
0.7295 ***
(0.1502)
perwork54.28 ***
(1.02)
52.04 ***
(1.37)
55.24 ***
(1.34)
−3.20
(2.23)
0.0043
(0.0070)
breed32.68 ***
(0.98)
36.56 ***
(1.19)
31.01 ***
(1.29)
5.55 ***
(2.12)
0.0274 ***
(0.0076)
land8.69 ***
(0.16)
12.70 ***
(0.29)
6.97 ***
(0.14)
5.73 ***
(0.28)
0.4044 ***
(0.0299)
population77.07 ***
(0.97)
82.60 ***
(1.31)
74.70 ***
(1.25)
7.90 ***
(2.09)
0.0383 ***
(0.0047)
Total Samples666200466
_cons−8.9107 ***
(0.9195)
Pseudo R20.5409
Dache Village Committee of Zehei Townshippoverty0.89 ***
(0.02)
0.90 ***
(0.04)
0.88 ***
(0.03)
0.03
(0.05)
0.5131
(0.3596)
perwork29.18 ***
(2.03)
32.43 ***
(3.93)
27.74 ***
(2.36)
4.68
(4.40)
0.0087 *
(0.0049)
breed42.87 ***
(1.97)
44.56 ***
(3.28)
42.12 ***
(2.44)
2.44
(4.27)
0.0089 *
(0.0053)
land9.05 ***
(0.17)
6.40 ***
(0.15)
10.21 ***
(0.18)
3.81 ***
(0.27)
−0.5870 ***
(0.0767)
population81.76 ***
(1.14)
71.55 ***
(2.32)
86.27 ***
(1.12)
14.72 ***
(2.29)
−0.0330 ***
(0.0080)
Total Samples23572163
_cons5.7676 ***
(0.9809)
Pseudo R20.5570
Note: The “_cons” represents the constant term estimated by the model. *, ***, respectively, indicate that the original hypothesis is rejected at the significance level of 10% and 1%.
Table 9. Average Treatment Effect on the Treated (ATT) of Promoting Sorghum Planting Policy.
ItemsTanglang Village CommitteeDache Village Committee
Kernel Matching5 Nearest Neighbor MatchingCaliper MatchingKernel Matching5 Nearest Neighbor MatchingCaliper Matching
ATT1591.90 ***
(323.18)
1364.19 ***
(348.59)
2181.96 ***
(243.32)
2168.75 **
(932.20)
1986.16 *
(1117.87)
2320.51 ***
(654.01)
Treatment Group Samples149149149414141
Control Group Samples466466466163163163
Total Samples615615615204204204
Note: the robust standard errors of clustering at the individual level are in the brackets of the estimation results. *, **, ***, respectively, indicate that the original hypothesis is rejected at the significance level of 10%, 5%, and 1%.
Table 10. Average treatment effect on the treated (ATT) estimation results obtained using the PSM-DID Model.
ItemsTanglang Village CommitteeDache Village CommitteeTotal
ATT2171.64 ***
(400.53)
1945.06 ***
(642.53)
1726.87 ***
(375.43)
Treatment Group Samples19556267
Control Group Samples430145626
Total Samples625201893
R20.260.670.34
Note: the robust standard errors of clustering at the individual level are in the brackets of the estimation results. *** indicates that the original hypothesis is rejected at the significance level of 1%.
Table 11. Robustness Test Results.
ItemsTanglang Village CommitteeDache Village Committee
1.5%2.0%2.5%1.5%2.0%2.5%
ATT2070.21 ***
(306.94)
2080.17 ***
(290.27)
2064.71 ***
(282.66)
1823.16 ***
(624.63)
1679.15 ***
(605.23)
1679.15 ***
(605.23)
Treatment Group Samples195195195565656
Control Group Samples430430430145145145
Total Samples625625625201201201
R20.360.380.390.680.690.69
Note: the robust standard errors of clustering at the individual level are in the brackets of the estimation results. *** indicates that the original hypothesis is rejected at the significance level of 1%.
Publisher’s Note: MDPI stays neutral with regard to jurisdictional claims in published maps and institutional affiliations.

