Article

Evaluation and Analysis on the Temperature Prediction Model for Bailing Mushroom in Jizhou, Tianjin

School of Atmospheric Sciences, Chengdu University of Information Technology, Chengdu 610225, China
*
Author to whom correspondence should be addressed.
Agriculture 2022, 12(12), 2044; https://doi.org/10.3390/agriculture12122044
Submission received: 6 November 2022 / Revised: 23 November 2022 / Accepted: 28 November 2022 / Published: 29 November 2022
(This article belongs to the Section Agricultural Technology)

Abstract

:
Based on the air temperature, wind speed, humidity, air pressure, etc., of the regional automatic weather station in Chutouling Town, Jizhou from April 2019 to November 2020, and the air temperature of the microclimate observation station receiving data every 10 min in a bailing mushroom greenhouse, this paper analyzed and evaluated a BP (back propagation) neural network and stepwise regression method to establish a prediction model for the temperature in the Bailing mushroom greenhouse for different seasons. The results showed that: (1) The air temperature, wind speed, humidity and air pressure outside the shed were the main factors for building the temperature prediction model for the inside temperature, and the air temperature was the most important factor affecting the temperature inside the shed. After introducing humidity, wind speed and air pressure, the accuracy of the model was significantly improved. (2) The temperature prediction model based on the BP neural network method, for every 10 min interval in the greenhouse, for the Bailing mushroom in different seasons, was more accurate than the stepwise regression model. The simulation results of the two models had the highest accuracy in summer, followed by autumn. (3) The root means square error of the BP neural network and stepwise regression model for inside the greenhouse, simulating the daily temperature variations for different seasons, was 1.25, 1.10, 1.08, 1.31 °C and 1.29, 1.19, 1.11, 1.37 °C, respectively. The BP neural network method performed better for predicting the daily temperature variations in seasons. (4) The specifying data of high temperature (24 July 2020) and strong cold wave (31 December 2019) were selected to test the two model methods; the results showed that the simulation of the BP neural network model was better than the stepwise regression model.

1. Introduction

The Bailing mushroom is delicate in flesh and has high edible and medicinal value, and is deeply loved by consumers. It is a storable variety, easy to transport, and has a broad market demand. Bailing mushrooms were first distributed in Xinjiang and plateau areas in China, and then large-scale artificial cultivation and production was developed since 1996 [1].
Jizhou (39°45′ N–40°15′ N, 117°05′ E–117°47′ E) is located at the northernmost of Tianjin City, at the intersection of Beijing, Tianjin, Tangshan, and Chengde. The continental monsoon climate, with warm temperature, semi-humid, no heavy industrial zone in the area, superior natural environment and convenient transportation, is the largest edible mushroom cultivation base in North China. The traditional cultivation method for Bailing mushroom is free-air cultivation, but its growth and development are greatly affected by temperature; extreme temperature will reduce the production of, or even destroy, Bailing mushrooms [2]. The temperature regulation ability of greenhouses can effectively defend against the risk of extreme temperature disasters for Bailing mushrooms [3], but the temperature of Jizhou is hot in summer and cold in winter, and cultivation for the Bailing mushroom is adaptable to extreme high and low temperature disasters [4]. However, the meteorological department usually only releases atmospheric temperature information. How to determine and predict the temperature inside the greenhouse, according to the environmental factors outside the shed, and do a good job of providing early warning of high and low temperatures for Bailing mushrooms in the greenhouse, is a particular focus.
In order to prevent the influence of the temperature in the greenhouse on the crop quality and production during the greenhouse planting process, many studies have been carried out as to how to build an effective model to predict temperature in the greenhouse. As early as the 1960s, Walker [5] established an energy balance model suitable for full-size greenhouses to predict the temperature in the shed, but there was a large error in the calculation of heat flow. Establishing the energy conservation equation in the greenhouse is an effective means to predict the temperature in the greenhouse [6,7,8]. However, due to the weak closure of plastic greenhouses, the applicability of this method for plastic greenhouses is poor. Kumar et al. [9] established a prediction model for the subtropical flower greenhouse by using a parallel comparison evaluation method, but the simulation results were greatly affected by the angle of the roof vent.
Machine learning is a widely used method to predict the temperature in greenhouses. Castaeda Miranda and Víctor M [10] established an intelligent frost control system for a greenhouse in central Mexico based on a neural network model. Yu et al. [11] established a new prediction model based on least squares support vector machine (LSSVM) using the meteorological data of Shandong Province from November 2013 to January 2014 to predict the temperature of a domestic solar greenhouse. Liu et al. [12] established a random forest algorithm prediction model based on the daily meteorological data inside and outside the shed from 4 December 2018 to 10 February 2019 and predicted and analyzed the maximum and minimum temperature inside the shed. Among various prediction models, the BP (back propagation) neural network model [13,14] and regression model [15] are two more effective methods. Liu et al. [16] established a BP neural network model to predict the temperature variation trend in the greenhouse for the future 1 to 7 days, based on the daily meteorological data of Tianjin from 2011 to 2013 in winter. Lin and Zheng [17] established a grey BP neural network model to simulate the annual average temperature of Fuzhou from 2006 to 2016. Shu et al. [18] established a linear regression model by using the daily temperature data in winter from 2012 to 2013 to analyze the correlation between the daily minimum temperature inside and outside the vegetable greenhouses in Zhejiang. Zhang et al. [19] established a regression model to predict the indoor temperature by using the daily indoor and outdoor temperature data of a solar greenhouse from November 2017 to March 2018.
Many researches showed that the temperature in the shed is greatly affected by the types of crops planted [20,21]. Due to the different biological characteristics of different crops, the existence of crops will affect the temperature in the greenhouse. Due to the different biological habits of different crops, the ways of manually adjusting the greenhouse were different (opening and closing the greenhouse, humidification in the greenhouse, etc.), so the temperature changes in the greenhouse with the same configuration are different due to crop varieties in the same area. With the increasing market demand for fungus food, with the Bailing Mushroom as one of the high-quality varieties, it is very important to build a prediction model in the greenhouse by using effective methods.
Based on air temperature, wind speed, relative humidity, air pressure, etc., of the regional automatic weather station receiving data every 10 min in Chutouling Town, Jizhou, Tianjin, from April 2019 to November 2020, and air temperature of the microclimate observation station in the Bailing mushroom greenhouse (the change rule of the temperature in the greenhouse is different for different crops), a 10 min air temperature prediction model in the Bailing Mushroom greenhouse in different seasons was established, using a BP neural network and stepwise regression. In order to further predict the daily change of temperature in the greenhouses, a prediction model of 10 min-daily change of temperature in greenhouses throughout the four seasons was established, and the daily prediction effect of the model of typical hot weather and low temperature weather was tested, in order to provide a basis for farmers to make scientific and effective prevention and control measures against high and low temperature disasters.

2. Data Sources and Research Methods

2.1. Observation Site

The observation site is the Bailing Mushroom Planting Demonstration Base (117°41′ E, 40°04′ N) at Chutouling Town, Jizhou. The experimental greenhouse is 56 m long and 14.6 m wide. According to the actual needs, the shading net and the thermal insulation quilt are uncovered. There are ventilation openings on the north and south sides. There are no heating facilities in the shed. In the middle of the greenhouse, there is a small climate automatic collector at 1.5 m from the ground to observe the temperature in the greenhouse, and the collection interval is 10 min.

2.2. Data Sources

The data used in this article were: 10 min air temperature (outside the shed), relative humidity, wind speed, air pressure of the regional automatic weather station, and 10 min air temperature (inside the shed) of the microclimate observation station in the greenhouse from April 2019 to November 2020.

2.3. Research Methods

2.3.1. Seasonal Division Standard

The temperature in the greenhouse for Bailing mushroom was greatly affected by the season. In order to accurately predict the temperature in the greenhouse, the annual seasons were divided according to the climatological method, namely: spring (March–May); summer (June–August); autumn (September–November); winter (December–February of the following year).

2.3.2. BP Neural Network Model

The BP (back propagation) neural network is multi-layer feedforward neural and network trained according to the error back propagation algorithm [22,23,24,25]. It uses gradient search technology to minimize the error mean square error between the network output value and the expected value, so as to achieve the purpose of prediction. An efficient method for nonlinear forecasting. The advantages of the BP neural network model lie in the few parameters required, the strong pertinence and the high simulation accuracy.
Mathematical statistical analysis method was used to analyze the correlation between the 10 min air temperature in the greenhouse and the meteorological elements outside the greenhouse (10 min outdoor temperature, relative humidity, wind speed, and air pressure), as shown in Table 1.
It could be seen from Table 1 and Table 2 that the meteorological elements outside the shed have a good correlation with the temperature inside the shed and passed the significance test. The correlation coefficient was significantly different in different seasons, indicating that seasons had a significant impact on the temperature in the greenhouse. In different seasons, the correlation coefficient of air temperature outside the shed is the largest, indicating that this factor is the most important factor affecting the temperature inside the shed. The correlation coefficients of wind speed, humidity and air pressure were relatively small, but they pass the significance test. Relevant research showed that these factors also play an important role in the temperature variation in the greenhouse [26,27]. Therefore, it is feasible to take the temperature, relative humidity, wind speed, air pressure and other factors outside the greenhouse in different seasons as input variables.
According to the principle of learning optimization, taking the 10 min outside air temperature, relative humidity, wind speed, and air pressure as the model input variables, and taking the indoor air temperature as the model output, the model prediction test was conducted to find the optimal hidden layer structure. This model uses a three-layer neural network. The first layer of input neurons is 4, which are the air temperature, relative humidity, wind speed and air pressure outside the shed for 10 min. The hidden layer of the middle layer is 256. After passing through the middle layer, the ReLU activation function is used, and then passed to the last layer. The last layer of neurons is 1, and the predicted value of the temperature in the shed is output. The model structure is shown in Figure 1.
ReLU ( x ) = { 0 ,   x 0 x ,   x > 0
where x is the input independent variable, x = [ x 1 x 2 x 3 x 4 ] , x1 is outside temperature, x2 is relative humidity, x3 is 10 min wind speed, x4 is air pressure.
The model uses the Adam optimizer, sets the learning rate to 0.001, uses the L1 loss function, the default number of each load is 3000, the default training is 50 rounds, and the model is saved after training.
L 1 = i = 1 n | Y i f ( x i ) |
where Y i is the true value, f ( x i ) is the predicted value, and n is the number of samples.
In order to solve the problem of inconsistent units and orders of magnitude between the input variables of the neural network, the data is normalized. The normalization process uses the BN algorithm (batch normalization), namely:
Calculate the mean μ for each batch along the channel:
μ = 1 n i = 1 n x i
Calculate the variance σ2 for each batch along the channel:
σ 2 = 1 n i = 1 n ( x i     μ ) 2
where n is the number of samples; x i is the input variable value. Normalize the input variables:
x i ~ = x i μ σ 2 + ε
x ~ i is the data after the i-th change; ε is a random variable. Introduce zoom and translation variables to calculate normalized values:
y i = γ x ~ i + β
where, yi is the normalized value, γ is the scaling variable, β is the translation variable.
There is no transfer function from the hidden layer to the output layer, and the input is four-dimensional and outputs a value. This study used gradient descent and the weights were automatically optimized. Gradient descent normal equation:
θ n e x t = θ n o w α f ( θ n o w )
where, θnext is the coordinate of x at the next moment, θnow: is the coordinates of x at the current moment, f(θnow) is the derivative of the objective function at the point of now).
The model selected the relevant parameter values: the initial learning rate η = 0.1, the maximum number of cycles is 10,000 times, and the target variance is 0.0001. The neural network model is implemented by programming with Python 3.6 software. In order to ensure the accuracy of the prediction effect of the established model, 70% of the sample data was randomly selected as the training sample, and the remaining 30% was used as the test sample.

2.3.3. Stepwise Regression Model

Stepwise regression is a linear regression model independent variable selection method [28,29,30]. Through continuous screening of variables, the model retained variables that were the most important, and there was no serious multicollinearity, so as to obtain the optimal regression model. The stepwise regression model is one of the most traditional forecasting methods in meteorological forecasting.
In this paper, the mathematical statistics analysis method was used to establish a stepwise regression model to predict the temperature in the greenhouse. The stepwise regression model equation is:
Y = b 0 + b 1 X 1 + b 2 X 2 + + b n X n + ε
where, b0 is a constant, X1, X2, …, Xn are the variable factors introduced to build the stepwise regression model, b1, b2, …,bn are the variable coefficients, and ε is the random error.

2.3.4. Model Checking

The root mean squared error (RMSE) and the mean absolute error (MAE) were used to analyze the simulation accuracy of the model and the acceptable between the simulated and observed values.
R M S E = i = 1 n ( O B S i S I M i ) 2 n
M A E = i = 1 n | O B S i S I M i | n
where, OBSi is the model simulation value, SIMi is the actual observed value, and n is the number of samples.

3. Results and Analysis

The temperature in the greenhouse for Bailing mushrooms was greatly affected by the meteorological factors outside the greenhouse; the greenhouse has the ability to control the temperature, which results in a temperature difference between the inside and outside of the greenhouse. If the temperature in the greenhouse for Bailing mushrooms is predicted only by the temperature outside the shed, there will be a big deviation, so that farmers cannot respond to extreme temperature changes in time, and then suffer huge economic losses. Therefore, it was very important to establish a temperature prediction model in the greenhouse.

3.1. Prediction Model of Temperature in Greenhouse of Four Seasons

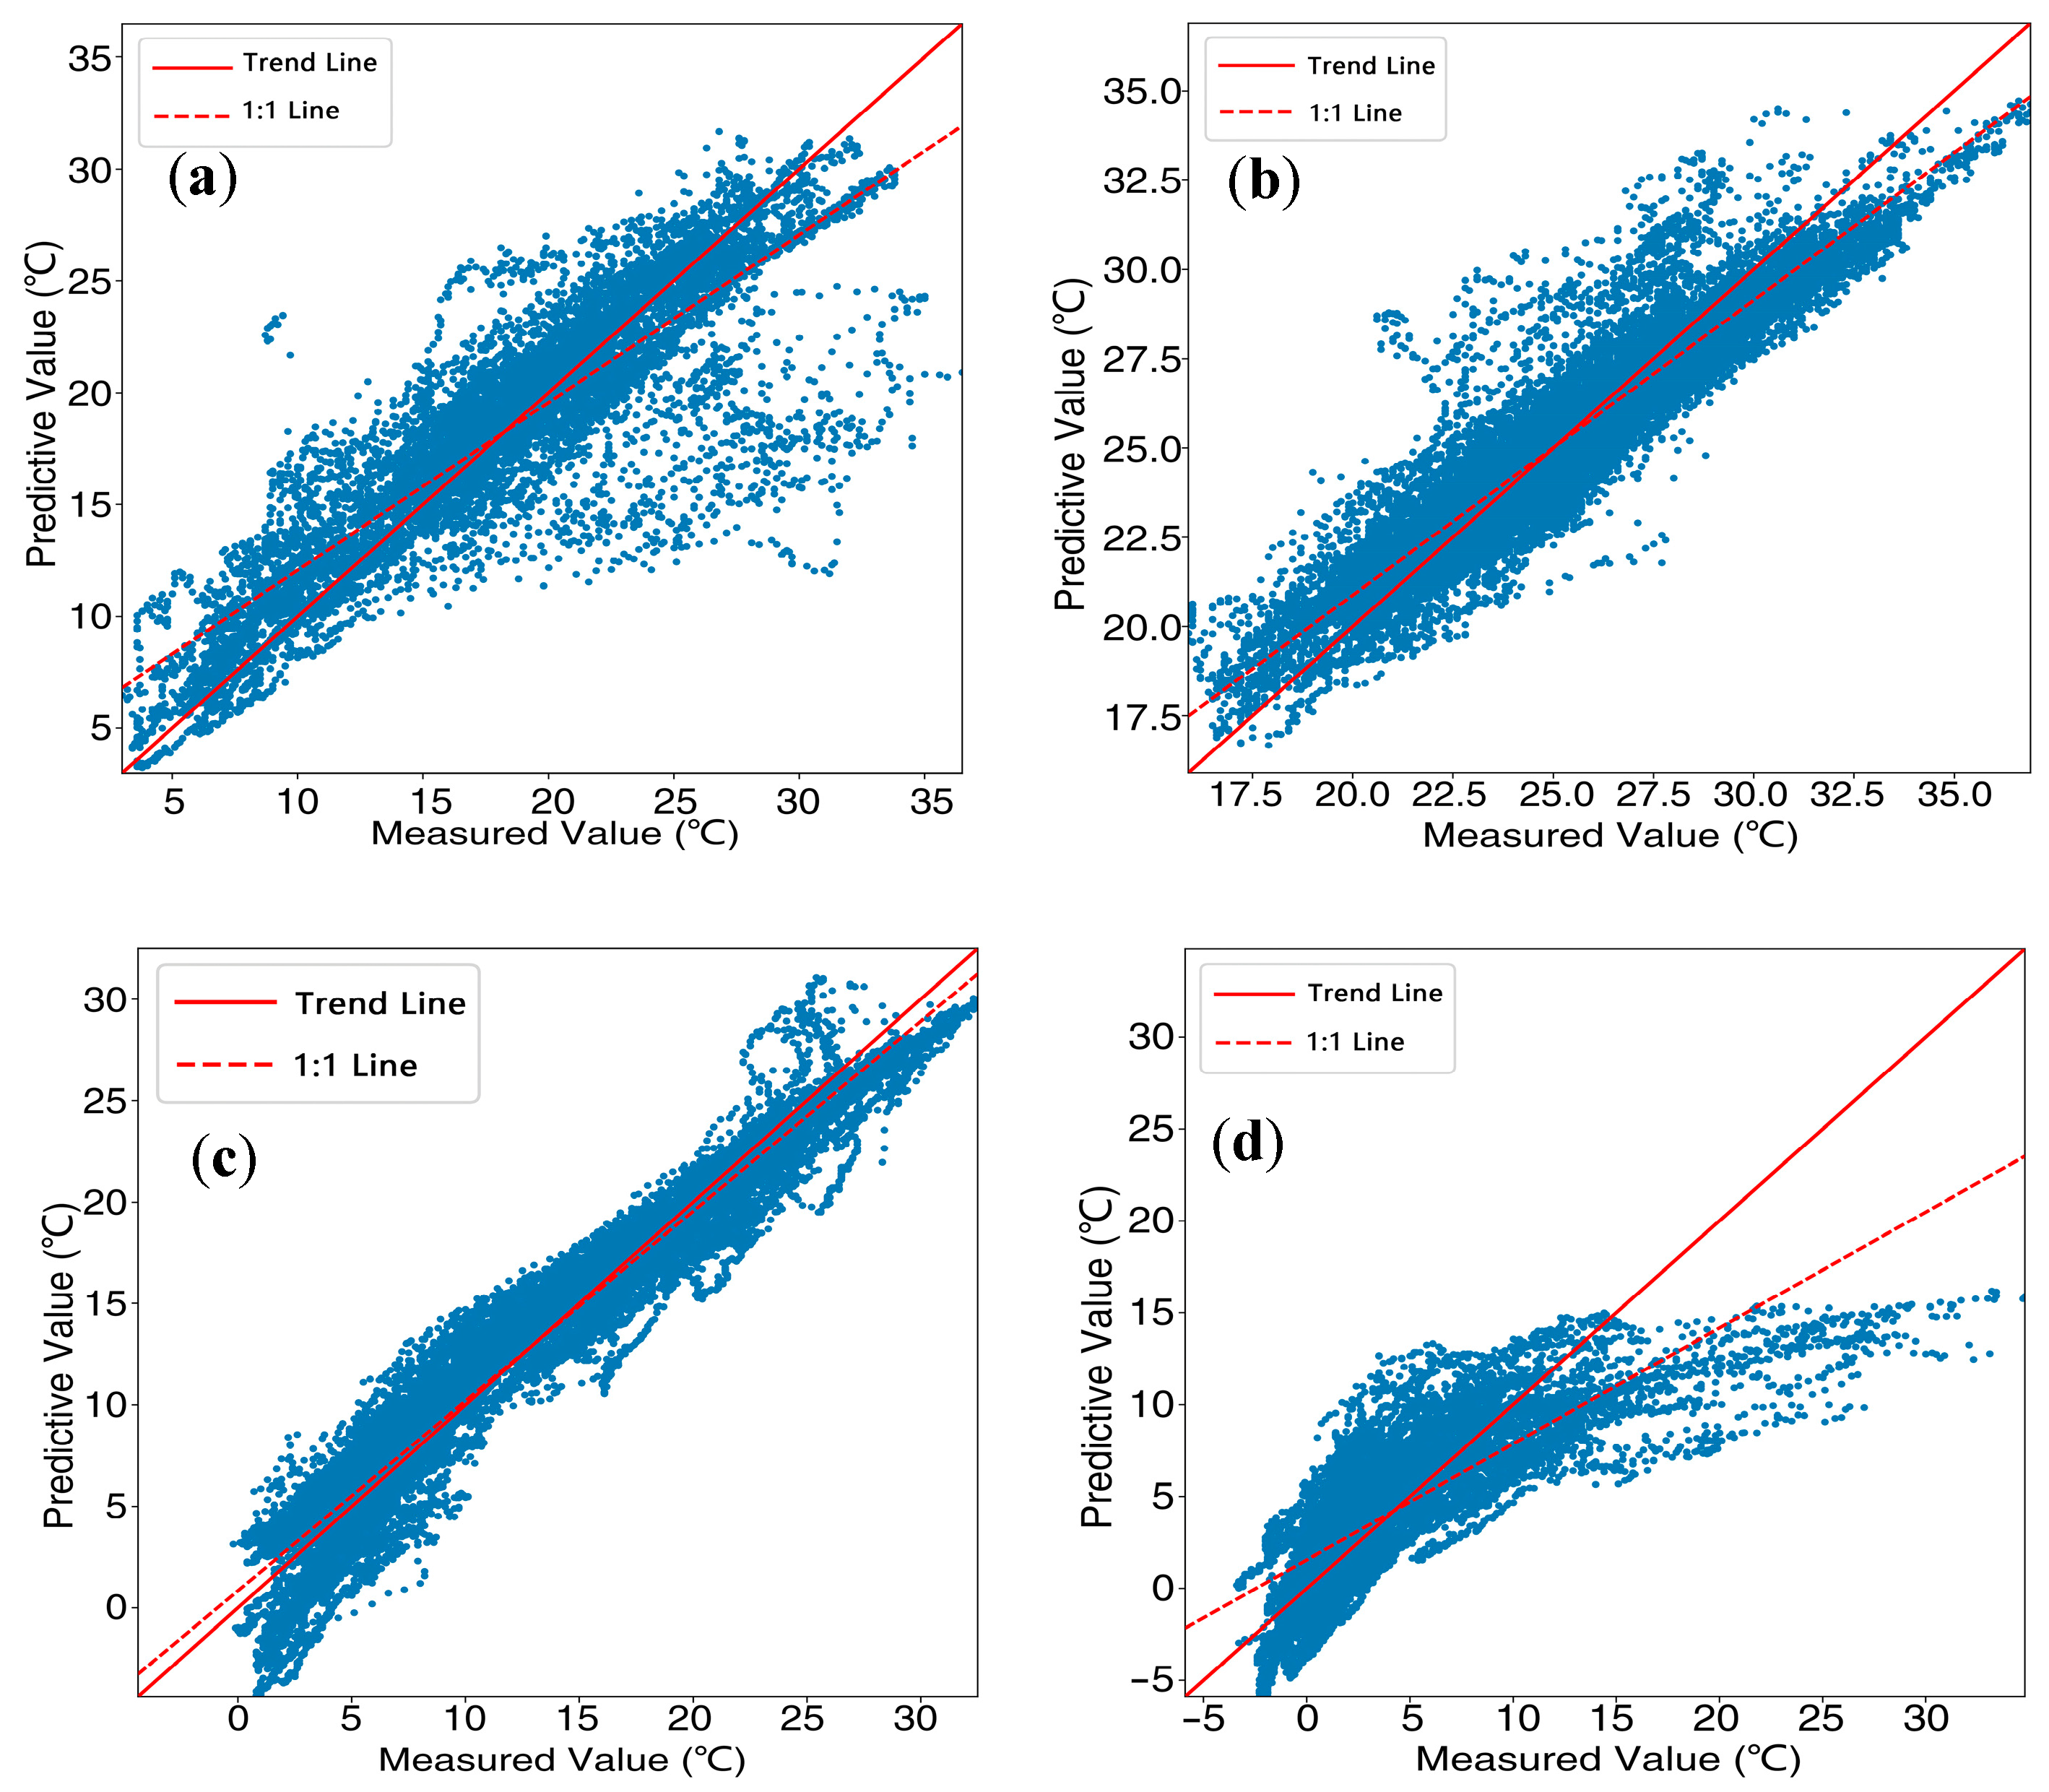
3.1.1. Prediction Model of Temperature Based on BP Neural Network

The temperature in the shed was greatly affected by seasonal changes, so the samples were divided into four seasons: spring, summer, autumn and winter, and the BP neural network model was input to obtain the network weights and thresholds. Then the test samples were input into the model for testing and prediction, and the air temperature and the actual air temperature was analyzed to test the prediction effect of the model. In this study, the above methods were used to simulate the temperature inside the shed by using the meteorological elements outside the shed. The results were shown in Figure 2.
It can be seen from Figure 2, the data was basically concentrated around the 1:1 line. The coefficients of determination for spring, summer, autumn and winter were: 0.75, 0.87, 0.94 and 0.64, respectively. The mean absolute errors were: 2.19, 1.01, 1.53 and 2.30 °C; the root mean square errors were: 3.29, 1.33, 1.88 and 3.23 °C. It can be seen from different seasons that the simulation effect in summer was the best and the accuracy was the highest, followed by autumn, and the simulation effect in spring and winter was poor and the accuracy was lower. The main reason was the high temperature in summer and autumn, when the greenhouse was often in a ventilated state; while the temperature in spring and winter was low and the greenhouse needed to be kept closed and covered with a thermal insulation quilt. Therefore, the manual intervention was relatively large, which made the model simulation accuracy lower in spring and winter. Overall, under different seasonal conditions, the average absolute error between the predicted value and the measured value was below 2.3 °C, and the root mean square error was below 3.23 °C, and the fitting results were adapting.

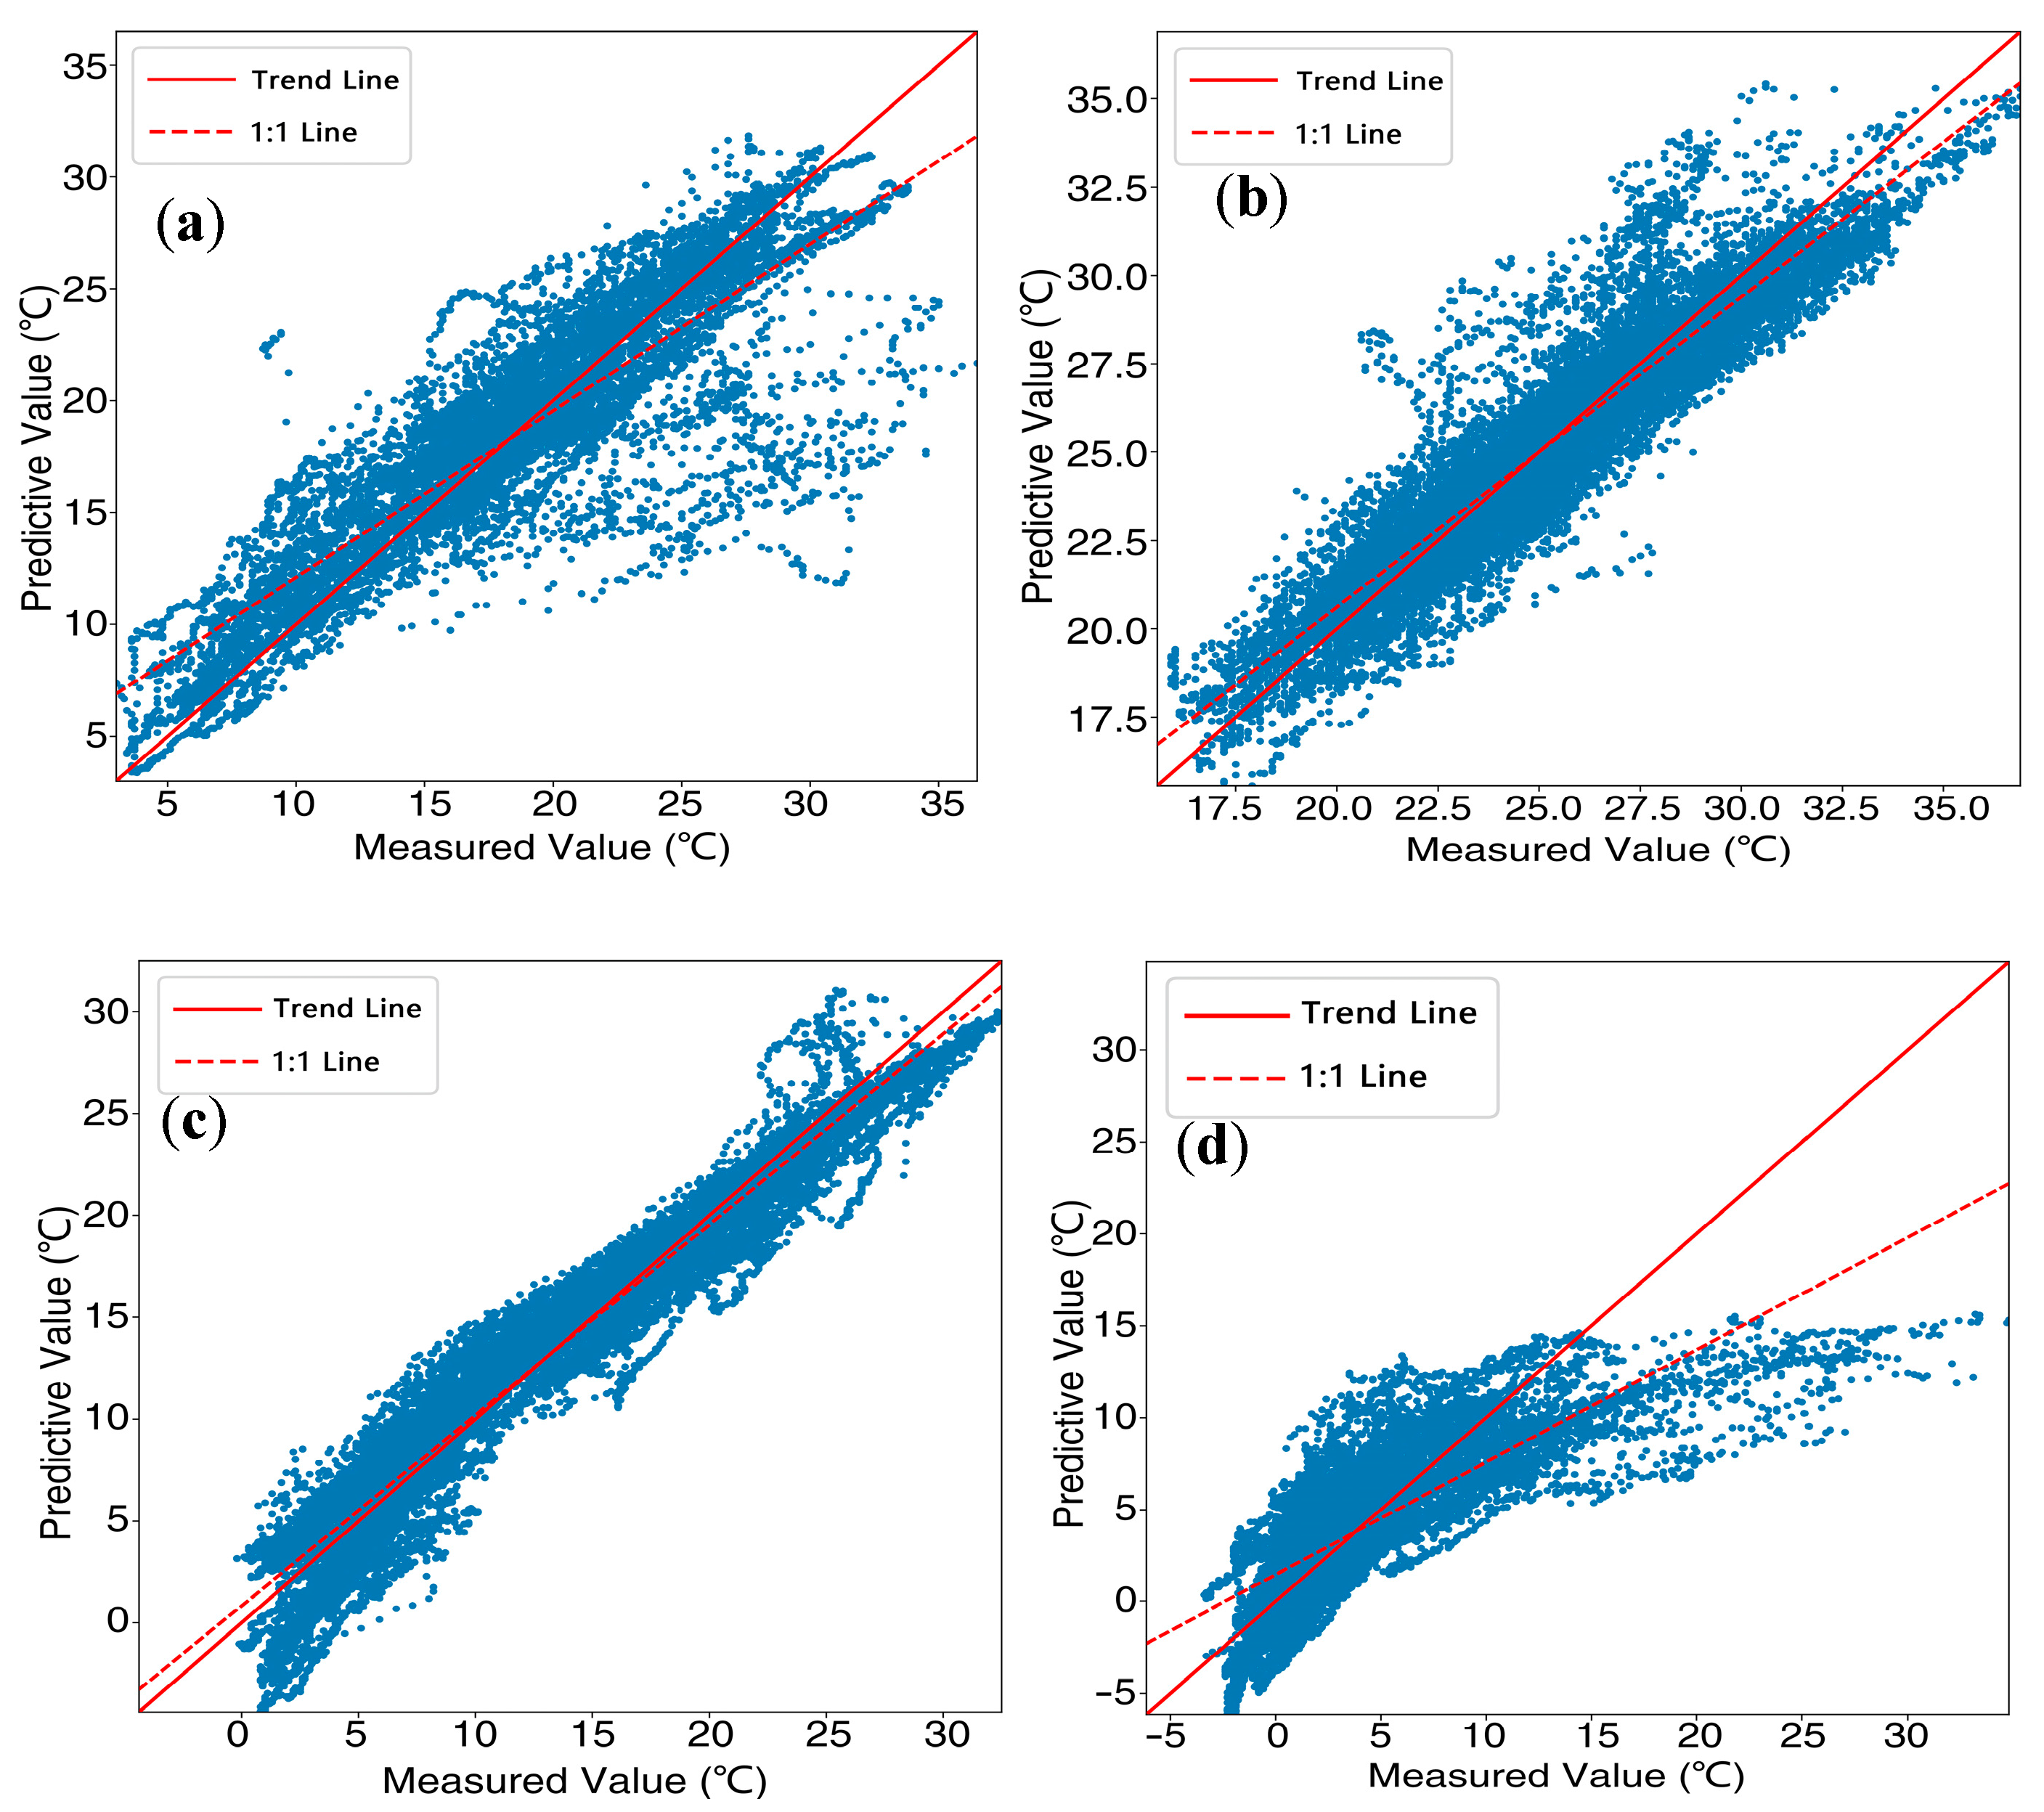
3.1.2. Prediction Model of Temperature Based on Stepwise Regression

The meteorological elements of different seasons were brought into the stepwise regression model, and the regression equation of the temperature in the greenhouse for the four seasons for the Bailing mushroom was established, and the temperature in the greenhouse was predicted. The results are shown in Figure 3, and the stepwise regression equation is shown in Table 3.
It can be seen from Figure 3, that the simulation effect of the stepwise regression model is better, and the data set is basically concentrated around the 1:1 line. The coefficients of determination for spring, summer, autumn and winter were: 0.74, 0.86, 0.94 and 0.63; the mean absolute errors were: 2.24, 0.98, 1.54 and 2.31 °C; the root mean square errors are: 3.33, 1.31, 1.89 and 3.29 °C. From the seasonal point of view, summer had the highest fitting accuracy, followed by autumn. The mean absolute error and root mean square error of spring and autumn were larger, and the fitting degree was poor.
It could be seen from Table 3, that the factors that had a significant impact on the temperature in the shed are gradually screened and retained according to the optimal principle. Wind speed, humidity and air pressure also have a significant impact on the model simulation results. Therefore, it was necessary to retain these three factors to correctly build the temperature prediction model in the shed.
Comparing the prediction results of the BP neural network model and the stepwise regression model, it can be seen that the simulation results of the BP neural network model were higher than the stepwise regression model except in summer. The simulation results of the two models were that the accuracy was the highest in summer, followed by autumn, and the effect was poor in spring and winter.

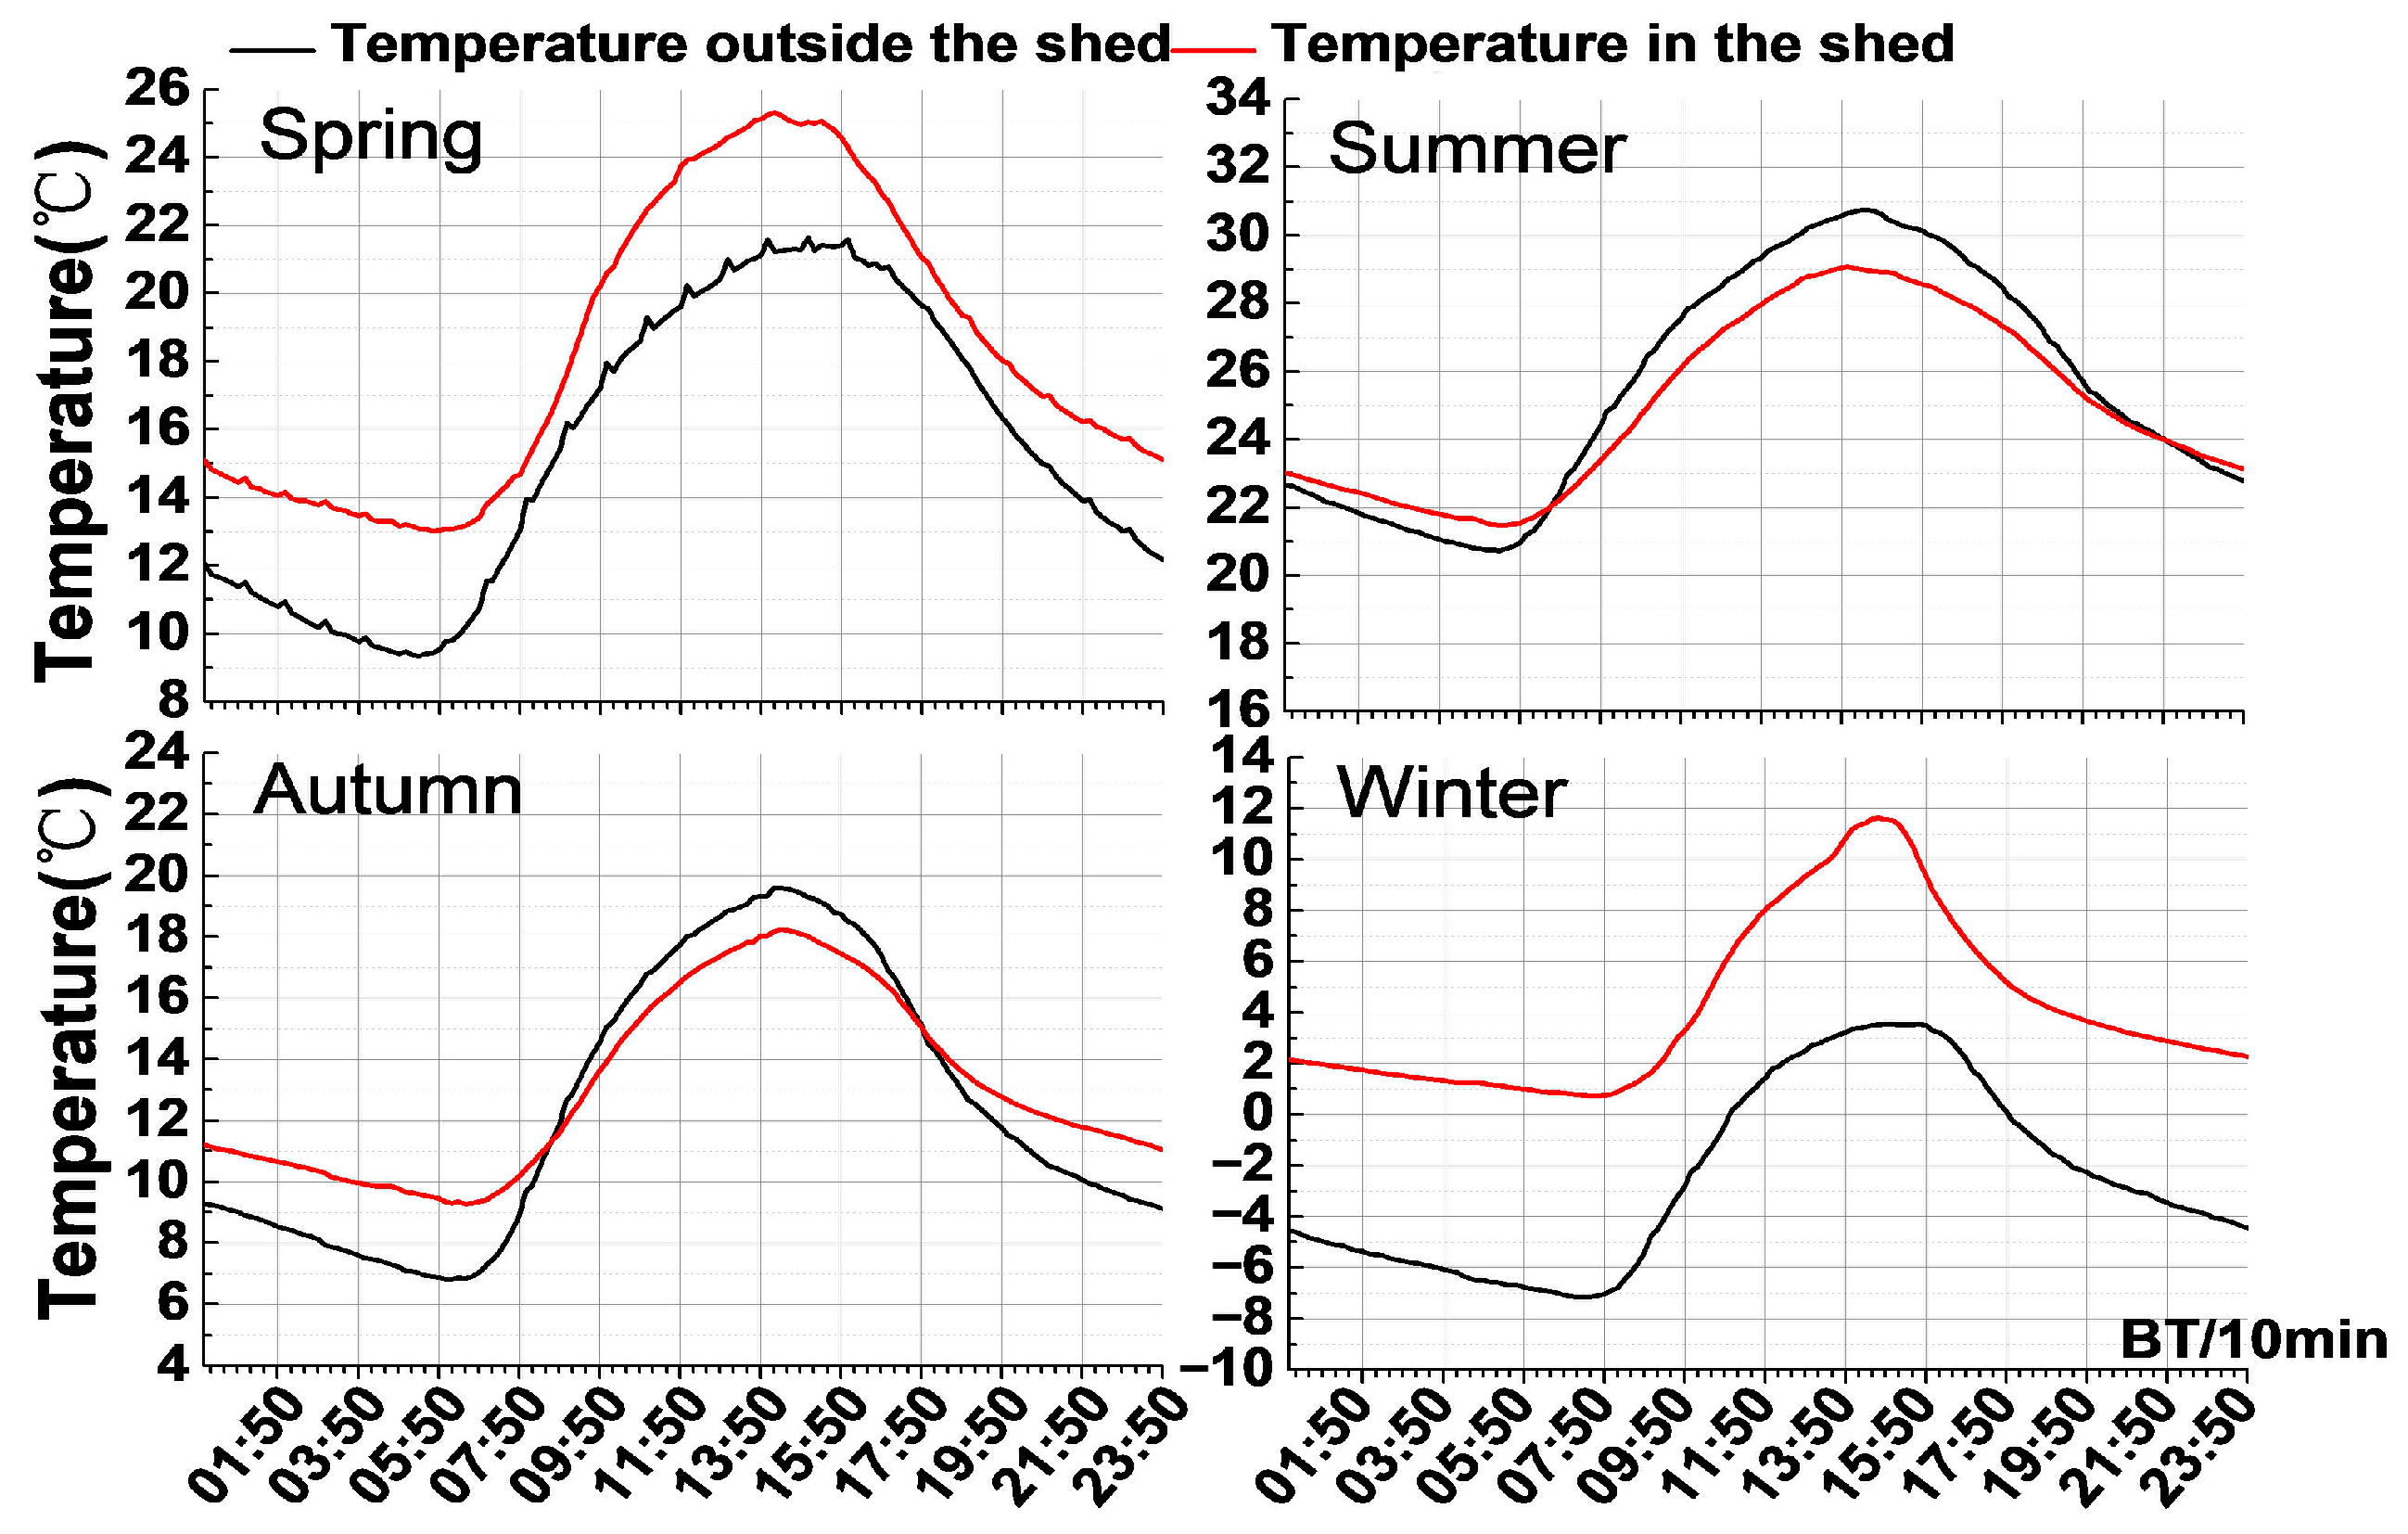
3.2. The Daily Variation of Temperature in the Greenhouse of Bailing Mushroom

The temperature inside and outside the greenhouse for the Bailing mushroom was greatly affected by the season. In order to further predict the daily change of the temperature in the greenhouse for the Bailing mushroom in the four seasons, it was first necessary to clarify the change characteristics of the temperature in the greenhouse in different seasons. Figure 4 showed the temperature changes inside and outside the shed under different seasonal conditions. It can be seen from Figure 4 that the greenhouse shows a warming effect in spring and winter, and the warming effect in winter was significant; in summer and autumn, before and after sunrise, the greenhouse had a warming effect, and the rest of the period had a cooling effect. After sunrise, the temperature in the shed rose rapidly, and the temperature rose significantly in spring (07:00–12:00) and winter (08:00–14:00), with a heating rate of 0.35 °C/10 min in spring and 0.28 °C/10 min in winter. In summer (06:00–13:00) and autumn (07:00–14:00), the heating rate was smaller, 0.17 °C/10 min in summer and 0.18 °C/10 min in autumn. After reaching the highest temperature near 14:00, the temperature in the shed gradually decreased, and the cooling rate was larger in spring (16:00–20:00) and winter (15:00–19:00), 0.27 °C/10 min in spring, and 0.38 °C/10 min in winter. The cooling rate was 0.13 °C/10 min in summer (16:00–20:00), and 0.22 °C/10 min in autumn (16:00–20:00).
The variations of temperature inside and outside were basically the same in the different seasons, which additionally explained that the temperature outside the shed was the main factor affecting the temperature inside the shed, but the temperature difference between inside and outside was very significant, and the result error of predicting the temperature inside the shed only using the temperature outside the shed was a wide difference, so it was very important to establish a multi-factor temperature prediction model inside the greenhouse.

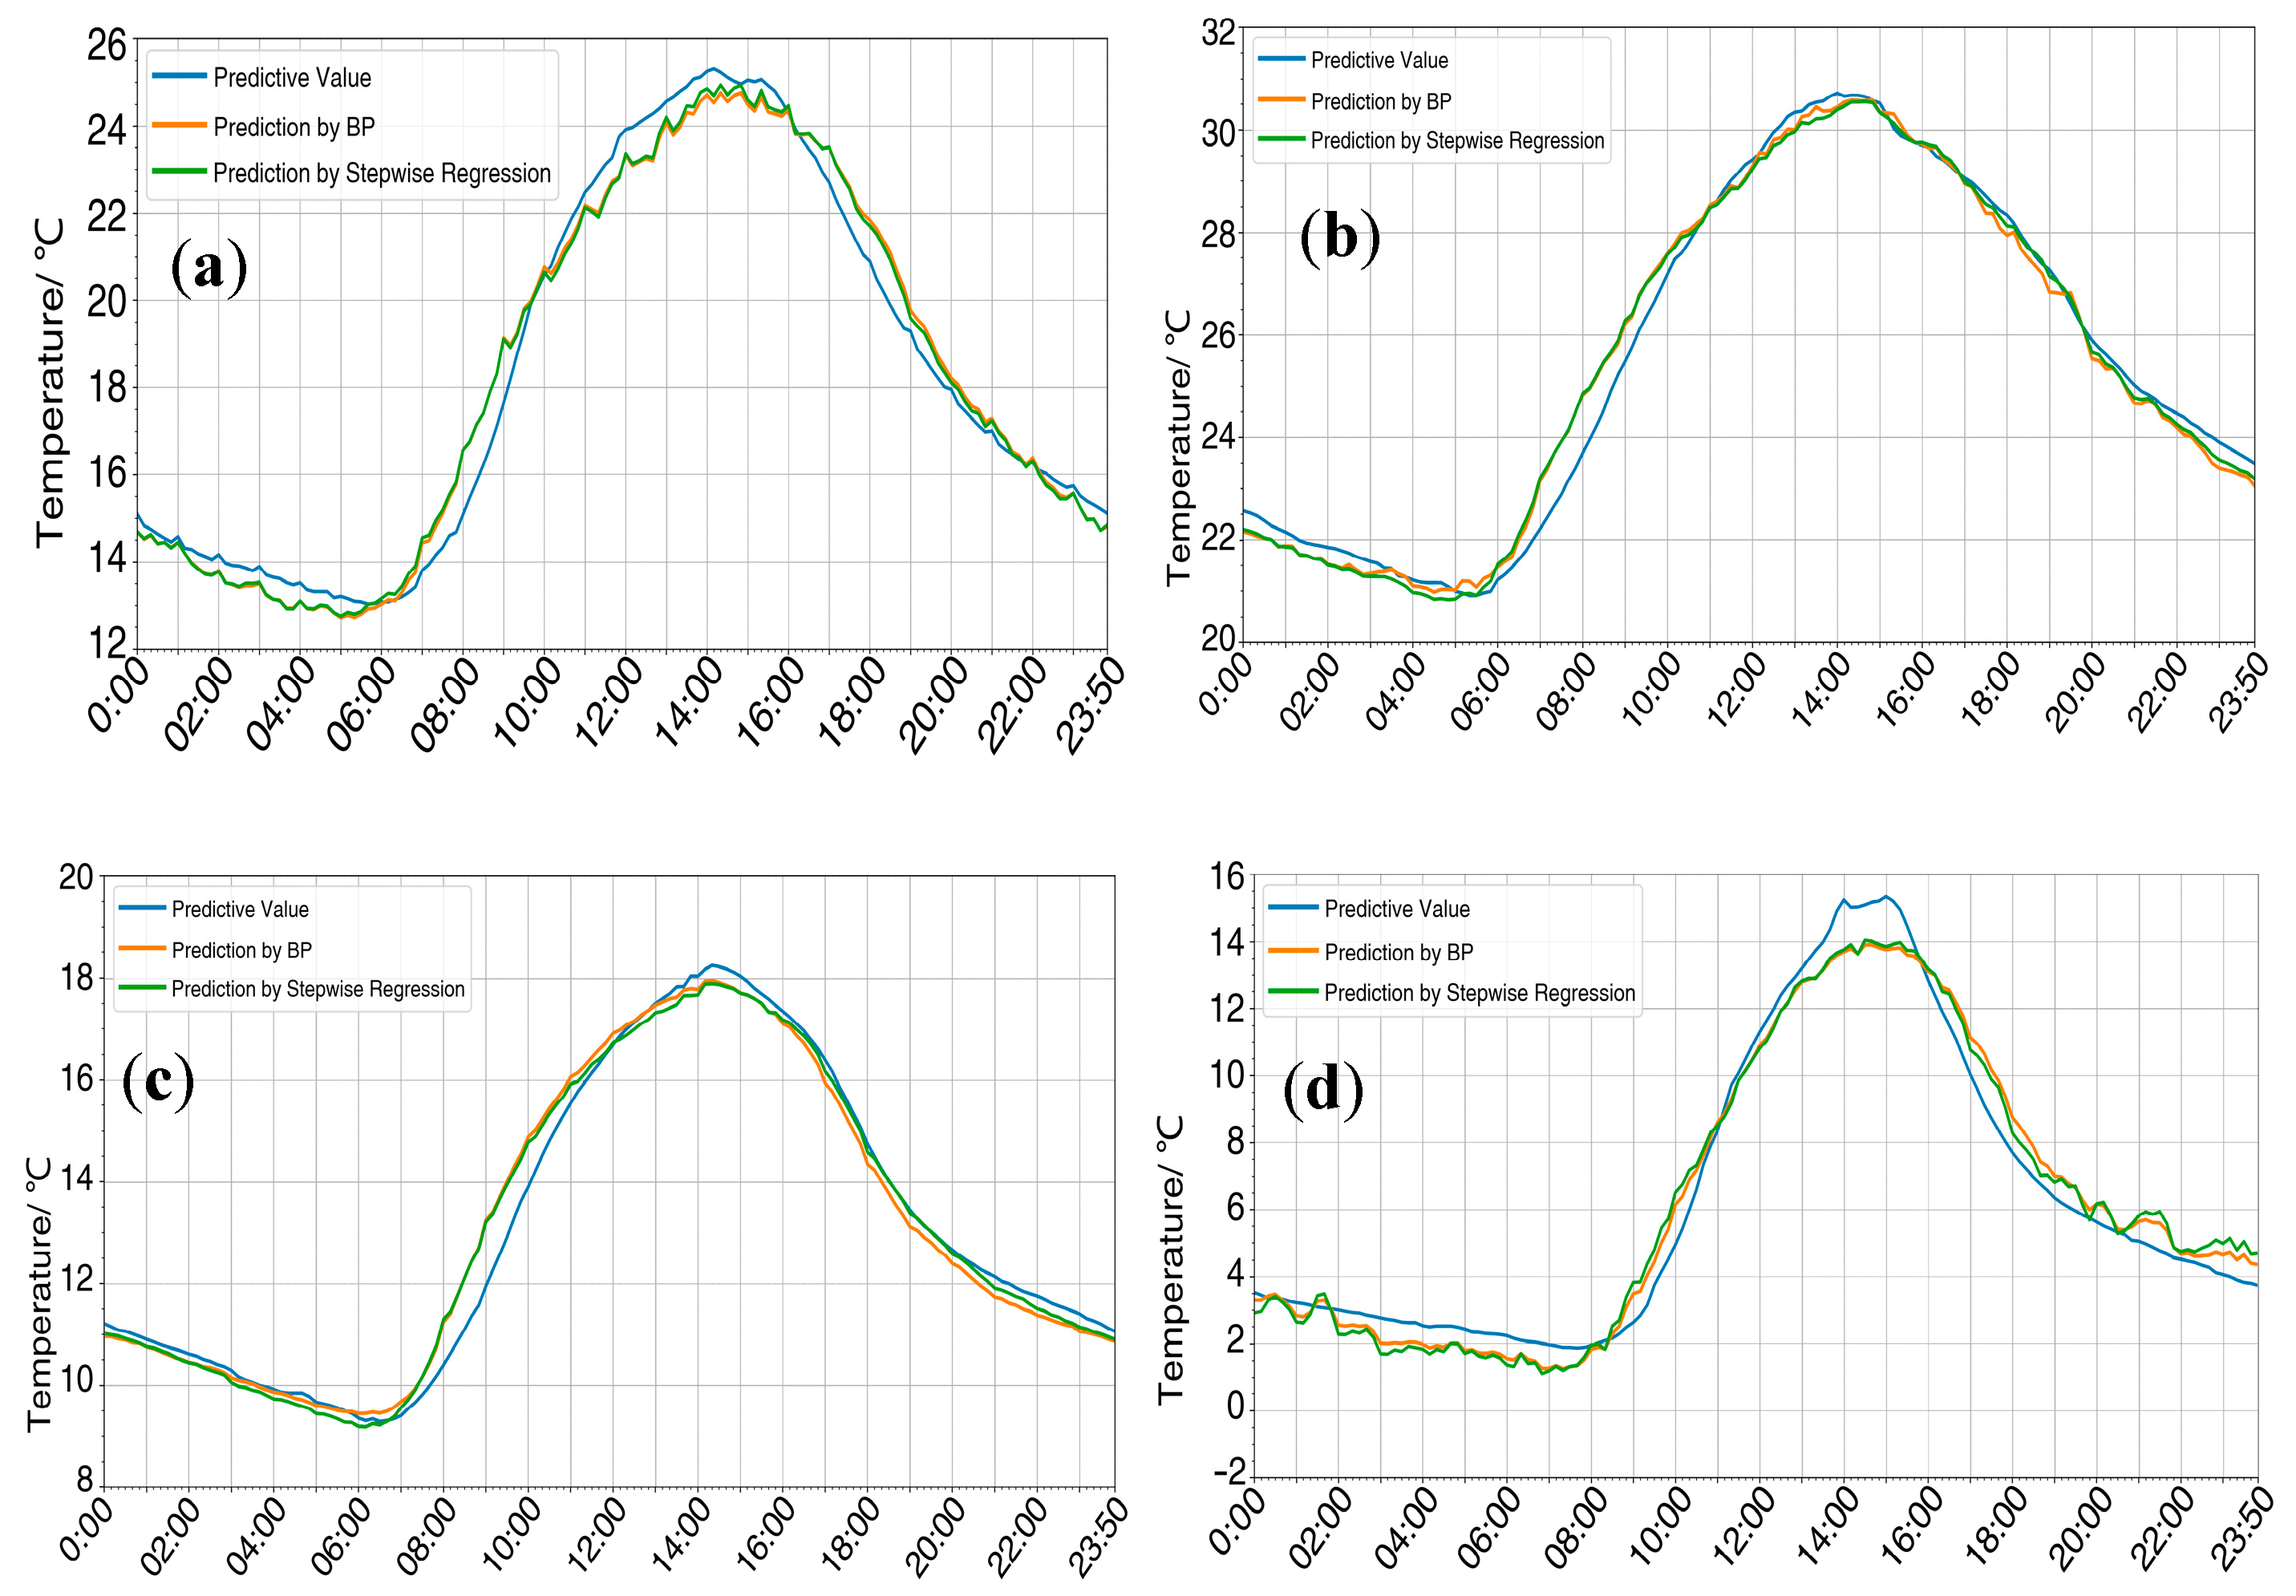
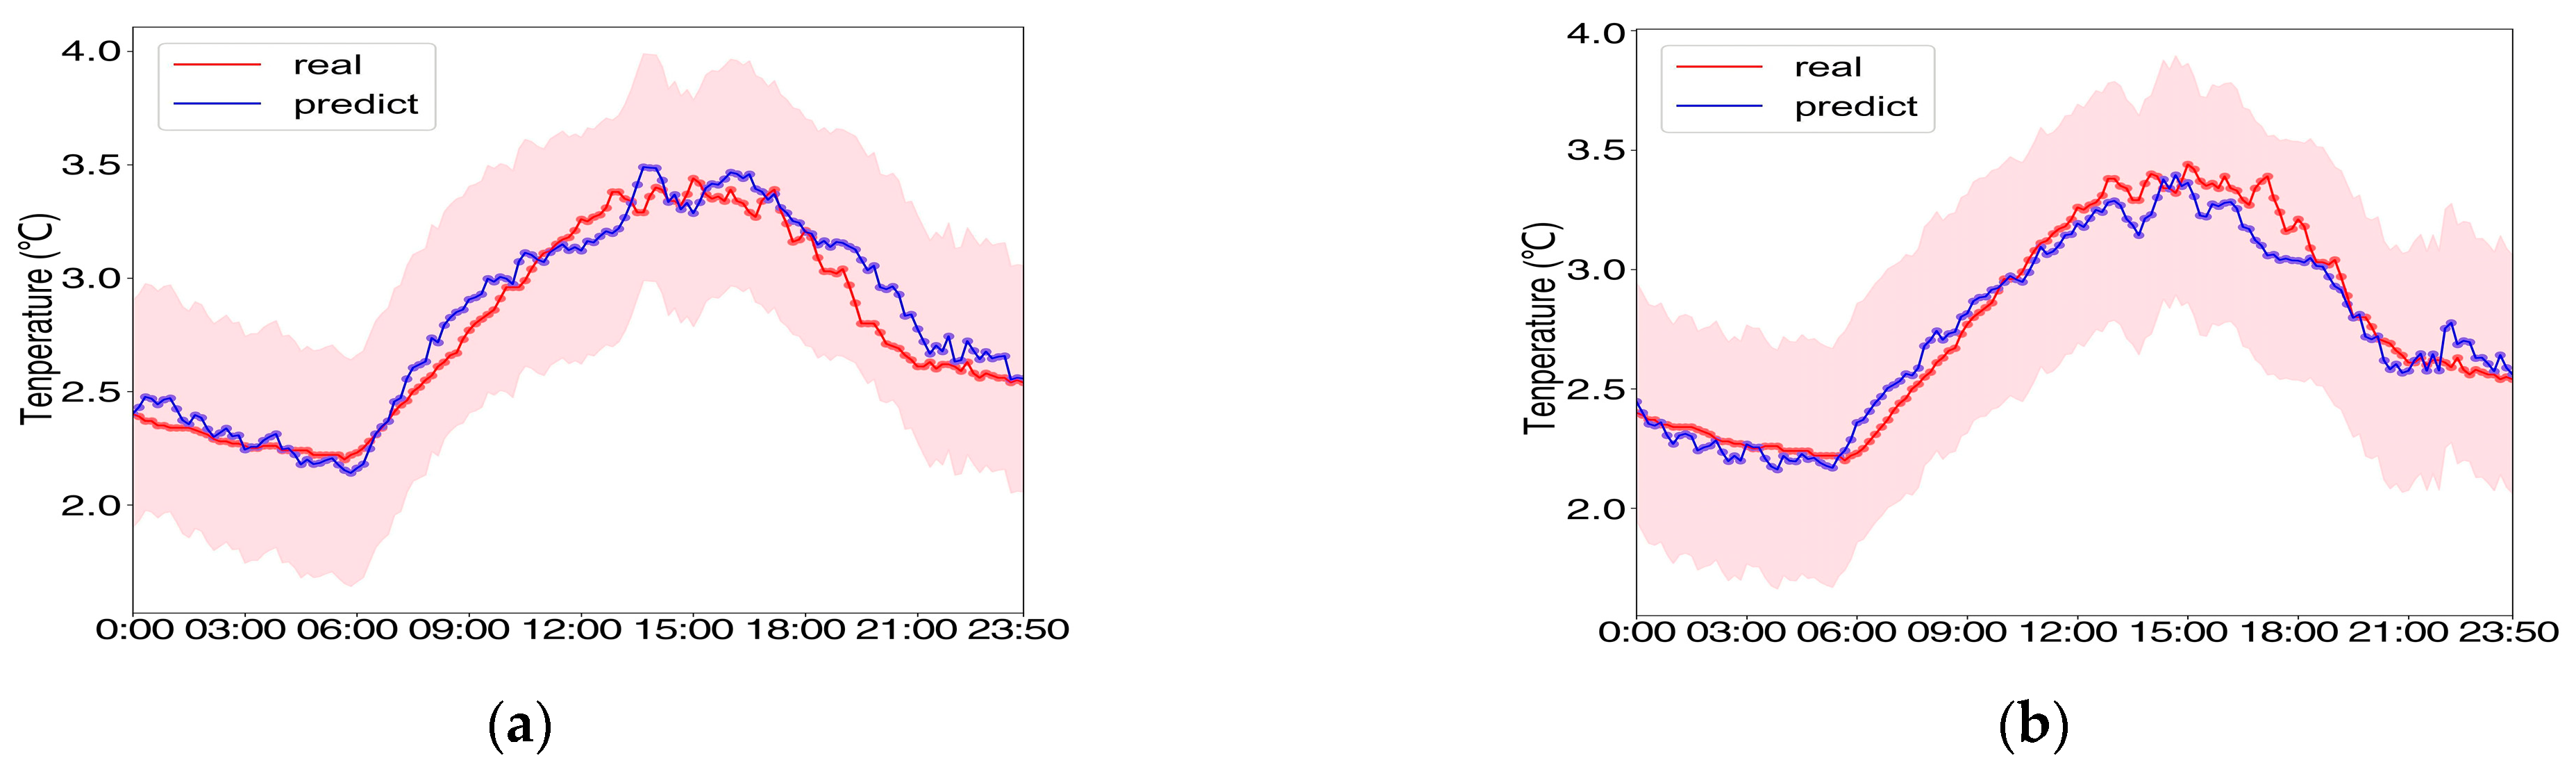
3.2.1. Diurnal Variation Prediction Model of Temperature in Greenhouse for Four Seasons

In different seasons, the temperature in the greenhouse varied greatly, rising and cooling. In order to accurately predict the temperature in the greenhouse of Bailing mushrooms in different seasons, the BP neural network and the stepwise regression method model were used to predict and analyze the temperature in the greenhouse for per 10 min. Table 4 was the prediction equation for the stepwise regression method to predict the temperature in the greenhouse for Bailing mushrooms in different seasons. Through the data back-substitution, the prediction effect of the stepwise regression model was obtained.
Figure 5 showed the prediction results of the temperature in the greenhouse for Bailing mushrooms in different seasons using BP neural network and stepwise regression. Compared with the model which was only used the air temperature outside, the accuracy of the two models, which were jointly constructed by the air temperature, wind speed, humidity and air pressure outside the greenhouse, was significantly improved to predict the temperature in the greenhouse. It could be seen from the figure that the prediction results of the two models are basically consistent: (1) Spring: 21:00–06:00 (the next day), 10:00–16:00, the predicted result was lower than the measured value, the error was within the range of 0.6 °C, 1.0 °C; 06:00–09:40, 16:10–20:50, the predicted value is higher than the measured values, the error was within the range of 1.5 °C and 1.0 °C. In spring, the error is relatively large from 07:00 to 19:00, within the range of 1.0 °C, and the error is around 0.5 °C in the rest of the period. (2) Summer: Except for 05:00–11:00, the predicted value was higher than the measured value, and the error is within 1.3 °C, and the predicted value in other periods was lower than or equal to the actual measured value, and the error is within 0.7 °C. (3) Autumn: Except for the period of 07:00–11:00, the maximum error of the two models was 1.1 °C, and the error of the other periods was about 0.5 °C. (4) Winter: During the period of 08:25–11:00 and 15:40–23:50, the predicted value was higher than the measured value, and the maximum error could reach 1.4 °C; during 00:00–08:25 and 11:00–15:40, the predicted value was lower than the measured value, and the maximum error was within the range of 1.5 °C.
The BP neural network model simulation results of the daily variation of temperature in the greenhouse in spring, summer, autumn and winter for Bailing mushroom showed that the root mean square errors were 1.25, 1.10, 1.08, 1.31 °C, and the average absolute errors were 1.10, 1.05, 0.93, 1.20 °C. The root mean square errors of the stepwise regression model were 1.29, 1.19, 1.11, 1.37 °C, and the mean absolute errors were 1.17, 1.09, 0.96, 1.29 °C. It could be seen that, in the simulation of daily temperature changes for Bailing mushroom greenhouses, the prediction effect of the BP neural network model in seasons was better than that of the stepwise regression model.

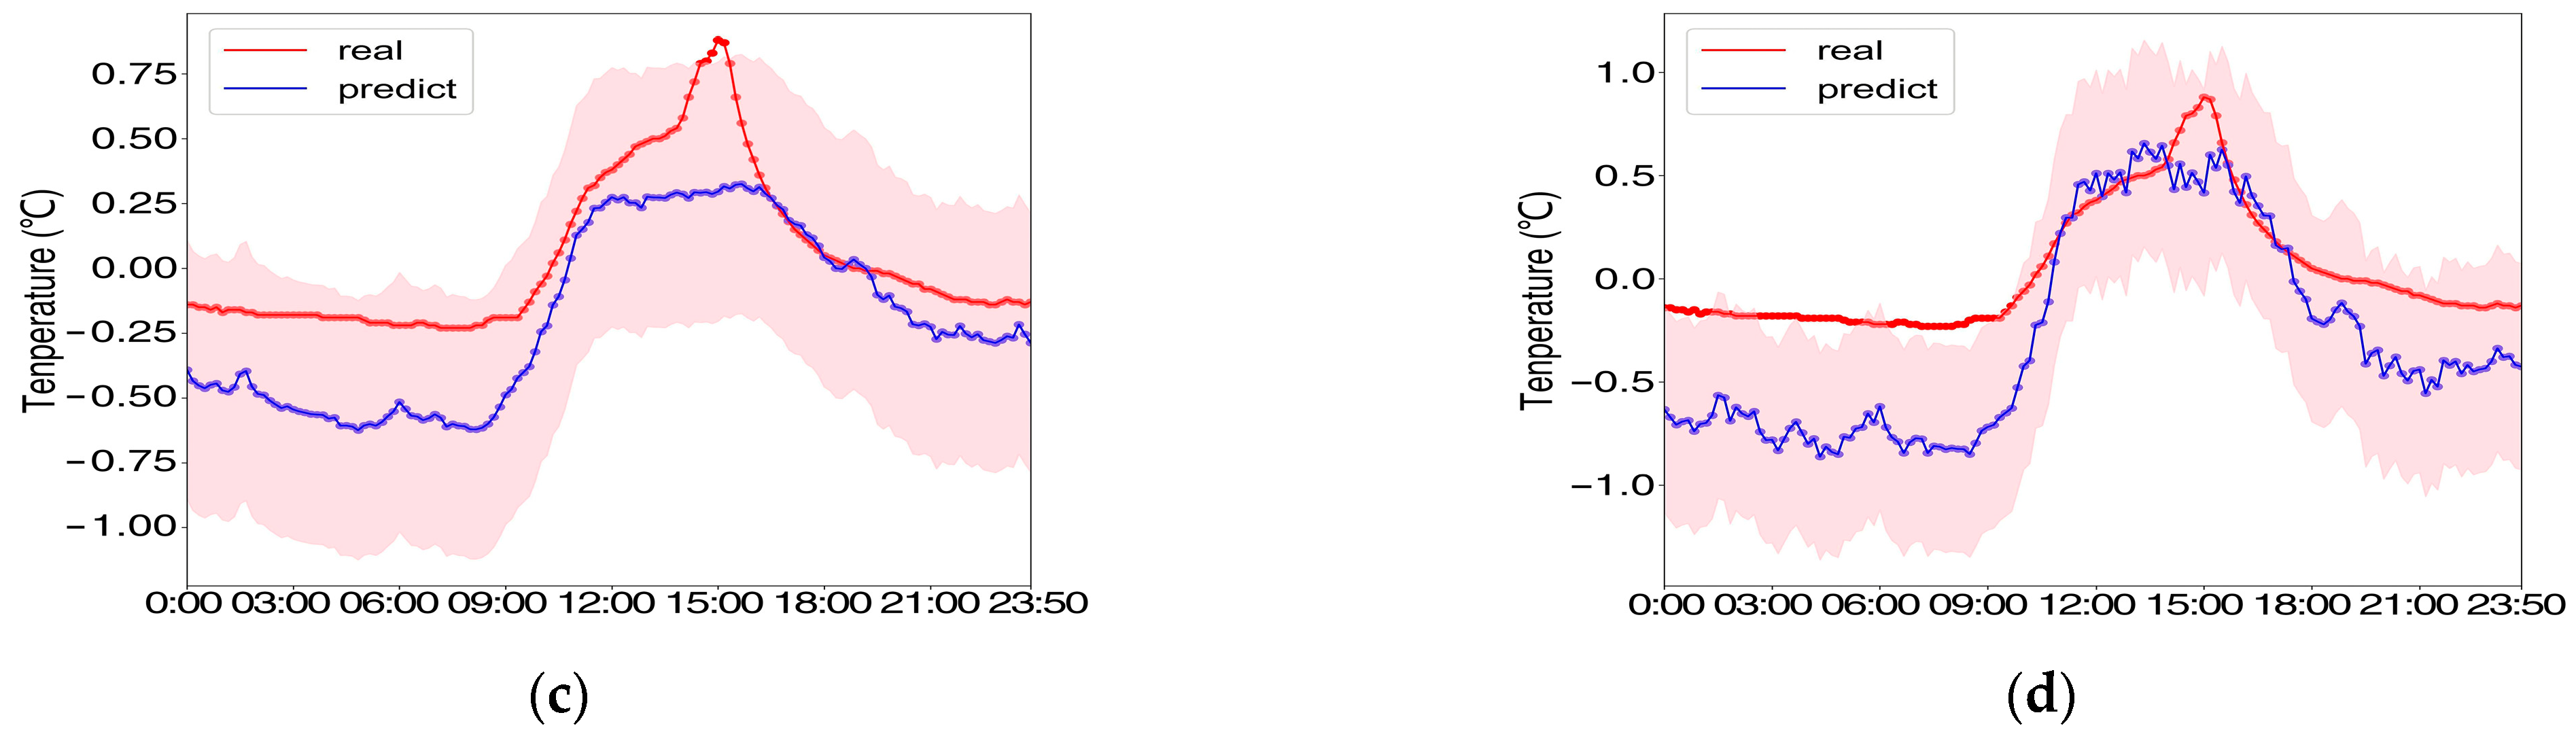
3.2.2. Effect Test of Diurnal Variation Prediction Model of Temperature in Greenhouse in Typical High and Low Temperature Weather

In order to clarify the prediction effect of the two models on the temperature in the Bailing mushroom greenhouse, in typical high and low temperature weather, the study selected the high temperature event on 24 July 2020 and the strong cold wave event on 31 December 2019 as the test objects. The network model and the stepwise regression model were tested separately, and the test results were shown in Figure 6.
It can be seen from Figure 6, that within the error range of 0.5 °C, the BP neural network model and the stepwise regression model have better simulation effects on high temperature weather. (1) The simulation effect of BP neural network model on high temperature weather was as follows: in the period of 05:00–06:30 and 10:20–13:00, the predicted value is lower than the measured value, and the predicted value was higher than the measured value in other periods. Between the value and the measured value, the error was within 0.3 °C. The simulation effect of low temperature weather was as follows: except that the predicted value from 16:00–18:00 is slightly higher than the measured value, the predicted value of the rest period is obviously lower than the measured value. The maximum error is 0.6 °C. (2) The simulation effect of the stepwise regression model on high temperature weather was as follows: except for 06:00–10:00 and 21:20–00:10 (the next day), the predicted value is higher than the measured value, and the predicted value of the rest period was lower than the measured values, the full-time error was within 0.3 °C. The simulation effect of low temperature weather was as follows: except for 11:00–13:30 and 16:00–17:00, the predicted value was slightly higher than the measured value, and the predicted value was significantly lower than the measured value in the rest period, at 00:00–09: 00 had a maximum error of 0.6 °C.
Comparing the prediction results of the two prediction methods on the specified date, it could be seen that (1) in low temperature weather, the BP neural network and the stepwise regression model had the same effect on the temperature prediction in the greenhouse, and the errors are all within 0.3 °C. (2) In high temperature weather, the BP neural network was better than the stepwise regression model in predicting the temperature in the greenhouse for the Bailing mushrooms.

4. Conclusions

1. The temperature inside the greenhouse for Bailing mushrooms was greatly affected by the meteorological factors outside the greenhouse. The actual simulation results showed that the proportion coefficient of these two factors in the model equation was relatively significant, indicating that although the temperature inside the greenhouse was mainly affected by the temperature outside the greenhouse, the humidity, wind speed and air pressure were introduced when building the prediction model inside the greenhouse and the model accuracy was obviously improved.
2. Comparing the results of two prediction models based on the BP neural network and stepwise regression method, the simulation accuracy of the BP neural network model was higher than that of traditional stepwise regression model. In terms of seasons, the simulation results of the two models are of the highest accuracy in summer, followed by autumn, with lower accuracy in spring and winter. The main reason was the high temperature in summer and autumn, when the Bailing mushroom greenhouse was always in an open and ventilated state. However, due to the low temperature in spring and winter, the greenhouse needed to be kept closed, and Bailing mushroom is an aerobic strain that needs frequent ventilation. Therefore, in the spring and winter, the Bailing mushrooms were greatly affected by the factors of manually opening and closing the greenhouse, and the accuracy of the model prediction results was reduced.
3. The simulation effect of the two models on the daily temperature variations for Bailing mushroom greenhouses under different seasonal conditions (accuracy: 10 min) was analyzed. In spring, summer, autumn and winter, the root mean square error of the BP neural network model was 1.25, 1.10, 1.08, 1.31 °C, and the average absolute error was 1.10, 1.05, 0.93, 1.20 °C. The root mean square errors of the stepwise regression model was 1.29, 1.19, 1.11, 1.37 °C, and the average absolute error was 1.17, 1.09, 0.96, 1.29 °C. The simulation results of the BP neural network model in different seasons were better than that of stepwise regression model.
4. The daily temperature variation effect of the two temperature prediction models in the greenhouse for Bailing mushrooms under typical high and low temperature weather was tested. The BP neural network and the stepwise regression prediction model showed good performance for greenhouse temperature prediction on specific dates. In high temperature weather, the prediction effect of BP neural network model was equivalent to that of stepwise regression model, and the error between the predicted value and the measured value was within 0.3 °C. In cold weather, it was shown that the BP neural network model was superior to the stepwise regression model.

Author Contributions

Conceptualization, methodology, software, R.L. and S.Y.; formal analysis, investigation, data curation, writing—original draft preparation, R.L.; writing—review and editing, visualization, R.L., S.Y. and L.H.; validation, supervision, project administration, funding acquisition, S.Y. and L.H. All authors have read and agreed to the published version of the manuscript.

Funding

This work was jointly supported by Natural Science Foundation of Sichuan Province (2021YJ0280) and the Arid Meteorology Fund (IAM202004).

Institutional Review Board Statement

Not applicable.

Data Availability Statement

Not applicable.

Acknowledgments

In this paper, we thank Jin Haidong of Meteorological Bureau of Tianjin Jizhou Distric for providing valuable data.

Conflicts of Interest

The authors declare that they have no known competing financial interests or personal relationships that could have appeared to influence the work reported in this paper.

References

  1. Xu, Y.J.; Fan, W.G.; Liu, B.R.; She, D.F. Research Advances in Cultivation of Pleurotus nebrodensis. J. Anhui Agric. Sci. 2007, 35, 1024–1025+1034. [Google Scholar]
  2. Xu, J.Q.; Jia, J.; Xu, C.; Fan, J.M.; Xie, C.J.; Cao, M.; Wei, Z.Z. Optimization of growth conditions of wild Pleurotus nerbrodensis mycelium by response surface methodology. Jiangsu Agric. Sci. 2020, 48, 137–142. [Google Scholar]
  3. Dong, X.X.; Huang, S.; Yu, L.M.; Liu, S.L. Microclimate Environment Test for Wide-span Plastic Greenhouse with External Thermal Insulation. Chin. J. Agrometeorol. 2020, 41, 413–422. [Google Scholar]
  4. Yao, T.M.; Li, M.; Li, S.M.; Tian, J.H.; Yu, L.F.; Xing, L. Effects of Temperature and pH Value on the Growth of Pleurotus nebrodensis Hypha. J. Anhui Agric. Sci. 2008, 36, 1414–1414,1446. [Google Scholar]
  5. Walker, J.N. Predicting Temperatures in Ventilated Greenhouses. Trans. ASAE 1965, 8, 445–448. [Google Scholar] [CrossRef]
  6. Wang, S.; Boulard, T. Predicting the Microclimate in a Naturally Ventilated Plastic House in a Mediterranean Climate. J. Agric. Eng. Res. 2000, 75, 27–38. [Google Scholar] [CrossRef] [Green Version]
  7. Mesmoudi, K.; Soudani, A.; Bournet, P.E. Determination of the inside air temperature of a greenhouse with tomato crop under hot and arid climates. J. Appl. Sci. Environ. Manag. 2010, 5, 117–129. [Google Scholar]
  8. Bai, Y.Q.; Zhou, D.S.; Cao, G.; Li, T.L. Research on Solar Greenhouse Architectural Design Theory and Method during Winter Time in Northern Cold Regions of China. Xinjiang Agric. Sci. 2014, 51, 990–998. Available online: http://www.xjnykx.com/CN/Y2014/V51/I6/990 (accessed on 25 June 2014).
  9. Kumar, K.S.; Jha, M.K.; Tiwari, K.N.; Sinjh, A. Modeling and evaluation of greenhouse for floriculture in subtropics. Energy Build. 2010, 42, 1075–1083. [Google Scholar] [CrossRef]
  10. Castaeda-Miranda, A.; Víctor, M.C. Smart frost control in greenhouses by neural networks models. Comput. Electron. Agric. 2017, 137, 102–114. [Google Scholar] [CrossRef]
  11. Yu, H.; Chen, Y.; Hassan, S.G.; Li, D.L. Prediction of the temperature in a Chinese solar greenhouse based on LSSVM optimized by improved PSO. Comput. Electron. Agric. 2016, 122, 94–102. [Google Scholar] [CrossRef]
  12. Liu, H.; Dang, X.D.; Du, Q.S.; Ma, R.N.; Bai, S.L. Temperature Prediction Model in Solar Greenhouse Based on Stochastic Forest Algorithm. Chin. Agric. Sci. Bull. 2020, 36, 95–100. [Google Scholar]
  13. Yan, S.J.; Peng, Y.J.; Guo, G. Monthly mean temperature prediction based on a multi-level mapping model of neural BP type. Trans. Atmos. Sci. 1995, 18, 344–348. (In Chinese) [Google Scholar]
  14. Jin, Z.F.; Fu, G.H.; Huang, H.J.; Pan, Z.Q.; Li, R.Z. Simulation and Forecast of Air Temperature inside the Greenhouse Planted Myica rubra Based on BP Neural Network. Chin. J. Agrometeor. 2011, 32, 362–367. [Google Scholar]
  15. Fan, L.S.; Zhu, L.J.; Chai, W.G.; Jin, Z.F. Temperature Variation Characteristic and Daily Minimum Temperature Forecast Inside Plastic Greenhouse in Winter in Hangzhou. Chin. J. Agrometeor. 2014, 35, 268–275. [Google Scholar]
  16. Liu, S.M.; Xue, Q.Y.; Li, Z.F.; Li, C.; Gong, Z.H.; Li, N. An air temperature predict model based on BP neural networks for solar greenhouse in North China. J. China Agric. Univ. 2015, 20, 176–184. [Google Scholar] [CrossRef]
  17. Lin, G.; Zheng, Z.W. Prediction of annual average temperature in Fuzhou based on grey-BP neural network combined model. J. Henan Univ. Eng. (Nat. Sci. Ed.) 2018, 30, 71–75. [Google Scholar]
  18. Shu, S.F.; Cai, M.; Liu, X.H.; Zhang, Y.H.; Cao, C.X.; Fan, J. Minimum Temperature Forecast and Freezing Injury Provention Techiques for Greenhouse V egetable. Meteor Sci. Technol. 2015, 43, 133–137. [Google Scholar]
  19. Zhang, Z.R.; Zhang, L.H.; Gao, P.; Li, K.; Zhang, P.; Wang, X.B.; Wu, S.M. Establishment of maximum and minimum temperature forecast models in sunlight greenhouse. Hubei Agric Sci. 2019, 58, 40–43. [Google Scholar] [CrossRef]
  20. Li, M.F.; Yang, W.G.; Ruan, S.M. The Relation Between Microclimatic Variation in Plastic Canopy with Planting Vegetable. Torrential Rain Disasters 2004, 23, 27–29. [Google Scholar]
  21. Liu, R.L.; Yuan, S.J.; Shi, H.X.; Long, X.Y.; Jin, H.D. Study on Changes of Microclimate in Greenhouse of Pleurotus nebrodensis in Jizhou, Tianjin. J. Geosci. Environ. Prot. 2022, 10, 66–79. [Google Scholar]
  22. Shi, F.; Wang, X.C.; Yu, L.; Li, Y. 30 Cases Analysis of MATLAB Neural Network; Beihang University Press: Beijing, China, 2010. [Google Scholar]
  23. Zhang, S.; Liao, S.B. Simulation and Analysis of Spatialization of Mean Annual Air Temperature Based on BP Neural Network. J. Geo-Inf. Sci. 2011, 13, 534–538. [Google Scholar] [CrossRef]
  24. Li, Q.; Zhao, F. Improved BP Neural Network of Heat Load Forecasting Based on Temperature and Date Type. J. Syst. Simul. 2018, 30, 1464–1472. [Google Scholar]
  25. Liu, X.Y. Agricultural Irrigation Forecasting Based on Grey Relational Analysis and BP Neural Network. J. Math. Pract. Theory 2020, 50, 287–291. [Google Scholar]
  26. Fu, G.H.; Zhang, B.; Yang, Z.Q.; Sun, J.B. Research on the Microclimate Characteristics and Inside Temperature Prediction Model for Plastic Greenhouse. China Agric. Sci. Bull. 2011, 27, 242–248. [Google Scholar]
  27. Yuan, J.; Wang, L.J.; Xu, J.P.; Qin, Z.L.; Zheng, X.S.; Cui, J.Y.; Li, S.J. Characteristics Analysis and Forecast of Microclimate in Greenhouse for Sweet Cherry. China Agric. Sci. Bull. 2015, 31, 173–179. [Google Scholar]
  28. Zeng, C.; Chen, C.M. Application of Stepwise Regression Analysis of Principal Components in Temperature Prediction. Acta Sci. Nat. Univ. Sunyatseni. 2006, 45, 107–110. [Google Scholar]
  29. Li, H.; Lian, J.J.; Wang, X.J. Stepwise regression model for daily runoff prediction based on wavelet decomposition. J. Hydraul. Eng. 2008, 39, 1334–1339. [Google Scholar]
  30. Chen, D.H.; Chen, C.M.; Zhou, X.M.; Sun, Q.B.; Wei, J. PC Stepwise Regression Forecasting Model of Climatic Field of Fujian Flood Period Rainfall. Meteorology 2013, 39, 1190–1196. [Google Scholar] [CrossRef]
Figure 1. Three-layer BP neural network structure.
Agriculture 12 02044 g001
Figure 2. Prediction model of temperature based on the BP neural network. (a) Spring. (b) Summer. (c) Autumn. (d) Winter.
Agriculture 12 02044 g002
Figure 3. Prediction model of temperature based on stepwise regression. (a) Spring. (b) Summer. (c) Autumn. (d) Winter.
Agriculture 12 02044 g003
Figure 4. Diurnal variation of temperature inside and outside the greenhouse for Bailing mushrooms in different seasons.
Agriculture 12 02044 g004
Figure 5. The daily variation trend of the measured and predicted temperature in the greenhouse for Bailing mushroom. (a) spring (b) summer (c) autumn (d) winter.
Agriculture 12 02044 g005
Figure 6. High and low temperature weather forecast effect. High temperature: (a) BP neural network, (b) stepwise regression. Low temperature: (c) BP neural network, (d) stepwise regression (the red area in the figure: prediction temperature ± 0.5 °C by the model).
Agriculture 12 02044 g006aAgriculture 12 02044 g006b
Table 1. The correlation coefficient between the inside temperature and the outside meteorological factors.
Outside
Temperature10 min Wind SpeedRelative HumidityAir Pressure
Inside temperture0.96 **0.16 *−0.13 *−0.83 **
Note: ** means passing the 0.01 significance test, * means passing the 0.05 significance test.
Table 2. The correlation coefficient between the inside temperature and the outside meteorological factors in different seasons.
Inside TempertureOutside
Temperature10 min Wind SpeedRelative HumidityAir Pressure
Spring0.85 **0.28 *−0.37 *−0.57 **
Summer0.93 **0.36 *−0.62 *−0.24 **
Autumn0.96 **0.10 *−0.13 *−0.76 **
Winter0.78 **0.31 *−0.57 *−0.17 **
Note: ** means passing the 0.01 significance test, * means passing the 0.05 significance test.
Table 3. The prediction model of temperature based on stepwise regression method.
SeasonEquationrr2
Springy = 0.625x1 − 0.461x3 + 0.011x4 + 0.080.8631 **0.75
Summery = 0.844x1 + 0.166x2 + 0.318x3 + 0.990.9309 **0.87
Autumny = 0.814x1 + 0.292x3 + 0.001x4 − 0.170.9673 **0.94
Wintery = 0.713x1 + 0.283x2 − 0.206x3 + 6.790.7912 *0.63
Note: * means passing the 0.05 significance test, ** means passing the 0.01 significance test; x1: air temperature outside the greenhouse (°C), x2: wind speed outside the greenhouse (m/s), x3: relative humidity outside the greenhouse (%), x4: air pressure outside the greenhouse (hPa), y: air temperature inside the greenhouse (°C).
Table 4. Diurnal variation prediction model of temperature based on stepwise regression method.
SeasonEquationrr2
Springy = 0.641x1 − 0.342x3 + 0.007x4 + 0.240.8631 **0.75
Summery = 0.033x1 + 0.958x2 − 0.904x3 − 0.640.9309 **0.87
Autumny = 0.589x1 − 0.137x3 + 0.006x4 − 0.250.9673 **0.94
Wintery = 0.707x1 − 0.343x2 − 0.647x3 − 0.450.7912 *0.63
Note: * means passing the 0.05 significance test, ** means passing the 0.01 significance test; x1: air temperature outside the greenhouse (°C), x2: wind speed outside the greenhouse (m/s), x3: relative humidity outside the greenhouse (%), x4: air pressure outside the greenhouse (hPa), y: air temperature inside the greenhouse (°C).
Publisher’s Note: MDPI stays neutral with regard to jurisdictional claims in published maps and institutional affiliations.

