Article

Tyre Configuration and Axle Load of Front-Wheel Assist and Four-Wheel Drive Tractors Effects on Soil Compaction and Rolling Resistance under No-Tillage

by
David Rivero
1,
Guido F. Botta
2,*,
Diogenes L. Antille
3,
Alejandra Ezquerra-Canalejo
4,
Fernando Bienvenido
5 and
Mustafa Ucgul
6
1
Facultad de Agronomia, Universidad Nacional de La Pampa, Santa Rosa 6300, Argentina
2
Departamento de Tecnologia, Universidad Nacional de Lujan, Lujan 6700, Argentina
3
CSIRO Agriculture and Food, Black Mountain Science and Innovation Precinct, Canberra 2601, Australia
4
Escuela Tecnica Superior de Ingenieria de Montes, Forestal y del Medio Natural, Universidad Politecnica de Madrid, 28040 Madrid, Spain
5
Centro de Investigacion Mediterraneo de Economia y Desarrollo Sostenible (CIMEDES), Universidad de Almeria, 04120 Almeria, Spain
6
Faculty of Science and Engineering, Southern Cross University, Lismore 2480, Australia
*
Author to whom correspondence should be addressed.
Agriculture 2022, 12(11), 1961; https://doi.org/10.3390/agriculture12111961
Submission received: 25 September 2022 / Revised: 16 November 2022 / Accepted: 17 November 2022 / Published: 20 November 2022
(This article belongs to the Special Issue Design and Application of Agricultural Equipment in Tillage System)

Abstract

:
Selecting the appropriate tyre configuration and settings for heavy farm vehicles is important to ensure that soil compaction and power loss in rolling resistance are minimised and traction is optimised. This study investigated the effect of front-wheel assist (FWA, ≈75 kN) and four-wheel drive (4 WD, ≈100 kN) tractors fitted with different tyre configurations (single, dual), tyre sizes and inflation pressures on soil strength (a proxy for soil compaction), and rolling resistance. Single-pass tests were performed on a Typic Argiudoll (≈23% clay, bulk density: 1305 kg m−3) managed under permanent no-tillage. Results showed that average power losses in rolling resistance were 7.5 kN and 5 kN for the 4 WD and FWA tractors, respectively. The average rut depth increased by approximately 1.4 times after a pass of the 4 WD compared with the FWA tractor. The soil cone index (0–600 mm depth) increased from 2023 kPa (before traffic) to 2188 and 2435 kPa after single passes of the FWA and 4WD tractors, respectively (p < 0.05). At the centreline of the tyre rut, dual tyres reduced the soil cone index a little compared with single tyres, but they significantly increased the volume of soil over which soil strength, and therefore soil compaction, was increased. For both tractors (regardless of tyre configuration or settings), soil strength increased to the full measured depth (600 mm), but relative changes before vs. after traffic became progressively smaller with increased soil depth. The power loss in rolling resistance was consistently greater with the heavier tractor, and rut depth was directly related to tyre inflation pressure.

1. Introduction

The drawbar performance of tractors depends primarily on the engine power and transmission system, the weight distribution on drive wheels, and the ground conditions over which the tractor is driven [1]. This performance is also affected by the tyre configuration (whether single or multiple tyres), tyre settings (size and inflation pressure) and tyre construction (radial, bias-ply, high-flexion), and factors related to soil–tyre interactions [2,3]. Mechanical power is obtained from internal combustion engines, but at less than 100% efficiency [4]. Power losses consist of gear and bearing friction (which represent the power loss in ground drive transmission) and drive wheel slip and rolling resistance (which represent the power loss in the ground drive) [5]. Rolling resistance includes the force required to deform the soil and deflect the tyres and the wheel bearing friction [6,7]. The coefficient of rolling resistance ( C r r ) is defined as the ratio of the force required to roll a wheel over an untracked surface to the load supported by the wheel [8,9,10]. Numerically, C r r may be estimated by computing the cone index of the soil, tyre parameters that relate to its (unloaded) dimensions, and dynamic wheel loading, as shown in Equation (1) (after Hunt [11]; Crossley et al. [12]):
C r r = 1.2 C n + 0.04
and
C n = C I × b × d W
where: Cn is a decimal dimensionless ratio, CI is soil cone index expressed in N m−2 [13], b is the unloaded tyre section width (m), d is the overall diameter of the unloaded tyre (m), and W is the dynamic wheel load (force units normal to the soil surface, N).
Therefore, wide variations in gross tractive efficiency may occur as operating conditions vary; for example, changes in soil strength (soil cone index) influence the load-carrying capacity of the soil. For pneumatic tyres operated at inflation pressures that allow for tyre deflections up to about 20%, typical values of Cn can vary between 15 for soft and light-textured soils to 50 for hard soils [10]. The overall tractive performance is also influenced by the efficiency of the ground drive, which is primarily determined by tyre performance [14]. Agricultural tyres are deformable and so are soils used for cropping, including soils that have been under long-term (e.g., >10 years) no-tillage [15,16,17,18]. The vertical force exerted by a loaded tyre is met by the reaction of the ground [19]. This loaded tyre will compact the soil until both opposing forces balance out. More significant soil deformation (sinkage) will increase rolling resistance and therefore the amount of energy wasted in compacting the soil, which could, otherwise, be used for developing traction [20,21,22]. The net result is a concurrent reduction in fuel-use efficiency [23]. When traffic is performed on soft soil conditions, increased tyre inflation pressure above the manufacturer’s designated pressure for load, speed, and slope will tend to increase sinkage into the ground (rut depth) and rolling resistance [24,25], and a rule of thumb suggests that 10 mm of additional depth can increase fuel consumption by approximately 10% [26]. Similarly, overinflation of the tyre increases the slip rate due to the reduced soil–tyre contact area [27,28], which at 30% can increase fuel consumption by 20% or greater and cause significant compaction [23,26]. Options for improving traction and minimising rolling resistance and soil compaction include an increase in the tyre–soil contact area, which can be achieved by fitting larger tyres (preferably, of larger diameter) [29], reducing wheel load and tyre inflation pressure, fitting low/ultra-low ground pressure tyres such as IF (increased flexion) and VF (very-high flexion) marked tyres, or converting the system to controlled traffic farming [1,30,31,32,33,34,35]. The length of the contact area is a function of the tyre diameter; hence, an increase in tyre diameter will result in improved slip performance.
In Argentina, approximately 23 million hectares of arable land are managed under permanent (>20 years) no-tillage [36]. Over the past 20 years, there has been a trend towards the adoption of articulated four-wheel drive (4WD) and front-wheel assist tractors (FWA) motivated by the need to improve field efficiency and timeliness of farm operations [37]. A drawback of this trend has been an increased risk of soil damage due to compaction, which has been attributed to the combined effects of high traffic footprint (e.g., 40–60% of field-cropped area each time a crop is produced) and improper tyre selection or tyre settings for the type of farm vehicle, field operation, and soil condition [37,38,39]. Brand new tractors in Argentina are released from the factory or imported into the country untyred, and so tractors are offered by local dealers without tyres. Newly acquired tractors are fitted with tyres selected by customers upon sealing the deal on the equipment purchase or resolved after-market privately. The tyres selected for brand-new tractors are often not fit for purpose, with tyre dimensions considered to be suboptimal for the intended equipment and equipment use. Surveys conducted by Botta [40] and Botta et al. [37] showed that mismatches between the overall mass and power of the equipment and the tyres’ configuration, dimensions, or settings were common in FWA and 4WD tractors. While buyers may choose to fit the correct set of tyres for a given equipment, their preferred option is often slightly smaller tyres as this reduces the upfront cost of the equipment. A hidden problem associated with this preference is the potential impact that underdimensioned tyres can have on energy-use efficiency (due to increased rolling resistance and wheel slip), soil compaction (due to increased tyre inflation pressure), and premature tyre wear.
Whilst the principles governing the complex soil–tyre–vehicle interactions are well-understood and well-documented (e.g., [41,42,43,44]), these relationships have not been quantified for local conditions in Argentina. Such data are needed to assist farmers and machinery operators make informed decisions about tyre selection for specific applications. The work reported in this article was conducted to address this data gap by undertaking a series of field-based experiments aimed at quantifying the impact of tractor–tyre combinations on rolling resistance and soil strength used, respectively, as indicators of energy-use efficiency and soil compaction. The specific objectives of this study were to determine the effect of front-wheel assist (FWA) and four-wheel drive (4WD) tractors on (1) rolling resistance and (2) soil compaction. For this, the two tractors were fitted with either single or dual tyres. They included the original set of tyres (those selected by the customer upon acquisition of the equipment or supplied by the dealer) and the correct set of tyres for the equipment. The FWA and 4WD tractors chosen for this study are both popular models in Argentina, and the soil type (Typic Argiudoll) at the experimental site had been under no-tillage for 22 years, which was, therefore, representative of the local farming conditions in the country. It was hypothesised that (1) given the axle load of the tractors used in the study, subsoil compaction would occur independently of the tyres fitted to the equipment, and (2) increased rolling resistance would be observed with the wider and dual tyre configurations, consistent with well-established theory and despite the soil being fairly consolidated (mean ρb ≈ 1305 kg m−3, 0–600 mm) after such a long-term no-tillage management and high (≈45%) traffic footprint [39]. It was also postulated that the expected increase in rolling resistance when inappropriate tyres were used would be due to the bulldozer effect at the soil–tyre interface (soil pushed in front of the tyre) and less so to tyre sinkage into the ground. It was envisaged that this work would go some way to alert advisers and farm machinery operators in Argentina about hidden costs associated with improper tyre selection that may result in reduced energy-use efficiency and increased soil damage due to compaction.

2. Materials and Methods

2.1. Experimental Site

Field tests were conducted on a Typic Argiudoll from a farm located near Lujan (Buenos Aires, Argentina) 34°32′ S, 59°07′ W [45]. The soil at the site had been continuously managed under no-tillage winter cereal and soybean cropping for 22 years. A summary of measured soil physical and mechanical properties is provided in Table 1. The soil water contents derived from the Proctor test were used as a reference for comparison with field measurements of soil water content to denote the soil’s susceptibility to compaction when the tractors were driven over.

2.2. Description of Farm Equipment and Experimental Treatments

The front-wheel assist JD7515 (henceforth FWA) and four-wheel drive Zanello-500 (henceforth 4WD) tractors used in these experiments are described in Table 2a,b. Both tractors are popular models in Argentina. The engine power of the tractors was 92 CV (68 kW) and 194 CV (143 kW) for the FWA and 4WD, respectively. The tyres fitted to the FWA tractor ensured the spoke ratios remained close to constant at approximately 1.25. In all tractor–tyre combinations, the tyre inflation pressures were adjusted to match the manufacturer’s specifications for load and speed. Treatments marked with the symbol (†) indicate that the tractor was fitted with tyres supplied by the local dealer (or selected by the customer when the equipment was first acquired). As discussed earlier, while these particular tyres can be used with the two tractors available for the study, they were considered to be suboptimal and likely to underperform compared with the correct tyres based on the guidelines given by The European Tyre and Rim Technical Organization (https://www.etrto.org/, accessed on 30 October 2022). For the FWA tractor, the front and rear tyres had different dimensions for all three sets of tyres used in the tests. For the 4WD tractor, the front and rear tyres were identical and only differed between tests. The tractors were ballasted to perform field operations that typically demand for high pull (e.g., subsoiling, chisel ploughing, heavy-disc harrowing), and ballasting remained unchanged during the tests. Before the field tests were conducted, the two tractors were weighed using a weighbridge. The overall weight of the tractor–tyre combination was first recorded, followed by the individual weights of the front and rear axles. Experimental plots were laid out in a completely randomised block design with three replications (n = 3) based on the approach used by Botta et al. [37]. The dimensions of each plot were 60 m wide by 100 m long, and the plots were separated by a 15 m buffer zone for turning and manoeuvring that ensured edge effects due to field traffic were avoided. Each plot was subdivided into 10 m to be able to perform rolling resistance measurements.

2.3. Experimental Variables Measured

Replicated measurements (n = 30) of soil cone index (CI) [13], gravimetric soil water content [53], rolling resistance [54], and rut depth were performed as described here. The number of replications ensured that any spatial variability along the traffic path could be captured [55].
Soil cone index and soil water content: CI was determined with an SC-900 FieldScout™ digital cone penetrometer (Spectrum Technologies Inc., Aurora, IL, USA, https://www.specmeters.com/, accessed 7 May 2022). Measurements were taken at the centreline of the tyre rut to a depth of 600 mm at regular increments of 25 mm, and the data were digitally recorded. Samples for gravimetric determination of soil water content were collected from locations near those used for measurements of CI. Penetration resistance values were adjusted by covariance analysis using gravimetric soil water content measurements simultaneously determined [56]. For the 4WD tractor, CI was measured immediately after the pass of the front tyres and subsequently after the pass of the rear tyres, allowing the effect of an individual set of tyres to be quantified. Mean tyre–ground contact pressures were measured with a Tekscan® pressure sensor (https://www.tekscan.com/, accessed 7 May 2022). For all tests, the soil water content at the time traffic was near both the soil’s DUL100 (laboratory determination of drained upper limit at 100 cm suction) and the Proctor water contents (Table 1), and the susceptibility of the soil to compaction was considered to be high.
Rolling resistance: measurements were performed through single-pass tests, with the front and rear tyres of the pulled tractor running over the same path [54]. The FWA and 4WD tractors were towed at a speed of 5 km h−1, offset from the towing vehicle, and the motion resistance force was recorded [37]. Subsequently, these data were corrected to account for the travelling angle between the two tractors [54]. Measurements were conducted using an electronic dynamometer (strain gauge type). For this, a cab-mounted unit collected the motion resistance force data with a sampling frequency of 200 Hz. These data were stored in a datalogger and downloaded as Excel files for subsequent analysis and reporting.
Rut depth: measurements were conducted using a profile meter that had 500 mm long, 5 mm diameter sliding rods spaced 25 mm apart on a 1 m aluminium H-frame. The profile meter was placed over the tyre rut perpendicular to the direction of travel, and the rods were allowed to drop until they made contact with the ground to replicate the shape of the rut [57]. The rods were then locked and the frame was lifted off the ground, placed on a gridded paper, and photographed. The maximum rut depth was then read off the image [58]. Relationships between tyre inflation pressure and rut depth were derived for each tractor by pulling together the data from all tests.

2.4. Statistical Analyses

The statistical package Statgraf 7.1 [59] was used to analyse the soil cone index, soil water content, rolling resistance, and rut depth data and involved ANOVA. The post hoc Duncan’s multiple range test was used to determine differences between pairs of means.

3. Results and Discussion

3.1. Soil Cone Index and Soil Water Content

Measurements of soil water content showed no significant differences between treatments or depth intervals (p > 0.05) and reported an overall mean value (± SD) for the full measured depth of 19.53 ± 1.63 % (w/w). The soil water content at the DUL100, averaged across all depth intervals, was 27.65 ± 1.10 % (w/w). The mean soil water content derived from the Proctor test (23.75 ± 1.29%, w/w) suggested that this soil condition provided moderately high susceptibility to deformation and compaction [58,60,61]. While penetration resistance values were adjusted by covariance analysis, the lack of statistical differences in soil water content at the time field tests were performed provided confidence that CI, rolling resistance, and rut depth measurements reflected treatment as opposed to site effects (the latter being associated, for example, with variability in soil strength both spatially and at depth).
Soil CI data are summarised in Table 3a,b. Overall, there were significant differences in CI (0–600 mm) before (1991 ± 385 kPa) and after (2304 ± 376 kPa) the tests were performed (p < 0.05). Except for FWA_D and FWA_S, treatment effects on CI were significant to the full measured depth of 600 mm (p < 0.05). At the 450–600 mm depth interval, the FWA_D and FWA_S tractor–tyre combinations did not induce significant changes in CI, and therefore, values remained close to those recorded prior to traffic (p > 0.05). Table 3a also shows that values of CI were highest with the heavier tractor–tyre system combinations; however, subsoil compaction (depth range: 150 to 450 mm) was evident across all treatments and despite axle loads being lower than the limits suggested in earlier studies [35,62]. This observation confirmed the first hypothesis formulated prior to this study that subsoil compaction would occur with both tractors regardless of the tyres fitted to the equipment. However, these effects may be mitigated or avoided if advanced tyre technology, such as VF/IF marked tyres, were to be used as shown by other studies with much heavier (34 Mg) harvesting equipment [63]. Table 3b shows the individual effect of the front tyres and the additive effect of the rear tyres on soil CI after a single pass of the 4WD tractor. Soil CI (0–600 mm) values recorded after the pass of the front tyres represented between 69% and 74% of the CI measured after the pass of the whole vehicle (front and rear tyres), which suggested that the rear tyre caused additional compaction to that initially induced by the leading front tyre. However, the compactive effect of the front tyre appeared to be greater than the follower rear tyre, consistent with the knowledge that up to 80–90% of the maximum compaction may occur when the soil is first trafficked, provided soil conditions were conducive to such effects [64].
Consolidation of the soil under long-term no-tillage did not prevent compaction from occurring under the prevailing experiment conditions; thus, suggesting controlled traffic farming (CTF) may be an effective alternative to the widespread ‘random’ and high-footprint (40–60%) traffic systems that are common in Argentina [39,65]. By confining traffic compaction to the least possible area of permanent traffic lanes (such as in fully matched CTF systems), significant improvements in year-round trafficability may be realised with associated benefits in terms of reduced rolling resistance and overall improvements in energy-use efficiency [38,66].

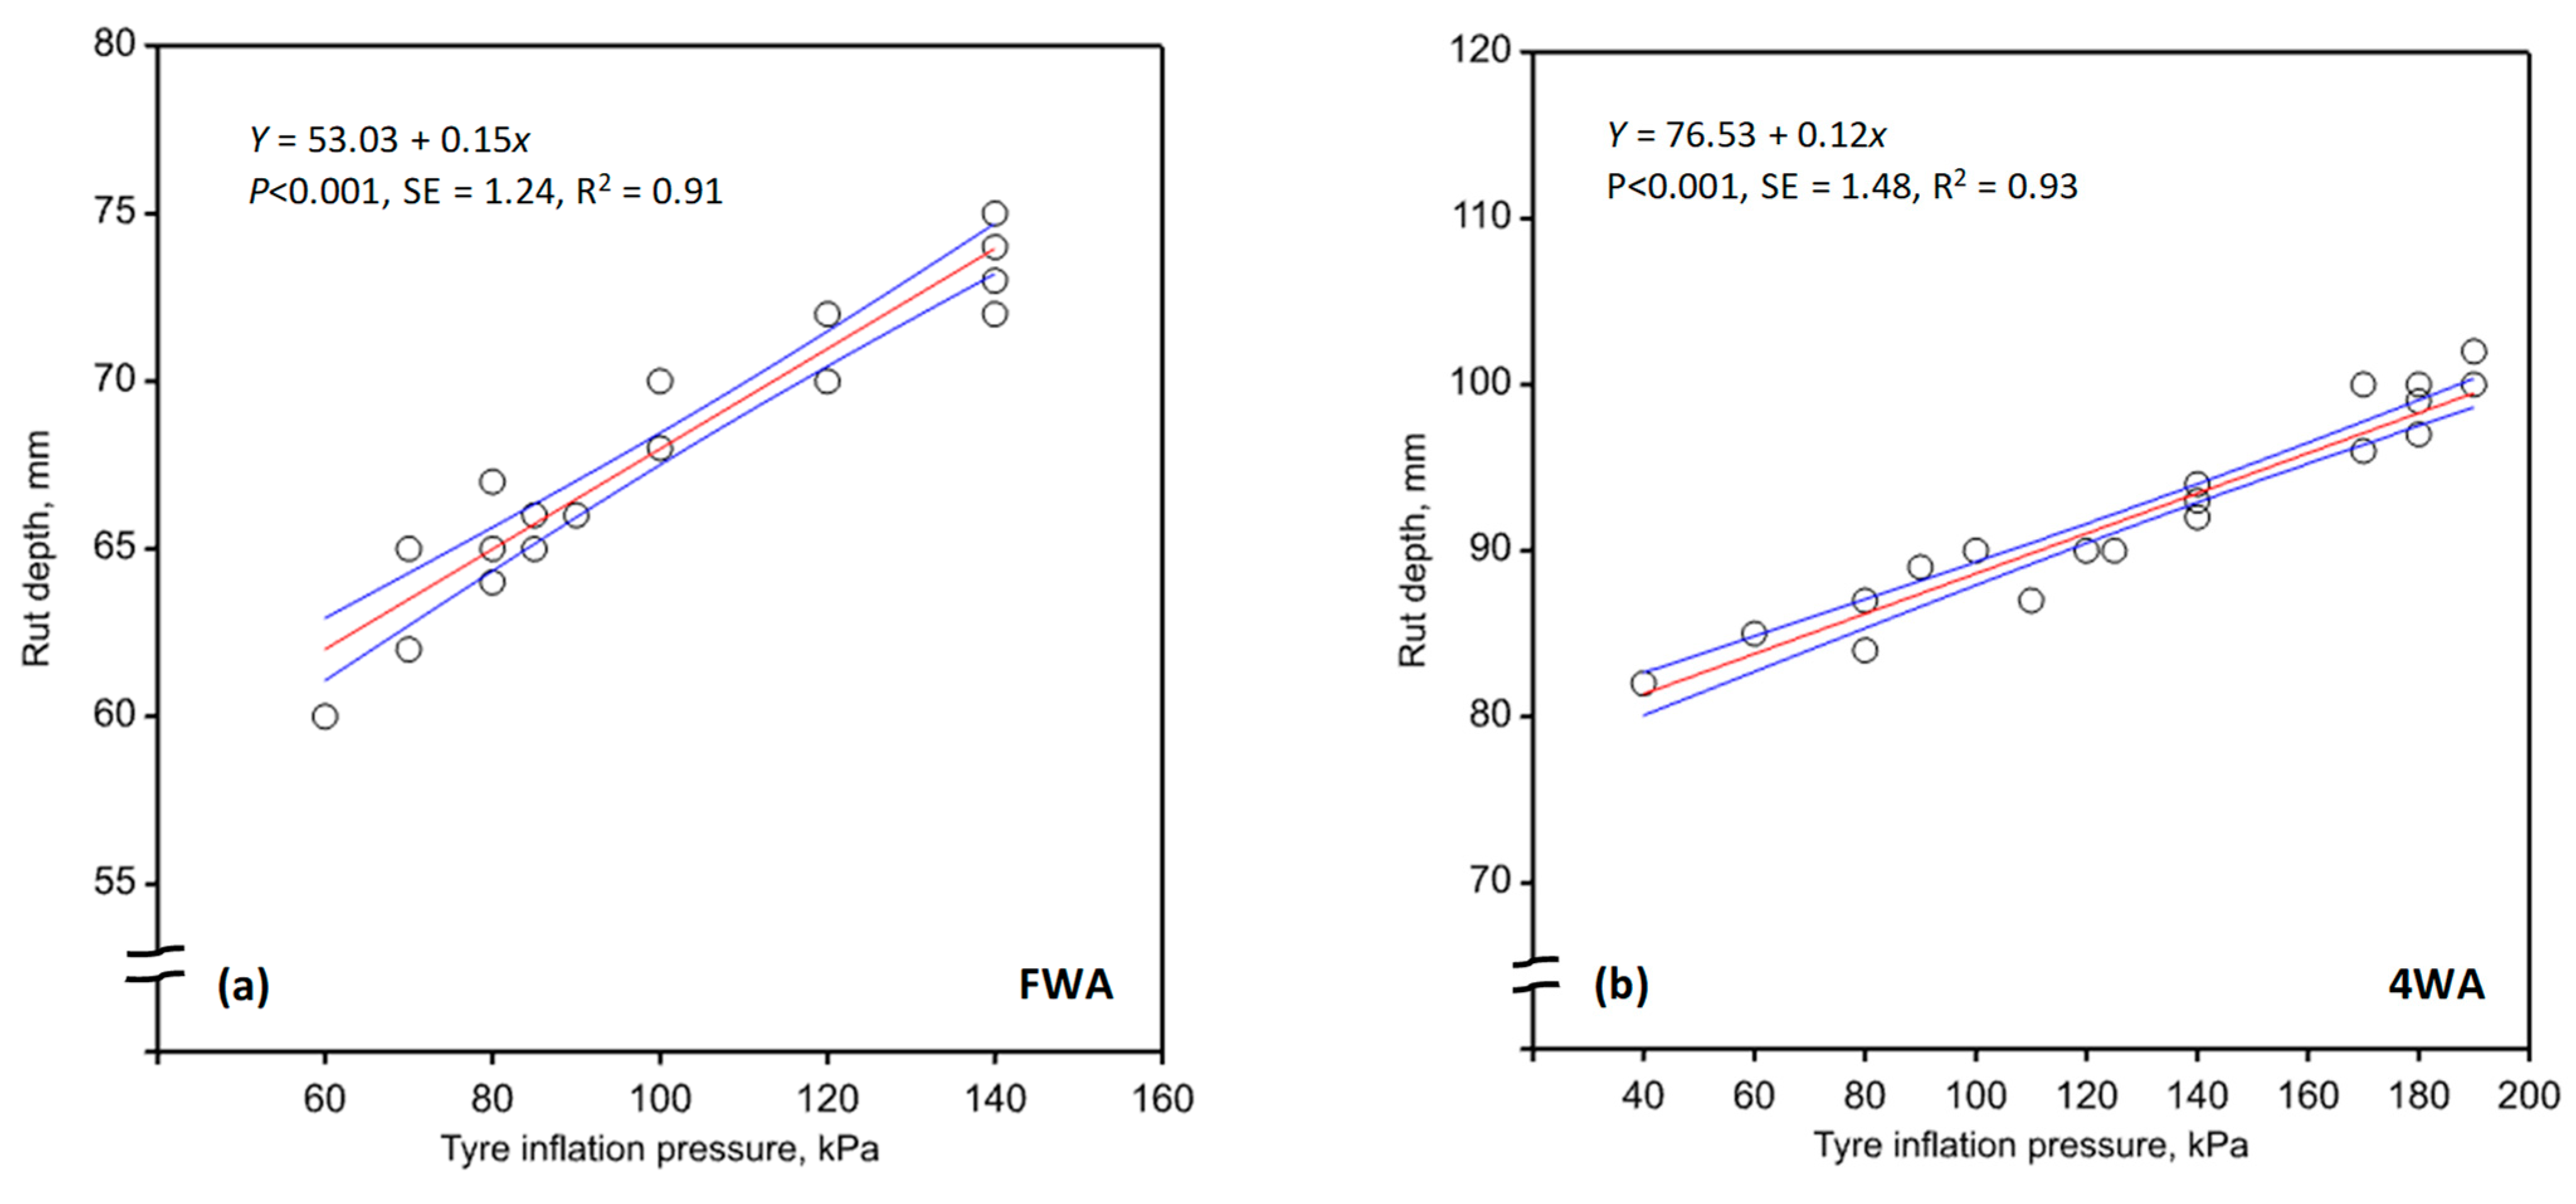
3.2. Rolling Resistance and Rut Depth

Rolling resistance and rut depth data are presented in Table 4 and Figure 1a,b, respectively. A strong relationship between tyre inflation pressure and rut depth was observed with both tractors (p-values < 0.001), consistent with earlier studies (e.g., [17,18,67,68]). Rut depths were the shallowest in the FWA_S and 4WD_S tractor–tyre combinations, respectively (Table 4).
There were significant differences in rolling resistance depending upon the tractor–tyre combinations, but overall values were higher with the 4WD tractor, which was about 25% heavier than the FWA tractor. Differences in rolling resistance between tractors were also explained by differences in rut depth, which were deeper for all 4WD–tyre combinations. For both tractors, rolling resistance was significantly lower with single compared with dual tyres. The single configuration system equipped with the tyres supplied by the dealer (marked †) reported higher rolling resistance than the same configuration equipped with the correct set of tyres (p-values < 0.05). The ‘bulldozer’ effect expected when using suboptimal tyres/tyre settings was less clear than the relationship between tyre inflation pressure and rut depth and the associated effect on rolling resistance. Hence, the second hypothesis formulated prior to this study could not be confirmed. Tyre inflation pressure was, therefore, a key factor influencing rolling resistance and power loss in ground drive [69].
Power loss estimates and rut depth measurements were consistent with rolling resistance data, with more significant penalties observed when the dual tyre configuration and the single tyres supplied by the dealer were used (p-values < 0.05). The single configuration system fitted with the 23.1 R30 tyre to the rear axle offered the least desirable combination of wheel load, tyre inflation pressure, and section width, as the mean ground contact pressures were the highest (Table 2b). Ground contact pressures higher than about 50 kPa were reported to be the threshold above which crop yield penalties may occur due to compaction [70]. The 24.5 R32 tyre in the single configuration system reported acceptable results considering that mean ground contact pressures beneath this tyre remained below or close to 50 kPa (Raper [70]’s suggested threshold value) and wheel loadings were the highest. The relatively low mean ground contact pressures recorded for the 18.4 R38 tyre were mainly due to the dual configuration, which allowed for increased contact area, and not to the inflation pressures used in this tyre. As highlighted earlier, CI (0–600 mm) measurements were also lower with this tyre, but the compaction footprint underground would be much wider than the soil–tyre contact area of the dual tyre system because of the distribution of compressive stresses beneath the tyres [63,71]. Other studies (e.g., [20,67,72]) have also shown that using wider tyres may reduce ground contact pressures and therefore sinkage and compaction but can potentially have adverse effects on traction and rolling resistance. A reduction in the tyre inflation pressure will not only increase the soil–tyre contact area but also the deformability of the tyre relative to the ground [5]. Consequently, the depth of sinkage along the length of the contact patch becomes more uniform and the rut depth shallower, both of which reduce rolling resistance. Since rolling resistance diminishes the thrust produced at the driving wheels, care should be exercised to minimize it so that production of drawbar pull is not significantly affected [29].

4. Conclusions

The work reported in this article investigated the effects of tyre configuration (namely, single and dual tyres, tyre dimensions, and inflation pressure) on rolling resistance and soil strength (which was used as a proxy for assessment of soil compaction). A series of single-pass tests with front-wheel assist (FWA, JD7515, ≈75 kN) and four-wheel drive (4WD, Zanello-500, ≈100 kN) tractors were conducted to compare tractor × tyre performance. The main conclusions derived from this work are summarised below:
(1)
Average rolling resistance values across all tyre combinations were 5 kN for the FWA and 7.5 kN for the 4WD tractors, with average power losses of 6.9 and 10.4 kW, respectively. These observations were consistent with rut depth measurements, which increased 1.4 times on average after a single pass of the 4WD compared with the FWA tractor. Rolling resistance increased significantly with dual compared with single tyres, and while soil cone index at the centreline of the rut was lower after the dual tyre tests, the final volume of soil over which soil strength (and therefore soil compaction) increased was significantly greater than that of the single tyre configuration.
(2)
Linear relationships between rut depth and tyre inflation pressure were established, which confirmed that greater soil deformation (sinkage) induced by wheeling is evidence of increased rolling resistance and soil compaction. If the same contact area was to be achieved with different tyres or tyre configurations, the depth of sinkage would be similar, but the resultant width of the rut would be increased with wider section tyres. This would result in increased rolling resistance. The rut depth–tyre inflation pressure-rolling resistance relationships documented in this study reinforced the knowledge that if the tyres could be operated at the lowest permissible inflation pressure, not only would the contact area be increased, but also (and importantly) their deformability relative to the soil. The net result would be shallower sinkage, reduced rolling resistance, and improved slip performance.
(3)
Soil cone index data (depth range: 150 to 450 mm) provided evidence that subsoil compaction occurred across all treatments and despite axle loads being lower than thresholds suggested in earlier studies. This was observed with both the FWA and 4WD tractors regardless of the tyres fitted to the equipment. These adverse effects may be mitigated, or possibly avoided, if advanced tyre technology (e.g., VF/IF marked tyres) were to be used, which should be considered in future studies. There is also a need to assess the cost-effectiveness of low-ground pressure tyre technology for heavy farm equipment relative to the adoption of controlled traffic farming (CTF). This research is required for improving the overall performance (timeliness, trafficability, energy-use efficiency) of mechanisation systems in Argentina and reducing impacts on soil associated with traffic compaction.

Author Contributions

Conceptualisation, D.R., G.F.B., D.L.A. and M.U.; methodology, investigation, and data validation, D.R., A.E.-C. and G.F.B.; electronic calibration devices and formal analysis; D.R., A.E.-C. and F.B.; writing—original draft preparation, D.L.A., D.R., M.U. and G.F.B.; writing—review and editing. All authors have read and agreed to the published version of the manuscript.

Funding

The work reported in this article was supported by grants (I-153/19 FA Research Group) provided by Universidad Nacional de La Pampa, Argentina (https://www.agro.unlpam.edu.ar, accessed on 28 January 2022).

Institutional Review Board Statement

Not applicable.

Data Availability Statement

The data reported in this article are available from Guido F. Botta (gfbotta@agro.uba.ar).

Acknowledgments

Operational support provided by the owners of the farm where this study was conducted is gratefully acknowledged. The authors are also grateful to CSIRO Agriculture and Food (Canberra, Australia).

Conflicts of Interest

The authors declare no conflict of interest. The funders had no role in the design of the study; in the collection, analyses, or interpretation of data; in the writing of the manuscript; or in the decision to publish the results.

References

  1. Goering, C.E.; Stone, M.L.; Smith, D.W.; Turnquist, P.K. Off-Road Vehicle Engineering Principles; ASAE Publication No.: 801M0103; American Society of Agricultural Engineers: St. Joseph, MI, USA, 2006; ISBN 1-892769-26-3. [Google Scholar]
  2. Soane, B.D.; Dickson, J.W.; Campbell, D.J. Compaction by agricultural vehicles: A review. III. Incidence and control of compaction in crop production. Soil Tillage Res. 1982, 2, 3–36. [Google Scholar] [CrossRef]
  3. Misiewicz, P.A.; Blackburn, K.; Richards, T.E.; Brighton, J.L.; Godwin, R.J. The evaluation and calibration of pressure mapping system for the measurement of the pressure distribution of agricultural tyres. Biosyst. Eng. 2015, 130, 81–90. [Google Scholar] [CrossRef]
  4. Srivastava, A.K.; Goering, C.E.; Rohrbach, R.P.; Buckmaster, D.R. Engineering Principles of Agricultural Machines, 2nd ed.; ASAE Pub. No.: 801M0206; American Society of Agricultural and Biological Engineers: St. Joseph, MI, USA, 2006; ISBN 1-892769-50-6. [Google Scholar]
  5. Inns, F.M.; Kilgour, J. Agricultural Tyres; Dunlop Ltd.: London, UK, 1978. [Google Scholar]
  6. Perdok, U.D.; Tijink, F.G.J. Developments in IMAG research on mechanization in soil tillage and field traffic. Soil Tillage Res. 1990, 16, 121–141. [Google Scholar] [CrossRef]
  7. Abeels, P.F.J. Tire deflection and contact studies. J. Terramech. 1976, 13, 183–196. [Google Scholar] [CrossRef]
  8. Wismer, R.D.; Luth, H.J. Off-road traction prediction for wheeled vehicles. Trans. ASAE 1974, 17, 8–10. [Google Scholar] [CrossRef]
  9. Kurjenluomar, J.; Alakukku, L.; Ahokas, J. Rolling resistance and rut formation by implement tires on tilled clay soil. J. Terramech. 2009, 46, 267–275. [Google Scholar] [CrossRef]
  10. ASABE. ASAE-Standard ASAE-D497.7 MAR2011(R2020): Agricultural Machinery Management Data; American Society of Agricultural and Biological Engineers: St. Joseph, MI, USA, 2020; p. 15. [Google Scholar]
  11. Hunt, D.R. Engineering Models for Agricultural Production; The Avi Publishing Co., Inc.: Westport, CT, USA, 1986; ISBN 0-87055-494-8. [Google Scholar]
  12. Crossley, C.P.; Kibiwot, V.N.; Reynolds, A.J.; Rickson, R.J. Rut formation and rolling resistance on earth roads. J. Agric. Eng. Res. 2001, 78, 99–107. [Google Scholar] [CrossRef]
  13. ASABE. ASAE-Standard EP542.1-NOV2019: Procedures for Using and Reporting data Obtained with the Soil Cone Penetrometer; American Society of Agricultural and Biological Engineers: St. Joseph, MI, USA, 2019; p. 6. [Google Scholar]
  14. Domier, K.W.; Friesen, D.H.; Townsend, J.S. Traction characteristics of two-wheel drive, four-wheel drive and crawler tractors. Trans. ASAE 1971, 14, 0520–0522. [Google Scholar] [CrossRef]
  15. Botta, G.F.; Tolón-Becerra, A.; Lastra-Bravo, X.; Tourn, M.; Balbuena, R.; Rivero, D. Continuous application of direct sowing: Traffic effect on subsoil compaction and maize (Zea mays L.) yields in Argentinean Pampas. Soil Tillage Res. 2013, 134, 111–120. [Google Scholar] [CrossRef]
  16. Burt, E.C.; Wood, R.K. Soil-tire interface stress measurements. Trans. ASAE 1987, 30, 1254–1258. [Google Scholar] [CrossRef]
  17. Antille, D.L.; Ansorge, D.; Dresser, M.L.; Godwin, R.J. The Effects of Tyre Size on Soil Deformation and Soil Bulk Density Changes; ASABE Paper No.: 083879; American Society of Agricultural and Biological Engineers: St. Joseph, MI, USA, 2008; Volume 4, pp. 2294–2304. [Google Scholar] [CrossRef] [Green Version]
  18. Antille, D.L.; Ansorge, D.; Dresser, M.L.; Godwin, R.J. Soil displacement and soil bulk density changes as affected by tire size. Trans. ASABE 2013, 56, 1683–1693. [Google Scholar] [CrossRef] [Green Version]
  19. Koolen, A.J.; Kuipers, H. Agricultural Soil Mechanics; Advanced Series in Agricultural Sciences; Springer: Berlin/Heidelberg, Germany, 1983; Volume 13, pp. 1–252. [Google Scholar] [CrossRef]
  20. Antille, D.L.; Peets, S.; Galambošová, J.; Botta, G.F.; Rataj, V.; Macák, M.; Tullberg, J.N.; Chamen, W.C.T.; White, D.R.; Misiewicz, P.A.; et al. Review: Soil compaction and controlled traffic farming in arable and grass cropping systems. Agronomy Res. 2019, 17, 653–682. [Google Scholar] [CrossRef]
  21. Plackett, C.W. The ground pressure of some agricultural tyres at low load and with zero sinkage. J. Agric. Eng. Res. 1984, 29, 159–166. [Google Scholar] [CrossRef]
  22. Liljedahl, J.B.; Turnquist, P.K.; Smith, D.W.; Hoki, M. Chapter 10: Traction. In Tractors and Their Power Units, 4th ed.; Springer: Boston, MA, USA, 1989; pp. 240–265. [Google Scholar] [CrossRef]
  23. Jensen, T.A.; Tullberg, J.N.; Antille, D.L. Chapter 3: Improving farm machinery operation and maintenance to optimise fuel use efficiency. In Energy-Smart Farming: Efficiency, Renewable Energy, and Sustainability. Part 1: Efficient Use of Electricity, Heat, and Fuel; Sims, R.E.H., Ed.; Burleigh Dodds Series in Agricultural Science No.: 115; Burleigh Dodds Science Publishing Limited: Cambridge, UK, 2022; pp. 71–102. [Google Scholar] [CrossRef]
  24. Chico-Santamarta, L.; Richards, T.; Godwin, R.J. A Laboratory Study into the Mobility of Travelling Irrigators in Air Dry, Field Capacity and Saturated Sandy Soils; ASABE Paper No.: 096106; American Society of Agricultural and Biological Engineers: St. Joseph, MI, USA, 2009; Volume 4, pp. 2629–2646. [Google Scholar] [CrossRef]
  25. Sitkei, G. Sinkage and rolling resistance of wheels: Some new results on an old problem. Prog. Agric. Eng. Sci. 2015, 11, 85–94. [Google Scholar] [CrossRef] [Green Version]
  26. Desbiolles, J.; Saunders, C.; Barr, J.; Riethmuller, G.; Northover, G.; Tullberg, J.; Antille, D. Chapter 6: Machinery evolution for conservation agriculture. In Australian Agriculture in 2020: From Conservation to Automation; Pratley, J., Kirkegaard, J., Eds.; Agronomy Australia and Charles Sturt University: Wagga Wagga, NSW, Australia, 2019; pp. 81–105. ISBN 13: 978-0-6485819-0-1. [Google Scholar]
  27. Davis, D.B.; Finney, J.B.; Richardson, R.J. Relative effects of tractor weight and wheel-slip in causing soil compaction. J. Soil Sci. 1973, 24, 399–409. [Google Scholar] [CrossRef]
  28. Raghavan, G.S.V.; McKyes, E.; Chassé, M. Effect of wheel slip on soil compaction. J. Agric. Eng. Res. 1977, 22, 79–83. [Google Scholar] [CrossRef]
  29. McKibben, E.G.; Davidson, J.B. Transport wheels for agricultural machines IV. Effect of outside and cross-section diameters on the rolling resistance of pneumatic implement tires. Agric. Eng. 1940, 21, 57–58. [Google Scholar]
  30. Tijink, F.G.J.; Döll, H.; Vermeulen, G.D. Technical and economic feasibility of low ground pressure running gear. Soil Tillage Res. 1995, 35, 99–110. [Google Scholar] [CrossRef]
  31. Soane, B.D.; Dickson, J.W.; Blackwell, P.S. Some options for reducing compaction under wheels on loose soil. In Proceedings of the 8th Conference of the International Soil and Tillage Research Organization, Stuttgart, Germany, 10–14 September 1979; ISTRO: Stuttgart, Germany, 1979; Volume 2, pp. 347–352. [Google Scholar]
  32. Antille, D.L.; Bennett, J.M.c.L.; Jensen, T.A. Soil compaction and controlled traffic considerations in Australian cotton-farming systems. Crop Pasture Sci. 2016, 67, 1–28. [Google Scholar] [CrossRef]
  33. Harris, B.J. Increased Deflection Agricultural Radial Tires Following the Tire and Rim Association IF, VF, and IF/CFO Load and Inflation Standards. In Proceedings of the Agricultural Equipment Technology Conference, ASABE Distinguished Lecture Series Tractor Design No.: 39. Louisville, Kentucky, 13–15 February 2017; ASABE: St. Joseph, MI, USA, 2017. [Google Scholar] [CrossRef]
  34. Godwin, R.J.; Misiewicz, P.A.; Smith, E.K.; Millington, W.A.J.; White, D.R.; Dickin, E.T.; Chaney, K. Summary of the effects of three tillage and three traffic systems on cereal yields over a four-year rotation. Asp. Appl. Biol. 2017, 134, 233–241. [Google Scholar]
  35. McPhee, J.E.; Antille, D.L.; Tullberg, J.N.; Doyle, R.B.; Boersma, M. Managing soil compaction—A choice of low-mass autonomous vehicles or controlled traffic? Biosyst. Eng. 2020, 195, 227–241. [Google Scholar] [CrossRef]
  36. Gauthier, G.F.; Carruthers, R.; Millán-Placci, F. Logística de la Soja: Argentina-Paraguay-Uruguay. Report No.: 105151. Serie de Informes Técnicos del Banco Mundial en Argentina, Paraguay y Uruguay. N°4, 2016; World Bank Group: Washington, DC, USA, 2016; Available online: http://documents.worldbank.org/curated/en/923401468272770160/Logistica-de-la-soja-Argentina-Paraguay-Uruguay (accessed on 27 October 2022).
  37. Botta, G.F.; Tolón-Becerra, A.; Tourn, M.; Lastra-Bravo, X.; Rivero, D. Agricultural traffic: Motion resistance and soil compaction in relation to tractor design and different soil conditions. Soil Tillage Res. 2012, 120, 92–98. [Google Scholar] [CrossRef]
  38. Antille, D.L.; Imhoff, S.C.; Alesso, C.A.; Chamen, W.C.T.; Tullberg, J.N. Potential to increase productivity and sustainability in Argentinean agriculture with controlled traffic farming: A short discussion. Acta Technol. Agric. 2015, 18, 83–87. [Google Scholar] [CrossRef] [Green Version]
  39. Botta, G.F.; Antille, D.L.; Nardon, G.F.; Rivero, D.; Bienvenido, F.; Contessotto, E.E.; Ezquerra-Canalejo, A.; Ressia, J.M. Zero and controlled traffic improved soil physical conditions and soybean yield under no-tillage. Soil Tillage Res. 2022, 215, 105235. [Google Scholar] [CrossRef]
  40. Botta, G.F. Armonización del Peso y Rodado del Tractor para Reducir la Compactación del Suelo. Master’s Thesis, Universidad Nacional de La Plata, Facultad de Ciencias Agrarias y Forestales, La Plata/Buenos Aires, Argentina, 1997. [Google Scholar]
  41. Bekker, M.G. Latest developments in off-the-road locomotion. J. Frankl. Inst. 1957, 263, 411–423. [Google Scholar] [CrossRef]
  42. Bekker, M.G. Off the Road Locomotion: Research and Development in Terramechanics; University of Michigan Press: Ann Arbor, MI, USA, 1960; p. 220. [Google Scholar]
  43. Wong, J.Y. On the study of wheel-soil interaction. J. Terramech. 1984, 21, 117–131. [Google Scholar] [CrossRef]
  44. Ageikin, I.S. Off-the-Road Wheeled and Combined Tractor Devices; Amerind Publishing Co.: New Delhi, India, 1987; p. 202. [Google Scholar]
  45. INTA. Carta de suelos de la Provincia de Buenos Aires; Instituto Nacional de Tecnología Agropecuaria: Buenos Aires, Argentina, 2015; Available online: https://inta.gob.ar/documentos/carta-de-suelos-de-la-provincia-de-buenos-aires (accessed on 20 April 2022).
  46. Bouyoucos, G.J. Hydrometer method improved for making particle size analyses of soils. Agronomy J. 1962, 54, 464–465. [Google Scholar] [CrossRef]
  47. Soil Survey Staff. Soil Taxonomy: A Basic System of Soil Classification for Making and Interpreting Soil Surveys, 2nd ed.; Agricultural Handbook No.: 436; US Department of Agriculture, National Resources Conservation Service: Washington, DC, USA, 1999; p. 886.
  48. Blake, G.R.; Hartge, K.H. Bulk density. In Methods of Soil Analysis, Part 1. Physical and Mineralogical Methods, 2nd ed.; Klute, A., Ed.; Agronomy Monograph; ASA-SSSA: Madison, WI, USA, 1986; Volume 9, pp. 363–375. [Google Scholar] [CrossRef]
  49. Ray, P.N.; Chapman, T.G. The British Standard compaction test for soils: A study of some factors affecting the test results. Geotechnique 1954, 4, 169–177. [Google Scholar] [CrossRef]
  50. Marshall, T.J. Relations between Water and Soil; Technical Communication No.: 50 of The Commonwealth Bureau of Soils; Commonwealth Agricultural Bureaux: Harpenden, UK, 1959; p. 91. [Google Scholar]
  51. Walkley, A.; Black, I.A. An examination of the Degtjareff method for determining soil organic matter, and a proposed modification of the chromic acid titration method. Soil Sci. 1934, 37, 29–38. [Google Scholar] [CrossRef]
  52. Davis, L.E. Measurements of pH with the glass electrode as affected by soil moisture. Soil Sci. 1943, 56, 405–422. [Google Scholar] [CrossRef]
  53. MAFF. The Analysis of Agricultural Materials, 3rd ed.; Reference Book 427; Ministry of Agriculture, Fisheries, and Food, The Stationery Office: London, UK, 1986.
  54. Hassan, A.E.; Sirois, D.L. Traction and rolling resistance of a dual-tired skidder on wetland. Trans. ASAE 1985, 28, 1038–1042. [Google Scholar] [CrossRef]
  55. Cassel, D.K. Tillage effects on soil bulk density and mechanical impedance. In Predicting Tillage Effects on Soil Physical Properties and Processes; Unger, P.W., Van Doren, D.M., Jr., Whisler, F.D., Skidmore, E.L., Eds.; ASA-SSSA Inc.: Madison, WI, USA, 1982; Volume 44, Chapter 4; pp. 45–67. [Google Scholar] [CrossRef]
  56. Yasin, M.; Grisso, R.D.; Bashford, L.L.; Jones, A.J.; Mielke, L.N. Normalizing cone resistance values by covariance analysis. Trans. ASAE 1993, 36, 1267–1270. [Google Scholar] [CrossRef]
  57. Aikins, K.A.; Jensen, T.A.; Antille, D.L. Three-dimensional scanning of soil surface and furrow profiles using a portable and affordable unit. Biosyst. Eng. 2020, 193, 279–289. [Google Scholar] [CrossRef]
  58. Vero, S.E.; Antille, D.L.; Lalor, S.T.J.; Holden, N.M. Field evaluation of soil moisture deficit thresholds for limits to trafficability with slurry spreading equipment on grassland. Soil Use Manag. 2014, 30, 69–77. [Google Scholar] [CrossRef]
  59. Bretschneider, S. Software Reviews: Statgraf 1.1. (1985). Soc. Sci. Microcomput. Rev. 1983, 3, 163–164. [Google Scholar] [CrossRef]
  60. Earl, R. Prediction of trafficability and workability from soil moisture deficit. Soil Tillage Res. 1997, 40, 155–168. [Google Scholar] [CrossRef]
  61. Spoor, G.; Tijink, F.G.J.; Weisskopf, P. Subsoil compaction: Risk, avoidance, identification and alleviation. Soil Tillage Res. 2003, 73, 175–182. [Google Scholar] [CrossRef]
  62. Håkansson, I.; Reeder, R.C. Subsoil compaction by vehicles with axle load extend persistence and crop response. Soil Tillage Res. 1994, 29, 277–304. [Google Scholar] [CrossRef]
  63. Tekeste, M.Z.; Antille, D.L.; Baillie, C.P. Modeling the effect of low ground pressure (LGP) tires on soil stress distribution beneath a cotton picker wheel loading. In Proceedings of the ISTVS 20th International and 9th Americas Conference, Online, 27–29 September 2021; International Society for Terrain-Vehicle Systems. [Paper No.: 119]. 2021. Available online: https://docs.google.com/document/d/12fQuuDEjR2pUK8WZeeYbiGzMfaZZ1nlkP2_GBTtU8J0/edit (accessed on 16 November 2022).
  64. Hovanesian, J.D.; Buchele, W.F. Development of a recording volumetric transducer for studying effects of soil parameters on compaction. Trans. ASAE 1959, 2, 0078–0081. [Google Scholar] [CrossRef]
  65. Botta, G.F.; Pozzolo, O.; Bomben, M.; Rosatto, H.; Rivero, D.; Ressia, M.; Tourn, M.; Soza, E.; Vazquez, J. Traffic alternatives in harvest of soybean (Glycine max L.): Effect on yields and soil under direct sowing system. Soil Tillage Res. 2007, 96, 145–154. [Google Scholar] [CrossRef]
  66. Tullberg, J.N.; Yule, D.F.; McGarry, D. Controlled traffic farming-From research to adoption in Australia. Soil Tillage Res. 2007, 97, 272–281. [Google Scholar] [CrossRef]
  67. Botta, G.F.; Rivero, D.; Tourn, M.; Bellora Melcon, F.; Pozzolo, O.; Nardon, G.F.; Balbuena, R.; Tolón-Becerra, A.; Rosatto, H.G.; Stadler, S. Soil compaction produced by tractor with radial and cross-ply tyres in two tillage regimes. Soil Tillage Res. 2008, 101, 44–51. [Google Scholar] [CrossRef]
  68. Ansorge, D.; Godwin, R.J. The effects of tyres and a rubber track at high axle loads on soil compaction: Part 1. Single-axle studies. Biosyst. Eng. 2007, 98, 115–126. [Google Scholar] [CrossRef] [Green Version]
  69. Pytka, J.D.; Dąbrowski, J.; Zając, M.; Tarkowski, P. Effects of reduced inflation pressure and vehicle loading on off-road traction and soil stress and deformation state. J. Terramech. 2006, 43, 469–485. [Google Scholar] [CrossRef]
  70. Raper, R.L. Agricultural traffic impacts on soil. J. Terramech. 2005, 42, 259–280. [Google Scholar] [CrossRef]
  71. Vanden Berg, G.E.; Gill, W.R. Pressure distribution between a smooth tire and the soil. Trans. ASAE 1962, 5, 0105–0107. [Google Scholar] [CrossRef]
  72. Hidalgo, R.J.; Pozzolo, O.R.; Domínguez, J.F.; Giménez, L.; Botta, G.F. Soil compaction caused by the impact of machinery traffic during corn (Zea mays) harvest. Rev. Fac. Cienc. Agrar. 2020, 52, 161–174. [Google Scholar]
Figure 1. Observed relationships (n = 30) between tyre inflation pressure and rut depth for (a) front-wheel assist (FWA) and (b) four-wheel drive (4WD) tractors used in this study (bulked data for all treatments). A description of treatments is shown in the caption of Table 2a,b.
Agriculture 12 01961 g001
Table 1. Characterisation of the soil (Typic Argiudoll) from the experimental site near Lujan (Buenos Aires, Argentina). DUL100 is drained upper limit measured at 100 cm suction and is considered to be the laboratory determination of field capacity; SOC is soil organic carbon. Values are means of five determinations (n = 5).
Property MeasuredAnalytical MethodAnalytical Value
Depth interval, mm-0–150 150–300300–450450–600
Particle size analysis[46]----
Clay (<2 μm), %-20.124.827.934.2
Silt (2–50 μm), %-75.670.867.261.3
Sand (>50 μm), %-4.34.44.94.5
Textural class[47]Silt loamSilt loamSilty clay loamSilty clay loam
Soil bulk density, kg m−3[48]1240127013301370
Proctor density, kg m−3[49]1490153016801710
Proctor soil water content, % (w/w)[49]22.323.124.425.2
DUL100, % (w/w)[50] 26.628.526.828.7
SOC, % (w/w)[51]1.851.440.950.61
pH1:2.5 (soil:water ratio)[52]5.85.86.06.2
Table 2. (Top): Description of tractors, specification of front tyres and settings, and front axle loads used in the experiments. Notation: ‘FWA’ (front-wheel assist), 4WD (four-wheel drive), ‘D’ (dual tyres), and ‘S’ (single tyres). The symbol (†) denotes the tractor fitted with tyres supplied by the local dealer (or selected by customers when the equipment was first acquired), and (Bottom): Description of tractors, specification of rear tyres and settings, and rear axle loads used in the experiments. Notation: ‘FWA’ (front-wheel assist), 4WD (four-wheel drive), ‘D’ (dual tyres), and ‘S’ (single tyres). The symbol (†) denotes the tractor fitted with tyres supplied by the local dealer (or selected by customers when the equipment was first acquired).
(a) Front Axle
TractorTreatmentFront TyresSpecificationInflation PressureMean Ground PressureFront Axle LoadLoad/Tyre
Units------------------ kPa ------------------------- kN ----------
FWAFWA_DSingle520/70 R268060.3530.3015.15
FWAFWA_SSingle18.4 R266060.0123.3011.65
FWA(†) FWA_SSingle480/70 R267065.1028.8414.42
4WD4WD_DSingle18.4 R3819048.8064.9632.48
4WD4WD_SSingle24.5 R3211052.8167.2033.60
4WD(†) 4WD_SSingle23.1 R3018061.2563.7031.85
(b) Rear Axle
TractorTreatmentRear TyreSpecificationInflation PressureMean Ground PressureRear Axle LoadLoad/Tyre
Units------------------ kPa ------------------------- kN ----------
FWAFWA_DDual18.4 R3814045.2545.4322.71
FWAFWA_SSingle24.5 R326055.4046.6023.30
FWA(†) FWA_SSingle23.1 R3010068.9043.5621.78
4WD4WD_DDual18.4 R388031.8035.0017.50
4WD4WD_SSingle24.5 R324039.2036.2018.10
4WD(†) 4WD_SSingle23.1 R307056.2034.3017.15
Table 3. (Top): Summary of soil cone index (CI) data recorded after single-pass tests with the FWA and 4WD tractors used in this study. Different letters horizontally indicate that mean values are significantly different (p < 0.05). Description of tractors and treatments’ notation are as shown in the caption of Table 2. (Bottom): Summary of soil cone index (CI) data recorded after driving the front tyres and the whole vehicle (front and rear tyres) over the soil, and the CI of front tyres expressed as a percentage of the CI recorded after the pass of the whole vehicle. Single-pass tests performed with the 4WD tractor. Description of the 4WD tractor and treatments’ notation are as shown in the caption of Table 2.
(a) Tractor Type: FWA and 4WD
TreatmentFWA_DFWA_S(†) FWA_S4WD_D4WD_S(†) 4WD_S
Depth interval, mm-------------------------------------------------------- CI, kPa -------------------------------------------------------
0–1501699 b1778 b1800 b1789 b1749 b2020 c
150–3002010 b2170 c1930 b 2380 c2545 d2290 c
300–4502322 b 2410 c2290 b 2688 c 2790 d2610 c
450–6002565 a 2605 b2508 a2762 c 2890 c2701 c
(b) Tractor Type: 4WD
MeasurementCI after Pass of front TyreCI after Pass of Whole VehicleCI of front Tyre Relative to CI of Whole Vehicle
Treatment4WD_D4WD_S(†) 4WD_S4WD_D4WD_S(†) 4WD_S4WD_D4WD_S(†) 4WD_S
Depth interval, mm--------------------------------- CI, kPa ----------------------------------------------------- % --------------------
0–1501319127014501789 1749 2020 73.772.671.7
150–3001590193015782380 2545 2290 71.062.468.9
300–4502000192818452688 2790 2610 74.469.170.6
450–6001900214019502762 2890 2701 68.774.072.1
Table 4. Rolling resistance, rut depth, and power losses recorded for the FWA and 4WD tractors after single-pass tests. Different letters (horizontally) indicate that mean values are significantly different (p < 0.05). Description of the tractors and treatments’ notation are as shown in the caption of Table 2a,b.
Measurement/TreatmentFWA_DFWA_S(†) FWA_S4WD_D4WD_S(†) 4WD_S
Overall load, kN75.7377.7072.0699.96104.4098.00
Rolling resistance, kN6.2 c3.6 a5.2 b8.9 e6.5 c7.1 d
Power loss, kW8.6 c5.0 a7.2 b12.3 d9.0 c9.8 c
Rut depth, mm73 b62 a65 a100 d84 c97 d
Publisher’s Note: MDPI stays neutral with regard to jurisdictional claims in published maps and institutional affiliations.

