Article

Degradation Pattern of Five Biodegradable, Potentially Low-Environmental-Impact Mulches under Laboratory Conditions

by
Jaime Villena
1,
Marta M. Moreno
1,*,
Sara González-Mora
2,
Jesús A. López-Perales
1,
Pablo A. Morales-Rodríguez
1 and
Carmen Moreno
1
1
Higher Technical School of Agricultural Engineering in Ciudad Real, University of Castilla-La Mancha, Ronda de Calatrava 7, 13071 Ciudad Real, Spain
2
Council of Agriculture, Water and Rural Development, Junta de Comunidades de Castilla-La Mancha, 13270 Almagro (Ciudad Real), Spain
*
Author to whom correspondence should be addressed.
Agriculture 2022, 12(11), 1910; https://doi.org/10.3390/agriculture12111910
Submission received: 16 October 2022 / Revised: 7 November 2022 / Accepted: 8 November 2022 / Published: 13 November 2022
(This article belongs to the Special Issue Sustainable Agriculture: Theories, Methods, Practices and Policies)

Abstract

:
The use of biodegradable (BD) plastic mulch materials as alternatives to the widely used low-density polyethylene (PE) is increasing nowadays, mainly for environmental reasons. However, the success of these materials depends, in addition to fulfilling their function, on completely degrading in the short term, which depends on both their composition and environmental conditions. This study focused on the degradation pattern of five BD plastic materials of different composition (i.e., corn and potato starch, and polylactic acid plastic (PLA) films, blended with different copolyesters during their manufacture), in two soils with different granulometry (Soil 1 has less clay content than Soil 2), taken from organic vegetable fields under controlled laboratory conditions. Conventional PE was used as a reference. The degree of degradation was evaluated through the number of fragments, weight loss, and surface area loss until their total disappearance. The degradation trend of the BD materials was similar in both soils, although much faster in Soil 2. Their total visible disappearance was in the following ranges: potato starch, 225–250 days in Soil 1, 150–200 days in Soil 2; corn starch, 550 days in Soil 1, 300 days in Soil 2; PLA, 1000–1050 days in Soil 1, 350–475 days in Soil 2. PE remained practically intact in both trials. The degradation model of potato starch materials fitted a decreasing exponential model in both soils, while the other bioplastics followed a decreasing Gompertz model, in all cases with steeper slopes in Soil 2. The curves of the degradation models indicated how the same material can degrade differently depending on the type of soil, information that could be useful for users and manufacturers in the framework of a sustainable agriculture.

1. Introduction

Mulching is used worldwide in agriculture for several reasons, which can be summarized as follows: increasing and stabilizing soil temperature, weed control, improving crop yields and quality, reducing soil evaporation and erosion, increasing soil water-holding capacity, and improving the efficiency of fertilizers and water, among other benefits [1,2,3,4,5]. For this purpose, polyethylene (PE), a petroleum-based polymer, is the most commonly used, mainly due to its ease of installation and maintenance, high durability, reasonably low price, and its positive effects on crop yields [6,7]. Among PE types, low-density PE (LDPE) is the most commonly used due to its high puncture resistance, impermeability to water, and mechanical stretch properties [8,9]. However, the excessive use of PE for mulching in recent decades has undoubtedly had a negative impact on the environment, as a result of its long degradation period, estimated at about 100 years [10], due to its high molecular weight and chemical stability [11]. Even as microplastics (<5 μm), it can threaten both aquatic [12] and terrestrial life, especially if these particles have adsorbed pesticides [13]. A detailed review of the environmental risk, toxicity, and biodegradation of polyethylene, as well as the positive and negative effects of mulching, can be found in previous studies [13,14,15].
With the aim of reducing these environmental problems, alternative materials to be used as mulch have increased in recent decades, especially biodegradable (BD) plastic films from renewable resources. In the field, these materials can experience photodegradation, for those parts exposed to solar radiation, and biodegradation as a result of the action of soil microorganisms [16]. The review compiled by Maisara and Mariatti [7] summarized the ideal characteristics a BD mulch film should have, according to the current international standards [17,18], as soil biodegradability, high tensile strength, low cost, good barrier properties, low water permeability, high elongation, and low photosynthetic active radiation transmittance. With the aim of approaching these ideal characteristics as closely as possible, additives and/or other polymers need to be included in their formulation [7,19,20]. In summary, BD plastic mulches can first be classified into synthetic and natural materials. Synthetic polymers include polyhydroxyalkanoates (PHA), polylactic acid (PLA), polybutylene succinate (PBS), and polybutylene adipate terephthalate (PBAT), while natural polymers include starch, lignin, and cellulose, among others. They may all exist as a single polymer, or they may be blended and made up of different polymers [21]. A detailed description of all these components can be found in Manzano et al. [22], Merino et al. [23], and Maisara and Mariatti [7].
Research studies into aspects of the degradation of mulch materials have increased considerably in the last 10 years, due to concerns about the previously mentioned problems [7]. The different methods used for estimating the processes related to mulch degradation in laboratory conditions, summarized as changes in the mechanical and optical properties, the CO2 evolution/O2 consumption ratio, the amount of carbon assimilated by the microbial community, or by soil enzymatic measurements, can be seen in Moreno et al. [24].
The present study is linked with that carried out by Moreno et al. [24], analyzing the deterioration pattern of six BD mulch materials (five of which are used in the present study) under field conditions, as well as their deterioration rate after incorporation into the soil. The current study therefore analyzed the degradation pattern of these same five mulch materials, until their total visual disappearance, through the evolution of weight, surface area, and number of fragments over time, in controlled laboratory conditions. The trials were carried out in the same soil used in the previous study, and additionally, the experiment was duplicated in another type of soil with different characteristics, mainly related to the kind of texture. This would allow the importance of the soil in the degradation process of the materials to be highlighted according to their nature and formulation.

2. Materials and Methods

2.1. Experimental Design

A laboratory experiment was conducted at the Sustainable Agriculture Laboratory of the Higher Technical School of Agricultural Engineering in Ciudad Real (University of Castilla-La Mancha, Ciudad Real, Spain).
Five BD films of different compositions used as mulch in agriculture were selected: Mater-Bi® (MB); Sphere 4 (Sp4); Sphere 6 (Sp6); Bioflex® (BFx); Ecovio® (Eco). A conventional standard linear low-density polyethylene (PE) was used as a control. All of these films were black in color and 15 μm in thickness (data provided by the suppliers). The main components and manufacturers of these materials are shown in Table 1.
As previously argued [24], all the BD materials used are susceptible to degradation due to different factors (microorganisms, temperature, humidity, and light). The starch-based materials are especially sensitive to humidity, while the PLA-based materials need, in addition to high humidity, higher temperatures for a fast degradation process. In this sense, PBAT as mulch is limited due to the excessive degradation rate, and for this reason several methods have been proposed to delay their degradation time, such as adding an ADR chain extender, UV absorber, and antihydrolytic agent, among others, as compiled by Quiao et al. [25,26].
Soil samples from two different types of soil (Soil 1, Soil 2) were collected from experimental organically managed vegetable fields (EC 848/2018) at the Agrarian Research Centre “El Chaparrillo” (39°0′ N–3°56′ W, altitude 640 m) (Regional Institute of Research and Food Industry and Forestry Development, IRIAF), Ciudad Real, Spain, at the end of June. Soil samples from Soil 1 correspond to the plot used in the field trials described in Moreno et al. [24].
In the laboratory, soil samples were spread out and air dried at room temperature for 72 h. They were then sieved through a 2 mm mesh sieve and analyzed for physical and chemical properties (Table 2). The differences between the two soils were mainly textural in nature, especially because of the clay content (Soil 1: 8.8%, sandy-loam; Soil 2: 29.0%, clay-loam). Additionally, in order to estimate the microbiological status of both soils at the beginning of the trial, enzyme activity was estimated through dehydrogenase activity (DHA), widely used as a good indicator of oxidative status in soils, according to Casida et al. [27,28] with further modifications [29,30]. Similar values were found in both soils, around 148 μg g-1 soil−1 day−1.
In preparing the trial, the procedure adopted was, in general terms, that established by Barragán et al. [16] but with the following modifications.
From each type of mulch material, 180 pieces of 8 × 8 cm2 were cut (180 samples × 6 materials = 1080 samples in total) and weighed individually on a precision balance (mod. Crystal, 0.1 mg precision). Next, the samples were individually placed in non-biodegradable plastic containers (polyethylene terephthalate, PET) with a capacity of 500 mL, perforated at the top and on the sides, previously filled with 400 mL of soil from each of the two soils tested. Plastic samples were carefully buried in the central part of the containers, fully extended, leaving the same distance between the top and the bottom. Therefore, 90 samples of each material were placed in each soil type (90 samples × 6 materials = 540 samples for each soil). Distilled water was then added to each container, to adjust the water soil content up to 50% of water-holding capacity. This value was determined using the methodology proposed by Jarrel et al. [31]. The containers were then transferred to an environmental chamber at a constant temperature of 25 °C and in dark conditions. Throughout the trial period, the soil humidity was checked weekly by randomly weighing 10 containers of each soil and correcting the weight loss by adding water.

2.2. Laboratory Measurements of Mulch Materials

From the beginning of the trial, the film samples were periodically extracted, up to their total degradation, at variable intervals according to their state (25 sampling dates maximum). To determine these dates, the film samples were visually inspected approximately every 10 days. On each sampling date, 36 film samples were extracted, corresponding to the material that had not yet been completely degraded (6 materials × 3 repetitions of each material × 2 soils), in order to determine the weight and surface area of each buried material. Next, the remnants of the films were carefully separated from the soil, cleaned with distilled water and cotton, dried at room temperature to constant weight, and weighed on a precision balance (±0.1 mg). The weights of the samples were expressed in grams, and as a percentage of the initial weight (new material), calculated as follows:
Weight (%) = (Wn/Wo) × 100
where Wo is the initial weight of the sample before starting the test and Wn the weight of the material on date n during the test.
Once weighed, the material remnants were photographed in order to determine their surface area. This was done by placing the samples in a glass support with a white background, illuminated from below, and photographed with a digital compact camera with built-in lens and optical viewfinder, model Canon PowerShort G11, 35 mm. The photographs were analyzed with the ImageJ® program. The scale for each image was established by drawing a line between two known points, 100 mm apart, using the program’s Set Scale function. Thus, the number of fragments and the surface area of each were obtained directly. As for weight, surface area data was expressed in cm2, or as a percentage of the initial value, calculated as follows:
Area (%) = (An/Ao) × 100
where Ao is the initial surface area of the sample before starting the test (64 cm2) and An the surface area of the material on date n during the test.
Additionally, the changes in the morphology of the surface areas of the films PE, MB, Sp6 and BFx during the degradation process were examined 100 days after the start of the trial, through micro-photographs taken by scanning electron microscopy (SEM, Scanning Electron Microscope, mod. JEOL JSM-6610LV) and compared with new materials. The scanning of the samples was performed at 500 and 1000 magnifications.

2.3. Statistical Analysis

The analysis of the data, both the descriptive study and the corresponding Analysis of Variance (ANOVA) and Linear and Non-Linear Regression for the establishment of models, was carried out with Infostat v. 2015 professional, with connectivity to the statistical package R (https://cran.r-project.org) (accessed on 15 June 2022), taking a significance level of 0.05.
When statistically significant differences were found, multiple range comparisons (Duncan’s test) and the Least Significant Difference (Fisher’s LSD) test were performed, incorporating the value of the latter through segments in the corresponding graphs.
In the choice of the best degradation model among those tested, the respective values of the AIC index (Akaike Information Criterion) were compared. The AIC is an estimator based on Information Theory, a measurement of the relative quality of the different statistical models that represent a data set [32]. AIC is calculated as follows:
AIC = 2 K − 2 ln(L)
where K is the number of independent variables used en the models and L is the log-likelihood estimate. The best-fit model according to AIC is the one that explains the greatest amount of variation using the fewest possible independent variables. Thus, the model with the lowest AIC index value was taken as appropriate for modelling.

3. Results and Discussion

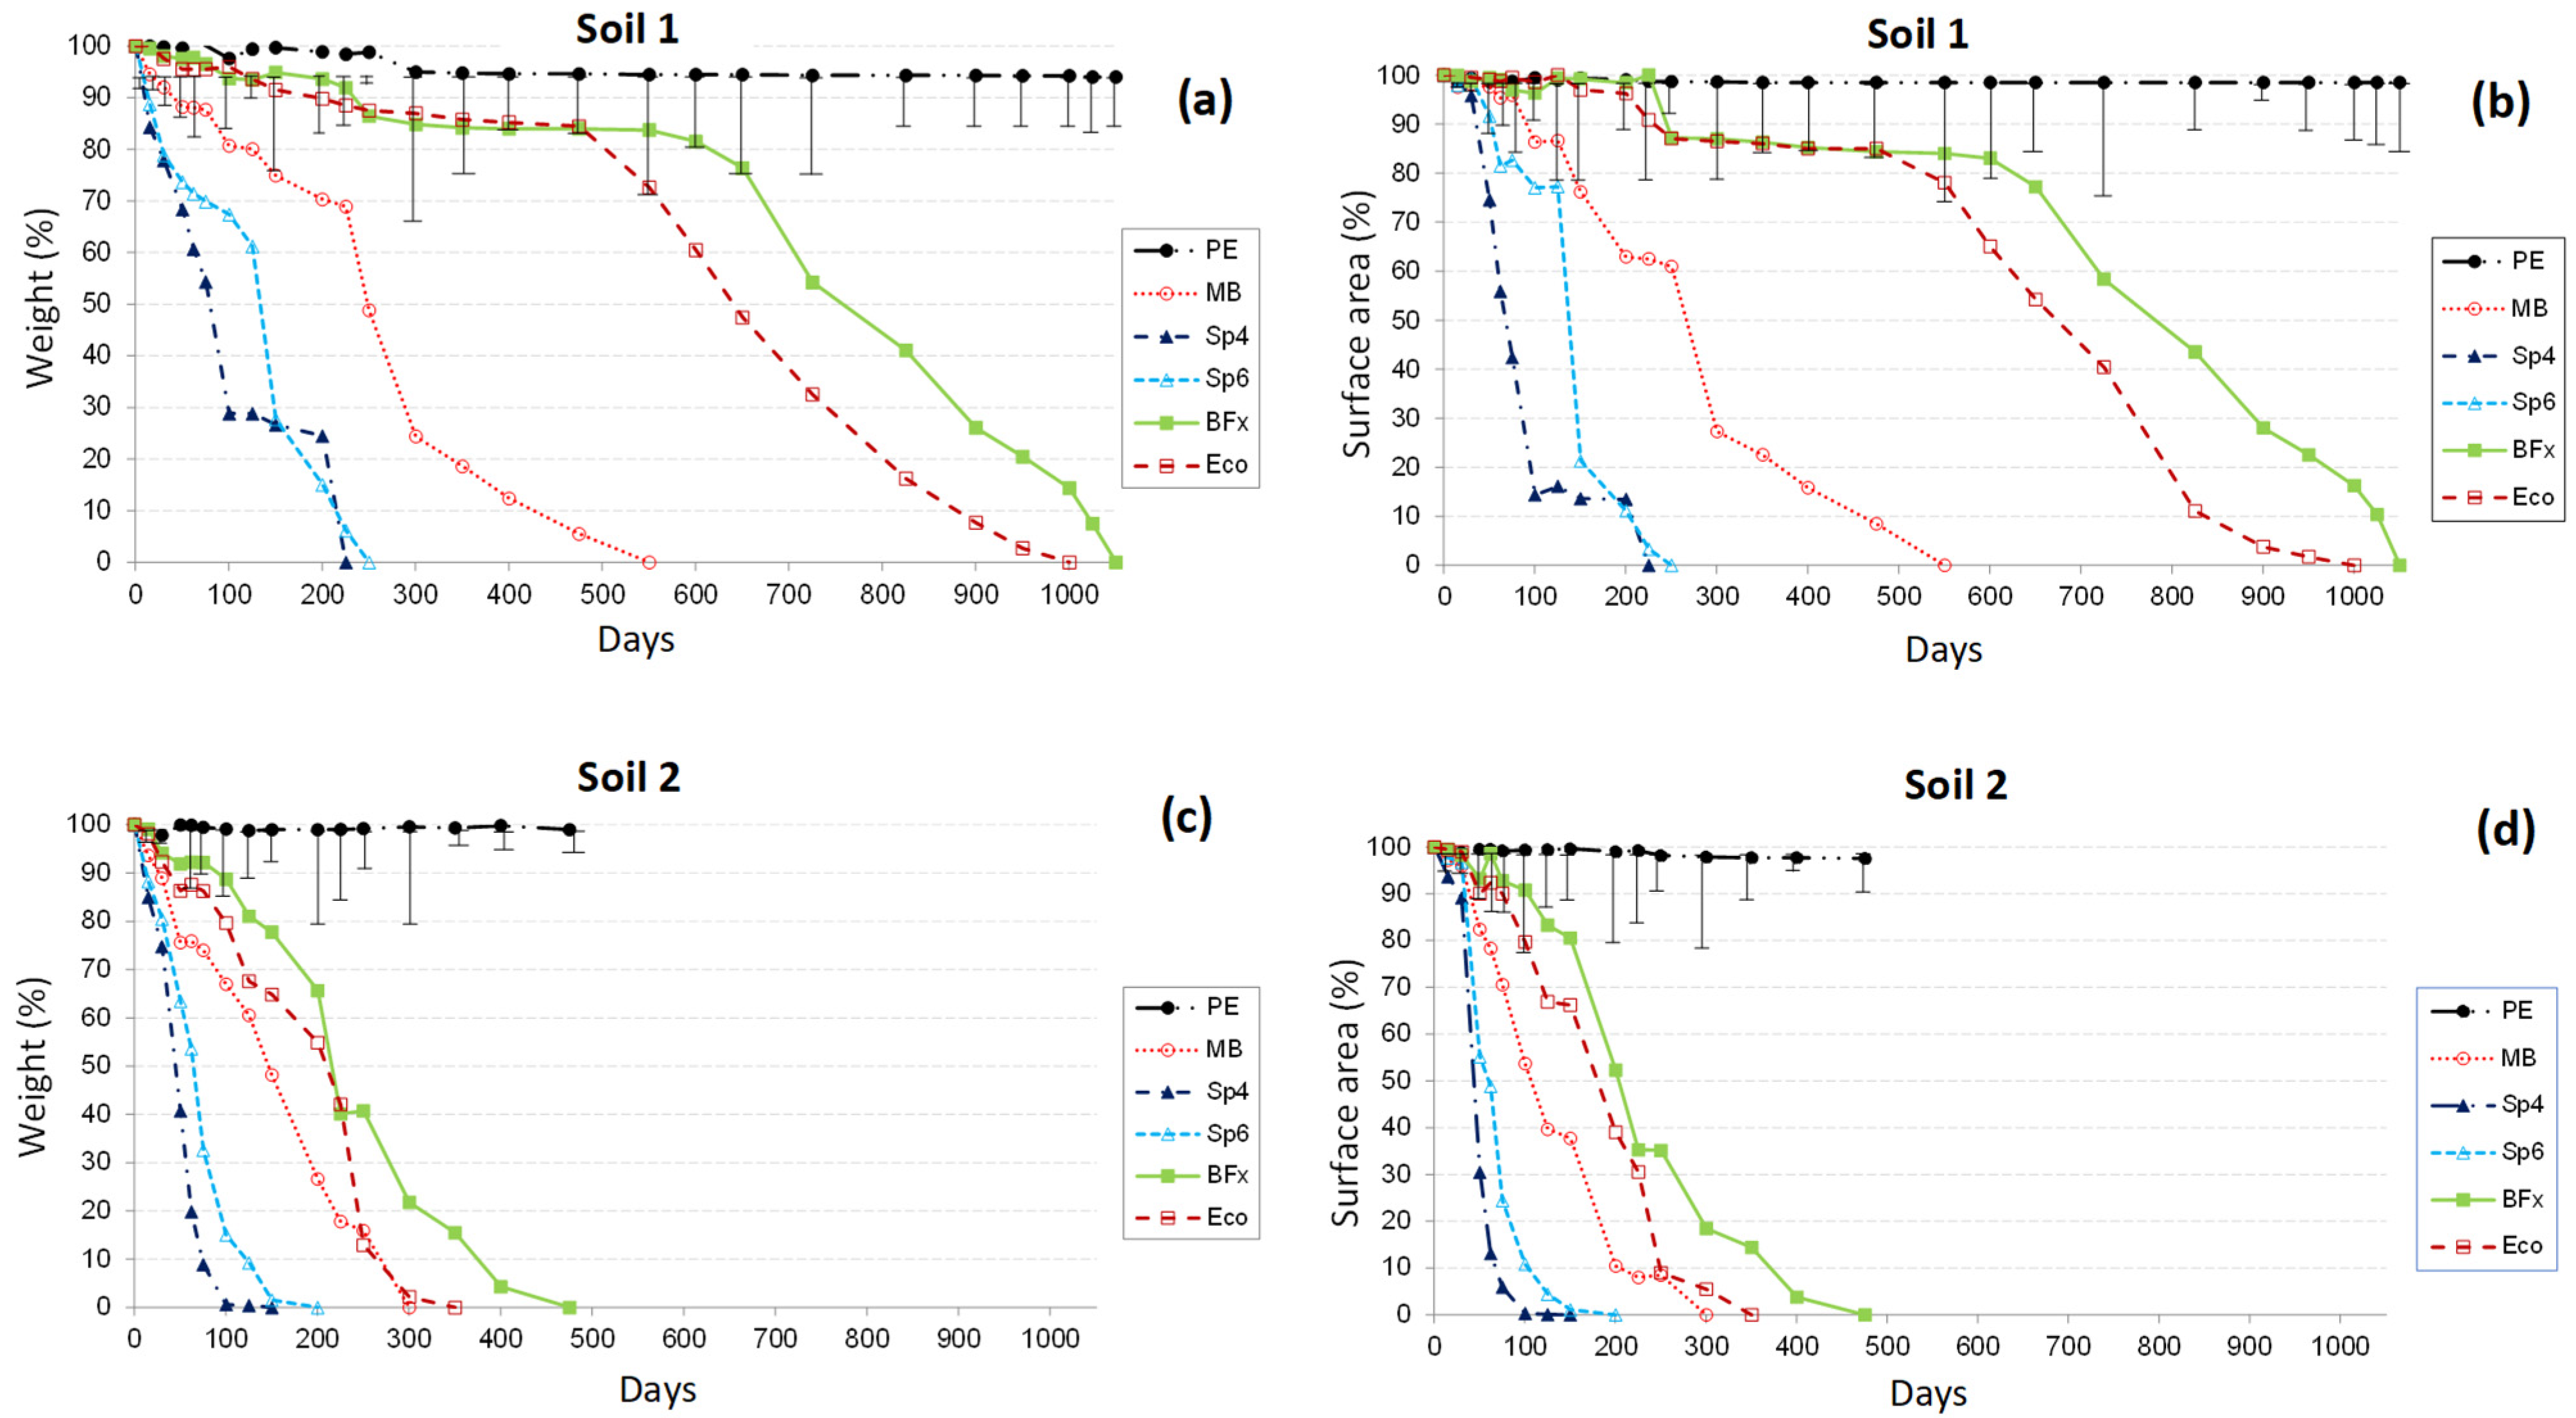
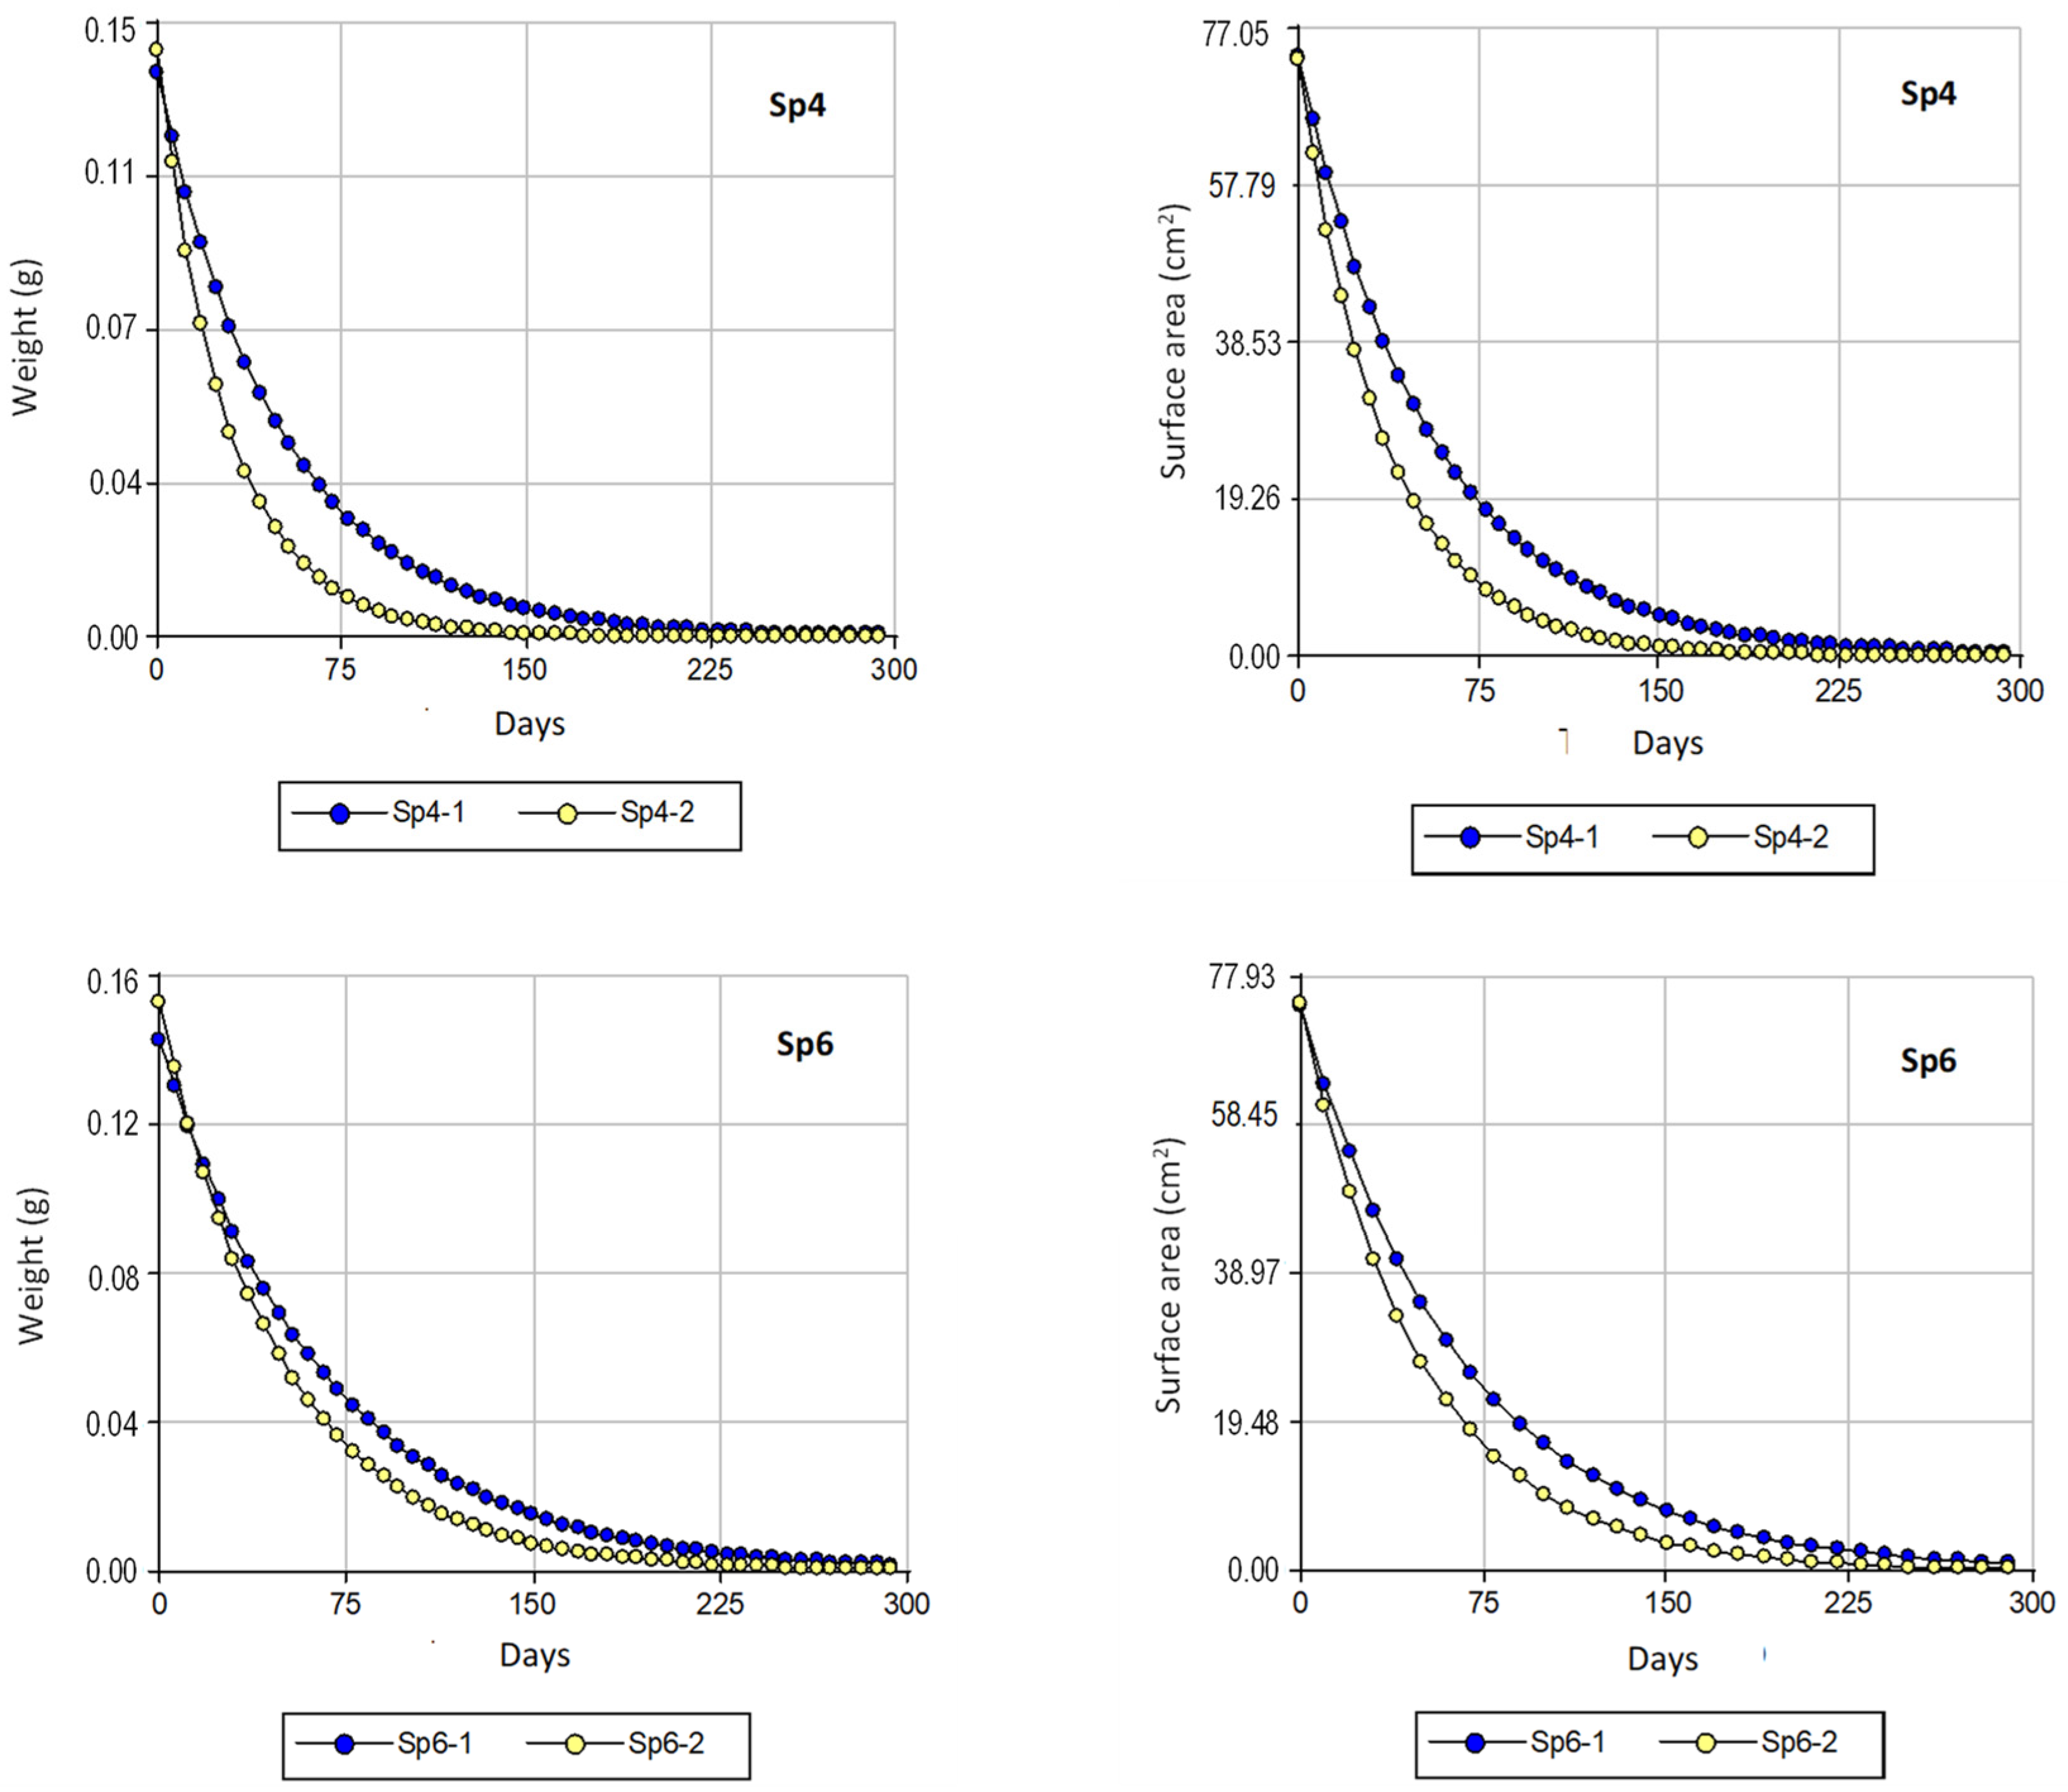
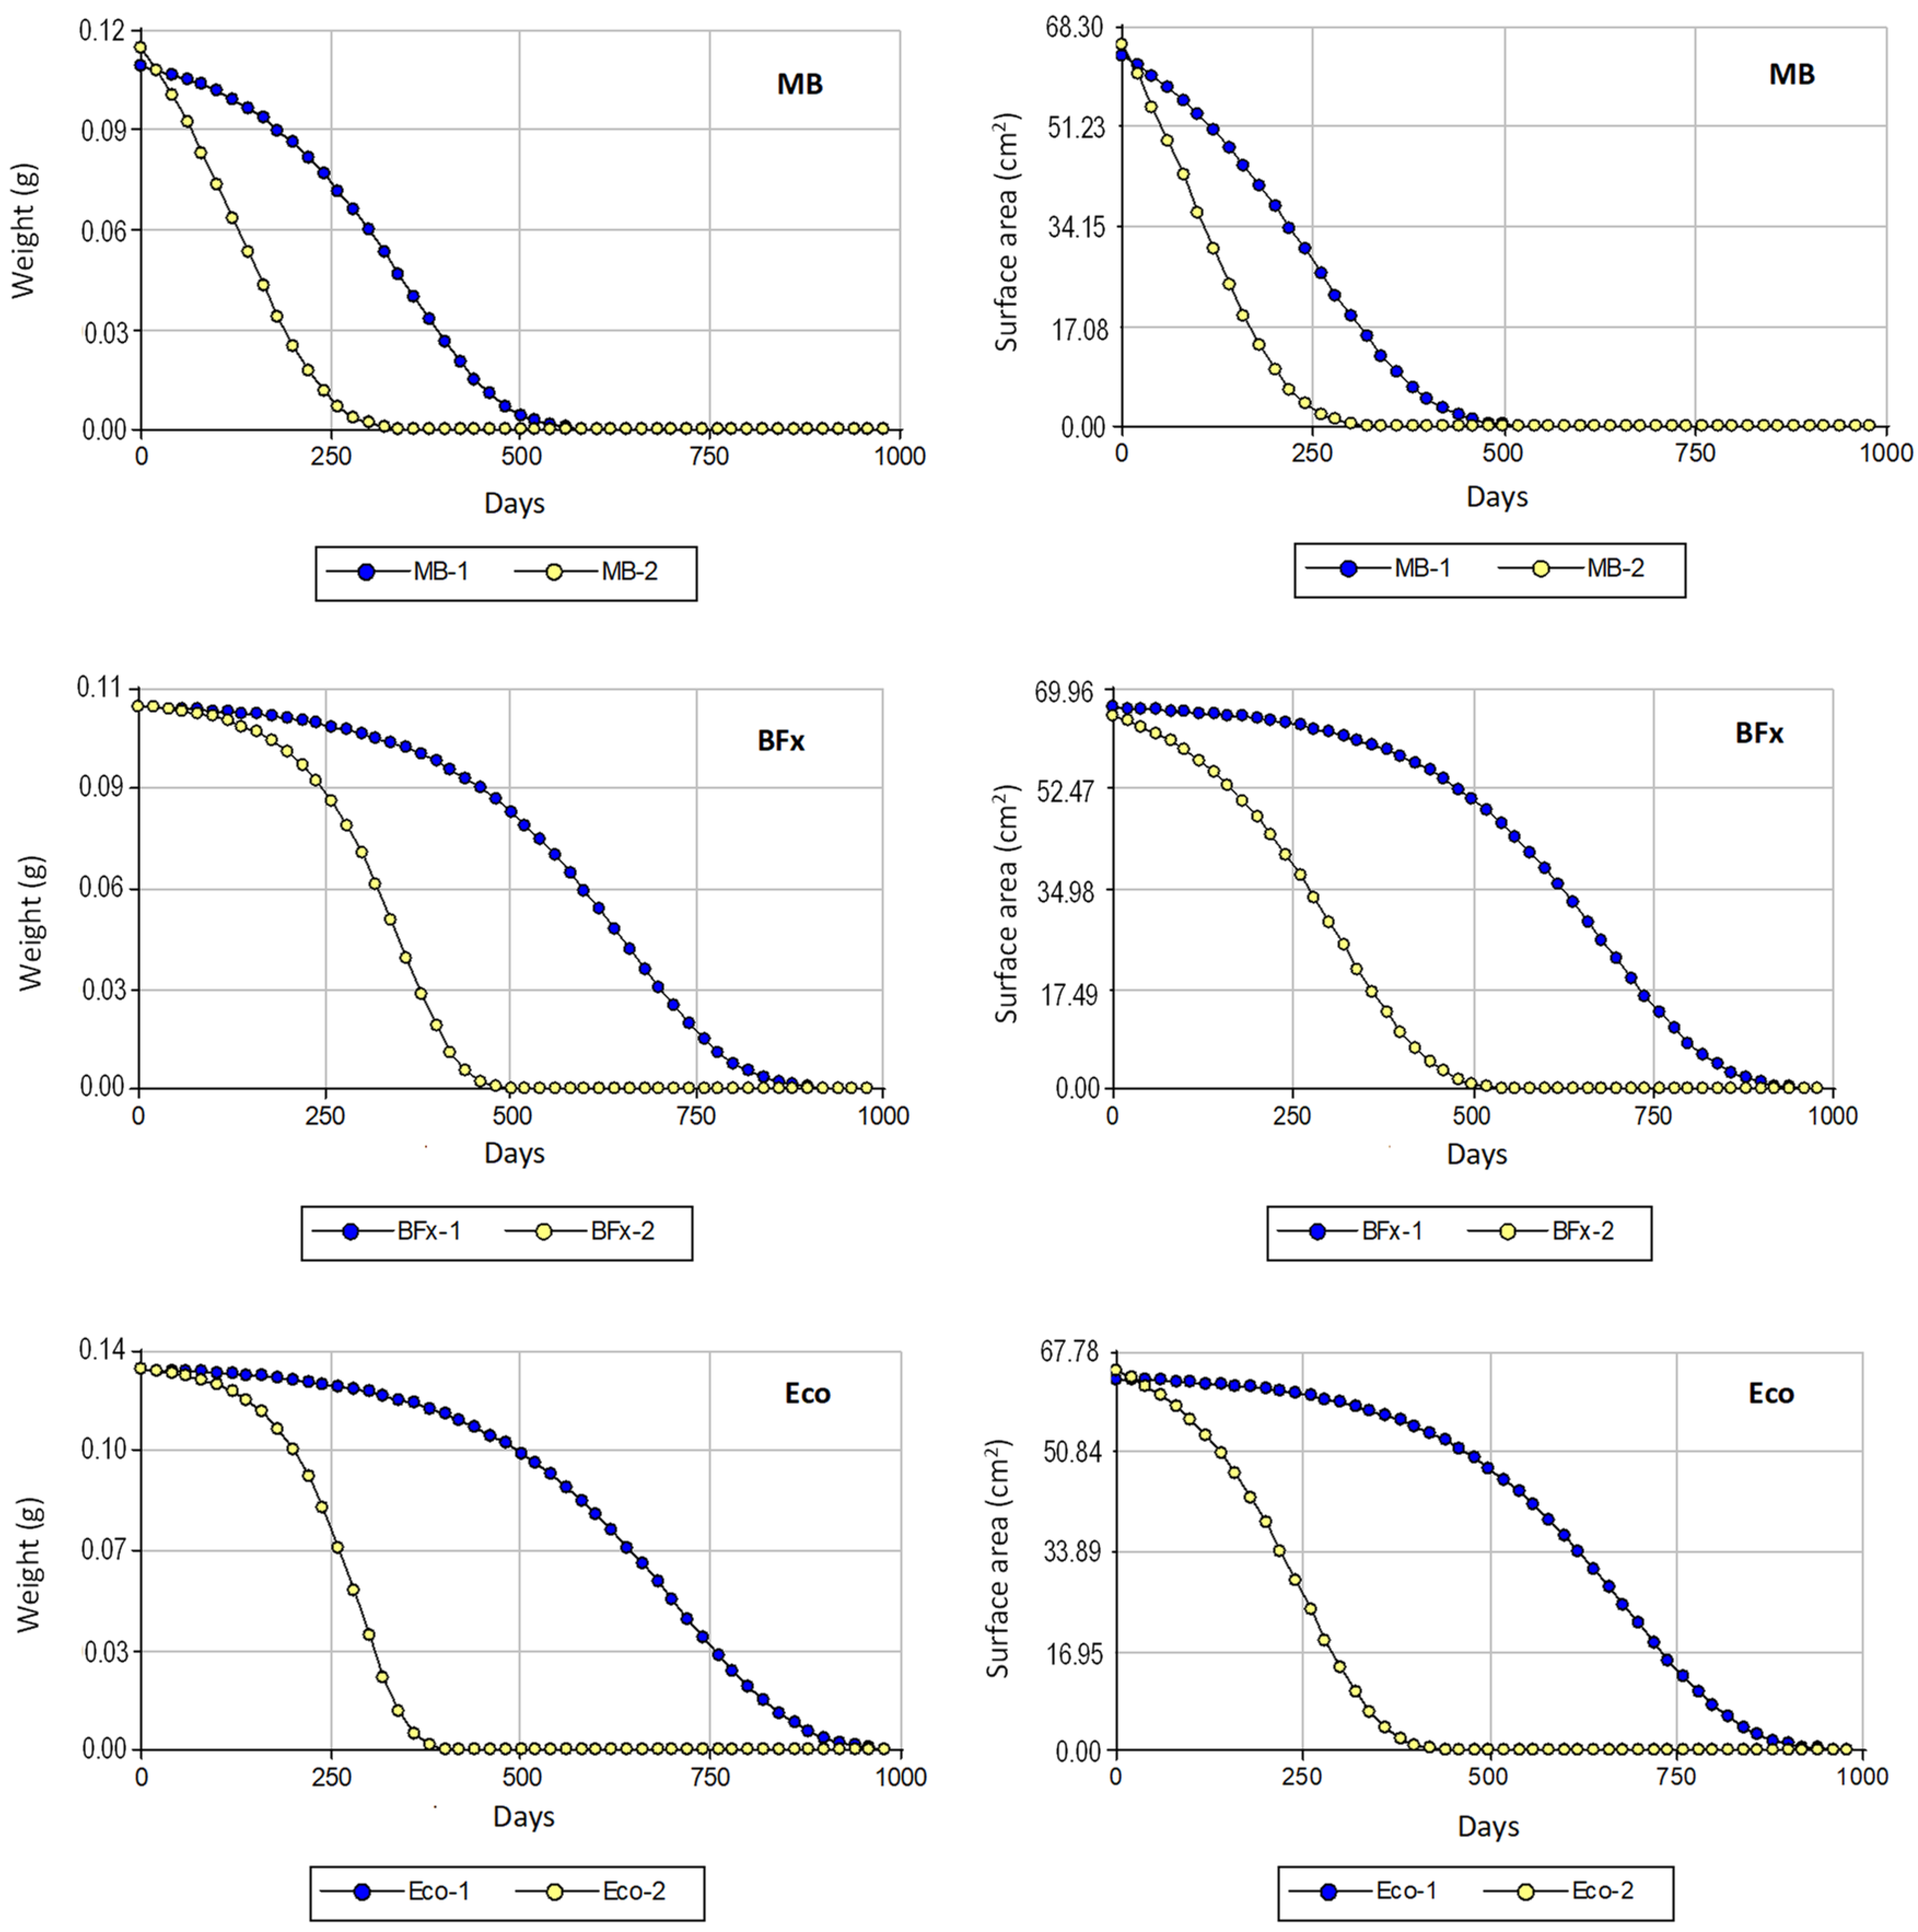
3.1. Evolution over Time of Weight, Surface Area and Number of Fragments

The initial weights of all the materials tested were in the range 0.111 (BFx) to 0.130 (Sp6) grams per 8 × 8 cm2 of surface area. However, from the first sampling date (15 days), significant differences both in weight and in surface area were established among materials in both soils, as shown in Figure 1 (values expressed as percentage in relation to the initial values: new materials, 0 days). Thus, the evolution of the weight and surface area of the materials in each soil was broadly similar. From 50 days in Soil 1 (Figure 1a,b), Sp4 and Sp6 stood out as the most degraded, a circumstance that was maintained until their total disappearance (at 225 days in Sp4 and 250 days in Sp6). Similar behavior was observed in Soil 2 (Figure 1c,d), although in this case the total degradation of these materials occurred somewhat earlier (at 150 days in Sp4 and 200 days in Sp6). MB totally disappeared at 550 days in Soil 1 and at 300 days in Soil 2. As expected, PE remained practically intact in both soils, while the PLA-based materials (BFx and Eco) showed intermediate behaviors; thus, Eco completely disappeared at 1000 days in Soil 1 and at 350 days in Soil 2, while visible remnants of BFx remained up to 1050 and 475 days in Soils 1 and 2, respectively.
In the field study previously carried out in Soil 1 by Moreno et al. [24], a similar trend was also observed in the degradation of the buried part of the tested mulch materials according to their nature (starch > PLA > PE) at the end of the crop cycle (145 days after transplanting). Although that timeframe (145 days) was not enough to achieve a significant deterioration of the buried part of the PLA mulches in the field (~10% as average), the starch-based materials did show it, especially Sp4 and MB (~40%), although this was not as pronounced as under laboratory conditions, in agreement with previous works [33].
It is noteworthy that the total variability of the current trial increased as it progressed, reaching a coefficient of variation of 400% (data not shown) at the end of the experiment in each soil (1050 days in Soil 1 and 475 days in Soil 2).
These trends can also be seen in Figure 2 and Figure 3, which show a photographic sequence of the evolution of the different materials (one of the three repetitions of each one) until the end of the tests in both soils.
In the comparison of soils, with the exception of PE (which remained practically intact in both), the loss of weight and surface area of the materials was more pronounced in Soil 2 than in Soil 1 (therefore, degradation in Soil 2 was faster). This may have been a consequence of the larger soil–material contact surface in soils with a greater clay component (Soil 2), since the enzymatic activity (ADH) was similar at the beginning of the experiment in both soils. Regarding the materials, in general the degradation depended on their nature, being faster in those based on starch (especially potato (Sp4 and Sp6) compared with corn (MB)) than in PLA compounds (BFx and Eco).
These results differ from those obtained by Barragán et al. [16] under laboratory conditions similar to those of the present study. The former study was carried out in a clay-loam soil with a slightly basic pH, non-saline, with 3.13% organic matter and a high carbonate content (29%), and in that case, MB and BFx practically disappeared at 180 days and a film based on potato starch at 160 days. An explanation for the lower film degradation in our trial could be the lower organic matter content of the soil (1.6% and 1.7% in Soils 1 and 2, respectively), because a high organic matter content favors soil microorganism activity and therefore the process of biodegradation [16,34].
Although Sp4, Sp6, and MB are formulated with a biodegradable base (potato or corn starch), they were blended with different types and amounts of copolyesters during their manufacture. This could well be the cause of the variations in their degradation processes. Likewise, the additives and the presence of vegetable oils in the MB blend with starch could lead to slower degradation compared with potato starch compounds [16]. In this sense, according to Vázquez et al. [35], the presence of amylose–lipid complexes has a negative effect on the enzymatic digestibility of starch, which could also explain the behavior of MB.
In a similar study, Mostafa et al. [36] found that pieces of MB buried in a sandy-loam soil at 25 °C degraded by up to 70% in five months. In our trial, however, the degradation of MB in the soil of a similar textural class (Soil 1) was much lower at that date (around 20%), which could be attributable, as in the previous comparison with Barragán et al. [16], to the lower organic matter content in our study.
In the case of the PLA materials, their slower degradation in comparison with starch-based materials could be explained by the temperatures maintained during the whole trial (≈25 °C), which were lower than the minimum threshold values indicated previously [37] for PLA degradation (≥30 °C). Other authors also support this [16,38,39], arguing that the slow degradation of PLA materials is a result of the normally low temperature of the soil and the limited hydrolysis of PLA in the soil environment.
Comparing both PLA materials, the higher degradation rate of Eco compared with BFx could be caused by the copolyester component added in its manufacture (PBAT in Eco and PBS in BFx) [16,36].
When discussing the different behavior of the materials used in the trials, it should also be noticed that the thickness of the films affects the disintegration process, as specifically discussed in previous works [40]. In our study, all the films used theoretically had the same thickness, although this information was given by the supplier companies.
With regard to the number of fragments (Supplementary Tables S1 and S2), the disintegration of the materials was higher in Soil 2 than in Soil 1, according to weight and surface area behavior. As examples, Sp4 and Sp6 in Soil 2 were in 31 and 25 fragments, respectively, at 50 days, while in Soil 1, 10 and 1 pieces were registered. MB in Soil 2 had 12 fragments at 75 days, while in Soil 1 the material was still practically intact. In the PLA materials, the slower fragmentation is very striking; in particular, Eco remained practically intact up to 475 days in Soil 1 and 100 days in Soil 2. As expected, PE did not undergo any disintegration process. All these circumstances led to great variability (measured through the coefficient of variation) in the number of fragments observed in the trial, which reached 100% after 50 days in practically all the sampling dates (Supplementary Tables S1 and S2).

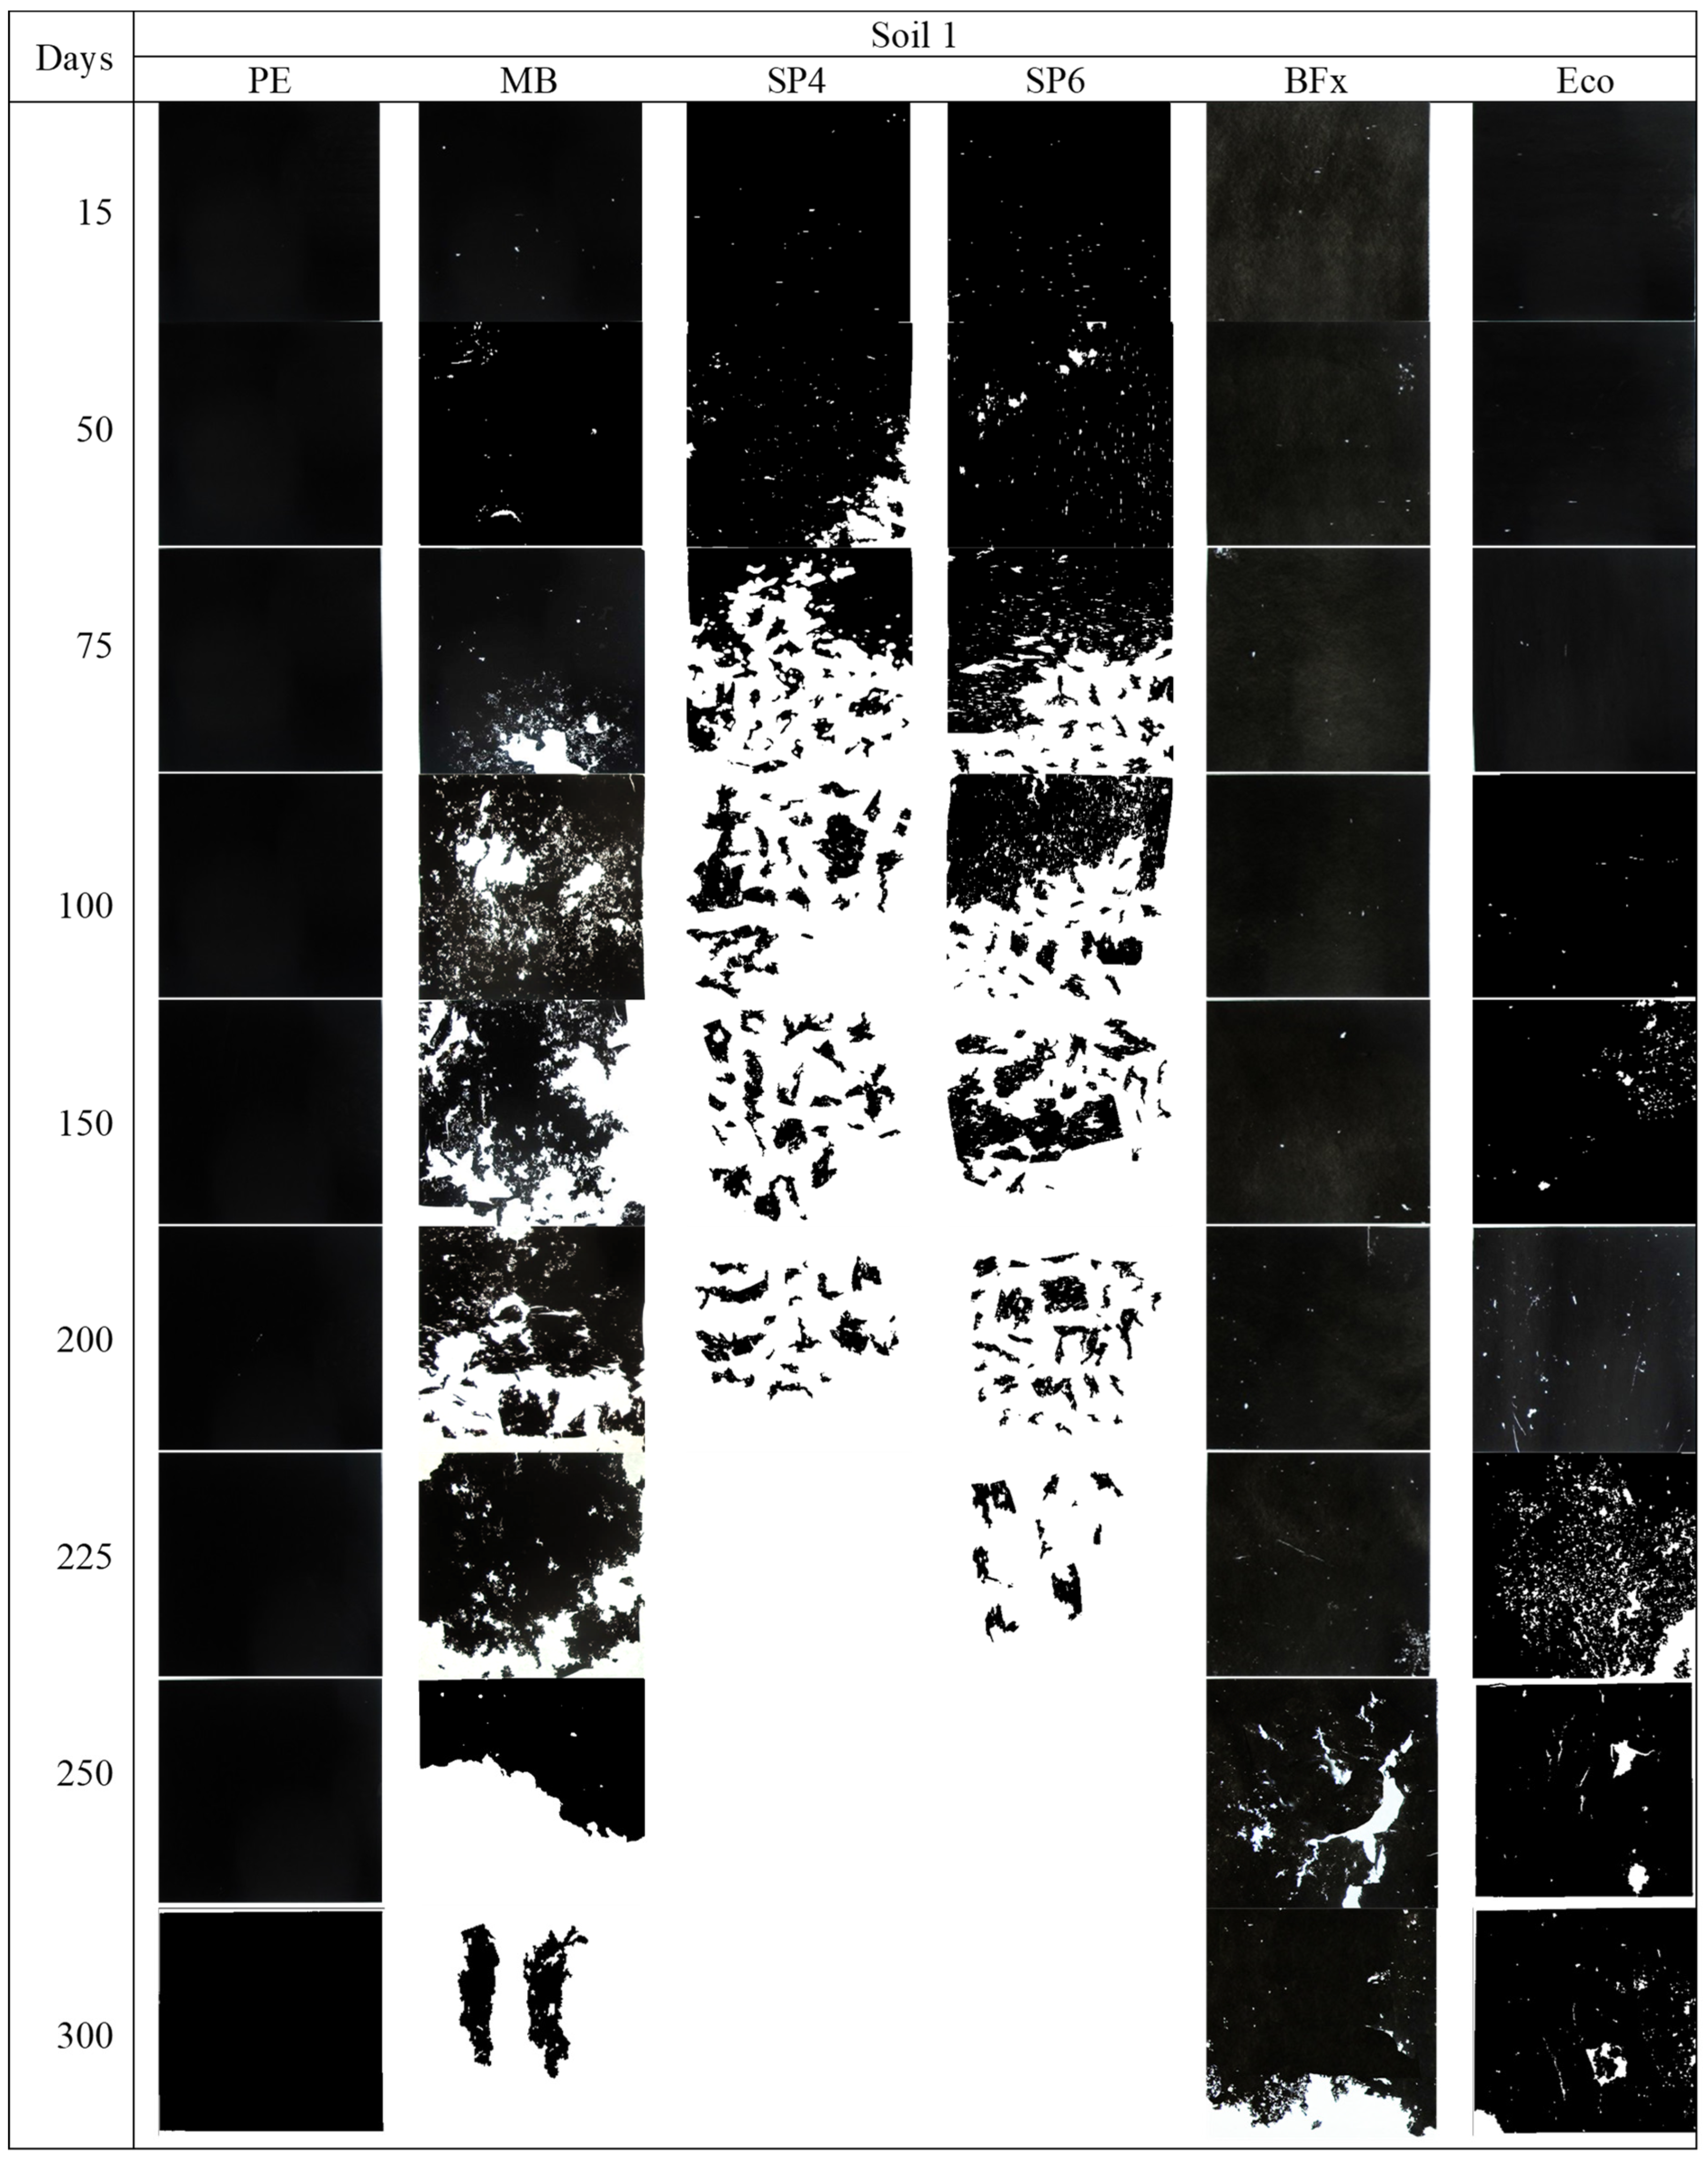
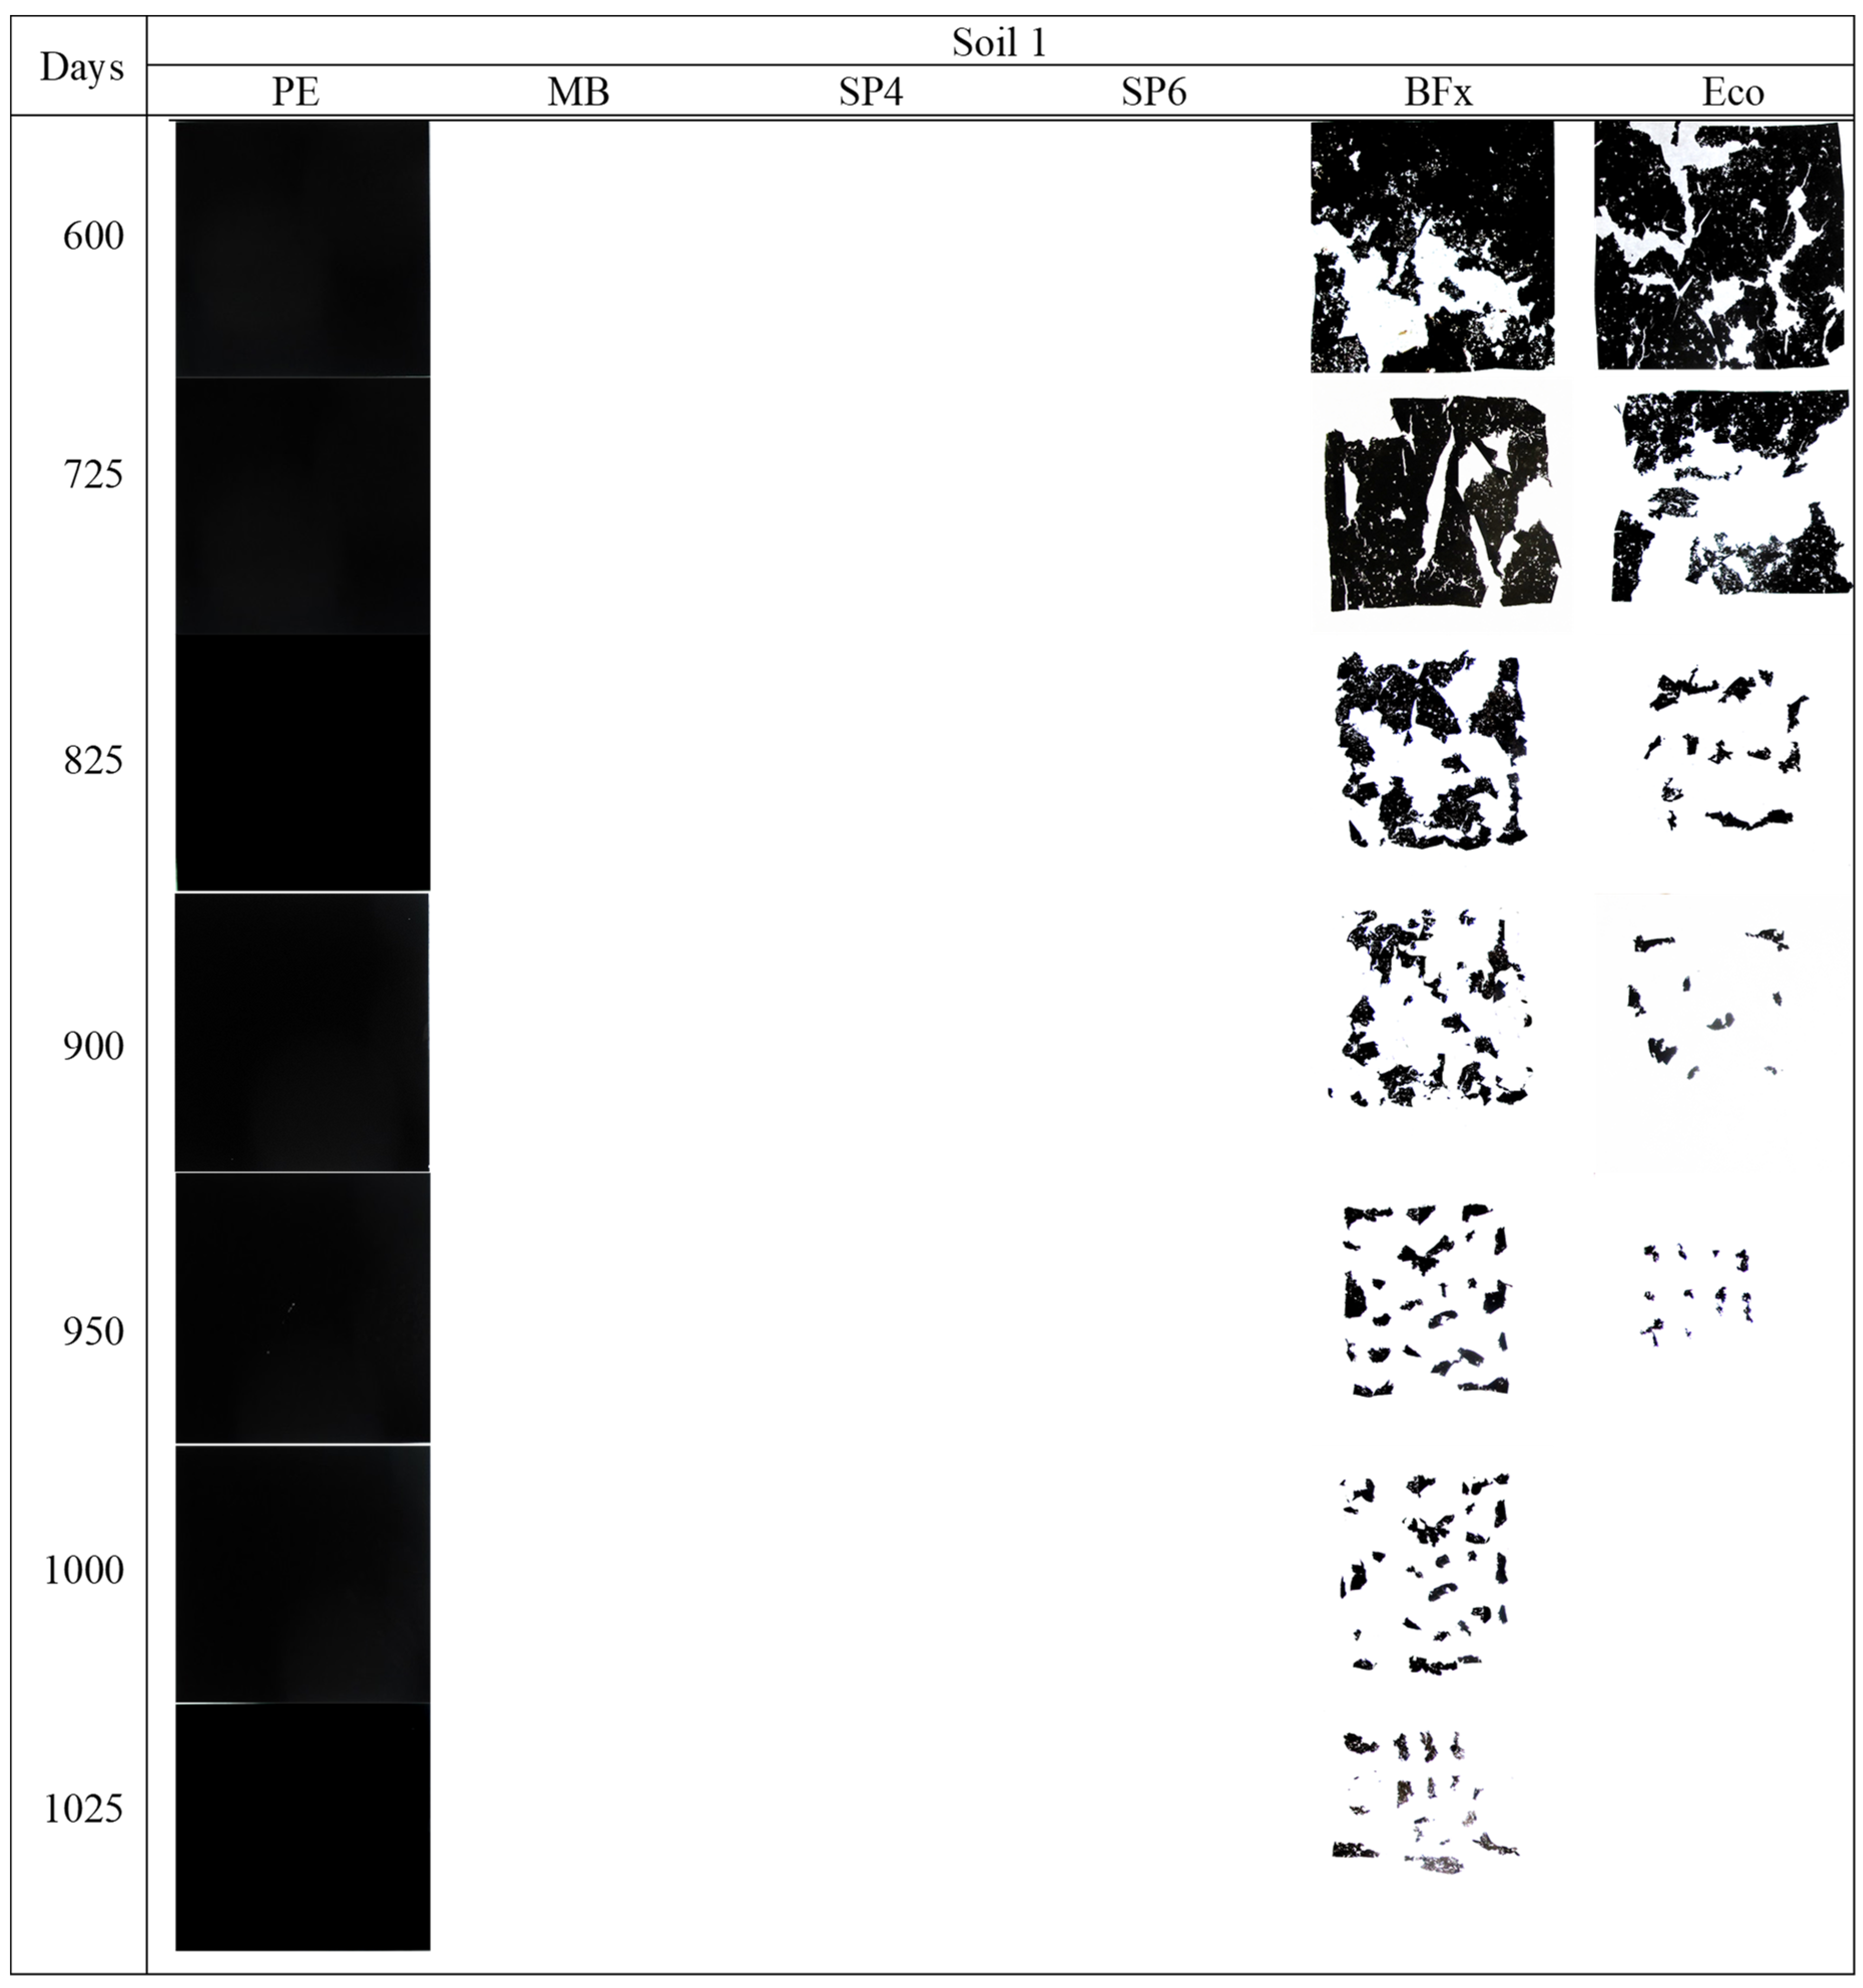
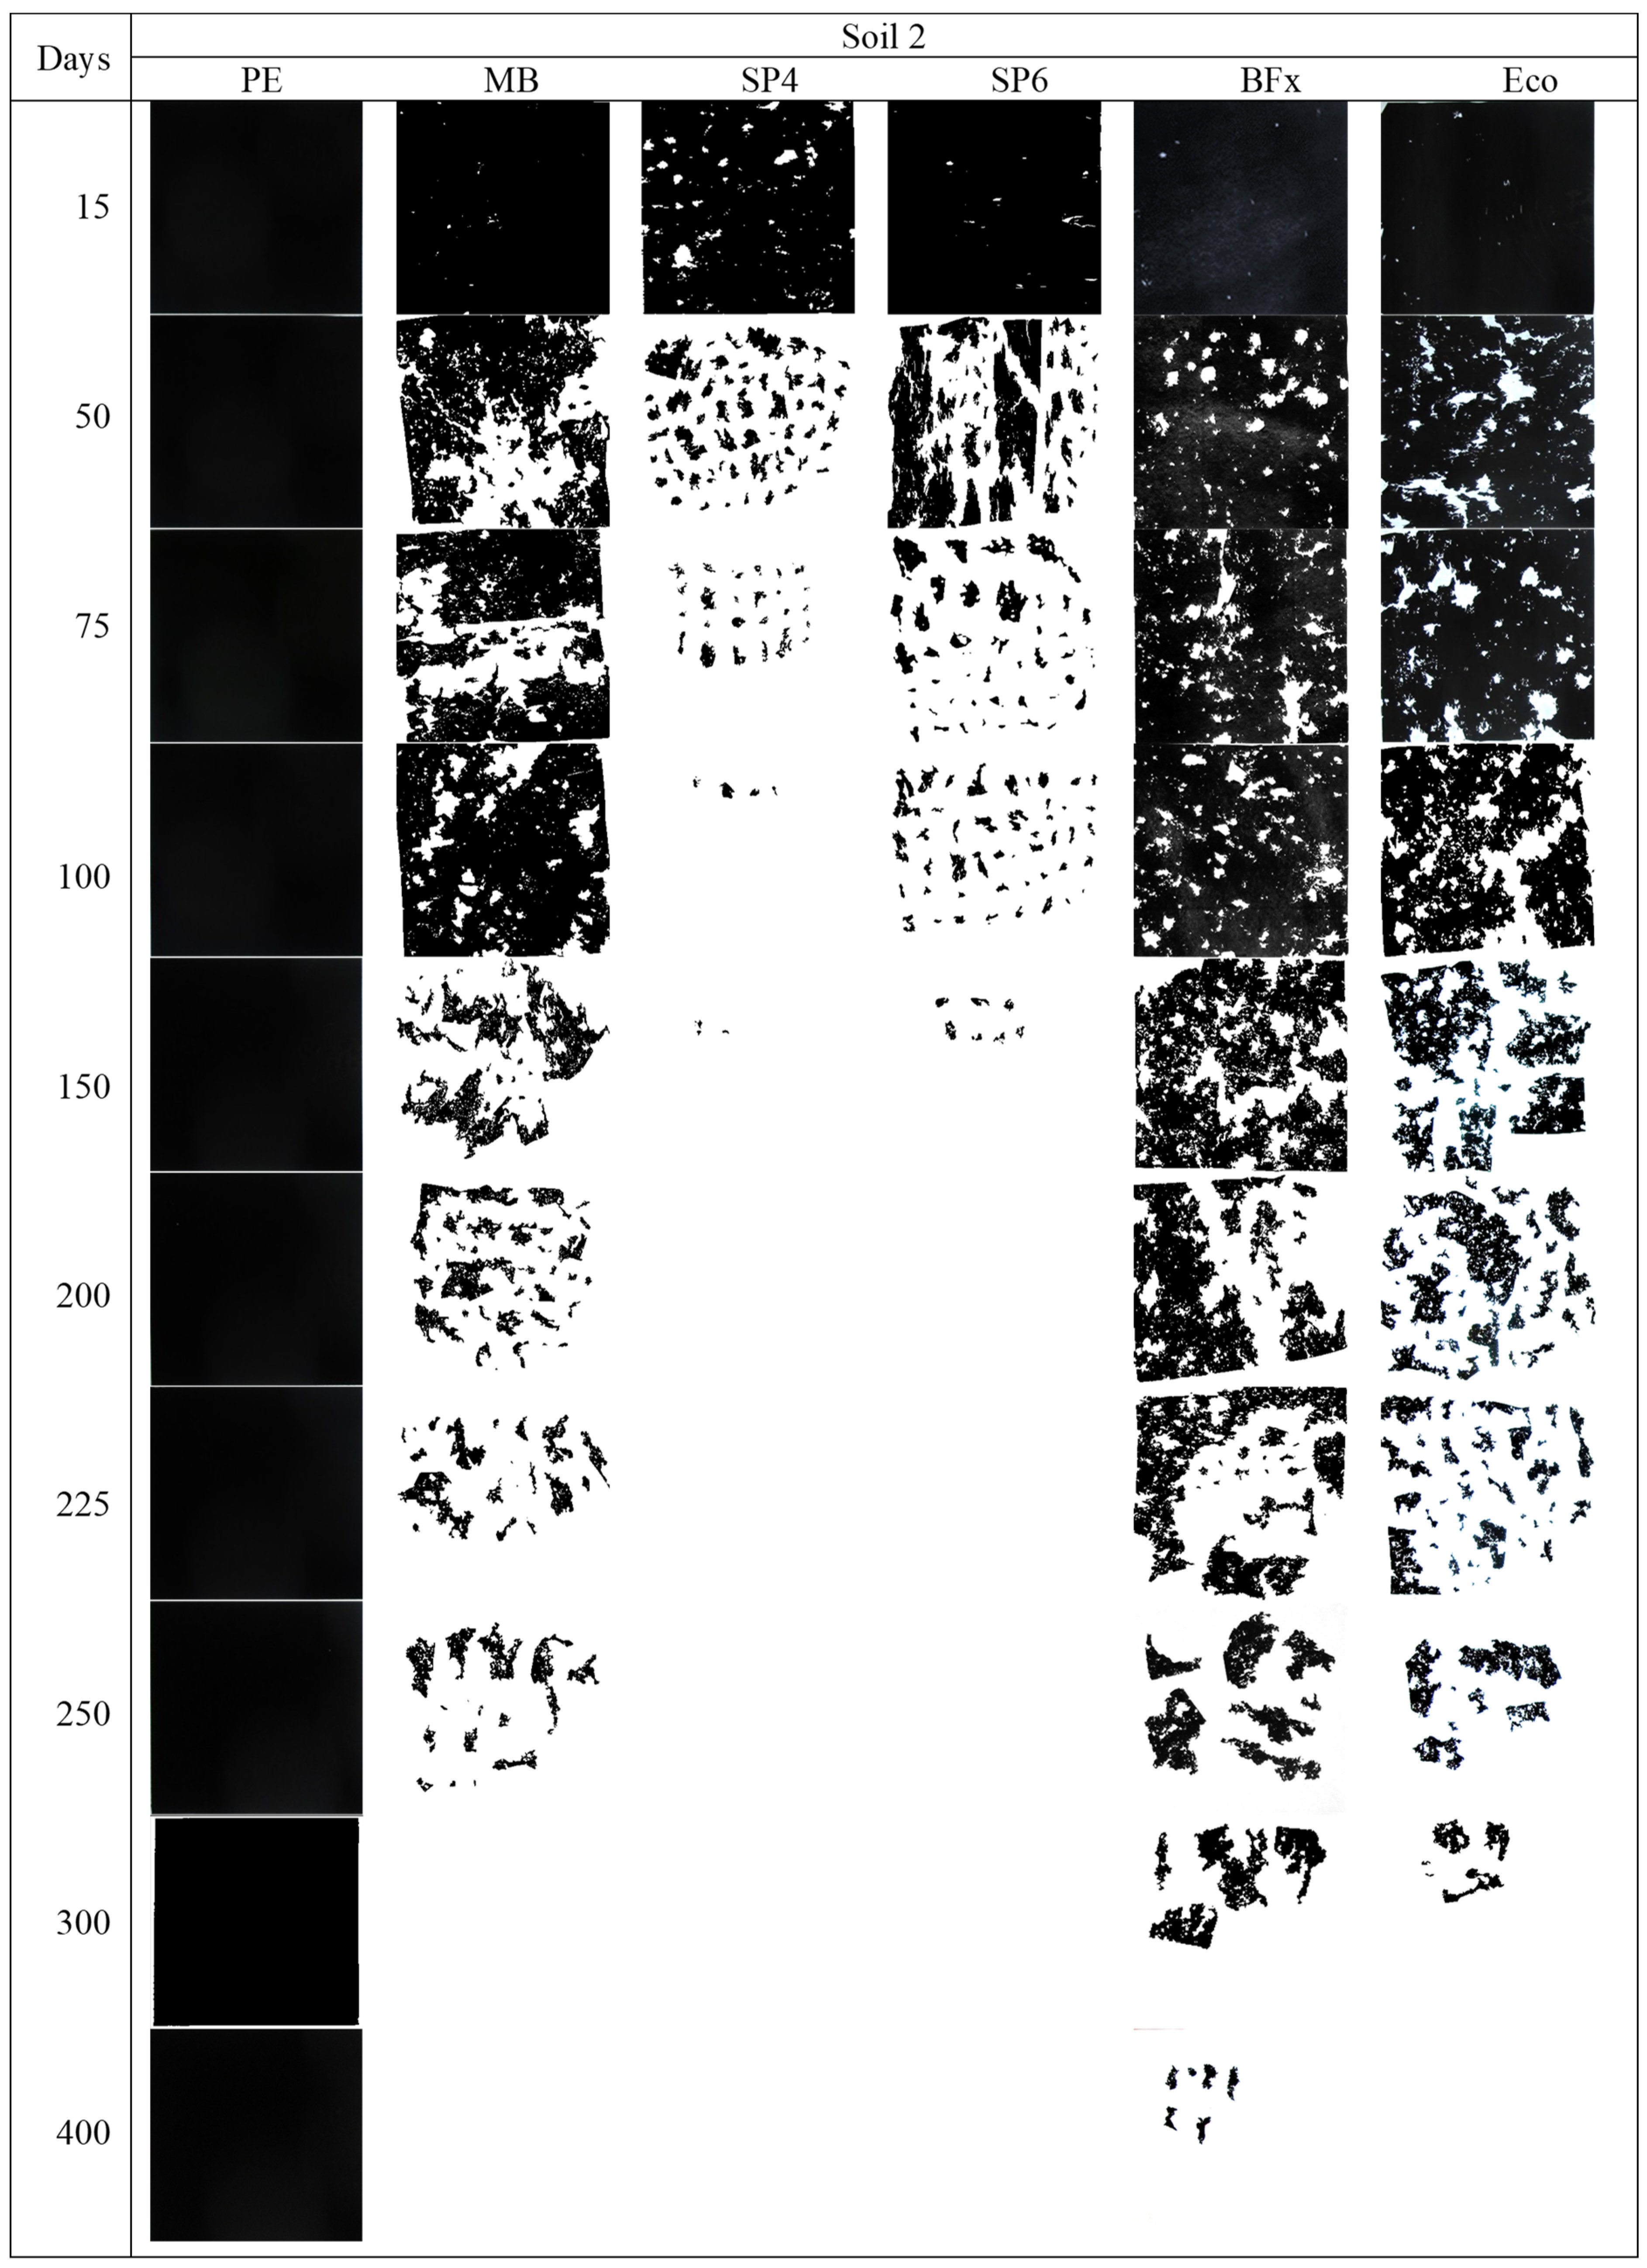
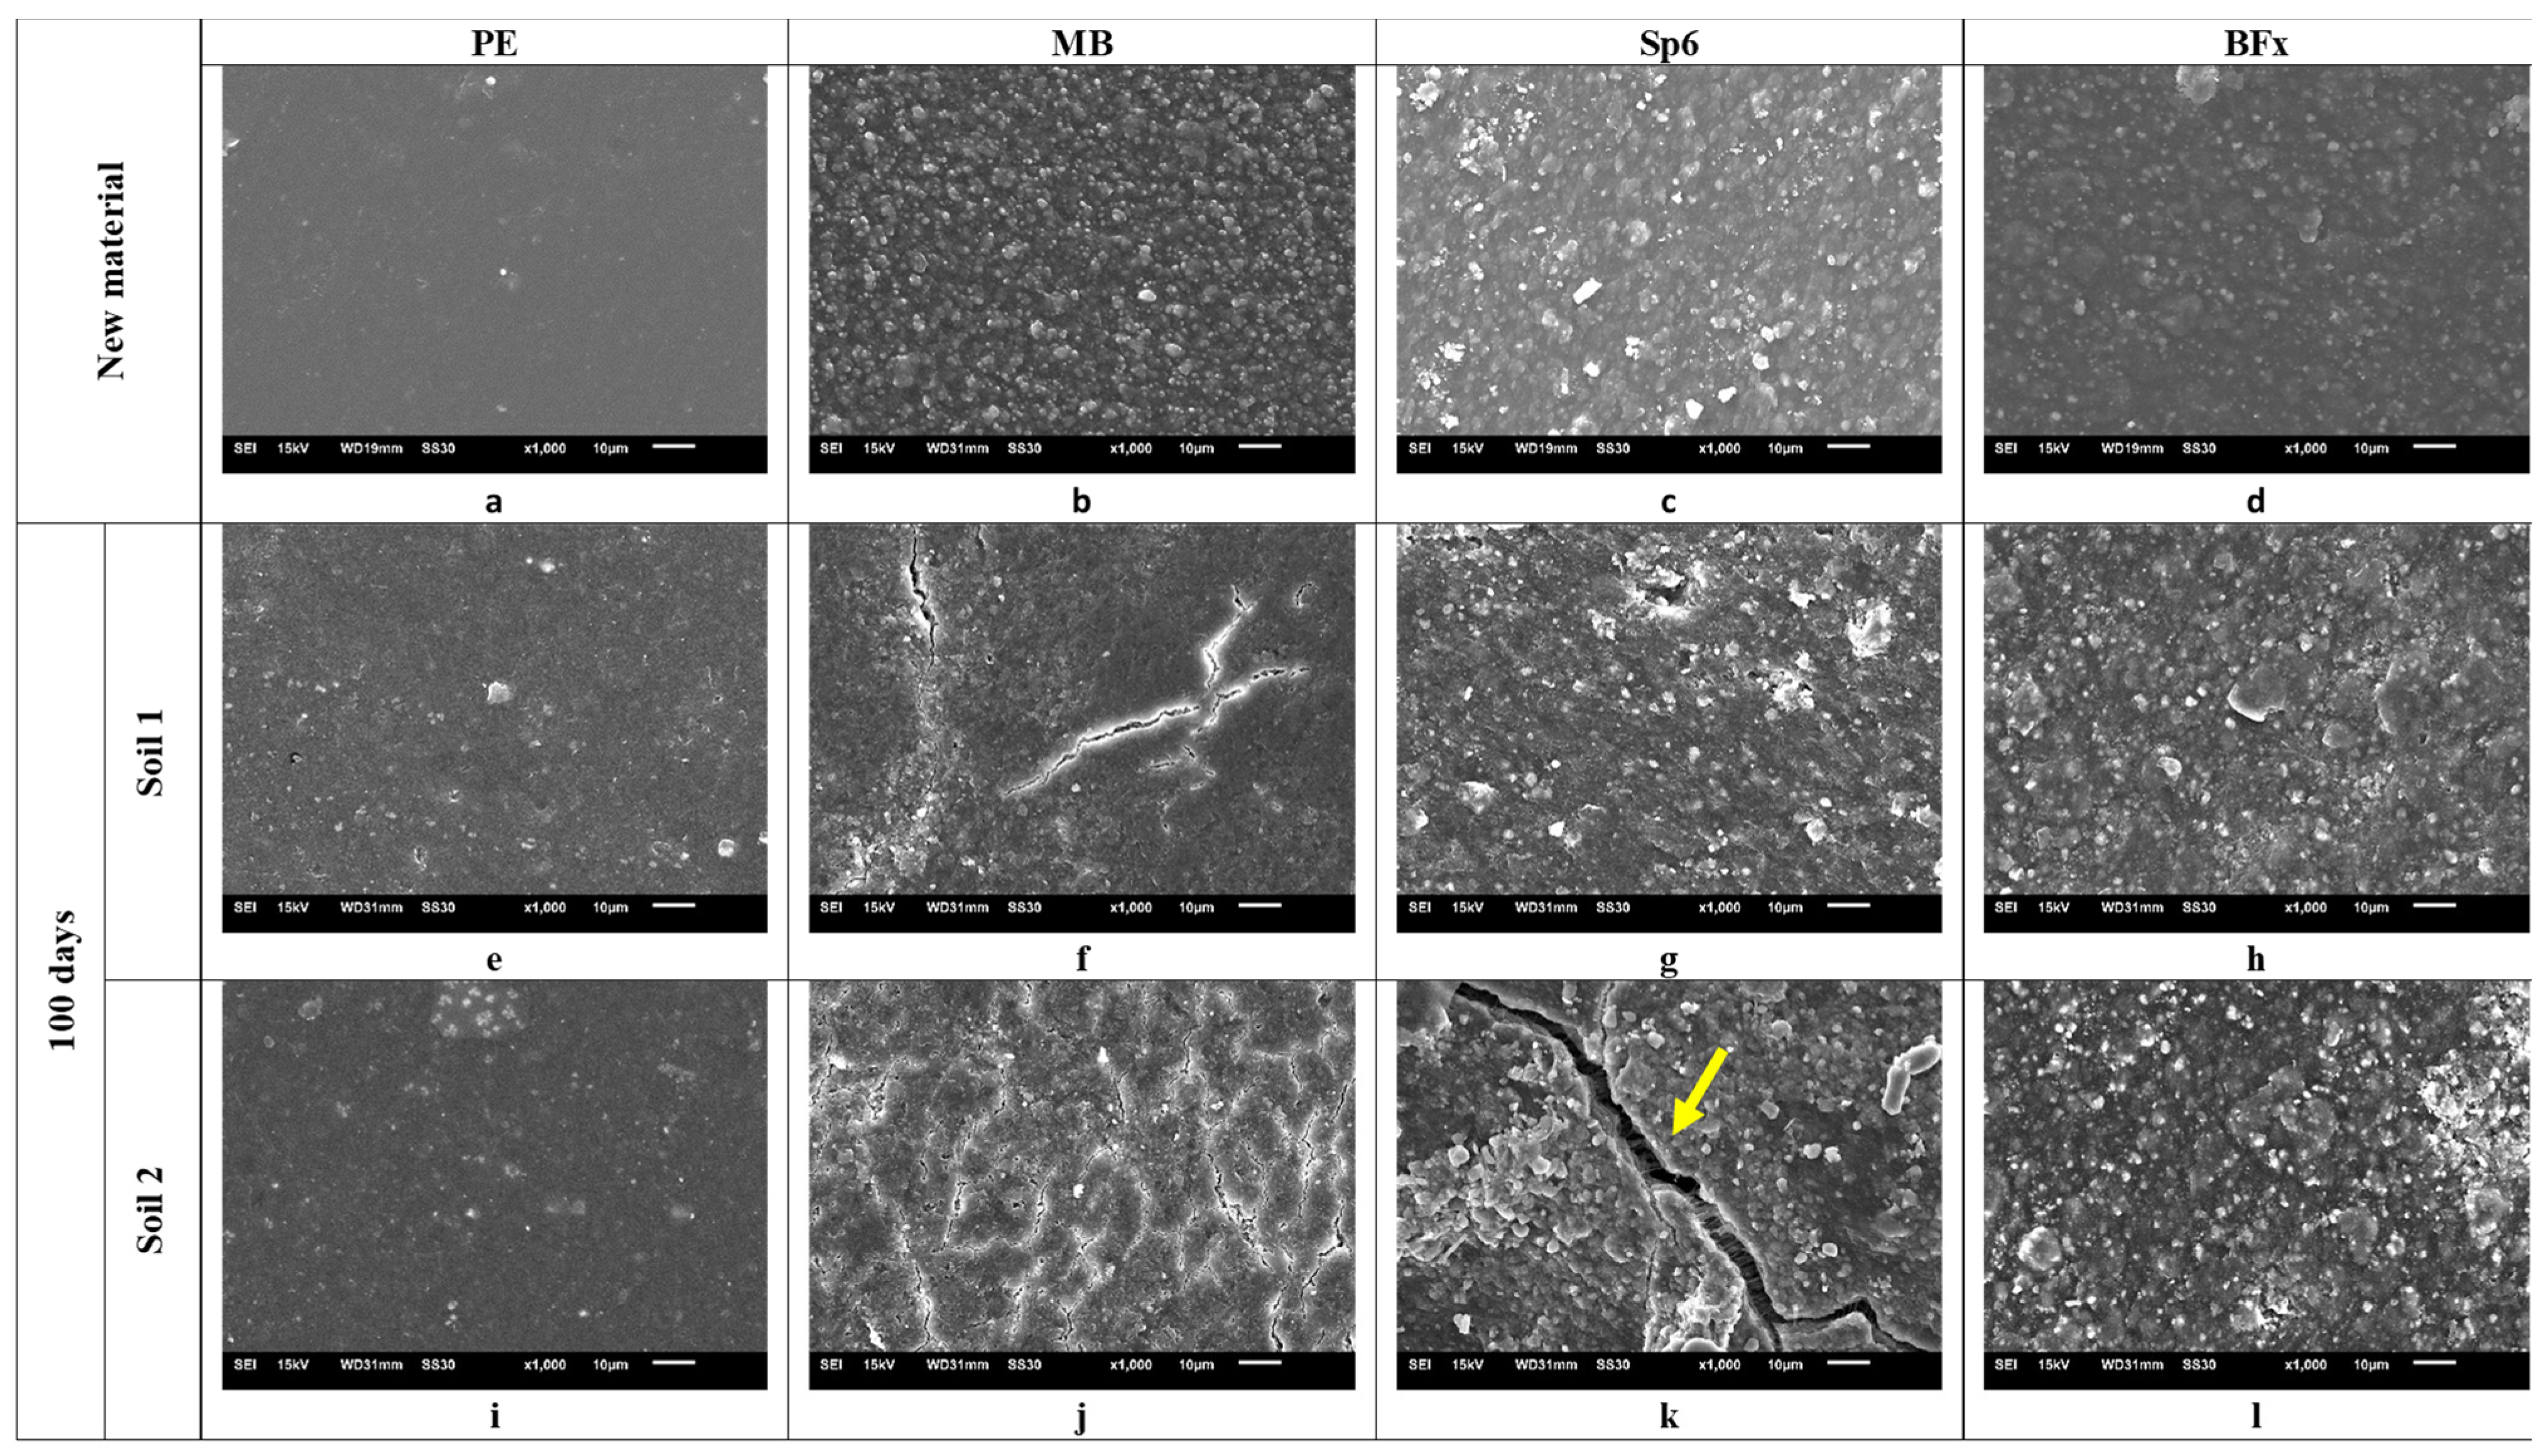
3.2. SEM Microphotographs

Microphotographs of PE, MB, Sp6, and BFx taken by SEM in new materials and after 100 days in Soils 1 and 2 (500 and 1000 magnifications, Figure 4 and Figure 5, respectively) showed that the surface of the new materials was smooth, without cracks or roughness. PE presented a very homogeneous surface due to the uniformity of the mixture of the granules it is made from. The surface of the BD materials revealed a fairly uniform dispersal of the starch particles for MB and Sp6, and of polylactic acid for BFx. These particles are embedded in a continuous matrix made up of the synthetic polymeric component used for the formulation [1]. At 100 days, a greater degree of degradation of the materials (except for PE, which remains intact) was observed, with differences between the two soils clearly visible. Thus, MB in Soil 2 presented a greater number of cracks than in Soil 1, although they were very uniformly distributed across the surface (Figure 4f and Figure 5f). Sp6 in both soils presented larger whitish granules in comparison with new material, which could be caused by the swelling of the starch particles due to the effect of humidity. Likewise, in Soil 1 (Figure 4g), some holes of a similar size to those of the original starch particles can be observed (see arrows on the figure). This finding could be explained by the fact that, when biodegradable mulch films are in contact with the soil, the microorganisms present feed on the original starch particles [33,41]. In Soil 2, a greater roughness was observed, probably due to a higher concentration of starch particles in these areas. It is worth noting the shape of the cracks in this material, in which distortion of the filaments is observed when the material is degrading (Figure 4k and Figure 5k). In BFx there were no clear signs of degradation (no cracks or holes); however, at 100 days, the granules observed in the new material became smaller in Soil 2 than in Soil 1 (Figure 4d,h,l and Figure 5d,h,l).

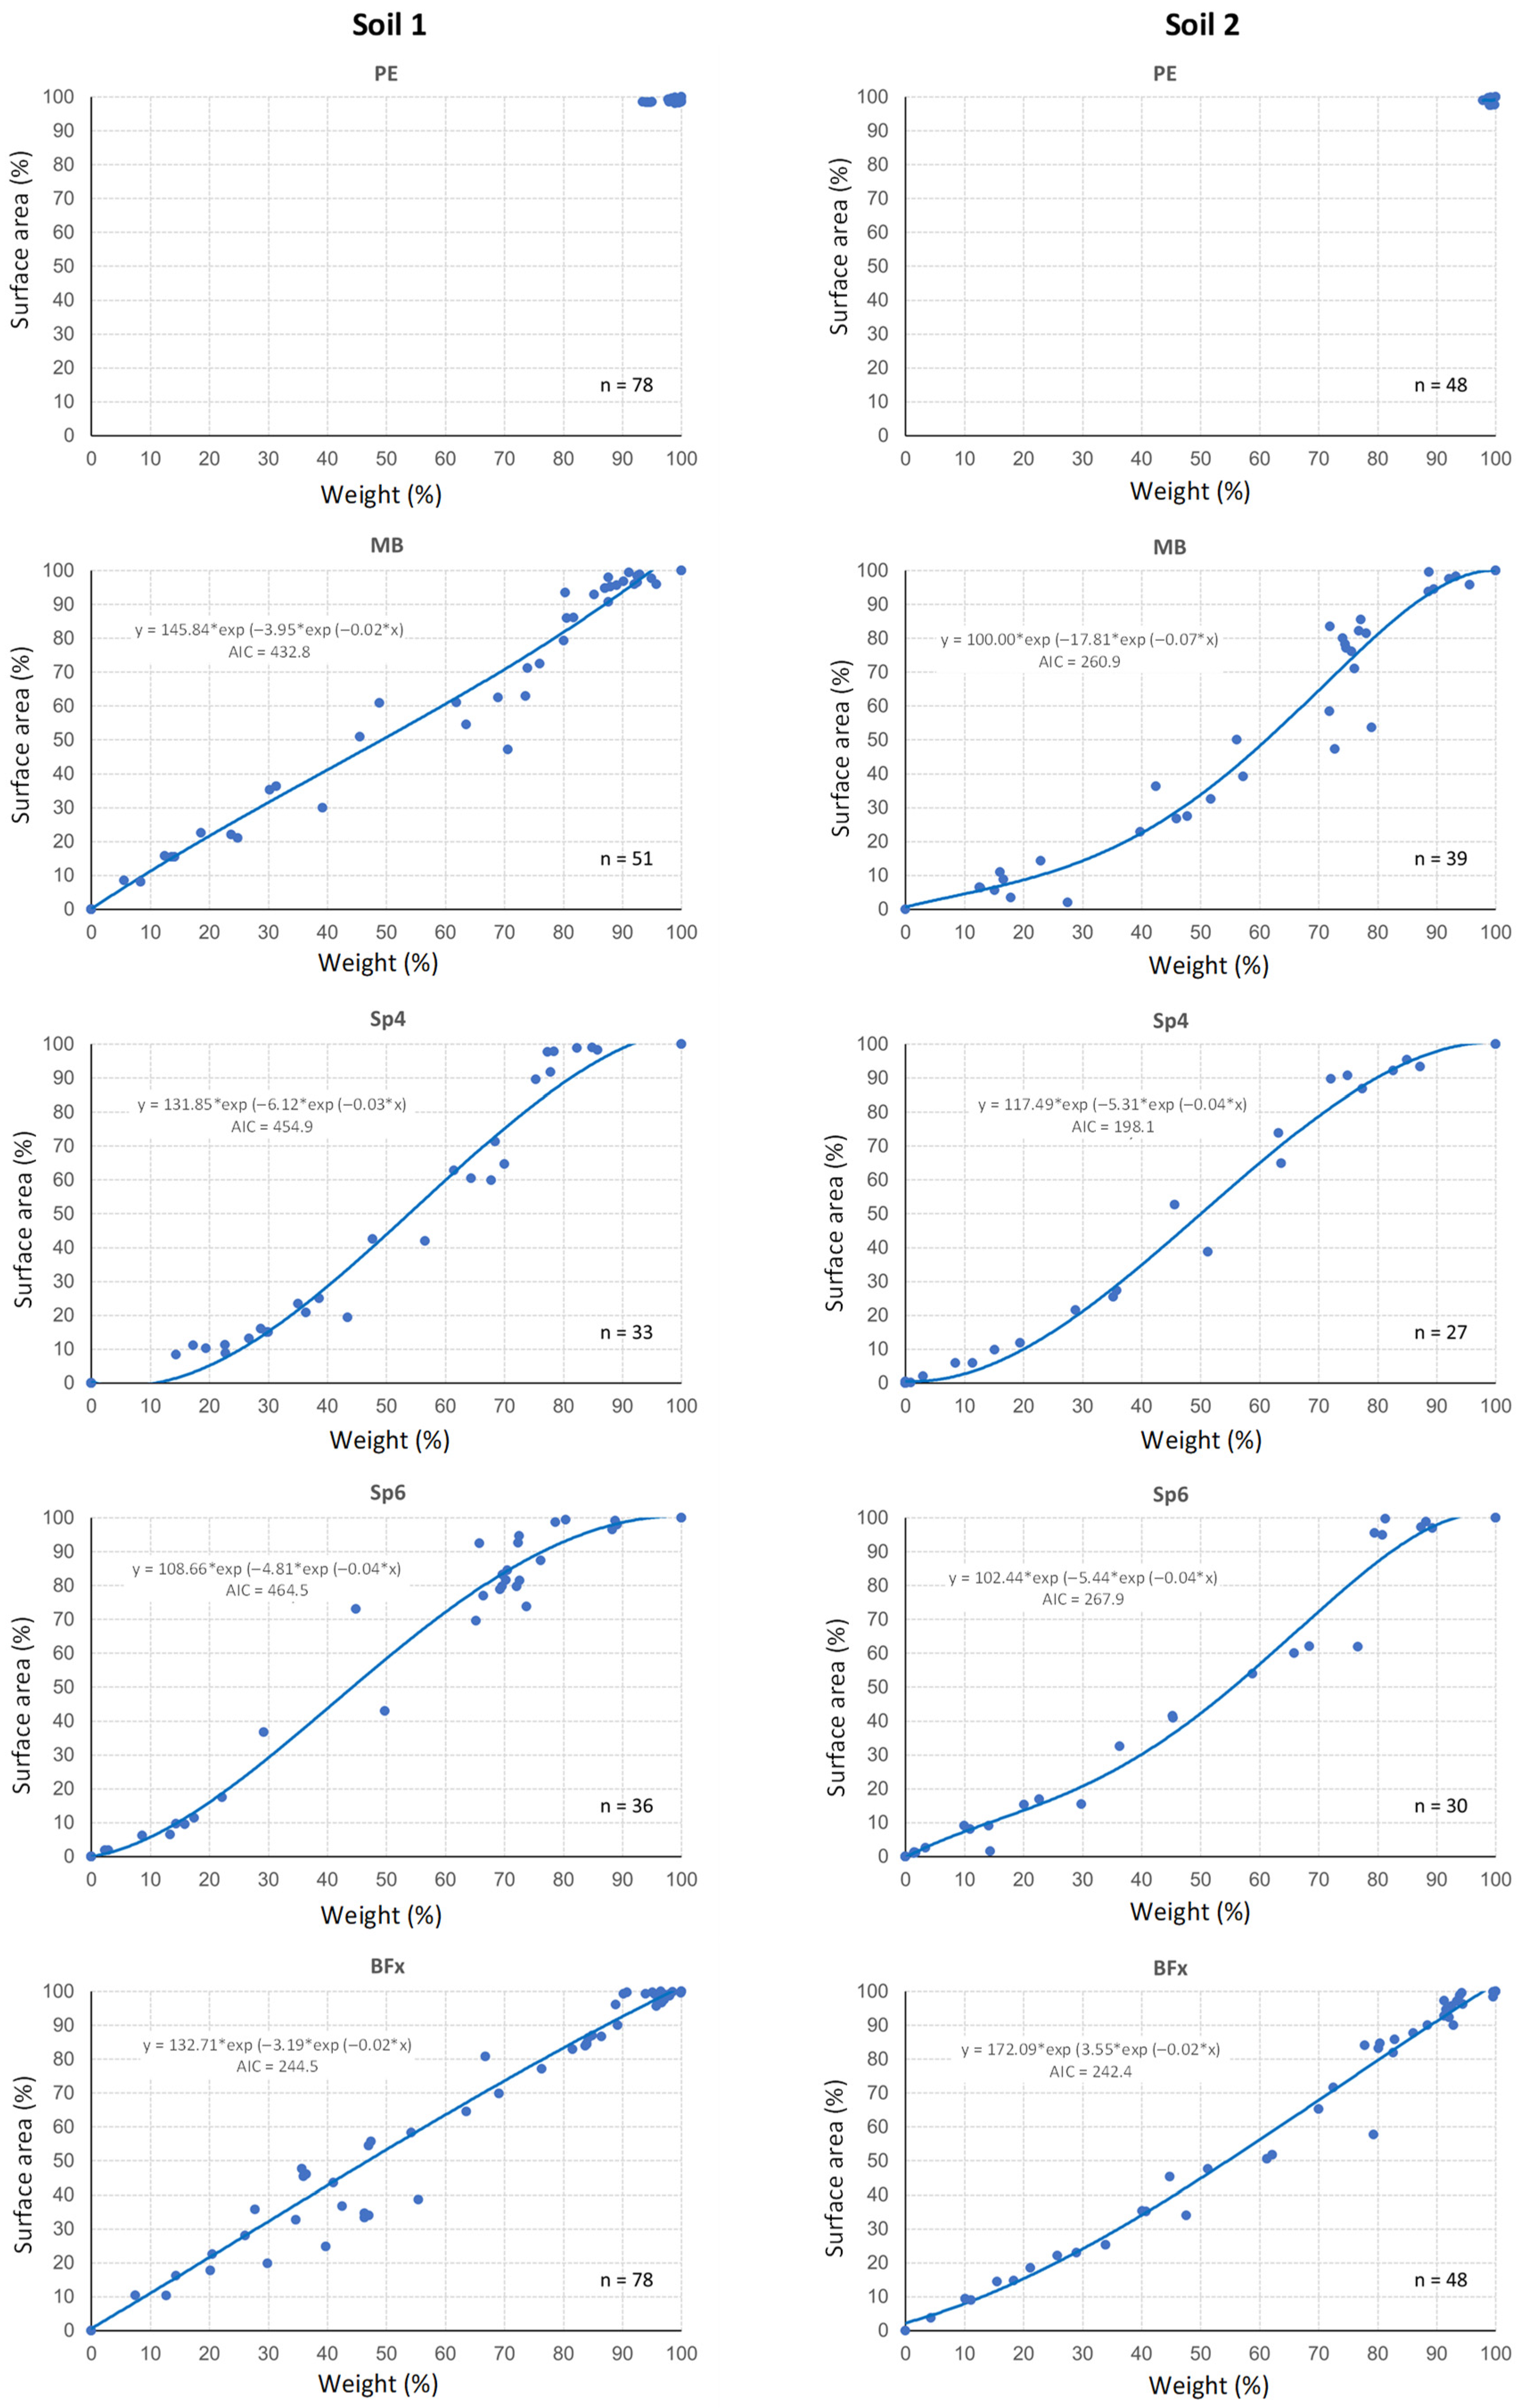
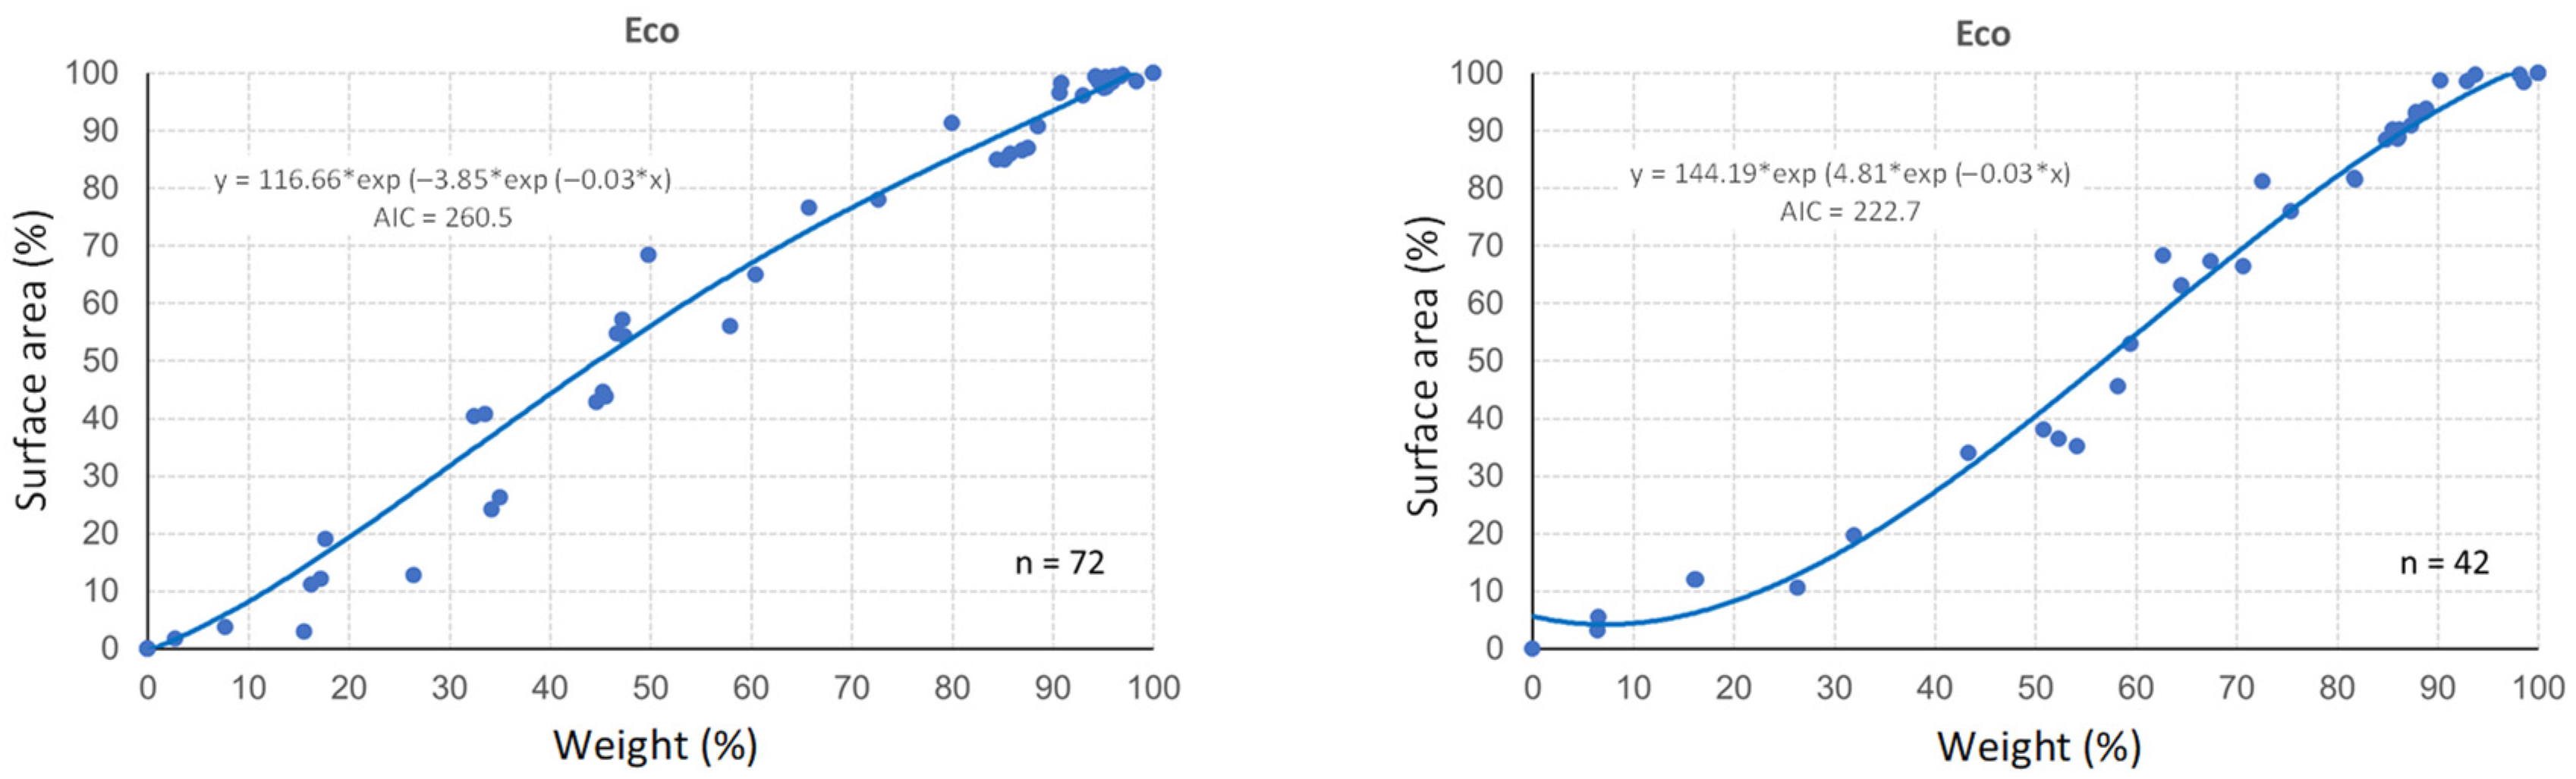
3.3. Surface Area—Weight Ratio

The optimal model that adjusted to the surface area–weight ratio for each BD film in both soils was the Gompertz model with Equation (4):
y = α e β e γ x
where y represents the surface area, x the weight (percentage values) and α, β, γ, the corresponding parameters of the model (see equations for the sigmoid curves in Figure 6). The small plateau of points in the sigmoid curves (on the right side of most of the figures, especially pronounced in Sp4 and Sp6) corresponds to the first stages of degradation. At this stage there was a reduction in the weight of the materials as a result of a decrease in their thickness (refining), but there was as yet no breaking (no cracks or holes), thus keeping their surface areas practically intact. As an example, we can see that the breaking threshold for the surface considered (8 × 8 cm2) would be reached when the weight dropped to 80% in Sp6 in Soil 2 or to 90% in PLA materials in Soil 1. In the case of PE, however, there was only a slight variation in the weight of the samples in both soils, although the surface area remained intact.

3.4. Degradation Models of the Mulch Materials

In constructing the corresponding degradation models of MB, Sp4, Sp6, BFx, and Eco, a sufficient range was considered in the regressor variable (time) to ensure their total practical disappearance in both soils. This time-frame exceeds the length of the crop cycles of the mulched annual vegetable crops. Thus, two time limits were established: 300 days (Sp4, Sp6) and 1000 days (MB, BFx, Eco).
With the data corresponding to the remaining weights and surface areas of each material in each soil, different models were tested, showing their degradation process over time, and those with the lowest AIC were chosen. Thus, exponential models were adopted for Sp4 and Sp6, and Gompertz models for MB, BFx, and Eco.

3.4.1. Sp4 and Sp6: Exponential Model of Degradation

The exponential model satisfies the following condition: the rate of change of the response variable y (weight, surface area) with respect to time t is proportional to y, where b is the constant of proportionality interpreted as the growth rate (decrease) in Equation (5), which solves this model:
y = aebt
The values obtained from the parameters of the exponential model (5), adjusted for the remaining weight and surface area at instant t, corresponding to the different materials and soils, are presented in Table 3.
Both in Sp4 and Sp6, the curves of the exponential degradation models relative to weight and surface area in Soils 1 and 2 were similar to each other (Figure 7): in both materials, the curve relative to Soil 2 always appeared below that corresponding to Soil 1, which shows a faster decrease in weight and surface area over time in Soil 2, as they are curves with a steeper slope (b values more negative in Soil 2, Table 3).
Comparing both materials, the curves related to Sp4 had more negative slopes than those corresponding to Sp6 (Figure 7 and b values in Table 3). This would indicate a higher rate of degradation (more negative) in Sp4 and therefore, an earlier disappearance than Sp6, especially in Soil 1 (Sp4: ≈225 days, Soil 1, ≈150 days, Soil 2; Sp6: ≈250 days, Soil 1, ≈200 days, Soil 2).

3.4.2. MB, BFx, and Eco: Gompertz Model of Degradation

In these materials, the Gompertz Equation (6) of parameters α, β, γ, where this last is considered the (negative) growth rate, satisfactorily modeled the decay of the response variable y (weight, surface area) with respect to time t,
y = α e β e γ x
The values obtained from the parameters of the Gompertz model (6), adjusted for the remaining weight and surface area at instant t, corresponding to the different materials and soils, are shown in Table 4.
As in the exponential case for Sp4 and Sp6, the Gompertz models for the weight and surface area of MB, BFx,h and Eco also showed great similarity to each other, and the degradation curves relative to Soil 2 were always below those corresponding to Soil 1. This indicates that the (negative) growth rate is higher in Soil 2 than in Soil 1 (parameter γ and the slopes of the curves more negative in Soil 2) (Figure 8, Table 4). This is especially noteworthy in Eco, with total disappearance in Soil 2 around 350 days compared with 1000 days in Soil 1.
As expected, in all the materials and soils of both models, the corresponding growth rates (b and γ parameters in the exponential and Gompertz models, respectively) were negative, corroborating the decreasing behavior of these curves. This corresponds logically to the degradation curves in which the variation of the weight and surface area of the materials over time has been modeled. Likewise, in all cases, a faster disappearance of the materials was observed in Soil 2 (clay-loam) than in Soil 1 (sandy-loam), being more pronounced in the films of the second model, especially in Eco, as previously discussed.

4. Conclusions

An important concern with regard to biodegradable (BD) mulch materials used as an alternative to the conventional PE in farms is to deepen the knowledge of their physical degradation process under different environments. In this study, using five BD plastics in laboratory conditions, and two types of soils, it was highlighted that (i) Biodegradable plastics degrade faster (based on weight and surface area loss, and greater disintegration) in soils with a higher clay content; (ii) the degradation of starch-based materials is faster than in those made from polylactic acid, especially those made from potato starch; (iii) the degradation model of potato-starch materials fits a decreasing exponential model in both soils, while corn-starch and polylactic acid mulches fit a decreasing Gompertz model, in all cases with steeper slopes in the soil with a higher clay content; And (iv) degradation curves based on surface area and weight indicate how the same material can degrade differently depending on the soil granulometry. The different behavior of the BD materials depending on both their composition and the type of soil where there are to be used would provide interesting complementary information to field trials to be taken into consideration by both manufacturers and users through accurate and sustainable tools.

Supplementary Materials

The following supporting information can be downloaded at: https://www.mdpi.com/article/10.3390/agriculture12111910/s1, Table S1: Number of fragments of the mulch materials in the different sampling dates. Soil 1; Table S2: Number of fragments of the mulch materials in the different sampling dates. Soil 2.

Author Contributions

Conceptualization, M.M.M. and C.M.; software, C.M., J.V. and P.A.M.-R.; methodology, J.V., C.M., P.A.M.-R. and J.A.L.-P.; formal analysis, J.V., C.M. and S.G.-M.; investigation, M.M.M., C.M. and J.A.L.-P., data curation, J.V., S.G.-M. and P.A.M.-R., writing—original draft, J.V., J.A.L.-P. and C.M., writing—review and editing, J.V., M.M.M. and C.M., funding acquisition, M.M.M. All authors have read and agreed to the published version of the manuscript.

Funding

This research was funded by the National Institute for Agricultural and Food Research and Technology (INIA), Ministry of Economy and Competitiveness (grant number: RTA2011-00104-C04-03), Spain.

Institutional Review Board Statement

Not applicable.

Data Availability Statement

Data will be made available on request.

Conflicts of Interest

The authors declare no conflict of interest.

References

  1. Scarascia-Mugnozza, G.; Schettini, E.; Vox, G.; Malinconico, M.; Immirzi, B.; Pagliara, S. Mechanical properties decay and morphological behaviour of biodegradable films for agricultural mulching in real scale experiment. Polym. Degrad. Stab. 2006, 91, 2801–2808. [Google Scholar] [CrossRef]
  2. Moreno, M.M.; Moreno, A. Effect of different biodegradable and polyethylene mulches on soil properties and production in a tomato crop. Sci. Hortic. 2008, 116, 256–263. [Google Scholar] [CrossRef]
  3. Moreno, M.M.; Cirujeda, A.; Aibar, J.; Moreno, C. Soil thermal and productive responses of biodegradable mulch materials in a processing tomato (Lycopersicon esculentum Mill.) crop. CSIRO Publ. Soil Res. 2016, 54, 207–215. [Google Scholar] [CrossRef]
  4. Nishigaki, T.; Shibata, M.; Sugihara, S.; Mvondo-Ze, A.D.; Araki, S.; Funakawa, S. Effect of mulching with vegetative residues on soil water erosion and water balance in an oxisol cropped by cassava in East Cameroon. Land Degrad. Dev. 2016, 28, 682–690. [Google Scholar] [CrossRef]
  5. Prosdocimi, M.; Tarolli, P.; Cerda, A. Mulching practices for reducing soil water erosion: A review. Earth Sci. Rev. 2016, 161, 191–203. [Google Scholar] [CrossRef]
  6. Haapala, T.; Palonen, P.; Korpela, A.; Ahokas, J. Feasibility of paper mulches in crop production—A review. Agric. Food Sci. 2014, 23, 60–79. [Google Scholar] [CrossRef]
  7. Maisara, A.M.A.; Mariatti, M. Formulation of biodegradable plastics mulch film for agriculture crop protection: A review. Polym. Rev. 2022, 62, 890–918. [Google Scholar]
  8. Kasirajan, S.; Ngouajio, M. Polyethylene and biodegradable mulches for agricultural applications: A review. Agron. Sustain. Dev. 2012, 32, 501–529. [Google Scholar] [CrossRef]
  9. Serrano-Ruiz, H.; Martin-Closas, L.; Pelacho, A.M. Biodegradable plastic mulches: Impact on the agricultural biotic environment. Sci. Total Environ. 2021, 750, 141228. [Google Scholar] [CrossRef]
  10. Bilck, A.P.; Grossmann, M.V.E.; Yamashita, F. Biodegradable mulch films for strawberry production. Polym. Test. 2010, 29, 471–476. [Google Scholar] [CrossRef]
  11. Ghatge, S.; Yang, Y.; Ahn, J.H.; Hur, H.G. Biodegradation of polyethylene: A brief review. Appl. Biol. Chem. 2020, 63, 27. [Google Scholar] [CrossRef]
  12. Duncan, E.M.; Arrowsmith, J.; Bain, C.; Broderick, A.C.; Lee, J.; Metcalfe, K.; Pikesley, S.K.; Snape, R.T.E.; Van Sebille, E.; Godley, B.J. The true depth of the Mediterranean plastic problem: Extreme microplastic pollution on marine turtle nesting beaches in Cyprus. Mar. Pollut. 2018, 136, 334–340. [Google Scholar] [CrossRef] [PubMed]
  13. Gao, H.H.; Yan, C.R.; Liu, Q.; Ding, W.L.; Chen, B.Q.; Li, Z. Effects of plasticmulching and plastic residue on agricultural production: A meta-analysis. Sci. Total Environ. 2019, 651, 484–492. [Google Scholar] [CrossRef] [PubMed]
  14. El-Sherif, D.M.; Eloffy, M.G.; Emesery, A.; Abouzid, M.; Gad, M.; El-Seedi, H.R.; Brinkmann, M.; Wang, K.; Naggar, Y.A. Environmental risk, toxicity, and biodegradation of polyethylene: A review. Environ. Sci. Pollut. Res. 2022, 29, 81166–81182, Epub ahead of print. [Google Scholar] [CrossRef] [PubMed]
  15. Kader, M.A.; Senge, M.; Mojid, M.A.; Ito, K. Recent advances in mulching materials and methods for modifying soil environment. Soil Tillage Res. 2017, 168, 155–166. [Google Scholar] [CrossRef]
  16. Barragán, H.; Pelacho, A.M.; Martín-Closas, L. Degradation of agricultural biodegradable plastics in the soil under laboratory conditions. Soil Res. 2016, 54, 216–224. [Google Scholar] [CrossRef]
  17. ASTM D5988–12; Standard Test Method for Determining Aerobic Biodegradation of Plastic Materials in Soil. ASTM International: West Conshohocken, PA, USA, 2012.
  18. EN 17033; Plastics-Biodegradable Mulch Films for Use in Agriculture and Horticulture-Requirements and Test Methods. European Standard; European Committee for Standardization: Brussels, Belgium, 2018.
  19. Brodhagen, M.; Goldbergerb, J.R.; Hayes, D.G.; Inglis, D.A.; Marsh, T.L.; Miles, C. Policy considerations for limiting unintended residual plastic in agricultural soils. Environ. Sci. Policy 2017, 69, 81–84. [Google Scholar] [CrossRef]
  20. Hayes, D.G.; Anunciado, M.B.; Debruyn, J.M.; Bandopadhyay, S.; Schaeffer, S.; English, M.; Ghimire, S.; Miles, C.; Flury, M.; Sintim, H.Y. Biodegradable plastic mulch films for sustainable specialty crop production. In Polymers for Agri-Food Applications; Gutiérrez, T.J., Ed.; Springer: Cham, Switzerland, 2019; pp. 183–213. [Google Scholar]
  21. Yang, Y.; Li, P.; Jiao, J.; Yang, Z.; Lv, M.; Li, Y.; Zhou, C.; Wang, C.; He, Z.; Liu, Y.; et al. Renewable sourced biodegradable mulches and their environment impact. Sci. Hortic. 2020, 268, 109375. [Google Scholar] [CrossRef]
  22. Manzano, V.; García, N.L.; Rodríguez Ramírez, C.; D’Accorso, N.; Goyanes, S. Mulch plastic systems: Recent advances and applications. In Polymers for Agri-Food Applications; Gutiérrez, T.J., Ed.; Springer: Cham, Switzerland, 2019; pp. 265–290. [Google Scholar]
  23. Merino, V.; Mansilla, A.Y.; Casalongué, C.A.; Alvarez, V.A. Performance of bio-based polymeric agricultural mulch films. In Polymers for Agri-Food Applications; Gutiérrez, T.J., Ed.; Springer: Cham, Switzerland, 2019; pp. 215–240. [Google Scholar]
  24. Moreno, M.M.; Gonzalez-Mora, S.; Villena, J.; Campos, J.A.; Moreno, C. Deterioration pattern of six biodegradable, potentially low-environmental impact mulches in field conditions. J. Environ. Manag. 2017, 200, 490–501. [Google Scholar] [CrossRef]
  25. Quiao, R.; Wang, X.; Qin, G.; Liu, Q.; Liu, J.; He, W. Preparation of organic crystal seed and its application in improving the functional period of biodegradable agricultural film. Crystals 2021, 11, 826. [Google Scholar] [CrossRef]
  26. Quiao, R.; Zhao, C.-P.; Liu, J.-L.; Zhang, M.-L.; He, W.-Q. Synthesis of novel ultraviolet absorbers and preparation and field application of anti-iltraviolet aging PBAT/UVA films. Polymers 2022, 14, 1434. [Google Scholar] [CrossRef] [PubMed]
  27. Casida, L.E.; Klein, D.A.; Santoro, T. Soil dehydrogenase activity. Soil Sci. 1964, 98, 371–376. [Google Scholar] [CrossRef]
  28. Casida, L.E. Microbial metabolic activity in soil as measured by dehydrogenase determinations. Appl. Environ. Microbiol. 1977, 34, 630–636. [Google Scholar] [CrossRef] [PubMed]
  29. Barajas, M. Ensayos de metabolismo microbiano en suelo: Actividad deshidrogenasa y tasa de mineralización del nitrógeno. In Ensayos Toxicológicos Para la Evaluación de Sustancias Químicas en Agua y Suelo: La Experiencia en México; Ramírez, P., Mendoza, A., Eds.; Instituto Nacional de Ecología: Mexico City, Mexico, 2008. [Google Scholar]
  30. Montejo, M.; Torres, C.P.; Martínez, A.; Tenorio, J.A.; Cruz, M.R.; Ramos, F.R.; Cuevas, M.C. Técnicas para el análisis de actividad enzimática en suelos. In Métodos Ecotoxicológicos Para la Evaluación de Suelos Contaminados con Hidrocarburos; Cuevas, M.C., Espinosa, G., Ilizaliturri, C., Mendoza, A., Eds.; INECC: Mexico City, Mexico, 2012. [Google Scholar]
  31. Jarrell, W.M.; Armstrong, D.E.; Grigal, D.F.; Kelly, E.F.; Monger, H.C.; Wedin, D.A. Calculating gravimetric water content and water holding capacity. In Standard Soil Methods for Long-Term Ecological Research; Robertson, G.P., Coleman, D.C., Bledsoe, C.S., Sollins, P., Eds.; Soil Methods; Oxford University Press: Oxford, UK, 1999; pp. 55–73. [Google Scholar]
  32. Akaike, H. A new look at the statistical model identification. IEEE Trans. Automat. Control 1974, 19, 716–723. [Google Scholar] [CrossRef]
  33. Griffin-LaHue, D.; Ghimire, S.; Yu, Y.; Scheenstra, E.J.; Miles, C.A.; Flury, M. In-field degradation of soil-biodegradable plastic mulch films in a Mediterranean climate. Sci. Total Environ. 2022, 806, 150238. [Google Scholar] [CrossRef]
  34. Borrowman, C.K.; Johnston, P.; Adhikari, R.; Saito, K.; Patti, A.F. Environmental degradation and efficacy of a sprayable, biodegradable polymeric mulch. Polym. Degrad. Stab. 2020, 175, 109126. [Google Scholar] [CrossRef]
  35. Vázquez, A.; Foresty, M.L.; Cyras, V. Production, chemistry and degradation of starch-bases polymers. In Biopolymers—New Materials for Sustainable Films and Coatings; Plackett, D., Ed.; John Wiley & Sons Ltd.: Hoboken, NJ, USA, 2011; pp. 277–299. [Google Scholar]
  36. Mostafa, H.; Sourell, H.; Bockisch, F. Mechanical properties of some bioplastics under different soil types used as biodegradable drip tubes. Agric. Eng. Int. CIGR J. 2010, 12, 12–21. [Google Scholar]
  37. Rudnik, E.; Briassoulis, D. Comparative biodegradation in soil behaviour of two biodegradable polymers based on renewable resources. J. Polym. Environ. 2011, 19, 18–39. [Google Scholar] [CrossRef]
  38. Ho, K.L.G.; Pometto, A.L. Temperature effects on soil mineralization of polylactic adic platic in laboratory respirometers. J. Environ. Polym. Degrad. 1999, 7, 101–108. [Google Scholar] [CrossRef]
  39. Ho, K.L.G.; Pometto, A.L.; Hinz, P.N. Effects of temperature and relative humidity on polylactic acid plastic degradation. J. Environ. Polym. Degrad. 1999, 7, 83–92. [Google Scholar] [CrossRef]
  40. Liu, Q.; Wang, Y.; Liu, J.; Liu, X.; Dong, Y.; Huang, X.; Zhen, Z.; Lv, J.; He, W. Degradability and properties of PBAT-based biodegradable mulch films in field and their effects on cotton planting. Polymers 2022, 14, 3157. [Google Scholar] [CrossRef] [PubMed]
  41. Liu, M.; Huang, Z.; Yang, Y. Analysis of biodegradability of three biodegradable mulching films. J. Polym. Environ. 2010, 18, 148–154. [Google Scholar] [CrossRef]
Figure 1. Variation of the weight (a,c) and surface area (b,d) of the mulch materials in Soils 1 and 2. Data expressed as percentages of the initial values. Vertical bars at each date represent the least significant difference (LSD) at a significance level of 0.05 among treatment means.
Agriculture 12 01910 g001
Figure 2. Evolution of the mulch materials in Soil 1 (reference area of 8 × 8 cm2). Photographs correspond to one of the three replications.
Agriculture 12 01910 g002aAgriculture 12 01910 g002b
Figure 3. Evolution of the mulch materials in Soil 2 (reference area of 8 × 8 cm2). Photographs corresponding to one of the three replications.
Agriculture 12 01910 g003
Figure 4. SEM micrographs corresponding to PE, MB, Sp6, and BFx in new materials and after 100 days in Soils 1 and 2 (500× magnification). The yellow arrows point out different cracks, holes or granules in the materials.
Agriculture 12 01910 g004
Figure 5. SEM micrographs corresponding to PE, MB, Sp6, and BFx in new materials and after 100 days in Soils 1 and 2 (1000× magnification). The yellow arrows point out different cracks, holes or granules in the materials.
Agriculture 12 01910 g005
Figure 6. Surface area–weight ratio of the different mulch materials in Soils 1 and 2. Data expressed as percentages of the initial values.
Agriculture 12 01910 g006aAgriculture 12 01910 g006b
Figure 7. Degradation curves relative to weight and surface area variation of Sp4 and Sp6 in Soils 1 (blue) and 2 (yellow). Exponential model (300 days).
Agriculture 12 01910 g007
Figure 8. Degradation curves relative to weight and surface area variation of MB, BFx, and Eco in Soils 1 (blue) and 2 (yellow). Gompertz model (1000 days).
Agriculture 12 01910 g008
Table 1. Main characteristics of the mulch materials tested.
Mulch MaterialCompositionManufacturer
Mater-Bi® (MB)Corn thermoplastic starch, PBAT, vegetable oilsNovamont S.p.A., Italy
Sphere 4 (Sp4), Sphere 6 (Sp6)Potato thermoplastic starch and biodegradable recycled polymers bioplastic (with a different proportion of its components)Sphere Group Spain S.L., Spain
Bioflex® (BFx)PLA, PBSFkur-Oerlemans Plastics, Germany
Ecovio® (Eco)PLA, ecoflex (PBAT)BASF, Germany
Polyethylene (PE)Conventional standard linear low density polyethyleneSiberline, Spain
Table 2. Physical–chemical properties of soils.
Soil ParameterSoil 1Soil 2
entry 1datadata
Sand (2–0.05 mm) (%)55.245.0
Silt (0.05–0.002 mm) (%)36.026.0
Clay (<0.002 mm) (%)8.829.0
Soil textural class (USDA)Sandy loamClay loam
Wilting point (m3 m−3)0.1000.160
Field capacity (m3 m−3)0.2300.350
pH (1:2.5 soil:water)8.28.0
EC (1:5 soil:water) (dS m−1)0.760.65
Organic matter (Walkley-Black) (%)1.61.7
Total carbonates (%)6.07.5
Total nitrogen (%)0.090.08
C/N ratio7.99.5
Assimilable phosphorus concentration (g kg−1)0.0170.020
Exchangeable potassium concentration (g kg−1)0.3510.409
Exchangeable calcium concentration (g kg−1)2.3242.480
Exchangeable magnesium concentration (g kg−1)0.2160.254
Exchangeable sodium concentration (g kg−1)0.0080.006
Table 3. Coefficients of the exponential model * of degradation corresponding to the remaining weight and surface area of Sp4 and Sp6 mulch materials (300 days, complete degradation in both soils).
MaterialSoil 1Soil 2
abAICabAIC
Weight (g)Sp40.135−0.020−179.90.140−0.035−129.4
Sp60.140−0.015−471.80.150−0.020−488.0
Surface area (cm2)Sp466.30−0.018217.564.10−0.028186.1
Sp668.01−0.015272.566.23−0.020279.9
* y = aebt. AIC: Akaike Information Criterion. y: remaining weight/surface area.
Table 4. Coefficients of the Gompertz model * of degradation corresponding to the remaining weight and surface area of MB, BFx and Eco mulch materials (1.000 days, complete degradation in both soils).
MaterialSoil 1Soil 2
αβγAICαβ
Weight (g)MB0.1200.060-0.008-465.00.1600.300
BFx0.1100.010-0.007-363.00.1100.070
Eco0.1300.010-0.006-360.90.1300.010
Surface area (cm2)MB75.000.170-0.007411.9100.00.43
BFx67.300.010-0.007253.270.700.080
Eco64.000.010-0.007194.969.900.080
* y = α e β e γ t . AIC: Akaike Information Criterion. y: remaining weight/surface area.
Publisher’s Note: MDPI stays neutral with regard to jurisdictional claims in published maps and institutional affiliations.

