Article

Associations of Automatically Recorded Body Condition Scores with Measures of Production, Health, and Reproduction

by
Ramūnas Antanaitis
1,*,
Dovilė Malašauskienė
1,
Mindaugas Televičius
1,
Mingaudas Urbutis
1,
Arūnas Rutkauskas
1,
Greta Šertvytytė
1,
Lina Anskienė
2 and
Walter Baumgartner
3
1
Large Animal Clinic, Veterinary Academy, Lithuanian University of Health Sciences, Tilžės Str. 18, LT-47181 Kaunas, Lithuania
2
Department of Animal Breeding, Veterinary Academy, Lithuanian University of Health Sciences, Tilžės Str. 18, LT-47181 Kaunas, Lithuania
3
University Clinic for Ruminants, University of Veterinary Medicine, Veterinaerplatz 1, A-1210 Vienna, Austria
*
Author to whom correspondence should be addressed.
Agriculture 2022, 12(11), 1834; https://doi.org/10.3390/agriculture12111834
Submission received: 22 August 2022 / Revised: 13 September 2022 / Accepted: 31 October 2022 / Published: 2 November 2022
(This article belongs to the Special Issue Digital Innovations in Agriculture)

Abstract

:
In the present study, we hypothesize that an automated body condition scoring system could be an indicator of health and pregnancy success in cows. Therefore, the objective of this study is to determine the relationship of the automated registered body condition score (BCS) with pregnancy and inline biomarkers such as milk beta-hydroxybutyrate (BHB), milk lactate dehydrogenase (LDH), milk progesterone (mP4), and milk yield (MY) in dairy cows. Indicators from Herd NavigatorTM were grouped into classes based on their arithmetic means. Values were divided into various classes: MY: ≤31 kg/day (first class—67.3% of cows) and >31 kg/day (second class—32.7%); BHB in milk: ≤0.06 mmol/L (first class—80.7% of cows) and >0.06 mmol/L (second class—16.9%); milk LDH activity: ≤27 µmol/min (first class—69.5% of cows) and >27 µmol/min (second class—30.5%); milk progesterone value: ≤15.5 ng/mL (first class—28.8% of cows) and >15.5 ng/mL (second class—71.2%); and BCS: 2.5–3.0 (first class—21.4% of cows), >3.0–3.5 (second class—50.8%), and >3.5–4.0 (third class—27.8%). According to parity, the cows were divided into two groups: 1 lactation (first group—38.9%) and ≥2 lactations (second group—61.1%). Based on our investigated parameters, BCS is associated with pregnancy success because the BCS (+0.29 score) and mP4 (10.93 ng/mL) of the pregnant cows were higher compared to the group of non-pregnant cows. The MY (−5.26 kg, p < 0.001) and LDH (3.45 µmol/min) values were lower compared to those in the group of non-pregnant cows (p < 0.01). Statistically significant associations of BCS and mP4 with the number of inseminations were detected. The number of inseminations among cows with the highest BCS of >3.5–4.0 was 42.41% higher than that among cows with the lowest BCS of 2.5–3.0 (p < 0.001). BCS can also be a health indicator. We found that the LDH content was greatest among cows with the highest BCS of >3.5–4.0; this value was 6.48% higher than that in cows with a BCS of >3.0–3.5 (p < 0.01). The highest MY was detected in cows with the lowest BCS of 2.5–3.0, which was 29.55% higher than that in cows with the highest BCS of >3.5–4.0 (p < 0.001). BCS was the highest in the group of cows with mastitis (4.96% higher compared to the group of healthy cows), while the highest statistically significant mean differences in body condition score (9.04%) were estimated between the mastitis and metritis groups of cows (p < 0.001).

1. Introduction

The popularity of autonomous analysis systems on farms has grown as dairy herd sizes have increased. The Herd Navigator (HN, DeLaval International) management tool, which examines many milk constituents automatically during milking, provides daily estimates of milk beta-hydroxybutyrate (BHB) [1]. According to Yu and Maeda [2], the HN system functions autonomously and offers real-time physiological information on lactating cows while also assisting with farm management decisions. This tool notifies and advises dairy farmers about the condition and health of each cow. To maintain herd health, the system includes unique biological models that take into account measured metrics, cow information, and other risk factors. This process avoids costly treatments and substantial output losses. Significant improvements in reproduction, mastitis, and ketosis have been observed on farms that use this approach [2].
Body condition score (BCS) is a subjective method for calculating the amount of metabolizable energy stored in fat and muscle in a live animal (body reserves) [3]. The body condition score (BCS) is, therefore, a measure for estimating cow body fat reserves [4]. BCS is a helpful method for monitoring the relationships between nutritional management, reproduction, and ketosis and supports farm management decisions [5]. There are some connections between energy status (ES) markers and reproductive features in the first several weeks of lactation. Because the negative effect of ES on fertility is well known, the proposed publicly available milk-based ES indicators are promising management strategies that can assist farmers in identifying cows that may be sensitive to metabolic stress and production disorders as well as determining the appropriateness of feeding techniques and the timing of insemination [1]. The dairy sector places a high value on reproductive performance management, which includes both fertility and calving.
The main objective of commercialized dairy farming is not only to produce one calf per year but also to maintain profitability by changing inputs and output. These inputs need enormous investment in infrastructure, labor, feed, and treatments, among other factors. The most important of these inputs is nutritional control, which is essential for a normal production and reproduction cycle. The connection between nutrition and reproduction was previously established [3]. Loeffler et al. [6] demonstrated that negative energy balance, physical condition decline, and sickness have an impact on fertility, and poor fertility is one of the major limiting factors impacting the dairy industry’s economy. Most studies have found that BCS is a useful tool for dairy cow management in predicting energy balance and disease risk variables. Overweight cows were found to be at higher risk of developing metabolic illnesses and had a reduced chance of becoming pregnant during their first breeding. Low BCS at calving causes oestrus to be delayed, follicular development to be delayed, fertility to be diminished, and the inter-calving interval to be extended. The link between nutrition and fertility management is also well understood [3]. It was established that BCS at calving and its variations throughout lactation have an impact on the health and fertility of high-producing dairy cows [7]. A fully automated inline LDH, progesterone (mP4), and BHB analyzer that can be paired with a milking robot is available for purchase on the commercial market to achieve better herd assessment. Using the precision diagnostic methods of this tool can provide greater information on the current parameters influencing dairy cow reproductive physiology. The first commercially accessible 3D BCS system based on image processing technologies was built by the DeLaval corporation [8].
According to Nyman et al. [9], additional research is needed to determine whether the diagnostic qualities of LDH improve with adjustment based on their interactions with other cow variables when used as a diagnostic tool for identifying cows with mastitis. We also discovered a positive relationship between LDH content in milk and milk yield [10]. An automated body condition scoring system would produce more objective and consistent information than observational scoring and result in a more efficient operation that is less stressful for the animal [11]. In terms of research, automated methods would enable the utilization of data collected at various precise time periods, resulting in scores that are unaffected by inter- and intra-evaluator variation [12].
In the present study, we hypothesize that an automatically recorded body condition score has associations with measures of production, health, and reproduction. Therefore, the objective of this study is to determine the associations of automatically recorded body condition scores with measures of production, health, and reproduction (MY, BHB, LDH, and mP4) in dairy cows.

2. Materials and Methods

2.1. Study Design

This research was conducted on a dairy farm in northern Lithuania, in the eastern region of Europe, located at 55.10571, 24.24399. The cows were kept in a loose housing system and fed a total mixed ration (TMR) that was balanced according to their physiological needs. Cows were fed a TMR composed of 30% corn silage, 10% grass silage, 4% grass hay, 50% grain concentrate mash, and 6% mineral mixture. Diets were created to fit or surpass the needs of a 550 kg Holstein cow producing 35 kg milk/d. Every day at 06:00 a.m. and 06:00 p.m., the animals were fed. The cows were milked twice a day, at 05:00 a.m. and 05:00 p.m., using a parlor system. The cows weighed an average of 550 ± 45 kg. In 2021, the average energy-corrected milk yield (4.2% fat, 3.5% protein) per cow and year was 10,500 kg. During the study, contact with animals was kept to a minimum, thus avoiding the impact of the trial on animal welfare. The cows (n = 597) had an average of 2.10 ± 0.05 lactations at 206.52 ± 5.02 days postpartum and were divided into two groups: primiparous cows (n = 232) and multiparous cows (n = 365).

2.2. Measurements

The real-time analyzer Herd NavigatorTM (Lattec I/S, Hillerd, Denmark) was applied in conjunction with a DeLaval milking parlor system to collect data on mP4, MY, BHB, and LDH (DeLaval Inc., Tumba, Sweden). During the robot milking operation, an inline sampler automatically took a representative sample of several millilitres of milk from each cow. The material was then loaded into the Herd NavigatorTM analyzer for further examination. Three-dimensional BCS cameras were used to measure BCS (DeLaval body condition scoring BCS, DeLaval International AB, Tumba, Sweden). These systems were used to collect daily averages of data on the following biomarkers for each cow from the day of oestrus to 7 days post-oestrus: mP4, MY, BHB, LDH, and BCS.

2.2.1. Measurements of BCS

After each milking, Herd NavigatorTMAutomatic BCS measurements were taken using a commercially available 3D body condition scoring camera system (DeLaval Body Condition Scoring, BCS DeLaval International AB, Tumba, Sweden) with two cameras, including a camera fixed above one of the milking parlor exit races. Cows were identified individually using a radio-frequency identification collar system, allowing for repeated BCS assessments per day. As a result, each cow typically had two visual BCS assessments taken on the same day each week. The camera system reported BCS readings in 0.1 point increments and provided a 1–5 scale [13]. Data from the camera system are given either as a one-day BCS rolling average that removes the lowest and highest 20% of data prior to averaging or as daily (AM and PM) BCS values. Individual daily AM and PM raw BCS data from each camera were accessed via the manufacturer’s software (DelPro Farm Manager, DeLaval International AB, Tumba, Sweden) using the pathway Systems > Devices > BCS Camera > BCS CAM as the data were not readily available for download and were downloaded weekly before being automatically overwritten by the system after eight days.

2.2.2. Measurements of BHB, LDH, MY, and mP4

To identify milk BHB concentrations and LDH activities, a real-time analyzer Herd NavigatorTM (Lattec I/S, Hillerd, Denmark) was paired with a DeLaval milking robot (DeLaval Inc., Tumba, Sweden). Several millilitres of milk were obtained from each cow during the milking process using an inline sampler to determine the concentrations of the previously listed parameters. The raw data were adjusted using company-specified procedures to account for differences in dry-stick sets and variations in the surrounding humidity. The most extreme outliers were then excluded from the calculations. Data more than 200 mol/min per liter were set to a maximum value of 200, and any negative values were removed from the equation because they did not fall within the typical range of measurements recorded by the Herd Navigator system. This is how data in the Herd Navigator system were standardized. An optical milk meter was used to measure the milk yield from each cow. The LDH concentration (mol/min) was estimated by dividing the LDH activity by the milk output from the most recent milking activity. The Herd Navigator system was set to automatically collect milk samples and test the mP4 in individual cows using dry-stick biosensor technology and enzyme immunoassays based on a bio-model that establishes the frequency and quantification of mP4 samples. The system adjusted the frequency of assays to an average of six to seven progesterone studies per cycle, depending on the postpartum period and the stage of the oestrus cycle. The data were then provided to a user interface via the analyzer. When the progesterone level in the oestrus cycle of a cow fell below 5 ng/mL, a heat alert was displayed. The mP4 concentration in milk samples began on the first postpartum day and was obtained every 5 days until pregnancy was recognized. Raw (actual) mP4 concentrations were adjusted to smoothed values based on a standardized procedure to correct for outliers predicted in the serial sampling system, as described by Friggens and Chagunda [14], in order to reduce random fluctuation and differences in batches of sticks and reagents.

2.3. Identification of Oestrus and Pregnancy

The cows’ oestrus cycles were all synchronized using the OvSynch protocol. When an animal displayed a progesterone alarm (registered by the Herd Navigator system), an increase in cow walking activity (registered by the AMS), or one or more of the oestrus signs described by Van Eerdenburg et al. [15] (standing to be mounted, mucous vaginal discharge, cajoling, restlessness at being mounted but not standing, sniffing the vagina of other cows, resting chin on other cows), rectal palpation was used to assess the cow’s uterine tone. The cows were artificially inseminated 12 hours after the start of oestrus (as assessed by the mP4 concentration determined via AMS). At 30–35 days after insemination, the pregnancies were tested with an ‘easy scan’ ultrasound (IMV imaging, Scotland).

2.4. Identification of Health Status

Out of 850 fresh milking cows (from 1 until 30 days after calving), we randomly chose 483 clinically healthy cows, 21 cows with subclinical ketosis, 26 cows with subclinical mastitis, and 67 cows with metritis.
Healthy group (n = 483). Cows that had no clinical symptoms of disease after calving and BHB values at or below 1.2 mmol/L for the entire 30-day post-calving period were categorized into this group. This group of cows had an average milk F/P of 1.2.
Subclinical ketosis group (SCG) (n = 21). When at least one beta-hydroxybutyrate (BHB) value throughout the 30-day postpartum period was 1.2 mmol/L, the cows were identified as having SCK. For this particular herd of cows, the milk fat/protein ratio (F/P) was recorded as being >1.2. After calving, the cows showed no clinical symptoms of any additional illnesses, including metritis, lameness, mastitis, displaced abomasus, dyspepsia with an average rectal temperature of +38.8 °C, or rumen motility of five to six times every three minutes.
Subclinical mastitis group (n = 26). SCC was used to identify cases that belonged to the subclinical mastitis group (CM). SCM was identified in cows with an SCC of more than 200,000 cells/mL [16]. SCC was assessed once daily during all studies. A general clinical evaluation revealed that none of the cows showed clinical indications indicative of any disease.
Metritis group (n = 67). Every 3 days after calving until day +21, vaginal discharge (VD) was assessed for each cow. A gloved hand was inserted into the vaginal canal up to the cervix to remove any discharge present and allow for visual inspection. Based on the scoring system used by Urton et al. [17], the appearance and smell of the VD were assessed and categorized as follows: putrid (red/brown color, watery, foul-smelling), no mucus or clear mucus = 0, cloudy mucus or mucus with flecks of pus = 1, mucopurulent (50% pus present) and foul-smelling = 2, and mucopurulent (50% pus present) and foul-smelling = 3. All cows had three points.

2.5. Data Analysis and Statistics

Indicators from Herd NavigatorTM were grouped into classes based on their arithmetic means. Values were divided into various classes: MY: ≤31 kg/day (first class—67.3% of cows) and >31 kg/day (second class—32.7%); BHB in milk: ≤0.06 mmol/L (first class—80.7% of cows) and >0.06 mmol/L (second class—16.9%); milk LDH activity: ≤27 µmol/min (first class—69.5% of cows) and >27 µmol/min (second class—30.5%); milk progesterone value: ≤15.5 ng/mL (first class—28.8% of cows) and >15.5 ng/mL (second class—71.2%); and BCS: 2.5–3.0 (first class—21.4% of cows), >3.0–3.5 (second class—50.8%), and >3.5–4.0 (third class—27.8%). According to lactation, the cows were divided into two groups: 1 lactation (first group—38.9% of cows) and ≥2 lactations (second group—61.1% of cows). According to their pregnancy status, 1-lactation cows were divided into two groups, non-pregnant (n = 107 or 46.0%) and pregnant cows (n = 125 or 54.0%); similarly, cows with ≥2 lactations were classified as non-pregnant (n = 207 or 57.0%) or pregnant (n = 158 or 43.0%). The average days in milk (DIM) among pregnant cows was 151.60 ± 0.11 days, while that among non-pregnant cows was 151.70 ± 0.08 days. The status of pregnancy among all investigated cows was as follows: pregnant (n = 283) and non-pregnant (n = 314). The statistical analysis of data was performed using the SPSS 25.0 software package. Normal distributions were assessed using the Kolmogorov–Smirnov test. The results from Herd NavigatorTM are presented as the mean ± standard error (M ± SE) with a 95% confidence interval (CI). The Pearson correlation (r) was determined to define the linear relationship between BCS and indicators from AMS. Multiple comparisons of group means were calculated using Tukey’s test. A probability below 0.05 was considered statistically significant. The chi-square (χ2) statistic was used to test the relationship between the categorical variable classes of BCS and the indicators investigated using Herd Navigator™, BCS, and the reproductive status of cows.

3. Results

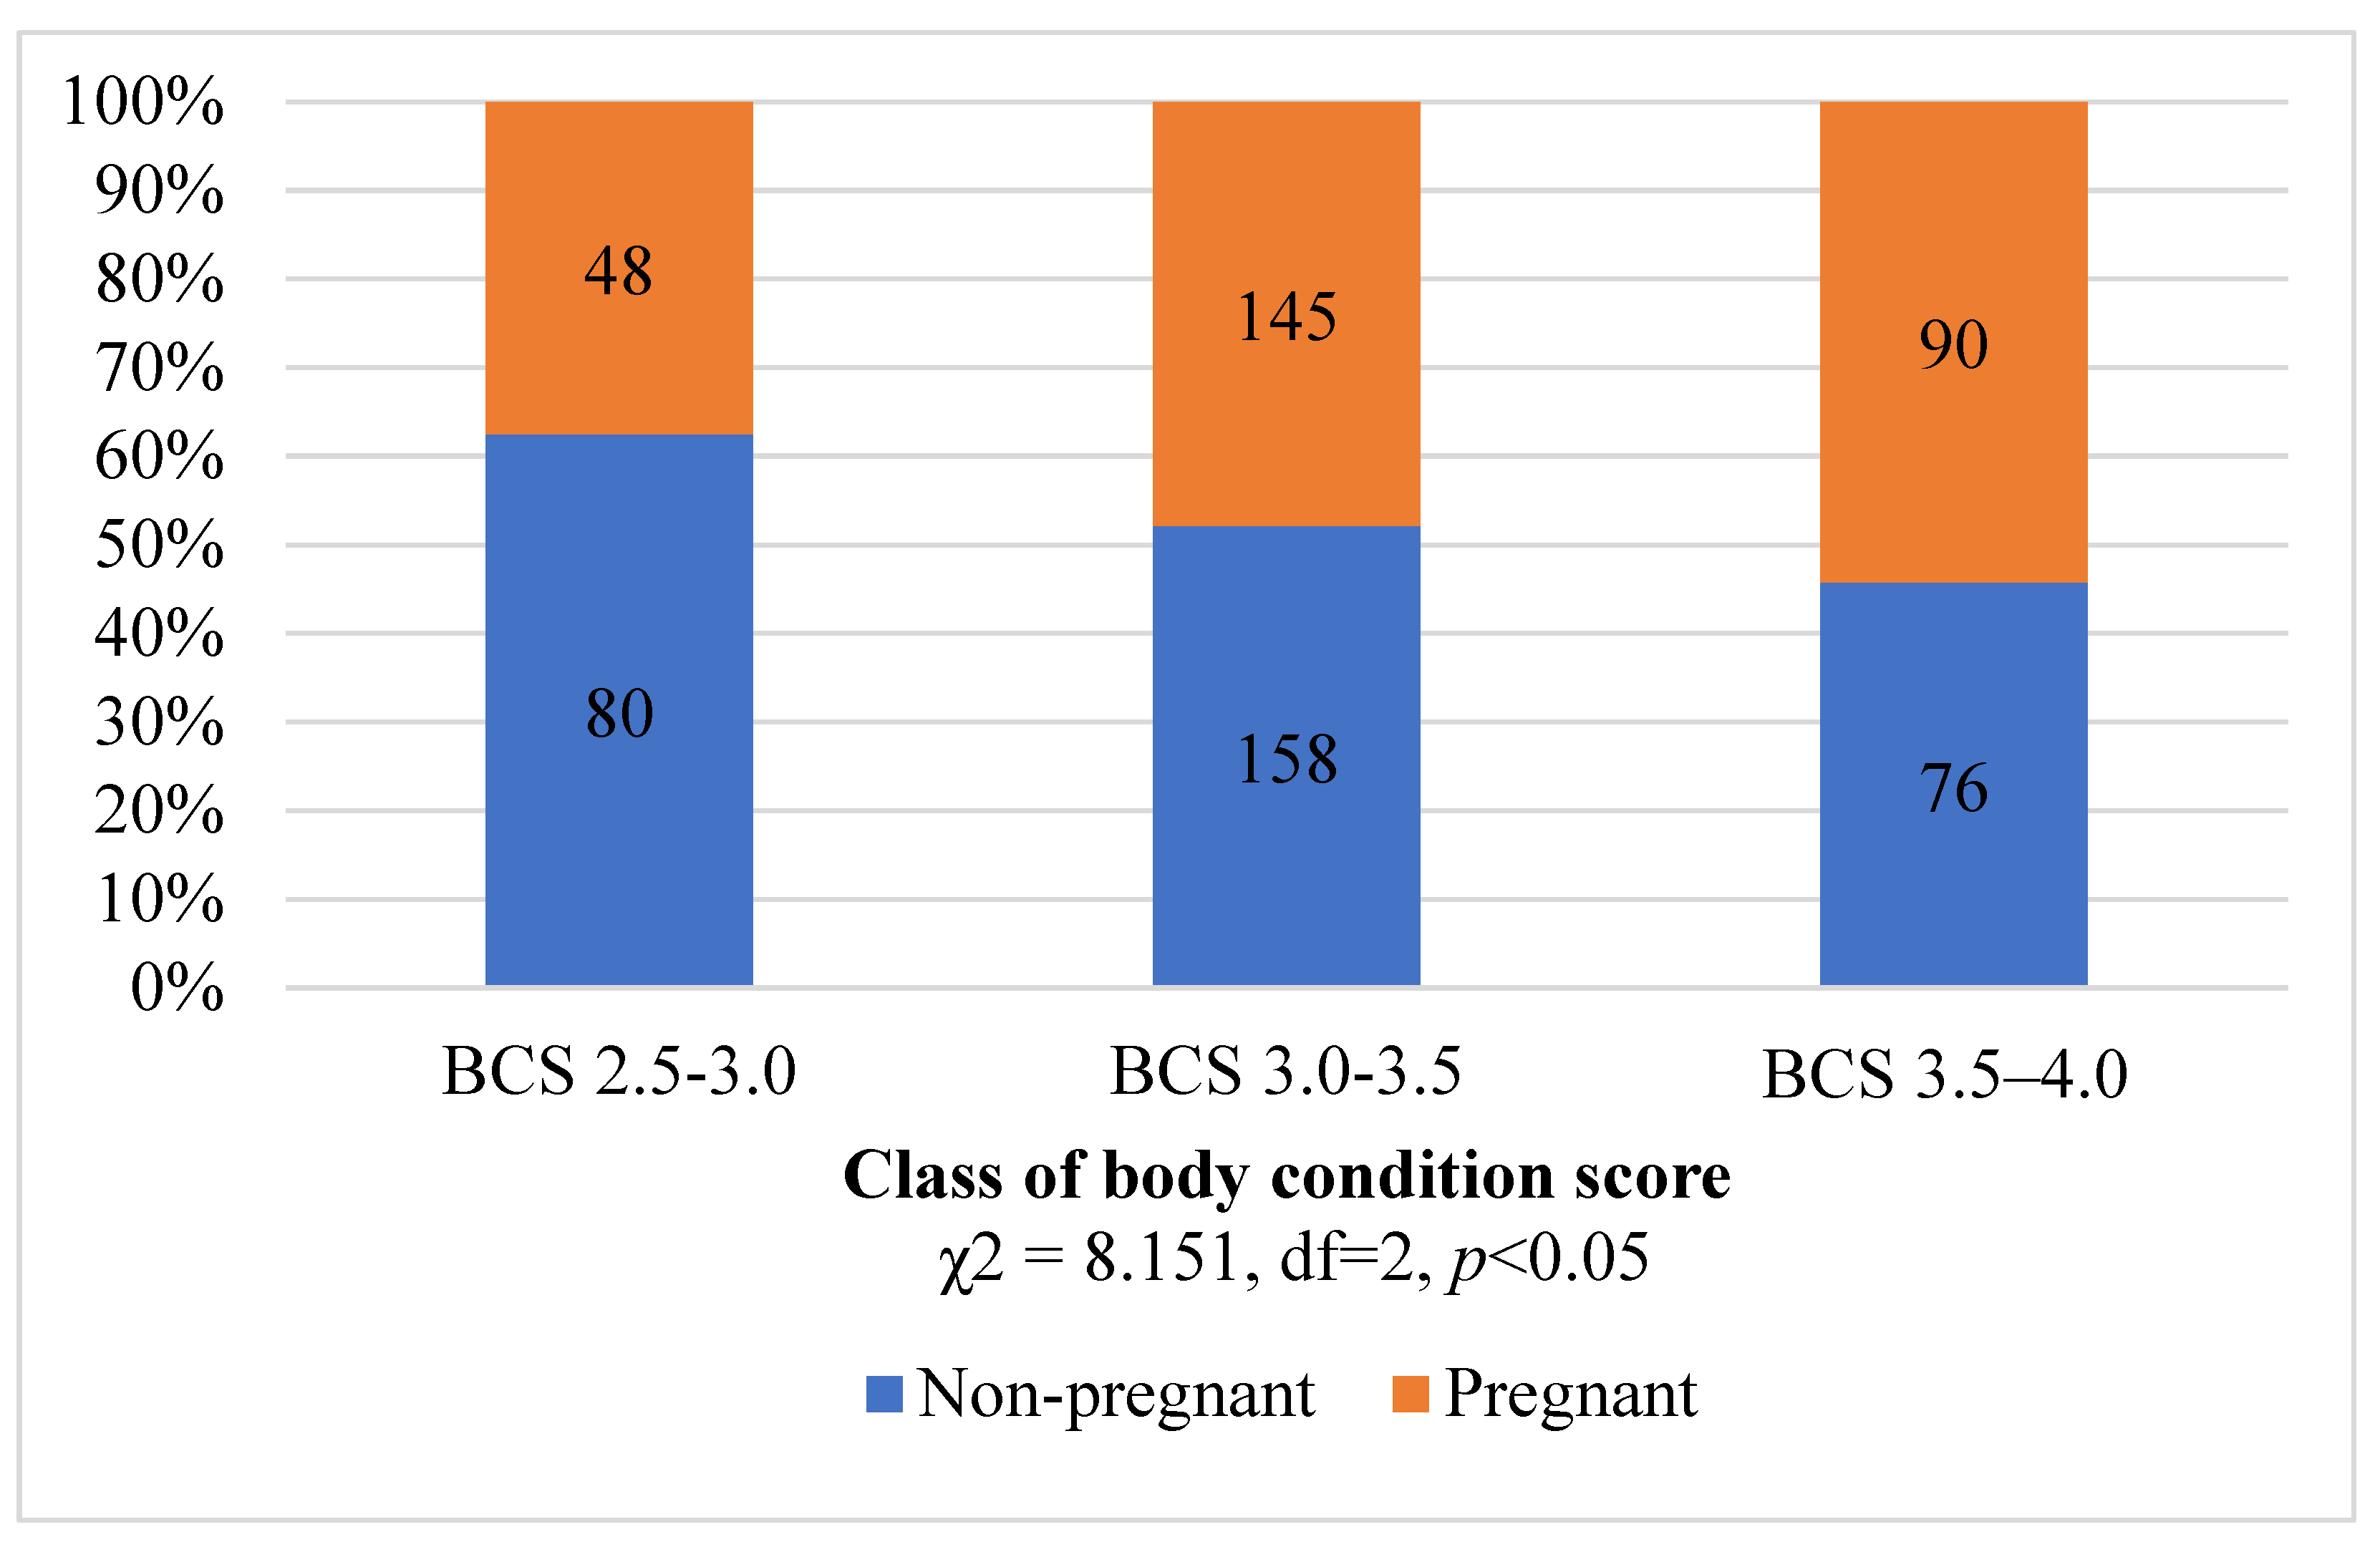
3.1. Associations of Automatically Recorded Body Condition Scores with Measures of Production and Reproduction

For all biomarkers, all differences between groups were significant except for milk β-hydroxybutyrate. The BCS (+0.09 score) and mP4 values of pregnant cows were higher (10.93 ng/mL) compared to those of non-pregnant cows. The MY (−5.26 kg; p < 0.001) and LDH values were lower (3.45 µmol/min) compared to those of non-pregnant cows (p < 0.01). The data are presented in Table 1. Backward stepwise multivariate logistic regression showed that, of all tested categorical variables (BCS, mP4, LDH, BHB, and MY), only mP4 (OR = 1.197, p < 0.001) and MY (OR = 0.886, p < 0.001) had a significant relationship with the reproductive status of cows.
The pregnancy status of cows was associated with the BCS assessment (p < 0.05). In the class of cows with BCS = 2.5–3.0, 37.5% of cows were pregnant, whereas with BCS > 3.0–3.5 and BCS > 3.5–4.0, 47.9% and 54.2% of cows were pregnant, respectively (Figure 1).
Of all the biomarkers, differences between BCS classes were significant only in LDH and MY. The LDH of cows with the highest BCS of 3.5–4.0 was 6.48% higher than that of the cows with a BCS of 3.0–3.5 (p < 0.01). The highest MY was detected in cows with the lowest BCS of 2.5–3.0; it was 29.55% higher compared to that of the cows with the highest BCS of 3.5–4.0 (p < 0.001) (Table 2).
The analysis showed that 51.16% more cows with a BCS of 2.5–3.0 were found in the second mP4 class compared to class 1, 58.41% more cows with a BCS > 3.0–3.5 were found in the second mP4 class, and 67.20% more cows with a BCS of 3 were found in the second mP4 class compared to the first mP4 class (Figure 2). Analysis of cows in the first mP4 class showed that 52.81%–53.93% more cows had a BCS of >3.0–3.5 compared to cows with a BCS of 2.5–3.0 and those with a BCS of 3 (χ2 = 26.244, df = 2, p < 0.001). In the second mP4 class, the analysis showed almost the same tendency of cow distribution, with 53.93% more cows having a BCS of 2 and 41.59% more cows having a BCS of >3.5–4.0 (χ2 = 60.767, df = 2, p < 0.001) (Figure 2).
The analysis showed that 79.25% more cows with a BCS of 2.5–3.0 were found in the first BHB class compared to the second BHB class; 78.31% more cows with a BCS of 3.0–3.5 and 82.27% more cows with a BCS of >3.5–4.0 were found in the first BHB class compared to the second BHB class. In the first BHB class, there were 56.91% and 47.15% more cows with a BCS of >3.0–3.5 than cows with a BCS of 2.5–3.0 and a BCS of <3.5–4.0, respectively. In the first BHB class, more cows were determined to have a BCS of >3.0–3.5 compared to cows with a BCS of 2.5–3.0 and a BCS of >3.5–4.0 (χ2 = 67.214, df = 2, p < 0.001). In the second BHB class, 59.26% more cows had a BCS of >3.0–3.5, and 53.70% more cows had a BCS of >3.5–4.0 (χ2 = 18.554, df = 2, p < 0.001) (Figure 2). The distribution of cows according to LDH classes revealed that 33.77% more cows with a BCS of 2.5–3.0 were present in the first LDH class than in the second LDH class. Additionally, 61.36% more cows with a BCS of >3.0–3.5 and 58.47% more cows with a BCS of >3.5–4.0 were found in the first BHB class compared to the second BHB class. In the first LDH class, there were 65.00% and 46.36% more cows with a BCS of >3.0–3.5 compared to cows with a BCS of 2.5–3.0 and a BCS of >3.5–4.0 (χ2 = 78.395, df = 2, p < 0.001). In the second LDH class, 40.00% and 42.35% more cows, respectively, had a BCS of >3.0–3.5 and >3.5–4.0 compared to cows with a BCS of 2.5–3.0 and >3.5–4.0 (χ2 = 13.276, df = 2, p < 0.001) (Figure 2). The analysis showed that 33.77% more cows with a BCS of 2.5–3.0 were found in the first MY class compared to the second MY class; 48.50% more cows with a BCS of >3.0–3.5 and 90.07% more cows with a BCS of >3.5–4.0 were found in the first MY class compared to the second MY class. In the first MY class, 74.50%–24.50% more cows were determined to have a BCS of >3.0–3.5 compared to cows with a BCS of 2.5–3.0 and >3.5–4.0 (χ2 = 86.075, df = 2, p < 0.001). In the second BHB class, 25.24% more cows had a BCS of >3.0–3.5, and 85.44% more cows had a BCS of >3.5–4.0 (χ2 = 62.892, df = 2, p < 0.001) (Figure 2).
Differences between classes of biomarkers with the number of inseminations were statistically significant only in BCS and mP4 (Table 3). The number of inseminations among cows with the highest BCS of >3.5–4.0 was 42.41% higher than that among cows with the lowest BCS of 2.5–3.0 (p < 0.001). The number of inseminations among cows with lower milk progesterone of ≤15.5 ng/mL (mP4 1) was 13.23% higher than that among cows with a higher concentration of milk progesterone of >15.5 ng/mL (p < 0.01). No statistically significant associations were found between BHB and LDH classes and the number of inseminations (p > 0.05).
The BCS was statistically significantly negatively related to the milk yield, lactation (p < 0.001), and milk lactate dehydrogenase (p < 0.05). It was positively related to the number of inseminations (p < 0.001) and milk progesterone concentration (p < 0.05).

3.2. Associations of Automatically Recorded Body Condition Scores with Measures of Health

The BCS was highest in the group of cows with mastitis—higher by 4.96% compared to the BCS among the group of healthy cows. The highest statistically significant mean differences in the body condition score (9.04%) were estimated between the mastitis and metritis groups of cows (p < 0.001) (Table 4).
The body condition scores in healthy and all diseased groups of cows were statistically significantly negatively related to the milk yield of cows (p < 0.001–0.05). The body condition score presented a dependence with the number of inseminations in the opposite direction between groups of cows, showing a positive relationship among healthy cows (p < 0.001) and those with mastitis (p < 0.05), along with a negative relationship in the metritis group of cows (p < 0.05). The body condition score had a positive relationship in healthy cows and a negative relationship in the mastitis group of cows (p < 0.05) (Figure 3).

4. Discussion

According to our results, the BCS registered from the day of oestrus to 7 days post-oestrus was higher among the pregnant cows (+0.29 score) compared to the BCS in the group of non-pregnant cows. Additionally, the mP4 in pregnant cows was higher (10.93 ng/mL), the MY was lower (−5.26 kg, p < 0.001), and the LDH was lower (3.45 µmol/min) compared to the values in the group of non-pregnant cows (p < 0.01). Statistically significant associations were detected between BCS, mP4, and the number of inseminations. The number of inseminations of cows with the highest BCS of >3.5–4.0 was 42.41% higher compared to that of the cows with the lowest BCS of 2.5–3.0 (p < 0.001). According to Roche et al. [18], the majority of studies on the physiological effects of energy status and energy balance on fertility revealed a positive link between earlier pregnancy attainment, enhanced BCS, and reduced BCS loss during early lactation. However, studies using daily BCS testing in large numbers of cows throughout early lactation remain uncommon. Daily automated BCS evaluations and the resulting enhanced prediction of pregnancy likelihood at AI may influence insemination decisions, such as which type of sperm to utilize [19] and when to discontinue inseminating cows that failed to conceive earlier during lactation [20]. The causes for the lower conception rates among cows with BCS are unknown. According to Britt [21], energy status during the early postpartum period may affect follicular/oocyte quality, resulting in decreased fertility in nursing dairy cows. Reduced functional competence of the ovulated follicles could be due to the development of follicles under negative energy balance or caused by subtle changes in the steroid hormone secretions that regulate gene expression and protein secretion by the endometrium, thereby affecting implantation and pregnancy recognition [22].
Poor postpartum health has a detrimental impact on dairy cow performance, and incidences of uterine, metabolic, and other health issues have been extensively recognized as risk factors for lower subsequent fertility [23]. A loss of body condition, as an indirect measure of energy balance in early lactation, and health, as a measure of metabolic, immunological, and homeostatic functioning, has been shown to produce delayed resumption of ovarian cyclicity postpartum [24,25,26]. Specific factors affecting the proper resumption of cyclicity include parity [27], changes in recoupling the growth hormone/IGF-1 axis in the liver [28], metabolic and infectious disorders [12,28], insufficient progesterone concentrations [29], and dystocia [30]. These implications may explain the effects of changes in body condition and disease on variables such as P/AI1, supporting the idea of using BCS and health information to predict fertility [12]. The amplitude of the link between milk yield and reproductive success is minor and depends on the herd production level [31]. Buckley et al. [31] discovered that high milk output at first service was associated with an increased risk of being pregnant after 42 days of the breeding season. However, the majority of research has found an antagonistic link between milk production and a variety of reproductive features [22,32]. These findings are consistent with the findings of our study, which showed that pregnant cows had a 5.26 kg/day lower milk output than non-pregnant cows. In previous studies, we found that pregnant cows had a 0.49-point higher body condition score, a 4.36 kg/day lower milk output, and a 6.11 ng/mL higher mP4 concentration than non-pregnant cows. Pregnant cows had a 0.49-point higher body condition score than non-pregnant cows, and cows with a BCS of >3.2 were 22 times more likely to be successful in reproduction than cows with a BCS of 3.2 [33].
We found that the LDH of cows with the highest BCS of >3.5–4.0 was 6.48% higher compared to that of cows with a BCS of >3.0–3.5 (p < 0.01). The highest MY was detected in cows with the lowest BCS of 2.5–3.0, which was 29.55% higher than that of the cows with the highest BCS of 3.5–4.0 (p < 0.001). The BCS was the highest in the group of cows with mastitis—the score was 4.96% higher compared to that in the group of healthy cows—while the highest statistically significant mean differences in body condition score (9.04%) were estimated between the mastitis and metritis groups of cows (p < 0.001). According to various studies, combining multiple sensor data is effective for detecting and differentiating mastitis types in AMS [34,35]. Lactate dehydrogenase (LDH) in dairy milk is correlated with somatic cell count (SCC) and utilized as a mastitis indication in commercial herd management [9,14]. Cell-damaging mechanisms during mammary inflammation, according to Zank and Schlatterer [36], should be best recognized by monitoring high LDH activity. Yang et al. [27] investigated the variations in milk malondialdehyde levels and enzymatic activity caused by subclinical mastitis in dairy cows. The median value of LDH activity in subclinical mastitis milk was found to be substantially higher than that in normal milk. The authors concluded that measuring this characteristic in milk is an appropriate approach for diagnosing SCM in dairy cows [37]. According to Suriyasathaporn [38], poor body condition reflects a negative energy balance and makes the animal more susceptible to mastitis. Patel et al. [39] found that cows in both groups (under and over the ideal body condition score) were at higher risk of developing subclinical mastitis. In comparison to cows in the high-infection herds, cows in the low-infection herds had considerably lower BCS results throughout the last month prior to calving and the first month of lactation. There were, overall, significant correlations between BCS and the incidence of mastitis infection [40]. A higher incidence of subclinical ketosis in animals with better conditions at calving may be one reason for the increased risk of developing mastitis among fatter cows. Ketosis and mastitis may be positively correlated due to the decreased production of chemoattractants that draw leukocytes to the infected quarter and diminished leukocyte responses when ketone bodies are present [41].

5. Conclusions

According to the aim of our study, to determine the associations of automatically recorded body condition scores with measures of production, health, and reproduction (MY, BHB, LDH, and mP4) in dairy cows, we found that automated registered BCSs can represent an indicator of pregnancy success because the BCS of the pregnant cows was higher (+0.29 score). Moreover, the mP4 was 10.93 ng/mL higher compared to that in the group of non-pregnant cows during insemination. The number of inseminations of cows with the highest BCS of >3.5–4.0 was 42.41% higher compared to that among cows with the lowest BCS of 2.5–3.0.
The automatically recorded BCS in cows with subclinical mastitis was higher by 4.96% compared to that in the group of healthy cows. The BCS was the highest in the group of cows with mastitis, with a 4.96% higher score compared to that in the group of healthy cows. Additionally, the highest statistically significant mean differences in body condition score (9.04%) were estimated between the mastitis and metritis groups of cows.

Author Contributions

R.A.: setup of the field experiment, data collection, and selection and management of the experimental group of animals; L.A.: software and algorithm development, design and setup of field experiments, and data collection and analysis; D.M., M.T., M.U. and G.Š.: setup of the field experiment and data collection; A.R. and W.B.: intensive support in the processing of data in the manuscript. All authors have read and agreed to the published version of the manuscript.

Funding

Research Council of Lithuania (project number: S-MIP-22-137).

Institutional Review Board Statement

The study was conducted according to the guidelines of the Declaration of Helsinki and approved by Ethics Committee (study approval number: PK016965, 6 June 2017).

Informed Consent Statement

Not applicable.

Data Availability Statement

The data presented in this study are available within the article.

Conflicts of Interest

The authors declare no conflict of interest.

References

  1. Mäntysaari, P.; Juga, J.; Lidauer, M.H.; Häggman, J.; Mehtiö, T.; Christensen, J.M.; Mäntysaari, E.A. The Relationships between Early Lactation Energy Status Indicators and Endocrine Fertility Traits in Dairy Cows. J. Dairy Sci. 2022, 105, 6833–6844. [Google Scholar] [CrossRef] [PubMed]
  2. Yu, G.-M.; Maeda, T. Inline Progesterone Monitoring in the Dairy Industry. Trends Biotechnol. 2017, 35, 579–582. [Google Scholar] [CrossRef] [PubMed]
  3. Nazhat, S.A.; Aziz, A.; Zabuli, J.; Rahmati, S. Importance of Body Condition Scoring in Reproductive Performance of Dairy Cows: A Review. Open J. Vet. Med. 2021, 11, 272–288. [Google Scholar] [CrossRef]
  4. Rodríguez Alvarez, J.; Arroqui, M.; Mangudo, P.; Toloza, J.; Jatip, D.; Rodriguez, J.M.; Teyseyre, A.; Sanz, C.; Zunino, A.; Machado, C.; et al. Estimating Body Condition Score in Dairy Cows From Depth Images Using Convolutional Neural Networks, Transfer Learning and Model Ensembling Techniques. Agronomy 2019, 9, 90. [Google Scholar] [CrossRef] [Green Version]
  5. Gillund, P.; Reksen, O.; Gröhn, Y.T.; Karlberg, K. Body Condition Related to Ketosis and Reproductive Performance in Norwegian Dairy Cows. J. Dairy Sci. 2001, 84, 1390–1396. [Google Scholar] [CrossRef]
  6. Loeffler, S.H.; de Vries, M.J.; Schukken, Y.H.; de Zeeuw, A.C.; Dijkhuizen, A.A.; de Graaf, F.M.; Brand, A. Use of Ai Technician Scores for Body Condition, Uterine Tone and Uterine Discharge in a Model with Disease and Milk Production Parameters to Predict Pregnancy Risk at First Ai in Holstein Dairy Cows. Theriogenology 1999, 51, 1267–1284. [Google Scholar] [CrossRef]
  7. Huang, X.; Hu, Z.; Wang, X.; Yang, X.; Zhang, J.; Shi, D. An Improved Single Shot Multibox Detector Method Applied in Body Condition Score for Dairy Cows. Animals 2019, 9, 470. [Google Scholar] [CrossRef] [Green Version]
  8. Somers, J.R.; Huxley, J.; Lorenz, I.; Doherty, M.L.; O’Grady, L. The Effect of Lameness before and during the Breeding Season on Fertility in 10 Pasture-Based Irish Dairy Herds. Ir. Vet. J. 2015, 68, 14. [Google Scholar] [CrossRef] [Green Version]
  9. Nyman, A.-K.; Emanuelson, U.; Waller, K.P. Diagnostic Test Performance of Somatic Cell Count, Lactate Dehydrogenase, and N-Acetyl-β-d-Glucosaminidase for Detecting Dairy Cows with Intramammary Infection. J. Dairy Sci. 2016, 99, 1440–1448. [Google Scholar] [CrossRef] [Green Version]
  10. Antanaitis, R.; Malašauskienė, D.; Televičius, M.; Juozaitienė, V.; Rutkauskas, A.; Palubinskas, G. Inline changes in lactate dehydrogenase, milk concentration according to the stage and number of lactation periods, including the status of reproduction and milk yield in dairy cows. Pol. J. Vet. Sci. 2020, 23, 153–156. [Google Scholar] [CrossRef]
  11. Leroy, T.; Aerts, J.M.; Eeman, J.; Maltz, E.; Stojanovski, G.; Berckmans, D. Automatic Determination of Body Condition Score of Cows Based on 2D Images. Precis. Livest. Farming 2005, 5, 251–255. [Google Scholar]
  12. Pinedo, P.; Manríquez, D.; Azocar, J.; Klug, B.R.; De Vries, A. Dynamics of Automatically Generated Body Condition Scores during Early Lactation and Pregnancy at First Artificial Insemination of Holstein Cows. J. Dairy Sci. 2022, 105, 4547–4564. [Google Scholar] [CrossRef] [PubMed]
  13. Wildman, E.E.; Jones, G.M.; Wagner, P.E.; Boman, R.L.; Troutt, H.F.; Lesch, T.N. A Dairy Cow Body Condition Scoring System and Its Relationship to Selected Production Characteristics. J. Dairy Sci. 1982, 65, 495–501. [Google Scholar] [CrossRef]
  14. Friggens, N.C.; Chagunda, M.G.G. Prediction of the Reproductive Status of Cattle on the Basis of Milk Progesterone Measures: Model Description. Theriogenology 2005, 64, 155–190. [Google Scholar] [CrossRef]
  15. Van Eerdenburg, F.J.C.M.; Loeffler, H.S.H.; van Vliet, J.H. Detection of Oestrus in Dairy Cows: A New Approach to an Old Problem. Vet. Q. 1996, 18, 52–54. [Google Scholar] [CrossRef]
  16. Nielen, M.; Schukken, Y.H.; Brand, A.; Deluyker, H.A.; Maatje, K. Detection of Subclinical Mastitis from On-Line Milking Parlour Data. J. Dairy Sci. 1995, 78, 1039–1049. [Google Scholar] [CrossRef]
  17. Urton, G.; von Keyserlingk, M.A.G.; Weary, D.M. Feeding Behavior Identifies Dairy Cows at Risk for Metritis. J. Dairy Sci. 2005, 88, 2843–2849. [Google Scholar] [CrossRef] [Green Version]
  18. Roche, J.R.; Friggens, N.C.; Kay, J.K.; Fisher, M.W.; Stafford, K.J.; Berry, D.P. Invited Review: Body Condition Score and Its Association with Dairy Cow Productivity, Health, and Welfare. J. Dairy Sci. 2009, 92, 5769–5801. [Google Scholar] [CrossRef] [Green Version]
  19. Shahinfar, S.; Guenther, J.N.; David Page, C.; Kalantari, A.S.; Cabrera, V.E.; Fricke, P.M.; Weigel, K.A. Optimization of Reproductive Management Programs Using Lift Chart Analysis and Cost-Sensitive Evaluation of Classification Errors. J. Dairy Sci. 2015, 98, 3717–3728. [Google Scholar] [CrossRef] [Green Version]
  20. Inchaisri, C.; De Vries, A.; Jorritsma, R.; Hogeveen, H. Improved Knowledge About Conception Rates Influences the Decision to Stop Insemination in Dairy Cows. Reprod. Domest. Anim. 2012, 47, 820–826. [Google Scholar] [CrossRef]
  21. Britt, J.H. Impacts of Early Postpartum Metabolism on Follicular Development and Fertility. Am. Assoc. Bov. Pract. Conf. Proc. 1991, 39–43. [Google Scholar] [CrossRef]
  22. Beam, S.W.; Butler, W.R. Effects of energy balance on follicular development and first ovulation in postpartum. Reprod Fertil. Suppl. 1999, 54, 411–424. [Google Scholar] [CrossRef] [Green Version]
  23. Carvalho, P.D.; Souza, A.H.; Amundson, M.C.; Hackbart, K.S.; Fuenzalida, M.J.; Herlihy, M.M.; Ayres, H.; Dresch, A.R.; Vieira, L.M.; Guenther, J.N.; et al. Relationships between Fertility and Postpartum Changes in Body Condition and Body Weight in Lactating Dairy Cows. J. Dairy Sci. 2014, 97, 3666–3683. [Google Scholar] [CrossRef] [Green Version]
  24. Nebel, R.L.; McGilliard, M.L. Interactions of High Milk Yield and Reproductive Performance in Dairy Cows. J. Dairy Sci. 1993, 76, 3257–3268. [Google Scholar] [CrossRef]
  25. Beever, D.E. The Impact of Controlled Nutrition during the Dry Period on Dairy Cow Health, Fertility and Performance. Anim. Reprod. Sci. 2006, 96, 212–226. [Google Scholar] [CrossRef] [PubMed]
  26. Stevenson, J.S.; Banuelos, S.; Mendonça, L.G.D. Transition Dairy Cow Health Is Associated with First Postpartum Ovulation Risk, Metabolic Status, Milk Production, Rumination, and Physical Activity. J. Dairy Sci. 2020, 103, 9573–9586. [Google Scholar] [CrossRef] [PubMed]
  27. Zhang, J.; Deng, L.X.; Zhang, H.L.; Hua, G.H.; Han, L.; Zhu, Y.; Meng, X.J.; Yang, L.G. Effects of Parity on Uterine Involution and Resumption of Ovarian Activities in Postpartum Chinese Holstein Dairy Cows. J. Dairy Sci. 2010, 93, 1979–1986. [Google Scholar] [CrossRef] [Green Version]
  28. Santos, J.E.P.; Bisinotto, R.S.; Ribeiro, E.S. Mechanisms Underlying Reduced Fertility in Anovular Dairy Cows. Theriogenology 2016, 86, 254–262. [Google Scholar] [CrossRef] [Green Version]
  29. Wiltbank, M.C.; Souza, A.H.; Carvalho, P.D.; Cunha, A.P.; Giordano, J.O.; Fricke, P.M.; Baez, G.M.; Diskin, M.G. Physiological and practical effects of progesterone on reproduction in dairy cattle. Animal 2014, 8, 70–81. [Google Scholar] [CrossRef] [Green Version]
  30. Ribeiro, E.S.; Lima, F.S.; Greco, L.F.; Bisinotto, R.S.; Monteiro, A.P.A.; Favoreto, M.; Ayres, H.; Marsola, R.S.; Martinez, N.; Thatcher, W.W.; et al. Prevalence of Periparturient Diseases and Effects on Fertility of Seasonally Calving Grazing Dairy Cows Supplemented with Concentrates. J. Dairy Sci. 2013, 96, 5682–5697. [Google Scholar] [CrossRef]
  31. Buckley, F.; O’Sullivan, K.; Mee, J.F.; Evans, R.D.; Dillon, P. Relationships Among Milk Yield, Body Condition, Cow Weight, and Reproduction in Spring-Calved Holstein-Friesians. J. Dairy Sci. 2003, 86, 2308–2319. [Google Scholar] [CrossRef]
  32. Royal, M.D.; Darwash, A.O.; Flint, A.P.F.; Webb, R.; Woolliams, J.A.; Lamming, G.E. Declining Fertility in Dairy Cattle: Changes in Traditional and Endocrine Parameters of Fertility. Anim. Sci. 2000, 70, 487–501. [Google Scholar] [CrossRef]
  33. Antanaitis, R.; Juozaitienė, V.; Malašauskienė, D.; Televičius, M.; Urbutis, M.; Baumgartner, W. Relation of Automated Body Condition Scoring System and Inline Biomarkers (Milk Yield, β-Hydroxybutyrate, Lactate Dehydrogenase and Progesterone in Milk) with Cow’s Pregnancy Success. Sensors 2021, 21, 1414. [Google Scholar] [CrossRef] [PubMed]
  34. Steeneveld, W.; Vernooij, J.C.M.; Hogeveen, H. Effect of sensor systems for cow management on milk production, somatic cell count, and reproduction. J. Dairy Sci. 2015, 98, 3896–3905. [Google Scholar] [CrossRef] [Green Version]
  35. Hernández Castellano, L.E.; Wall, S.; Stephan, R.; Corti, S.; Bruckmaier, R. Milk Somatic Cell Count, Lactate Dehydrogenase Activity, and Immunoglobulin G Concentration Associated with Mastitis Caused by Different Pathogens: A Field Study. Schweiz. Arch. Für Tierheilkd. 2017, 159, 283–290. [Google Scholar] [CrossRef] [Green Version]
  36. Assessment of Subacute Mammary Inflammation by Soluble Biomarkers in Comparison to Somatic Cell Counts in Quarter Milk Samples from Dairy Cows—Zank—1998—Journal of Veterinary Medicine Series A—Wiley Online Library. Available online: https://onlinelibrary.wiley.com/doi/abs/10.1111/j.1439-0442.1998.tb00799.x (accessed on 13 August 2022).
  37. Klein, R.; Nagy, O.; Tóthová, C.; Chovanová, F. Clinical and Diagnostic Significance of Lactate Dehydrogenase and Its Isoenzymes in Animals. Vet. Med. Int. 2020, 2020, e5346483. [Google Scholar] [CrossRef]
  38. Suriyasathaporn, W.; Schukken, Y.H.; Nielen, M.; Brand, A. Low Somatic Cell Count: A Risk Factor for Subsequent Clinical Mastitis in a Dairy Herd. J. Dairy Sci. 2000, 83, 1248–1255. [Google Scholar] [CrossRef]
  39. Patel, Y.; Modi, R.J.; Trivedi, M. Relationship Between Body Condition Score. Trends Biosci. 2020, 13. [Google Scholar]
  40. Valde, J.P.; Lystad, M.L.; Simensen, E.; Østerås, O. Comparison of Feeding Management and Body Condition of Dairy Cows in Herds with Low and High Mastitis Rates. J. Dairy Sci. 2007, 90, 4317–4324. [Google Scholar] [CrossRef] [Green Version]
  41. Berry, D.P.; Lee, J.M.; Macdonald, K.A.; Stafford, K.; Matthews, L.; Roche, J.R. Associations Among Body Condition Score, Body Weight, Somatic Cell Count, and Clinical Mastitis in Seasonally Calving Dairy Cattle. J. Dairy Sci. 2007, 90, 637–648. [Google Scholar] [CrossRef]
Figure 1. Relation of body condition score with the pregnancy status of cows from the day of oestrus to 7 days post-oestrus.
Agriculture 12 01834 g001
Figure 2. Relationship between the body condition scores of cows with other biomarkers from the Herd NavigatorTM system. mP4 1—milk progesterone ≤ 15.5 ng/mL; mP4 2—milk progesterone > 15.5 ng/mL; BHB 1—β-hydroxybutyrate in milk ≤ 0.06 mmol/L; BHB 2—β hydroxybutyrate in milk > 0.06 mmol/L; LDH 1—milk lactate dehydrogenase ≤ 27 μmol/min; LDH 2—milk lactate dehydrogenase > 27 μmol/min; MY 1—milk yield ≤ 31 kg/day; MY 2—milk yield > 31 kg/day; BCS1 = 2.5–3.0; BCS2 ≥ 3.0–3.5; BCS3 ≥ 3.5–4.0.
Agriculture 12 01834 g002
Figure 3. Body condition score correlations with investigated indicators of dairy cows that were eventually diagnosed as healthy or diseased. *** p < 0.001; ** p < 0.01; * p < 0.05. mP4—milk progesterone; BHB—milk β-hydroxybutyrate; LDH—milk lactate dehydrogenase; MY—milk yield; TI—number of inseminations.
Agriculture 12 01834 g003
Table 1. Means and standard errors of the mean of biomarkers based on the pregnancy status of cows from the day of oestrus to 7 days post-oestrus.
Indicator/BiomarkerStatus of PregnancyMSE95% CI
Lower BoundUpper Bound
BCS, score Non-pregnant a3.20 ***,b0.0193.163.24
Pregnant b3.29 ***,a0.0193.253.33
mP4, ng/mL Non-pregnant12.89 ***,b0.60011.7114.07
Pregnant23.82 ***,a0.25523.3124.32
LDH, µmol/min Non-pregnant25.01 **,b0.96223.1126.90
Pregnant21.56 **,a0.71520.1522.97
BHB, mmol/LNon-pregnant0.060.0010.0570.063
Pregnant0.060.0010.0560.059
MY, kg/day Non-pregnant30.54 ***,b0.50329.5531.52
Pregnant25.28 ***,a0.35724.5825.99
Different letters (a and b) indicate statistically significant differences between classes (*** p < 0.001, ** p < 0.01). BCS—body condition score; mP4—milk progesterone; LDH—milk lactate dehydrogenase; BHB—milk β-hydroxybutyrate; MY—milk yield. M—mean; SEM—standard error of the mean.
Table 2. Means and standard errors of the mean of biomarkers based on the body condition score from the day of oestrus to 7 days post-oestrus.
Indicator/BiomarkerClass of BCSMSE95% CI
Lower BoundUpper Bound
mP4, ng/mL2.5–3.016.700.86514.9918.41
3.0–3.518.050.58016.9119.19
3.5–4.019.150.74017.6920.61
LDH, µmol/min2.5–3.027.161.35624.4829.84
3.0–3.521.81 **,c0.77920.2723.34
3.5–4.023.32 **,b1.28920.7725.86
BHB, mmol/L2.5–3.00.060.0010.060.06
3.0–3.50.060.0020.060.06
3.5–4.00.060.0010.060.06
MY, kg/day2.5–3.032.18 ***,b,c0.72230.7633.61
3.0–3.529.24 ***,a,c0.41928.4230.07
3.5–4.022.67 ***,a,b0.51121.6623.68
Different letters (a, b and c) indicate statistically significant differences between classes ** p < 0.01, *** p < 0.001. BCS—body condition score; mP4—milk progesterone; LDH—milk lactate dehydrogenase; BHB—milk β-hydroxybutyrate; MY—milk yield. M—mean; SE—standard error of the mean; 95% CI—the 95% confidence interval.
Table 3. Means and standard errors of the mean of biomarkers registered from the day of oestrus to 7 days post-oestrus based on the number of inseminations.
Indicator/BiomarkerClass of BiomarkerMSE95% CI
Lower BoundUpper Bound
BCS 2.5–3.02.20 ***,c0.1291.942.46
3.0–3.52.61 ***,c0.1062.402.82
3.5–4.03.82 ***,a,b0.1953.434.20
mP4≤15.53.10 **,b0.2212.663.54
>15.52.69 **,a0.0862.522.86
BHB≤0.062.760.0902.592.94
>0.062.910.2382.433.38
LDH≤272.690.0942.502.87
>273.040.1802.693.40
Different letters (a, b and c) indicate statistically significant differences between classes ** p < 0.01, *** p < 0.001). BCS—body condition score; mP4—milk progesterone; LDH—milk lactate dehydrogenase; BHB—milk β-hydroxybutyrate.
Table 4. Means and standard errors of the mean of the body condition score based on the health status of cows.
BiomarkerDiseaseMeanSEM95% CI
Lower BoundUpper Bound
BCS, scoreHealthy a
n = 483
3.26 *,d0.0153.233.28
Subclinical ketosis b
n = 21
3.13 *,c0.0752.973.29
Subclinical mastitis c
n = 26
3.43 ***,d,*,b0.0703.283.57
Metritis d
n = 67
3.12 ***,c,*,a0.0423.043.21
Different letters (a, b, c and d) indicate statistically significant differences between classes (* p < 0.05, *** p < 0.001).
Publisher’s Note: MDPI stays neutral with regard to jurisdictional claims in published maps and institutional affiliations.

