Article

Development of Heat Stress Forecasting System in Mechanically Ventilated Broiler House Using Dynamic Energy Simulation

1
Research Institute for Agriculture and Life Sciences, College of Agriculture and Life Sciences, Seoul National University, 1 Gwanak-ro, Gwanak-gu, Seoul 08826, Korea
2
Department of Rural Systems Engineering, Research Institute for Agriculture and Life Sciences, Global Smart Farm Convergence Major, College of Agriculture and Life Sciences, Seoul National University, 1 Gwanak-ro, Gwanak-gu, Seoul 08826, Korea
3
Research Institute of Green Eco Engineering, Institute of Green Bio Science and Technology, Seoul National University, 1 Gwanak-ro, Gwanak-gu, Seoul 08826, Korea
4
Department of Agricultural and Biosystems Engineering, College of Engineering, Mariano Marcos State University, Batac 2906, Philippines
5
Agriculture, Animal & Aquaculture Intelligence Research Centre, Electronics and Telecommunications Research Institute, 218 Gajeong-ro, Yuseong-gu, Daejeon 34129, Korea
6
National Center for AgroMeteorology (NCAM), Seoul National University, 1 Gwanak-ro, Gwanak-gu, Seoul 08826, Korea
*
Author to whom correspondence should be addressed.
Agriculture 2022, 12(10), 1666; https://doi.org/10.3390/agriculture12101666
Submission received: 26 August 2022 / Revised: 5 October 2022 / Accepted: 7 October 2022 / Published: 11 October 2022
(This article belongs to the Special Issue Advances in Agricultural Engineering Technologies and Application)

Abstract

:
The internal rearing environment of livestock houses has become an important issue in the last few years due to the rapid increase in meat consumption. As the number of days of heat waves increase continuously, problems caused by abnormal weather changes steadily occurred. Thus, the main goal of this study is to develop a technology that can automatically calculate heat stress for livestock by considering weather forecast data. Specifically, a web-based heat stress forecasting system for the evaluation of heat stress in broilers was developed. The field experiments were carried out at the selected broiler house to measure and analyze the external weather, the internal environment, and the ventilation flow rate of fans used in tunnel ventilation. The developed model was validated by comparing the field and simulated thermal environment values. Based on a reliable model, Land-Atmosphere Modeling Package (LAMP) weather forecast data was used to show the stress index on the internal rearing environment with a heat stress index suitable for South Korea. When the users input the farm location, structure and equipment, and rearing information, users responded after receiving heat stress from the broiler raised in a mechanically ventilated broiler house.

1. Introduction

Due to the increase in meat consumption, domestic livestock production continues to increase from KRW 19.1 trillion (USD 13.2 billion) in 2015 to KRW 20.3 trillion (USD 14.0 billion) in 2020, and the proportion of livestock production in agriculture and forestry also increased from 37.6% to 39.0% [1]. The poultry industry is divided into the broiler, a chicken raised for meat, and the laying hens, a chicken raised to produce edible eggs. The recent record showed that in Korea, the broiler industry accounts for 10.0% of the total livestock production in 2020. Moreover, in the same year, the per capita chicken consumption in Korea continuously increased from 13.4 kg in 2015 to 14.7 kg [2]. As the consumption of poultry products has steadily increased, the number of rearing birds per unit area has increased compared to the number of farm households. However, the current broiler houses lacked the production application of cutting-edge technologies such as ICT and lack of production. In these situations, the birds tend to have a higher mortality rate due to infections such as Avian Influenza (AI) during the cold season, and heat waves during the hot season.
The climate change scenario RCP (Representative Concentration Pathways) 8.5, which was a case where carbon emission reduction was not implemented as in the current trend, predicted that the heat wave in South Korea will increase by about three times in 2050. In fact, the temperature analysis reported Korea Meteorological Administration (KMA) in 2020 showed that the average annual temperature in the 2010s continuously increased to 13 °C compared to the 1980s (12.2 °C), the 1990s (12.6 °C) and the 2000s (12.8 °C) [3]. This trend reduces immunity to livestock and increases the incidence of diseases, increasing mortality rate and a decrease in productivity. A heat wave, by definition, refers to abnormal climates causing very hot weather. In South Korea, the KMA issued a ‘heat wave warning’ if the daily maximum temperature is predicted to last more than 33 °C for two days or more, and a ‘heat wave alert’ if it is predicted to last more than 35 °C. The number of days where heatwaves occurred also tends to increase along with the rise in average temperature in South Korea, and in particular, the average number of heatwave days has changed from 10 to 15.5 as of 2010. The highest temperature in 2018 in South Korea was 41 °C, and the average number of days of heatwave was 31.5 days [4].
So, a response to climate change is necessary for the livestock industry. Whereas, the average number of heat wave days in the Jeollabuk-do region was found to be 39.9 days, which accounts for 27.3% of domestic meat production [5]. The Jeollabuk-do region, where a lot of livestock were raised, has a high mortality rate of 42% compared to other regions. As an example, over 420,000 (chickens account for 97%, ducks 2.5%, and pigs 0.5%) livestock died in a 5 days continuous heat wave in July 2018 [6]. Most of this livestock was raised in a very dense internal rearing environment, so they have weak basic immunity and are vulnerable to stress, which often leads to death when the temperature rises. Specifically, the temperature adaptability of chickens is very low compared to other livestock, so the problem of heat stress in the summer poses a serious threat to the poultry industry. Thus, scientific actions against climate change are necessary to reduce the production risk of chickens.
In the situation where the climate change problem persists, a web-based heat stress forecasting simulator was developed for the evaluation of heat stress in the broiler house.
There are recent studies that continue to develop a heat stress index for poultry directly affected by high temperatures. Usually, most studies consider regional characteristics and the thermal status of chickens by correcting the coefficient of previously developed indices. In addition to considering the air temperature and humidity inside the house, activity [7], body weight gain [8], black glove temperature [9], and feed requirement [10] were additionally considered. Ha et al. predicted a heat stress index using external weather conditions such as air temperature and enthalpy [11]. These latest studies may better represent the thermal environment of chickens, but they have the disadvantage of not being able to preemptively respond because they need to understand the heat stress of chickens through real-time monitoring. In the study, through field experiments, factors causing heat stress in livestock were analyzed, and the model was verified using internal and external thermal environment values. Based on a reliable model, weather forecast data were used to show the degree of stress on the internal rearing environment with a heat stress index suitable for South Korea, and a system development study was conducted to provide information to users by web service. Previously, related users responded after receiving heat stress from chickens, but this study is meaningful in that it can automatically calculate the heat stress of livestock according to the weather forecast and provide it to farmers in advance.

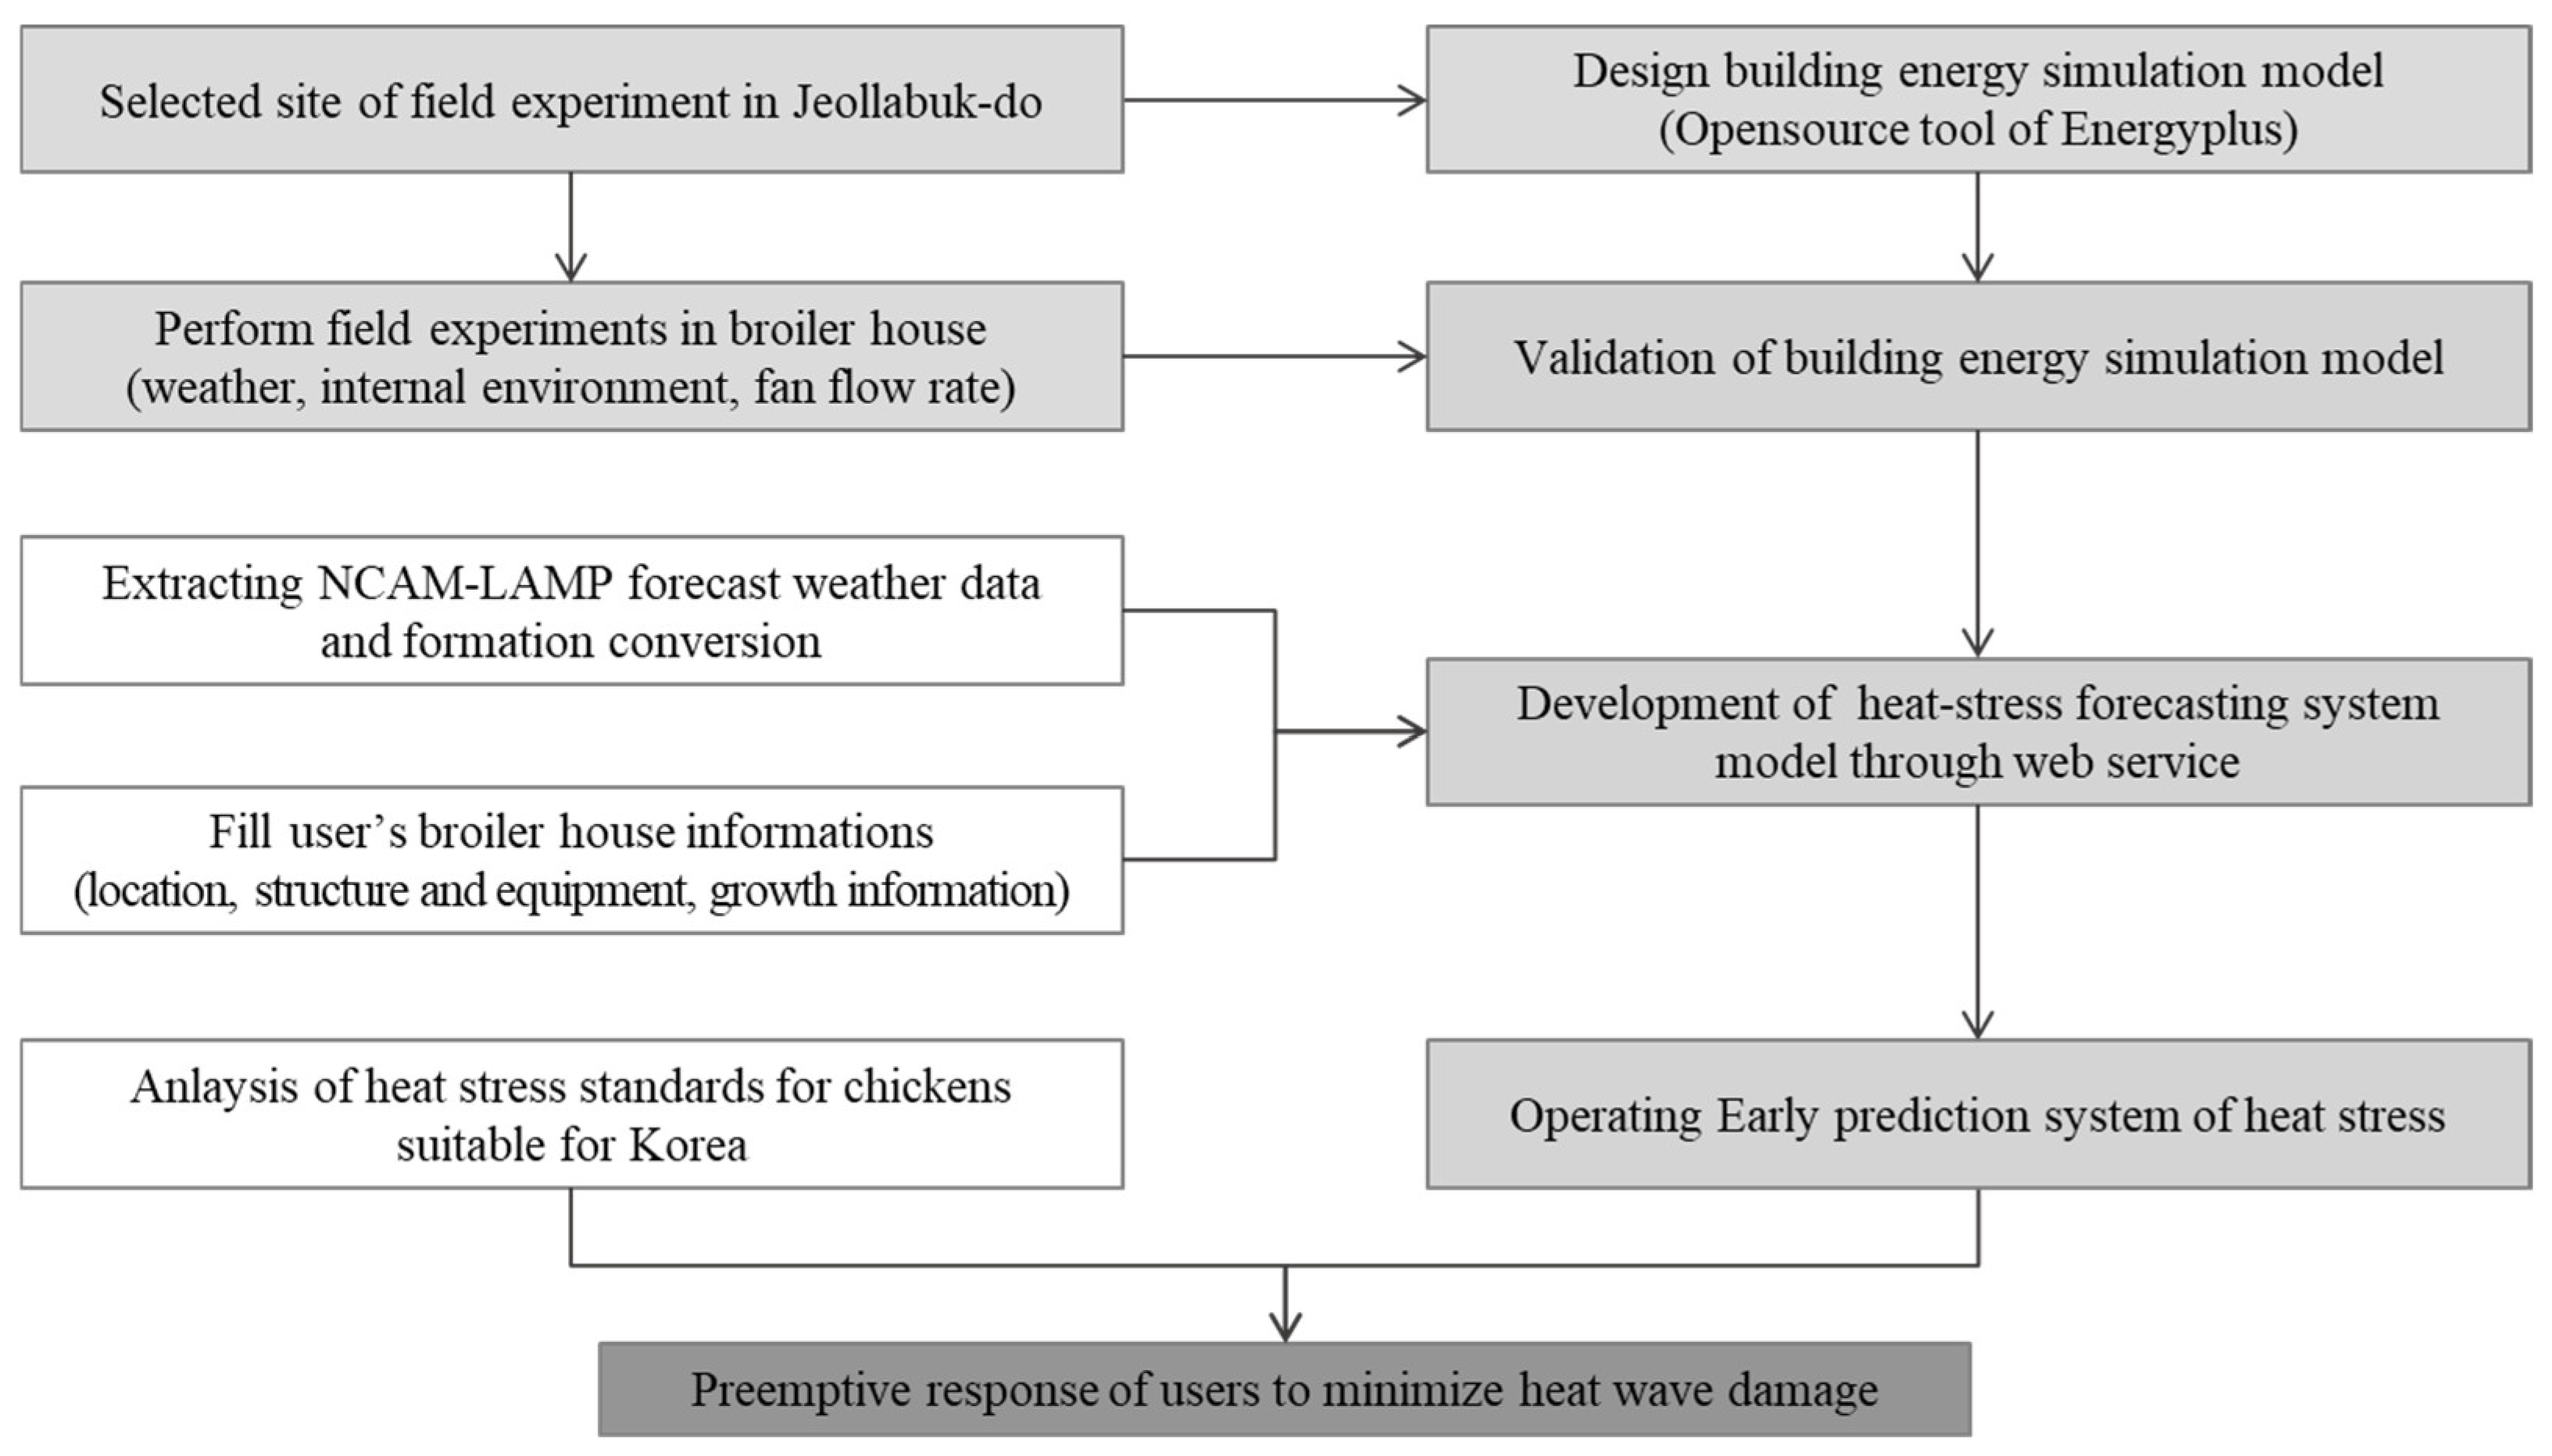
2. Materials and Methods
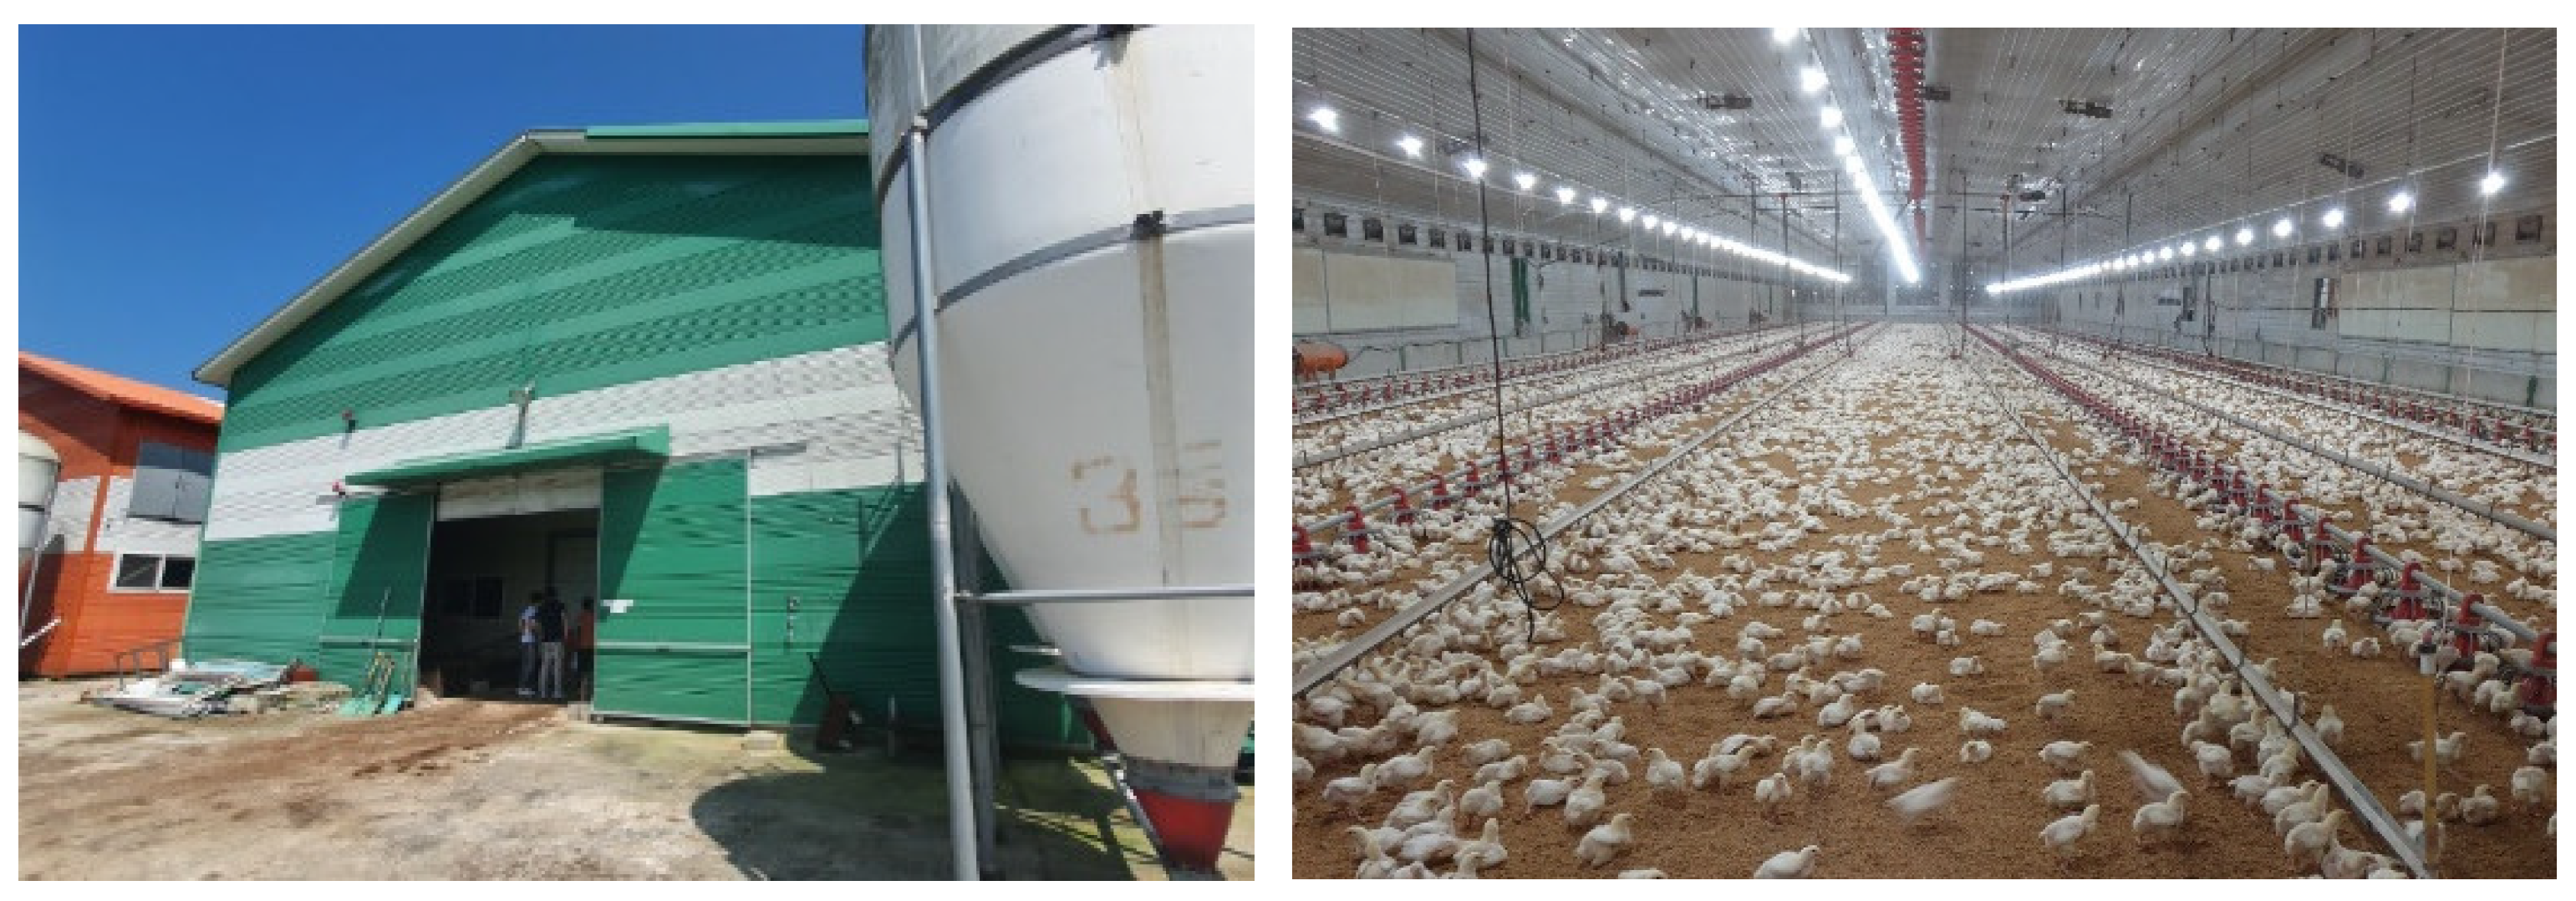
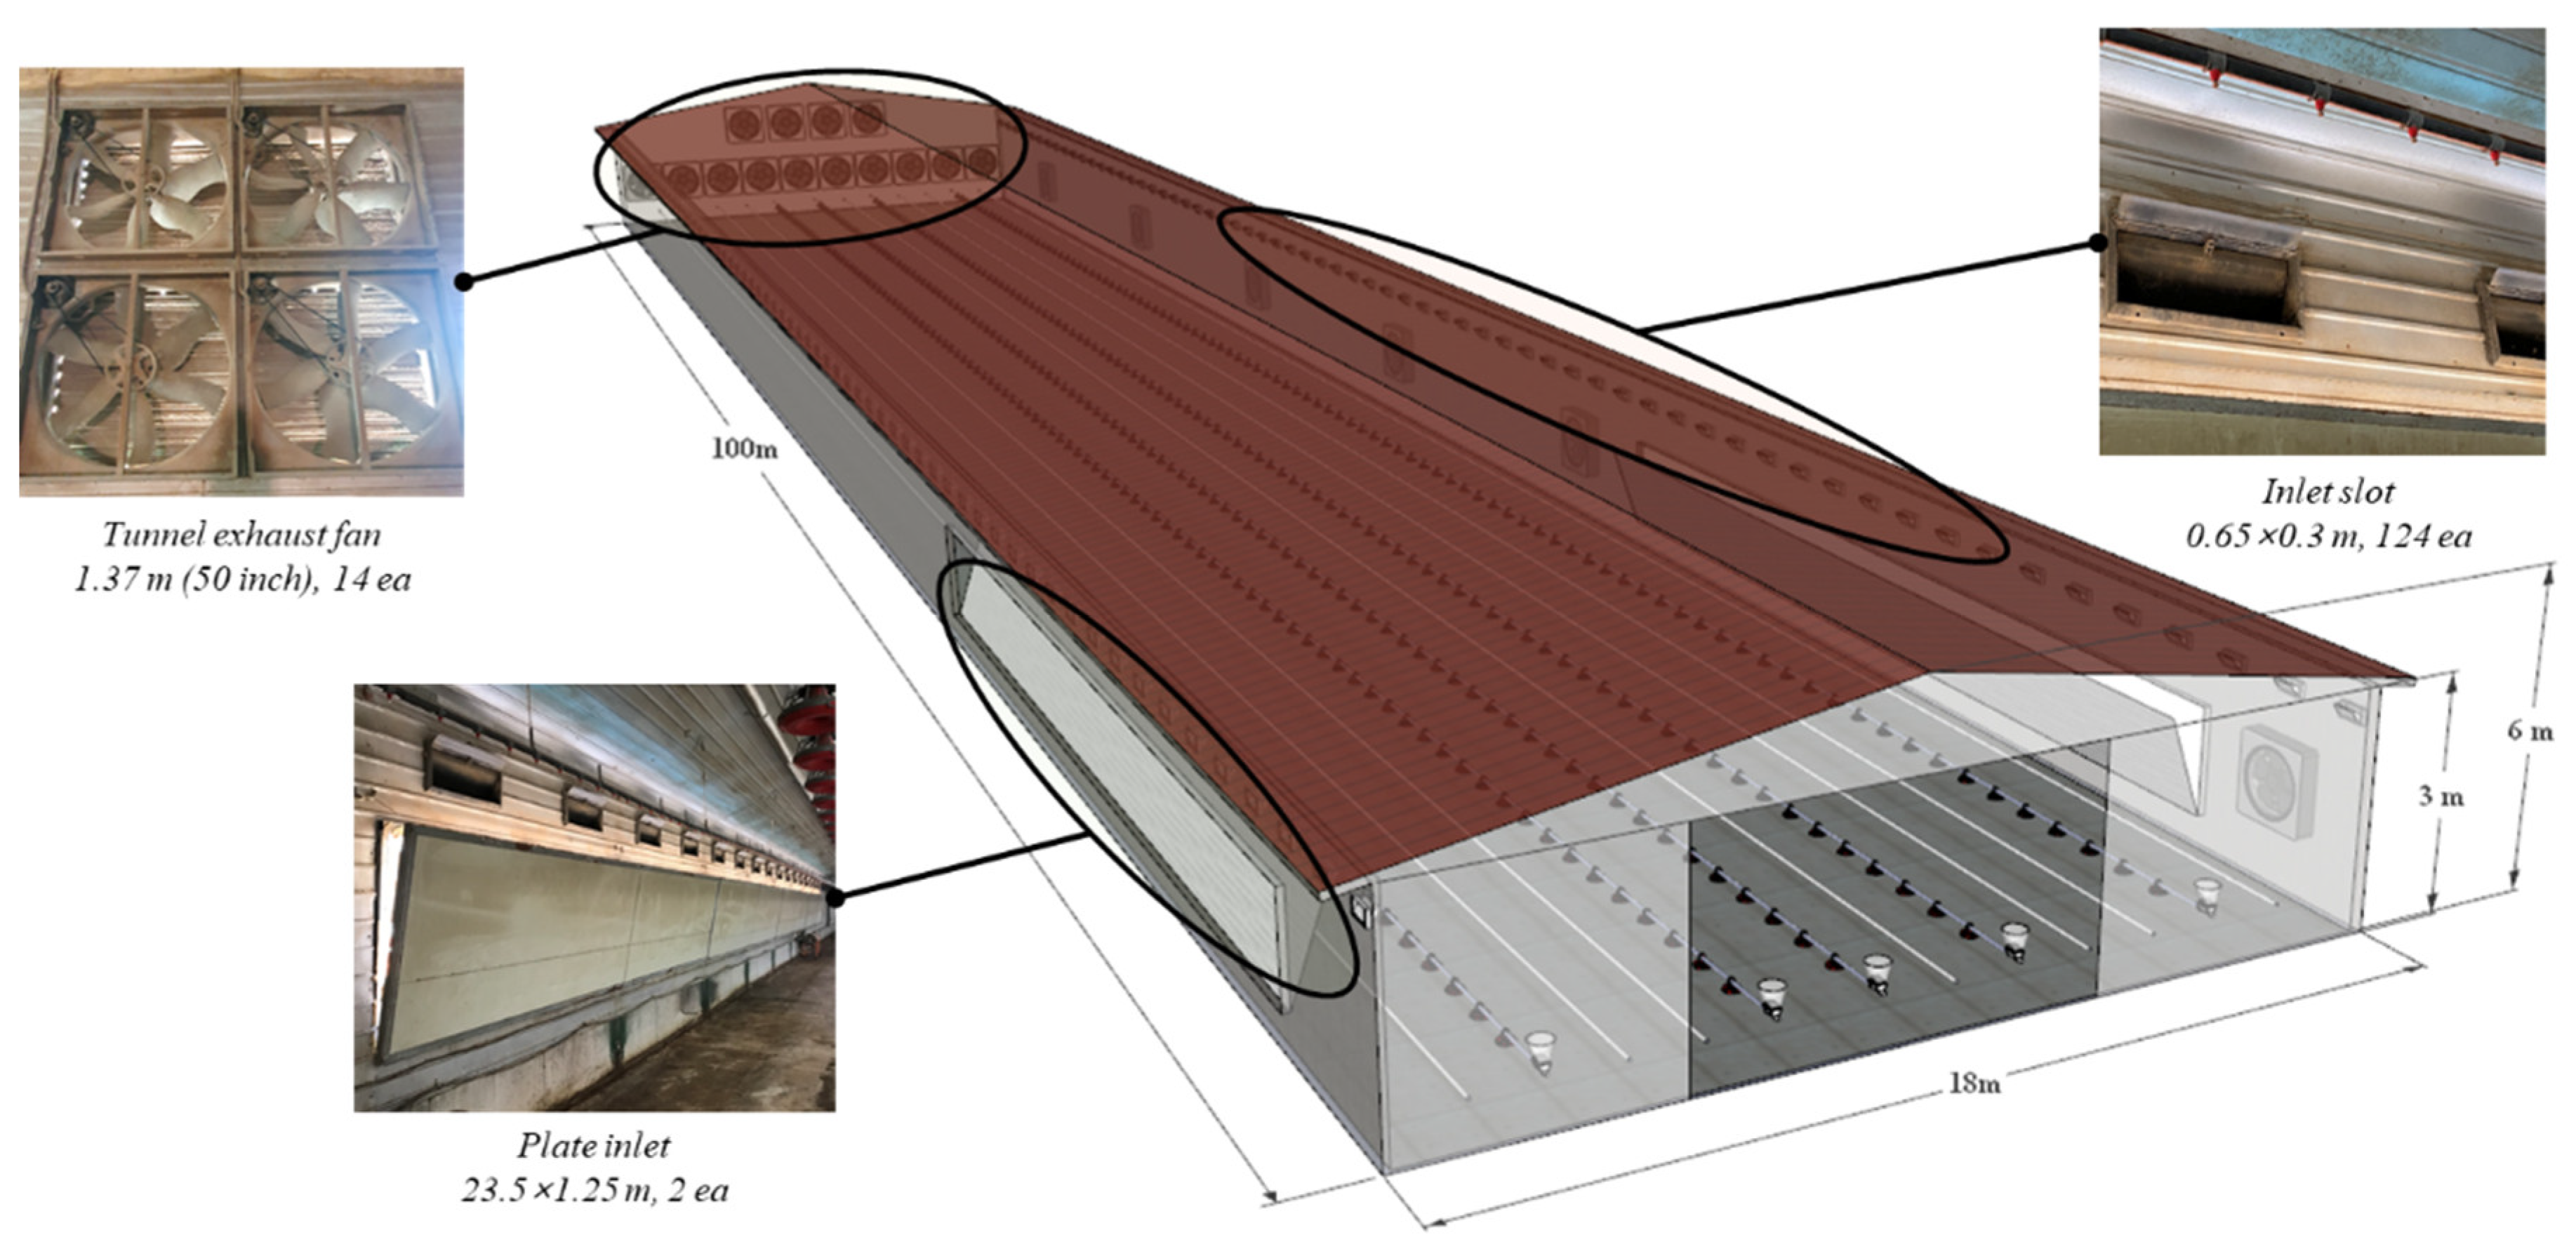
The overall process of establishing a heat stress forecasting system for broilers to improve the internal rearing environment exposed to abnormal climates is shown in Figure 1. First, a broiler house in Jeollabuk-do was selected as the experimental site, and various energy-related factors were collected through field experiments. In addition, the internal environment, according to local weather data and actual fan ventilation rate were measured. The structure of the house, the type of envelope, and the growth environment conditions were also investigated to design the energy model of the house. The model was designed to simulate the internal and external flow of energy according to the time step by considering the sensible heat and latent heat generated by the chickens. The accuracy of the model was secured through statistical indicators using the previously measured field test data.
Next, to establish a service that automatically provides chicken heat stress information to users, a forecasting system was developed to calculate an energy model according to the user’s farm information by receiving high-resolution weather forecast data from National Center for AgroMeteorolgy—Land Atmosphere Modelling Package (NCAM-LAMP). The input variables, such as livestock structure, environmental facility conditions, and livestock growth information, are needed for the energy model. And heat stress index was calculated one day and two days after the forecast. Among the heat stress index developed by researchers in the past, the heat stress index suitable for South Korea was selected.

2.1. Research Site

The target broiler house is located in Deokho-ri, Yeonggwang-eup, Yeonggwang-gun, South Korea (Latitude: 35.277, Longitude: 126.511, Elevation 85 m). The building was 18 m in width, 100 m in length, 3 m in side height, and 6 m in ridge height, and 34,000 broilers were raised every rearing cycle. The duration of one rearing cycle was about one month, and the average initial and shipment weights were 45 g and 1.7 kg, respectively. The average daily growth rate during the rearing cycle was about 50 g to 60 g.
The target broiler house used negative pressure forced ventilation where cross ventilation was applied in winter, tunnel ventilation in summer, and another ventilation was used by changing the two ventilators in order to remove the heat remaining in the house in the changing season when the outside air is lower than in summer. Cross ventilation is a method in which an exhaust fan was installed on one side along the side wall of the house, and an inlet was installed on the other side so that the air flows in the width direction of the house. On the other hand, in the tunnel ventilation, exhaust fans were installed on one side along the length of the house and an inlet is installed on the other side. Due to the high ventilation flow rate, it was mainly applied as a ventilation method in summer due to the effect of lowering the effective temperature. In this ventilation method, the temperature difference between the air inflow side and the discharge side was relatively large. In tunnel ventilation, the inlet for external air with a dimension of 23.5 m × 1.25 m was installed at the side wall. The tunnel exhaust fan (Euroemme EM50; Munters, Sweden) has a propeller diameter of 1.27 m and a maximum flow rate of 42,125 m3/h. A windbreak was installed 3.0 to 4.0 m in front of the tunnel exhaust fan to prevent dust and odors emitted outside the facility from spreading to nearby villages or damaging crops. Figure 2 and Figure 3 showed the external view and internal structure of the target farm.

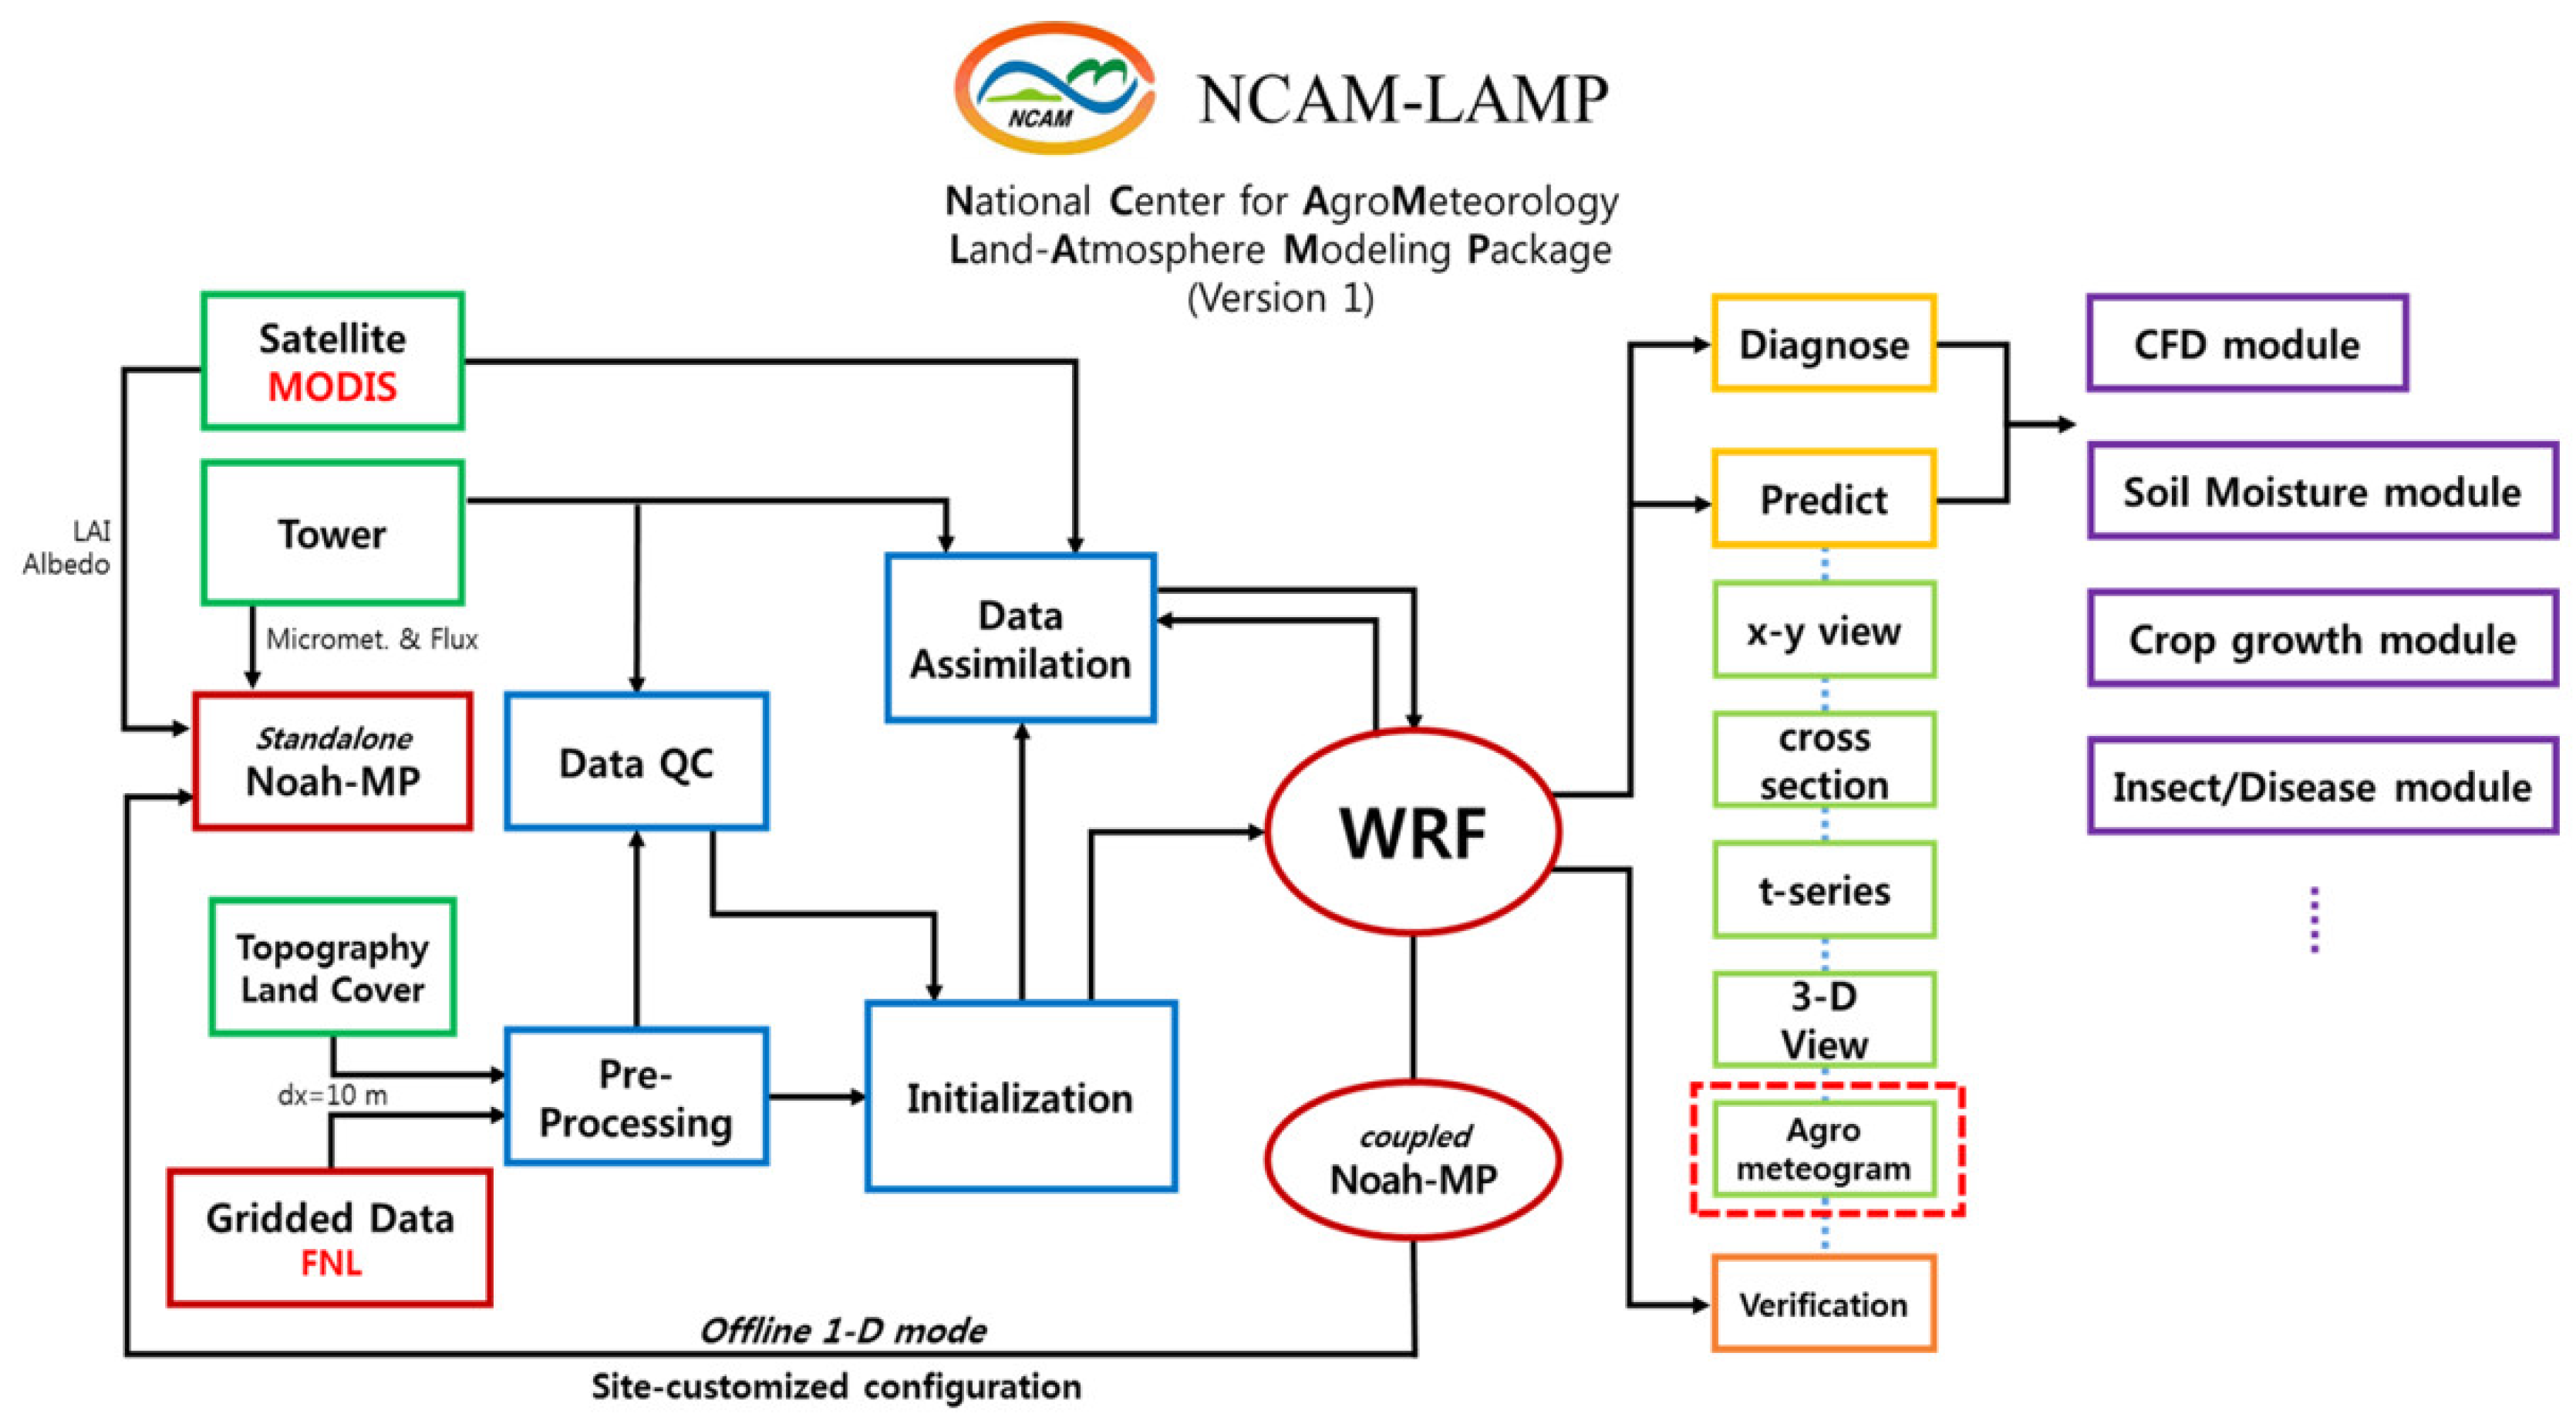
2.2. NCAM-LAMP Weather Forecast Data

In order to evaluate the heat stress of livestock, it is necessary to calculate the internal environment through dynamic energy simulations. In accordance with ISO 13790 process (2008), the meteorological data was used in advance to check the local climatic condition of the building before entering the building information [12]. Buildings, including livestock houses, verified the performance from the planning stage through the energy performance evaluation program. The weather conditions had the greatest influence on the calculation of energy loads aimed at appropriate indoor conditions. The heating and cooling demand (kWh/m2a) may change depending on the outdoor temperature, wind speed, wind direction, and precipitation, which has a significant impact on heat loss due to the outer wall, roof, floor, window, and door of the building. These factors were found to have a direct effect on heat loss according to the amount of ventilation. In addition, the amount of solar radiation was directly related to the amount of energy that the building can acquire and acted as an important variable in determining the energy load. Therefore, for precise building energy analysis, energy analysis should be performed based on meteorological data within the target area. The meteorological data mentioned here was basic input data for the evaluation of building energy and building environmental performance and was various data of 8760 h—365 days.
The NCAM developed the agricultural and forestry support numerical forecasting model based on the Weather Research and Forecasting (WRF)/Noah-MP Model, which regularly produces and provides weather, vegetation, and soil forecasting information with a high resolution of less than 1 km in South Korea. This agricultural support numerical forecast model was built in the Land Atmosphere Modelling Package (LAMP) (Figure 4) [13]. To support customized weather forecasting, medium to long-range weather/climate information in agriculture, forestry, and livestock industries are produced, and high-resolution decision-making information on the target area is provided to local governments and individual workers (e.g., Hong et al., 2021 [14]). LAMP produces forecast data not only for traditional meteorological variables such as air pressure, temperature, wind, humidity, and precipitation but also for various variables such as soil temperature and soil moisture, carbon dioxide, PM10, and PM2.5. Therefore, it is a practical option to use the LAMP meteorological data in order to inform users of the possibility of heat damage in advance and to respond preemptively.
The LAMP was validated for the temperature and relative humidity at a height of 2 m and wind speed at a height of 10 m in the Jeollabuk-do region. Data from 19 AWS branches located in the region were collected, and model grid data were found nearby, and data were performed at 1-h intervals from 23 August 2020 to 19 September 2020. The Root Mean Square Error (RSME) of temperature, relative humidity, and wind speed were analyzed as 2.52, 11.0, and 3.54, respectively. The LAMP is now produced twice a week, and the forecast period per episode is 12 days corresponding to the medium-range weather forecast. In addition, the temporal resolution is 30 min, and the spatial resolution is about 800 m.

2.3. Building Energy Simulation (BES)

Quantitative evaluation of building energy load is required to prepare measures for the energy demand and efficient use of buildings. In particular, in the case of livestock facilities, the insulation properties are significantly lower than that of general residential houses. The internal environment may be changed by a heat source having a heat capacity, such as wall insulation material, and the heat transfer process reacts sensitively to weather data. Therefore, the building energy simulation (BES) was used to calculate the thermal energy flow of the broiler house using a numerical analysis method through the dynamic load calculation method that changes with time. The BES can evaluate the overall performance of various design proposals in the architectural field. In addition, it can be applied to the improvement of the system because it is possible to continuously evaluate the energy performance according to the operation and maintenance of the building after its construction.
Studies have been performed to analyze the internal environment of livestock like pigs and broilers using dynamic energy simulation [15,16,17,18,19,20,21]. In previous studies, indoor environmental conditions were analyzed, but thermal loads were additionally analyzed [15,16,18,19], and energy consumption was calculated [20,21]. Panagakis and Axaopoulous analyzed animal stress indexes to determine fogging strategies for pig rearing [17]. Mogharbel et al. analyzed environmental control as a stress index to properly control the thermal comfort of sow farrowing rooms [20]. Among the previous dynamic energy model studies, most house types were studied mainly for pig houses. And studies that analyzed the heat stress evaluation did not verify the model using the results of field experiments [22,23,24]. Moreover, a few studies simply focused on case analysis by factor. Therefore, it is necessary to evaluate the thermal environment inside the house using reliable results of the verified model. Moreover, if it is provided to users in connection with the service, a better rearing environment can be achieved.
In this study, Energyplus (Version 9.5.0, DOE, USA) was used to analyze the energy load and energy flow in the house. This simulation tool is a dynamic energy analysis engine created by the US Department of Energy by combining the strengths of BLAST, DOE-2, and COMIS. Energyplus has input items for various building and HVAC system components, and in particular, it performs calculations simultaneously through feedback between the building, air conditioning system, and heat source equipment. Among the programs verified according to the ASHRAE Standard 140-2007, the Energyplus software was used mainly due to open source and flexible source code modification, so it is easy to connect with the interface [25]. Existing commercial programs are difficult to frequently perform modeling and simulation according to field needs, and their licenses are limited, making them inappropriate to extend to services provided for general users. Therefore, using Energyplus, a model was developed to analyze the energy flow of the house building and determine the high-temperature stress of chickens through the air environment inside.

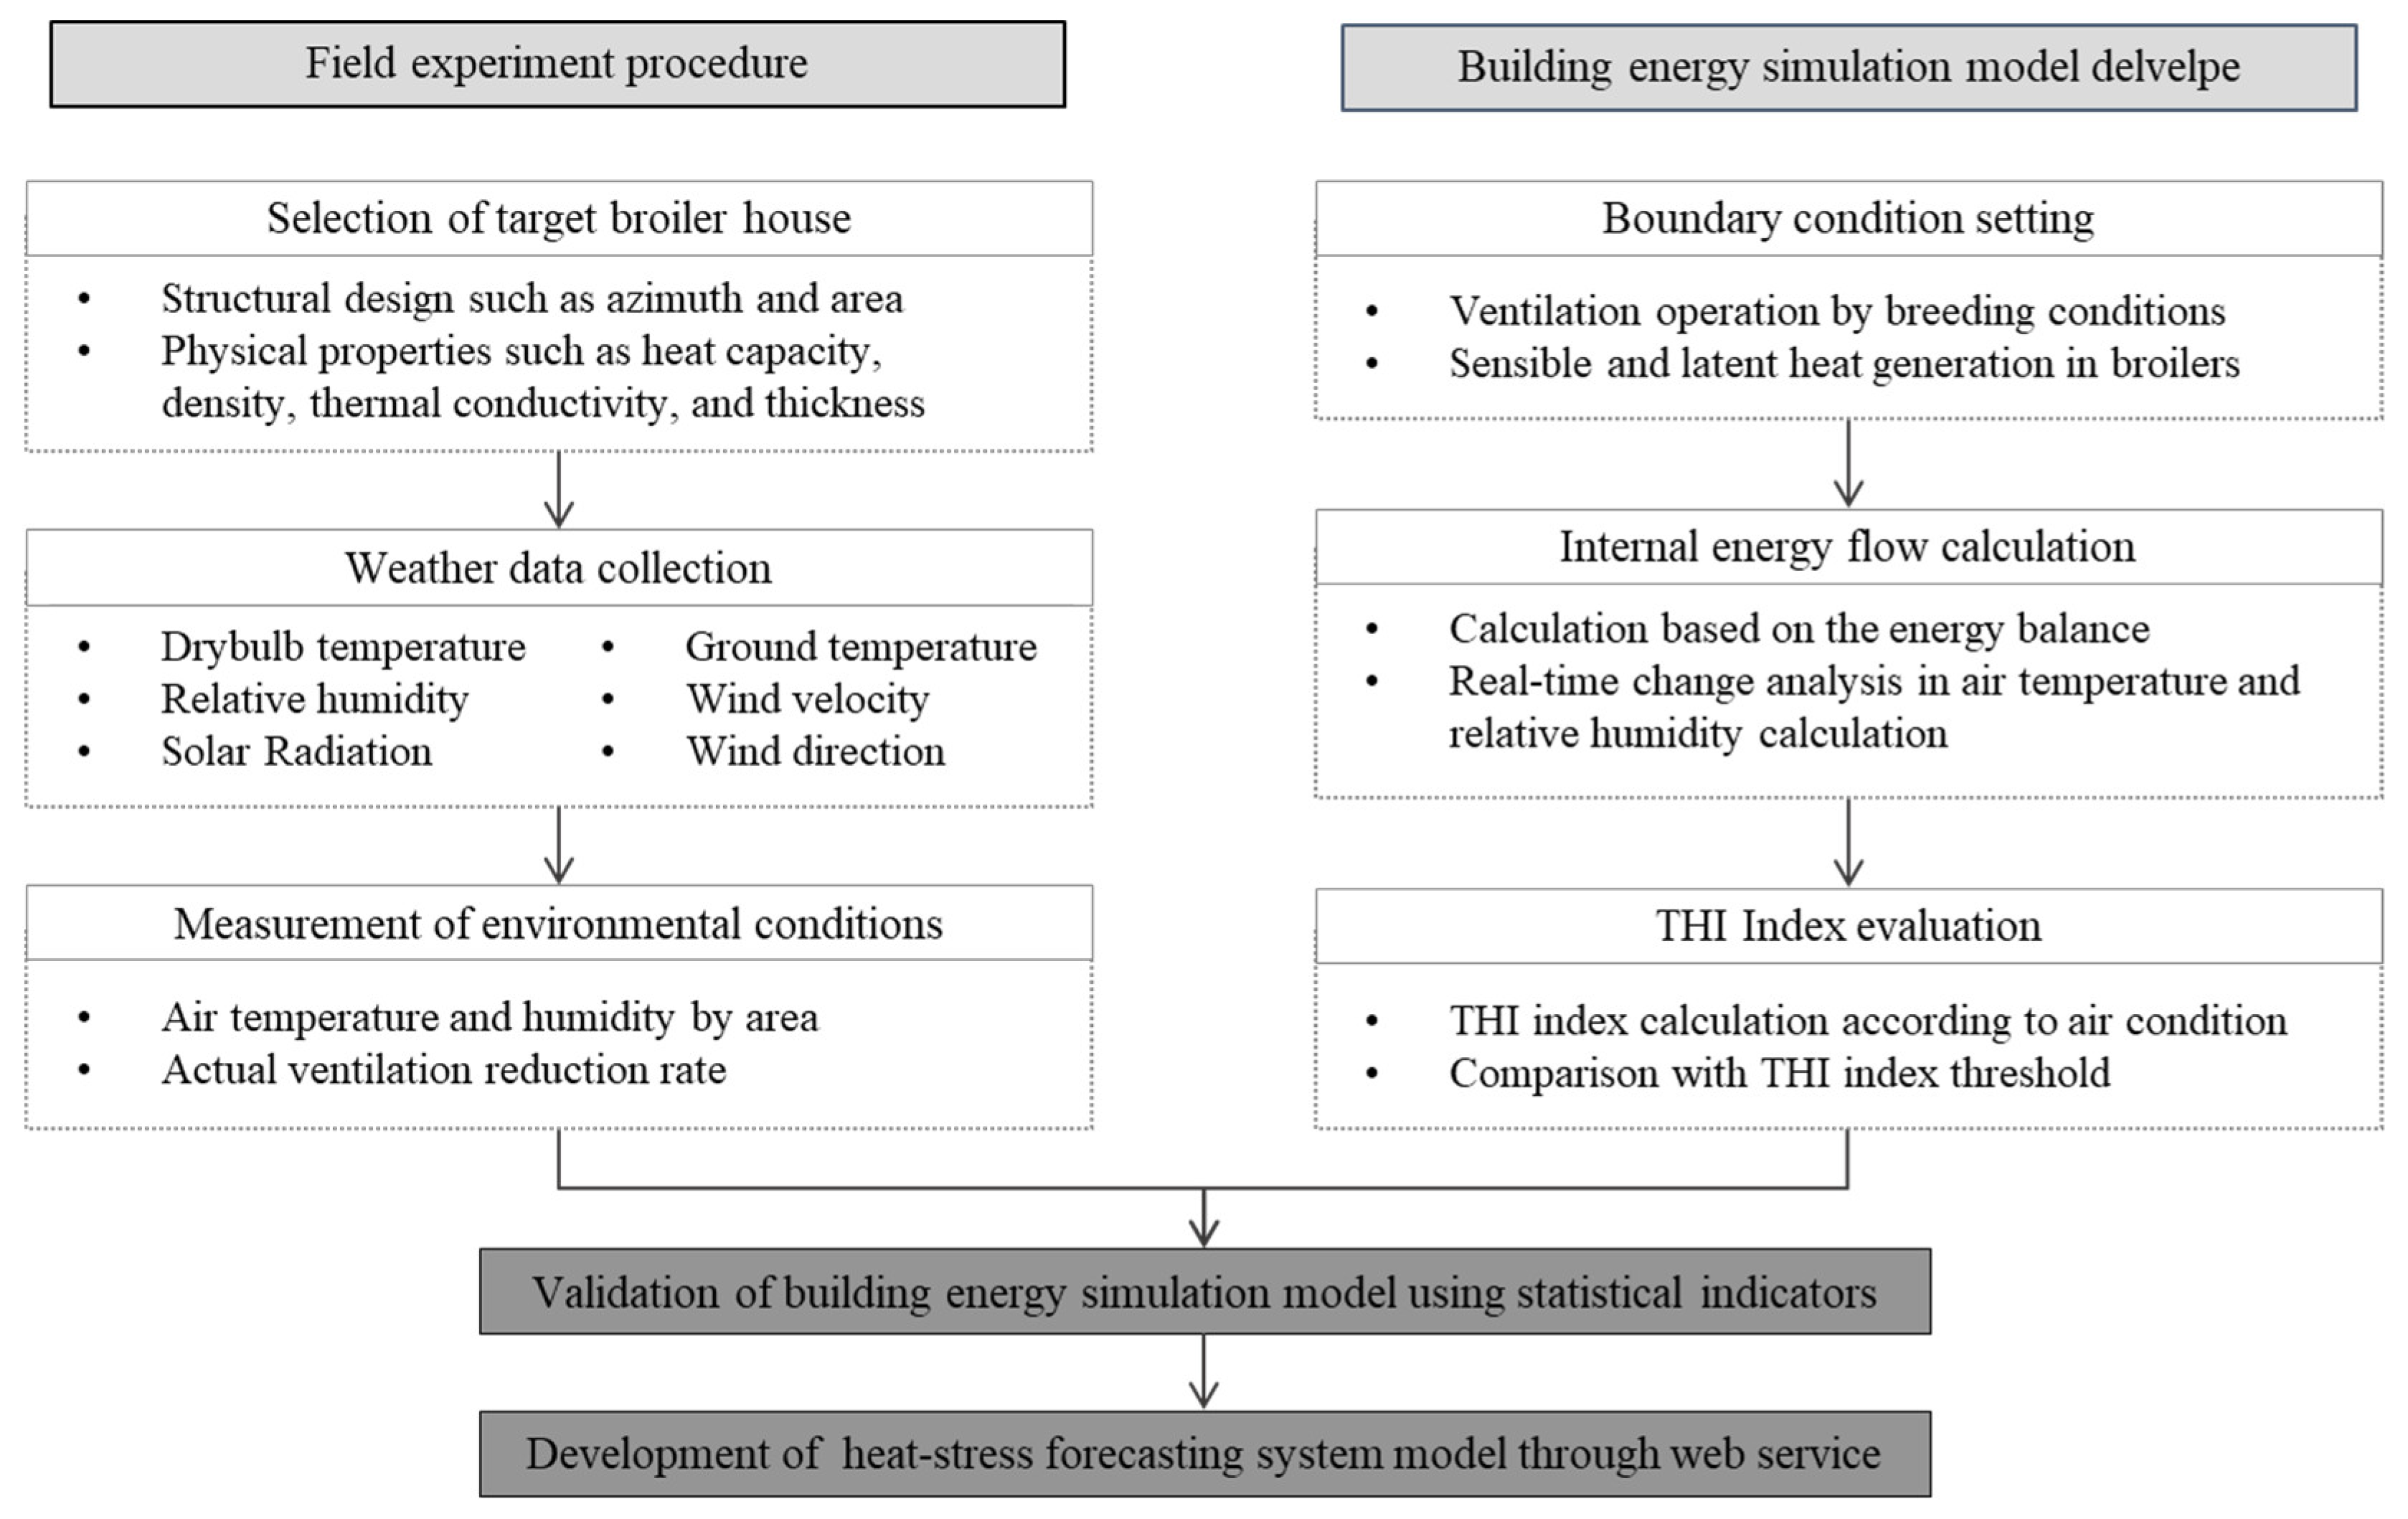
2.4. Field Experimental and Energy Model Developed Procedure

The heat stress calculation model for each environmental condition of broilers was developed through the following process (Figure 5). First, a broiler house was selected for the experiment, and meteorological data of the area where the broiler house was located was collected through a field experiment. In order to design the corresponding broiler house on the model, the structure and physical properties of the envelope were investigated. In addition, the summer growth environment conditions of the broiler were measured and reflected in the model. Next, to develop a dynamic numerical analysis model, the amount of sensible and latent heat generated by broilers and the ventilation operation plan was considered. In order to simulate the flow of energy inside and outside the house, the Air Heat Balance (AHB) algorithms adopted by Energyplus were used to calculate the air temperature and humidity over time. In addition, the reliability of the model was secured by comparing the values measured in the field with the results of model calculations using statistical indicators. The heat stress index of broilers according to the internal environmental conditions was expressed using the calculated air temperature and humidity values inside the house as variables. To prevent the death of livestock during the summer by using this energy model, a system was built that could provide a warning to users in case of an emergency by using weather forecast data as input data.

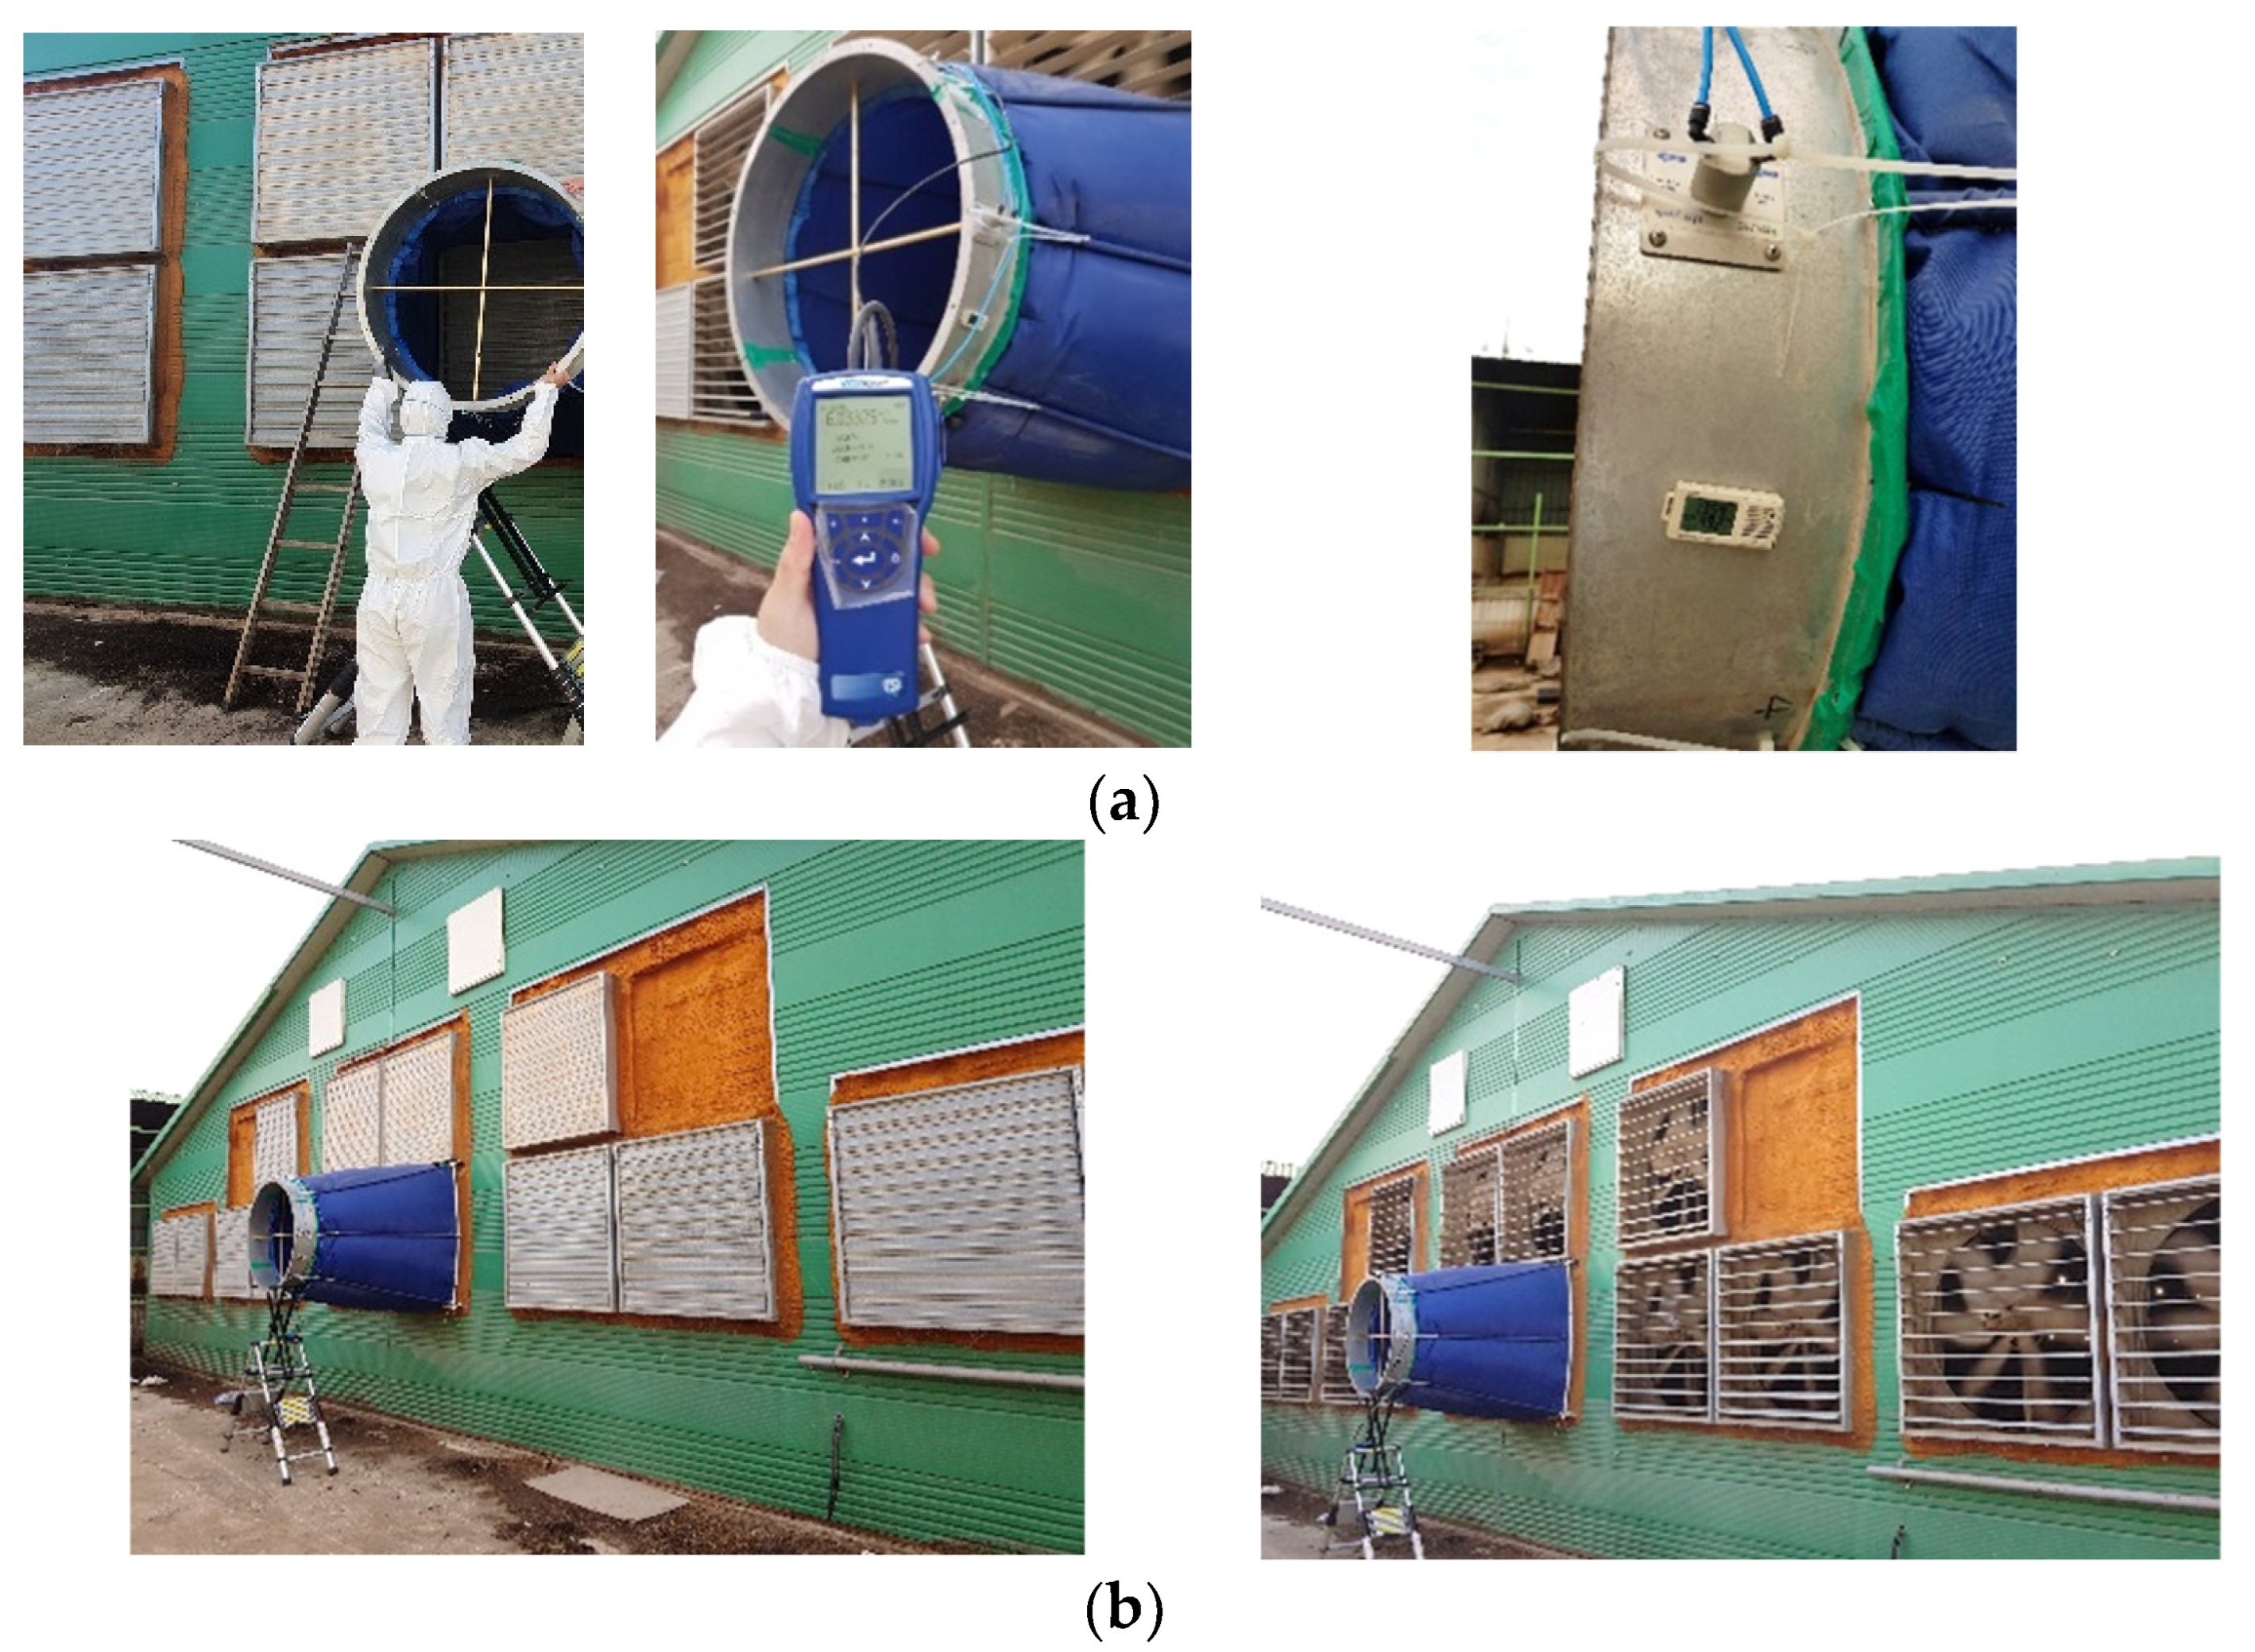
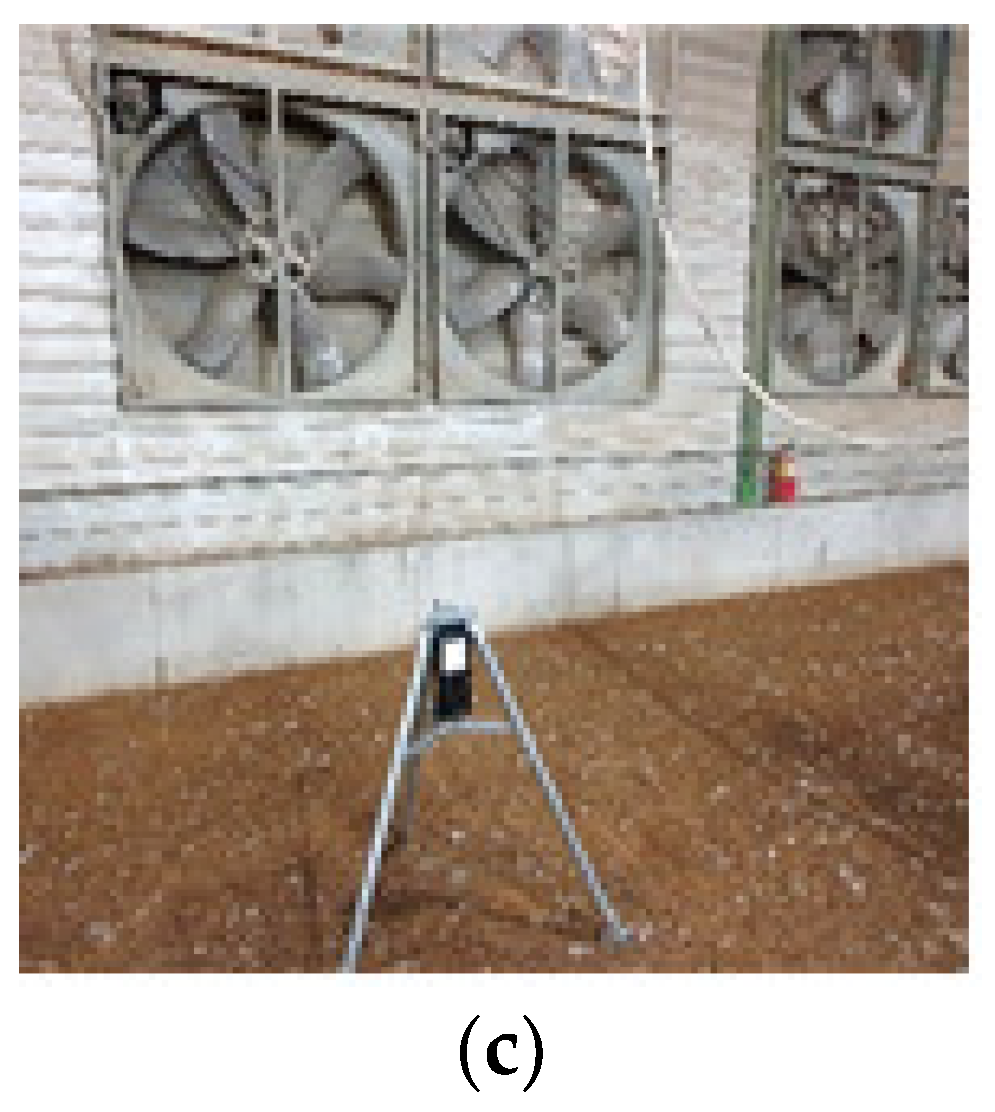
2.4.1. Field Experiment

The duration of the field experiment was done when the chicks weighed 50 g (25 September) until broiler weighed approximately 1.6 kg (28 October). External weather such as temperature, humidity, wind speed, etc. acts as major factors affecting the growing environment inside the facility. Therefore, the external weather at the target farm was measured at 5 min intervals, and Automated Synoptic Observing System (ASOS) data provided by the adjacent meteorological observatory where the target facility is located were additionally analyzed. For the analysis of the air environment in the broiler house, three rows of temperature and humidity sensors (a total of 12 sensors were installed at intervals of 20 m) were installed in the 18 m × 100 m house, and logging was performed every 5 min.
Since the actual air volume of the ventilation fan installed in the livestock facility may vary depending on the ventilation load inside the facility, such as the inlet conditions, the actual air volume of the ventilation fan installed in the target broiler house was measured using a micro-pressure measuring instrument (TSI DP-CALC Micro manometer, TSI Incorporated, Shoreview, MN, USA) (Figure 6). To measure the air volume, a prefabricated T-shaped (+) aero-flow meter with a pressure hole, and a duct of the same size as the tunnel fan was designed and manufactured so that the exhaust air can pass through the air volume meter. There are pitot tubes in the air volume meter, and the number and location of pitot tubes follow ANSI/AMCA Standard 210. According to the Bernoulli theorem, the dynamic pressure at the corresponding position was measured through a pitot tube and a pressure gauge through the difference between the voltage and the static pressure, and the flow rate was calculated. Assuming that the Bernoulli equation was followed, Equation (1) can be considered Equation (2) because P is equal to each other at the same atmospheric pressure and is zero or negligibly small in a streamlined flow. Therefore, the experiment was conducted by measuring the dynamic pressure for 1 min according to the operation of the ventilation system using a dynamic pressure measuring device and calculating the wind speed value under the relevant conditions. In this experiment, the difference between air flow rate and static pressure was measured while changing the number of tunnel fans operated, and the fan performance curve of the actual ventilation flow rate was derived.
P + ρ v 2 2 + ρ g h = P + q + ρ g h = c o n s t a n t
q = ρ v 2 2
The target experimental broiler house has 14 tunnel exhaust fans installed at the end wall. In theory, when forced ventilation is performed through the exhaust fan, the static pressure inside the facility is kept lower than the outside, so the difference between the external and the internal static pressure was measured. The capacity of a fan is generally determined based on the maximum flow rate, but when applied in the field, the flow rate of the fan varies depending on the structural characteristics of the surrounding environment such as ducts and dampers. As the resistance of airflow increases due to structural changes around the fan, the difference in static pressure between the inlet and the outlet increases, and the flow rate decreases. In other words, the difference in static pressure between the outlet and the inlet of the fan corresponds to a pressure to overcome the resistance of flow due to the surrounding structure. The fan performance curve refers to the static pressure difference upstream and downstream of the fan. The performance curve is a unique characteristic of a fan that remains the same when the fan shape, power required, and rotation speed are constant. These factors are an important consideration when designing and installing a fan. The manufacturer of the fan generally provides a design performance curve for the fan measured according to the corresponding criteria. However, it is known that the fan performance curve changes due to pressure drop ( Δ P ) due to surrounding structures or aging of the fan, and the fan performance curve at the maximum rotational speed can be approximated by a quadratic polynomial Equation (3).
The design fan performance curves typically show performance at standard air conditions corresponding to 101.3 kPa barometric pressure, 20 °C temperature, 50% relative humidity, and 1.20 kg/m3 density ( ρ ). To accurately estimate the performance in the field, it is necessary to perform the correction of the flow rate through the air temperature and density ( ρ d ) through the following Equation (4) [26]. The fan performance curve is a relational expression between static pressure and flow rate and is a converted formula considering the area of the target tunnel exhaust fan with a diameter of 1.4 m, as shown in Equation (5). The orifice formula is a formula commonly used to estimate the flow of fluid through the inlet and can be derived from the Bernoulli equation under the assumption of incompressible steady flow. When the cross-sectional area ( A ) changes due to the throttle, which rapidly changes the cross-section during fluid flow, Equations (6) and (7) are established by the Bernoulli equation and the continuity equation. By linking the two equations, the flow rate ( v 1 ) and the flow rate passing through the orifice ( v 2 ) are calculated as shown in the following Equation (8). Energy loss occurs due to the contraction and friction of the cross-section of the fluid passing through the orifice.
Δ P = c 0 + c 1 Q + c 2 Q 2
Δ P = ρ ρ d ( c 0 + c 1 Q + c 2 Q 2 )
Δ P = 67.553 + 61.877 v 7.3758 v 2
1 2 ρ v 1 2 + p 1 = 1 2 ρ v 2 2 + p 2
Q = A 1 v 1 = A 2 v 2
Q = A 2 v 2 = A 2 × 2 ( p 1 p 2 ) ρ [ 1 ( A 2 / A 1 ) 2 ]
Q = C D A 2 Δ P ρ

2.4.2. Building Energy Model Design

To develop a dynamic numerical analysis model, the structure of the target broiler house was first modeled. The size of the house was 18 m in width, 3 m in inside height, 6m in height, and 100 m in total length. As there was no drawing of the house, reference was made to the standard design drawing for broilers [27]. On the floor of the house, it is suggested to install two layers of moisture-proof film on the 150 mm rubble compaction, and install 50 mm discarded concrete and 200 mm reinforced concrete slabs on it. 150 mm and 100 mm sandwich panels are presented for the roof and wall surfaces, respectively. The broiler house analysis model to be used in the study was designed based on the broiler house construction method announced in the standard design drawing, and the structural properties of the model used as input data are as follows. (Table 1) The envelope input of the energy model was implemented using the “Material” and “BuildingSurface:Detailed” classes and the modeling used Sketchup 2019 to shape the house structure.
Ventilation methods applied to livestock houses can be divided into natural and forced ventilation. In the case of natural ventilation, the environment may be maintained by introducing external air without using additional energy. Meanwhile, in hot summer, a large amount of cooler external air was introduced using a forced ventilation tunnel fan, and in the case of high external temperature, air enters the opening where the cooling pad was used. The “ZoneVentilation:DesignFlowRate” class was used to implement the ventilation operation recommendations according to the age and internal air temperature recommended by the broiler house on the model. The actual ventilation measured experimentally was entered into the design flow rate factor, and the exhaust option was selected as the ventilation type.
In order to simulate the effect of the cooling pad, which is a cooling method that can lower the heat stress index by removing latent heat of the outside air introduced into the house, the cooling efficiency was confirmed through a literature survey. In summary, factors affecting the cooling pad efficiency include air flow rate, pad type and thickness, and circulation water amount. The airflow rate and the amount of water have a significant impact on the cooling efficiency of the cooling pad, and the type and thickness of the pad have less impact on the efficiency [28]. As the control period is long and the flow rate becomes larger, the temperature difference between the inlet and the outlet increases, and the air resistance increases when water is supplied [29]. In addition, the air that passed through the cooling pad was mixed vertically at the side of the house and then moved to the center, and the wind speed of the central aisle was higher than that of the side passage, showing a difference in ventilation rate [30]. The widely used design wind speed of about 1.5m/s of air passing through the cooling pad to adjust the internal and external static pressure difference of negative pressure ventilation. In addition, the type of pad used in the calculation is CELdek7090 (Munters, Sweden), with 60 L per minute of water sprayed along the cross-sectional area of the upper part of the pad [31]. If the cooling efficiency of the pads differs depending on the outside air conditions, but on average, the cooling efficiency was 15 to 40% depending on the pad thickness [32]. The cooling efficiency of the cooling pad on the energy model was implemented using the “Evaporative Cooler: Direct: CelDekPad” class. As an input to the energy model, the direct pad area was 35 m2, the direct pad depth was 150T, and the recirculation water pump power consumption was 0.7 kW
Next, it is necessary to simulate the energy generated by the broiler as an internal heat source in the house and reflect it as a boundary condition. Through previous studies, the empirical equations for the amount of sensible and latent heat generated according to the surrounding environment, weight, and feed efficiency of the broiler were determined. The heat and moisture generated by the broiler reflected the sensible and latent heat of the broiler suggested by Perdersen and Salvik (2002) [33]. In addition, in order to calculate the weight of the broiler, the empirical Equation (10) suggested by Yoo (2009) was used for the weight of the broiler by age. Perderson and Salvik (2002) presented a correction equation for the total amount of energy generated from the broiler according to the temperature change when 1000 W of unit energy was generated from the broiler, as shown in Equation (11) [34]. Whereas, Equations (12) and (13) refer to the amount of sensible and latent heat generated, respectively.
m = 1.1678 × d 2   + 11.137 × d + 35.753
Q t o t = 1 1000 × 10.62 × m 0.75 × [ 1000 + 200 × ( 20 T ) ]
Q s e n = 1 1000 × 10.62 × m 0.75 × { 0.61 × [ 1000 + 200 × ( 20 T ) ] 0.228 × T 2 }
Q l a t = Q t o t Q s e n
The amount of heat generated by the broiler can be calculated by entering the input variables corresponding to Equations (10)–(13) as simulation results or schedule values through the Energy Management System (EMS) built into Energyplus. In Table 2, parameters in the group that drives the EMS function were written. “Variable” refers to a simulation result item collected through “Sensor”, and the internal air temperature and relative humidity required for calculation were obtained as variables calculated as the result value according to the timestep during the Energyplus simulation process, and the number of rearing days and boilers was input through the “Schedule”. Since the heat energy of the broiler affects the load inside the house, the value calculated using the sensor variable was set as “InternalGain:OtherEquipment” through the actuator and applied as an internal gain. In addition, the “EnergyManagementSystem:Program” class was used to simulate the high-temperature stress index and the amount of heat generated by the broiler as the result of simulation calculations. The location where the ERL (Energyplus Runtime Language) was written in the program was also determined. For the high-temperature stress index, “EndOfZoneTimestepBeforeZoneReporting” was selected, and the program was executed immediately before the output result was generated at every zone timestep. This calling point was used because it is useful when creating a custom output variable. Next, the amount of sensible and latent heat generation was executed at the beginning of every timestep by selecting “BeginTimestepBeforePredictor” and before calculating the load of the zone. It is useful when used by components related to internal and external heat acquisition (lighting, shading device, set temperature) based on the results of previous timesteps and current weather data [35].

2.4.3. Energy Model Validation

When developing a building energy simulation model and deriving results, it is compared with field measurement data to determine the accuracy of the model. Through comparison, the reliability of the results through the building energy simulation model can be secured by verifying Measurement and Verification (DOE, 2015) through a statistical method that indicates the error of whether the thermal behavior and energy consumption are similar [36]. However, differences between data calculated inside the actual buildings and simulation models occurred due to errors and information uncertainty in design values, heat loss in each part of construction and equipment, and schedule differences in internal heat gains (occupant, lighting, electric equipment, etc.). The parameters used in the building energy simulation model were adjusted through the trial-and-error method and included the simulation results within the allowable range. The energy model implementing thermal zones was validated using data such as external weather, indoor air temperature and humidity, ventilation amount, and rearing information measured by the broiler house. The guides used in this study are ASHRAE (American Society of Heating, Refrigerating and Air-conditioning Engineers) and FEMP (Federal Energy Management Program), and NMBE (Normalized Mean Based Error), Cv (RSME), and R2 which are applicable indicators as performance indicators are as follow Equations (14)–(17). MBE is a statistical indicator of the overall behavior of the model prediction value compared to the measurement data. The positive value means that the model underpredicts the measured data, and the negative value overpredicts. This index checks Cv (RSME) together due to a cancellation error that the sum of positive and negative numbers can reduce MBE. Cv (RSME) represents the relative error variability as a percentage, and the smaller the coefficient, the closer it is to the average value. Usually, the smaller the value of the two error indicators, the more reliable the model is, and NMBE and Cv (RSME) are ±5 and 15 when analyzed monthly, respectively, and ±10 and 30 when analyzed on a collimated basis. In this validation, the time step was set to 1 min, which is the same as the experimental data, and R2 indicates how close the calculated value is to the regression line of the measured value. IPMVP and ASHRAE handbooks recommend that the coefficient of determination is not less than 0.75.
N M B E ( % ) = ( S M ) M × 100
R M S E = ( S M ) 2 N
C v   ( R M S E ) = R M S E M a v g × 100
R 2 = ( i = 1 n ( R i R i ¯ ) ( C i C i ¯ ) i = 1 n ( R i R i ¯ ) 2 × i = 1 n ( C i C i ¯ ) 2 ) 2

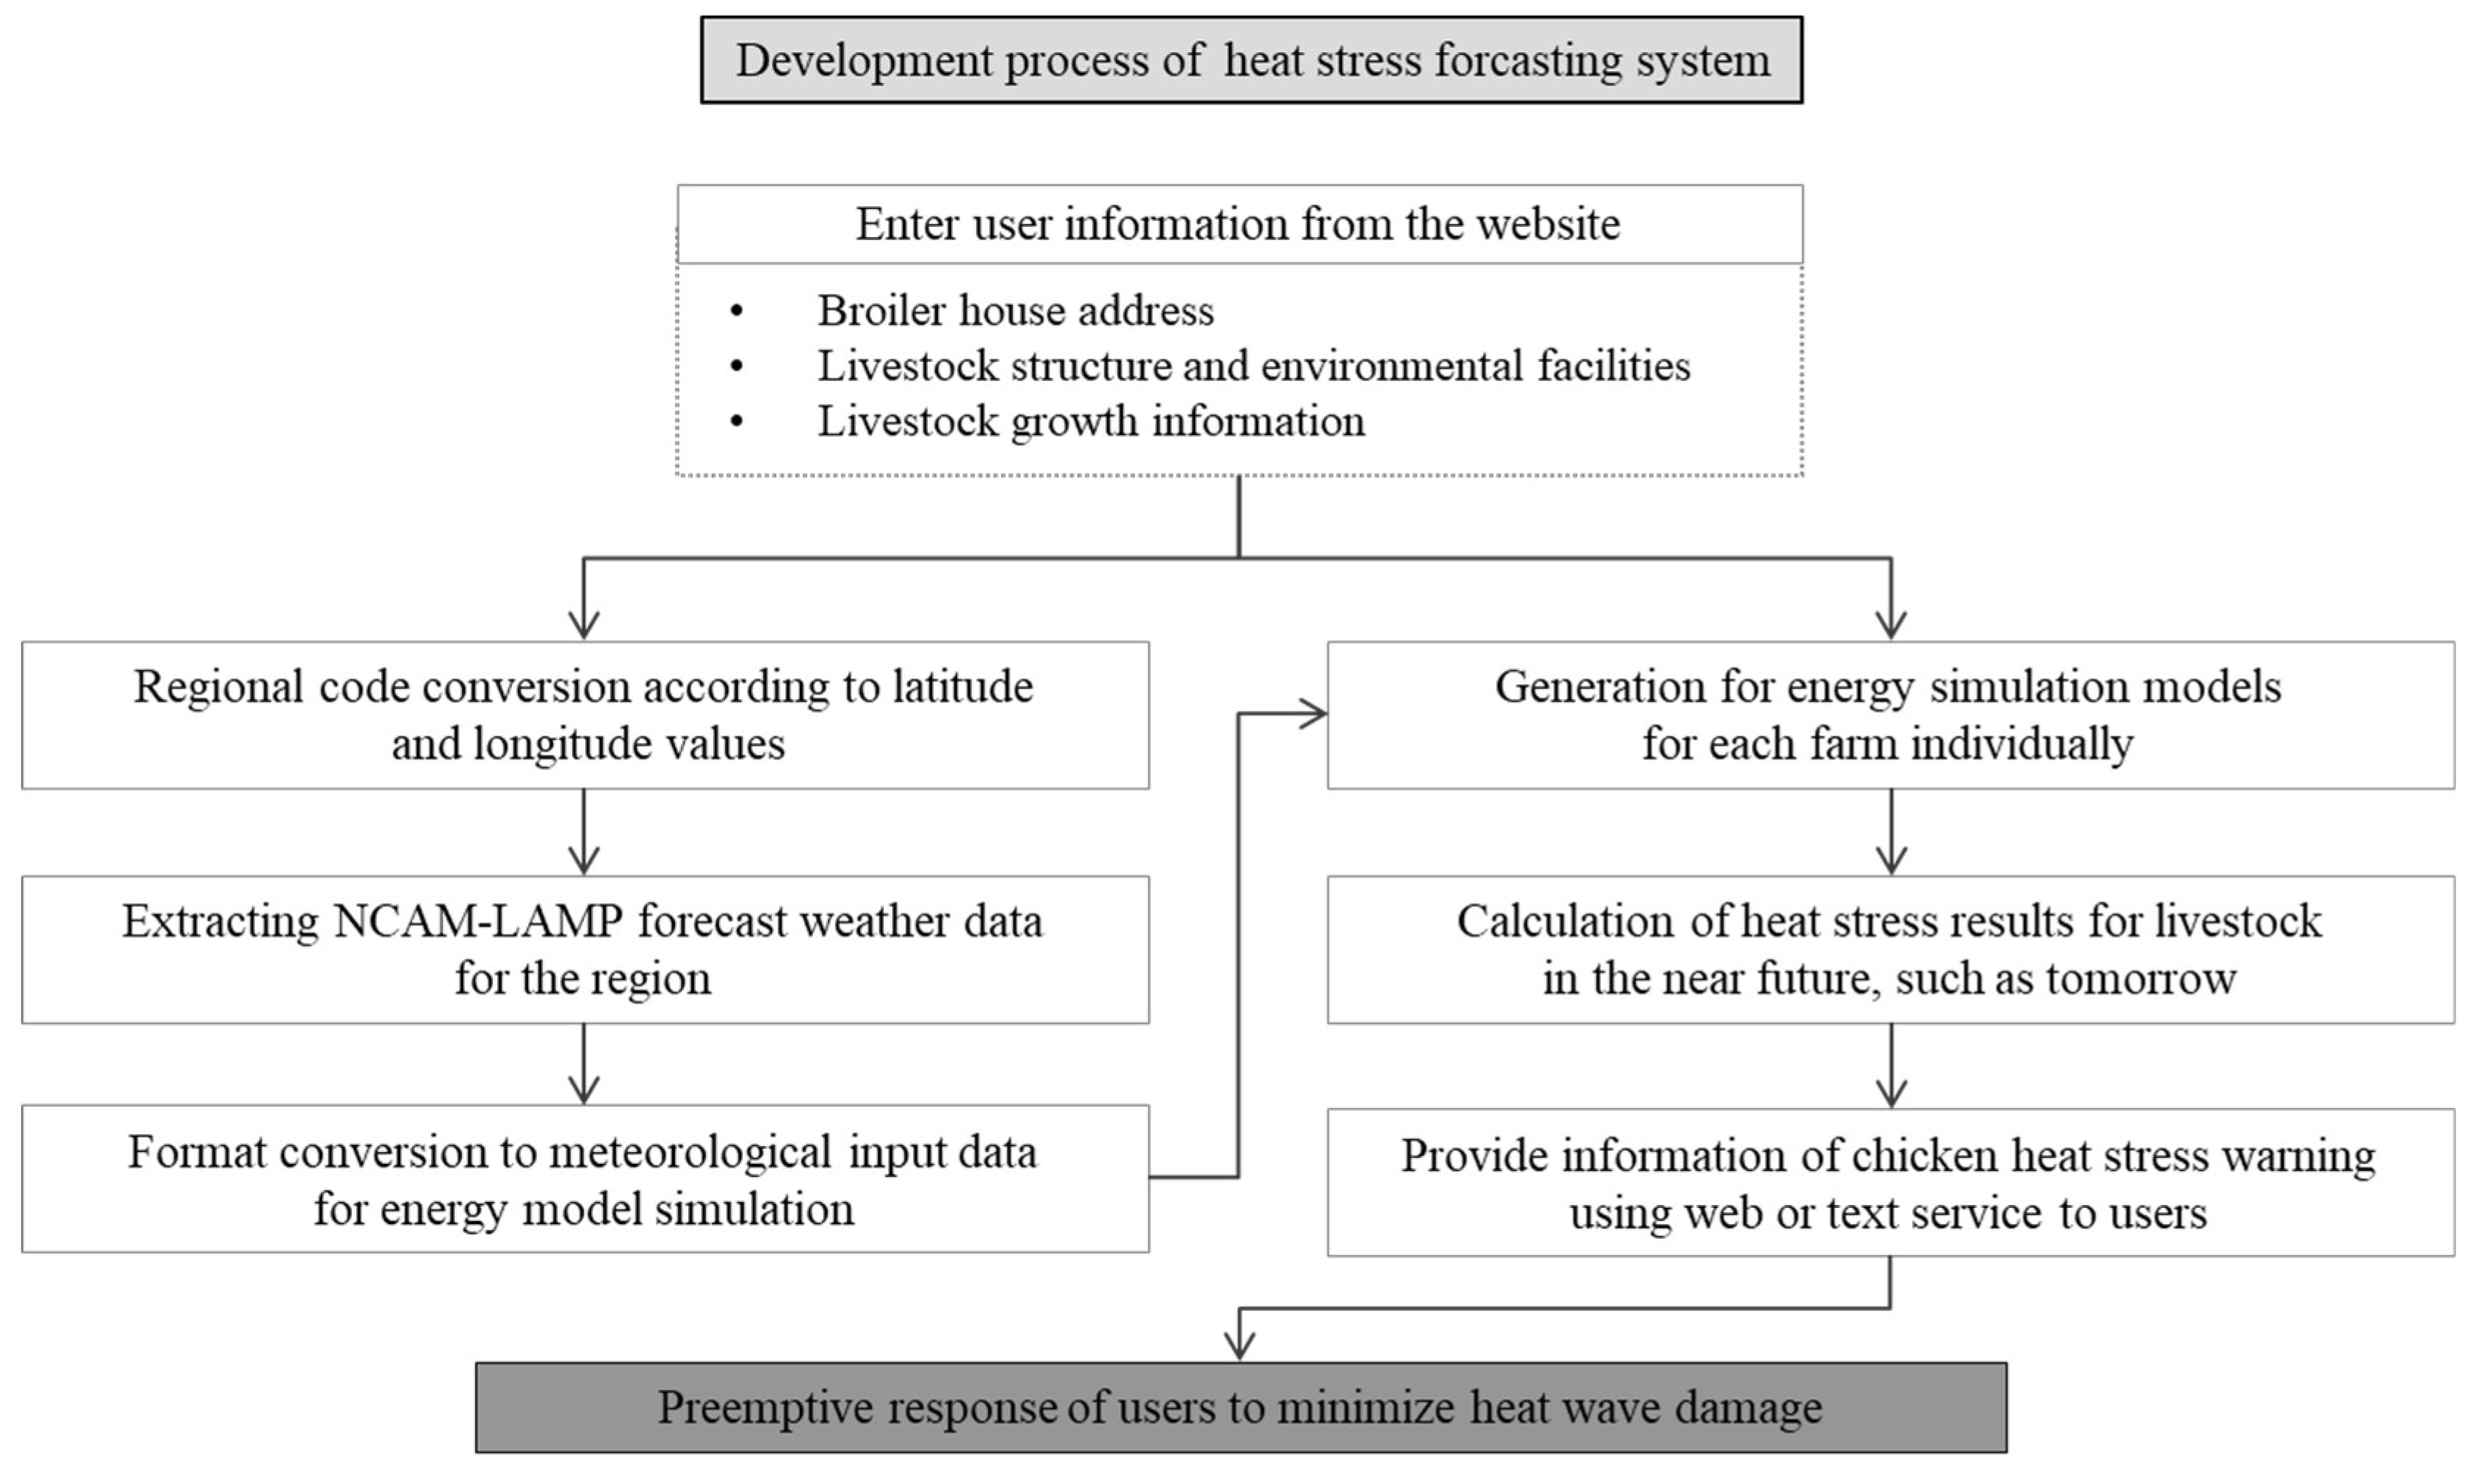
2.5. Heat Stress Forecasting System Developed Procedure

The process of establishing a heat stress forecasting system service is as follows. (Figure 7) This study was conducted to receive NCAM-LAMP data, a high-resolution weather prediction site with 810 m spatial resolution for Jeollabuk-do, and to calculate the validated energy model according to chicken rearing conditions and provide it to users using web and text services. To establish a service that automatically provides risk information to users, first, weather data of the area were extracted with farm location information and constructed as input data for energy models. Next, the variables of the energy model were updated for livestock structure, environmental facility conditions, and livestock growth information, and the forecasted heat stress index (the next day and the day after) was calculated from the forecast time to prevent heat wave damage in advance.

2.5.1. Heat Stress Modelling for Construction of LAMP

Using a web service site and a mobile phone, users will receive various information such as farm addresses, livestock structures, environmental facilities, and livestock growth information (Table 3). Among the input information, building dimensions (length, width, ridge, eave height, etc.), wall/roof insulation information (thickness and type), cooling pad, number of fans, fan size corresponds to livestock structure and environmental facilities, and the number of birds and days corresponding to livestock growth information were identified. The latitude and longitude of the house can be determined using the input farm address. Based on the open Application Programming Interface (API) grid of the Korea Meteorological Administration, the district code can be divided using data with maps of latitude and longitude grids per 1 km in Jeollabuk-do. For example, the code “45790” presented city and county, the first two digits “45” referred to Jeollabuk-do, while the last three digits “790” meant Gochang-gun. Weather data from the area where the input farm address is located is required as input data for the livestock heat stress model. Since Energyplus weather data can be calculated only when there is a full period of one year, only the data of the LAMP forecast period was updated from the original Energyplus weather data and a new file of Energyplus weather data for one year was created every time it is calculated. The LAMP file format is NetCDF (.nc), and the weather data file format to be entered into the Energyplus model was EnergyplusWeather (.epw), which analyses the file characteristics and internal variables of each data. First of all, since a nc file contains data only for one time in all regions, the file was generated by time and is provided at about 100 MB per file, so if the predicted and provided file is merged into one, a very large file is generated and hard disk capacity is required. The epw file was annual data of latitude and longitude as long as it corresponds to a house in one file, and is about 1.5 MB. Among the variables that require values per unit time in the epw file, variables that affect the calculation of the internal model include dry bulb temperature, dew point temperature, relative humidity, atmospheric pressure, horizontal infrared radiation, direct vertical radiation, diffusion horizontal radiation, wind direction, wind speed, cloud cover, opaque cloud, snow depth, precipitation, etc. LAMP weather data also has several variables, but none of the weather variables required for epw were added. The variables such as 10 m vertical wind, relative humidity, 10 m wind direction and speed, sea level pressure, lower cloud cover, total cloud cover, direct solar radiation, normal direct solar radiation, diffuse solar radiation, snow depth, horizontal longwave radiation intensity, etc. were added. The lower cloud cover was generated based on 850 hPa isostatic surface cloud cover, the total cloud volume was generated based on the maximum vertical cloud cover, and the horizontal radiation intensity was calculated by referring to Walton (1983), Clark and Allen (1978) literature [37,38]. In addition, the units that have been the same in the past have been unified. Since the nc file has weather data of one region in the entire Jeollabuk-do region, it was coded using jupyter notebook so that only the value of the required area where the farmhouse is located among the forecasted weather data can be obtained. The latitude and longitude values in the header of the original epw file and the target latitude and longitude values in the nc file must be exactly the same to extract the data of the region corresponding to the latitude and longitude. The date of the period to be used and the original/merged file name was modified according to the generated file. In addition, if month and day are single digits, two digits must be created by adding a leading zero to them. In addition, nc files are created from 00:00 to 23:00 in one day, and the following period is used as a standard of one day. The newly created epw file, including the LAMP forecast data, was shown through Algorithm 1.
Algorithm 1. Pseudocode for merged data and converted LAMP format.
I n p u t :
D t o d a y : S t a r t   d a t e   t o   r e p l a c e   w e a t h e r   d a t a
E P W i n : A n n u a l   w e a t h e r   d a t a   f o r   a   s p e c i f i c   l a t i t u d e   a n d   l o n g i t u d e   ( . e p w   f i l e )
N C H D : N a t i o n a l   w e a t h e r   d a t a   f o r   H   h o u r   o n   d a t e   D   ( D t o d a y D < D t o d a y + 7 ,   0 H < 24 ,   . n c   f i l e )
O u t p u t :
E P W o u t : A n n u a l   w e a t h e r   d a t a   w i t h   r e p l a c e m e n t   c o m p l e t e d   ( . e p w   f i l e )
Algorithm :
R E A D   f i r s t   l i n e   o f   E P W i n   ( f i r s t   l i n e   o f   . e p w   f i l e   c o n t a i n s   l a t i t u d e ,   l o n g i t u d e   i n f o r m a t i o n )
L a t   : = L a t i t u d e   i n f o r m a t i o n   o f   E P W i n
L n g   : = L o n g i t u d e   i n f o r m a t i o n   o f   E P W i n
R o w s   : = H o u r l y   w e a t h e r   d a t a   l i s t   f o r   o n e   w e e k   a t   l a t i t u d e   L a t   a n d   l o n g i t u d e   L n g   l o c a t i o n
F O R   i   : = D t o d a y   t o   ( D t o d a y + 6 ) :
   F O R   j   : = 0   t o   23 :
     R E A D   N C j i
     E X T R A C T   w e a t h e r   p a r a m e t e r s   w h e r e   t h e   l a t i t u d e   a n d   l o n g i t u d e   v a l u e s   c o r r e s p o n d   t o   L a t   a n d   L n g
     E X T R A C T   o n l y   t h e   n e c e s s a r y   p a r a m e t e r s   t o   c o m p o s e   . e p w   f i l e
     R E L O C A T E   t h e   e x t r a c t e d   p a r a m e t e r s   t o   f i t   t h e   f o r m a t   o f   . e p w   f i l e   ( m a k e   o n e   r o w )
     A D D   a   r o w   i n   t h e   R o w s
F O R   L i n e   i n   E P W i n : ( e a c h   L i n e   c o n t a i n s   w e a t h e r   d a t a   a t   a   s p e c i f i c   t i m e   f o r   a   s p e c i f i c   d a t e )
   D L i n e   : = L i n e s   d a t e   i n f o r m a t i o n
   H L i n e   : = L i n e s   h o u r   i n f o r m a t i o n
   I F   L i n e s   d a t e   N O T   I N   R o w s   d a t e s :
     W R I T E   L i n e   t o   E P W o u t
   E L S E :
     L i n e   : = A m o n g   t h e   r o w   s t o r e d   i n   R o w s ,   t h e   o n e   e x t r a c t e d   f r o m   N C H L i n e D L i n e
     W R I T E   L i n e   t o   E P W o u t

2.5.2. Web-Based Forecasting System Development

An Energyplus Input File (.idf) file developed using the Energyplus program was created for the broiler energy model. The livestock building structure, environmental equipment, and broiler growth information values were manually entered by the users at the corresponding coding line. The heat stress calculation time for 3 days takes about 2 s. T The calculation period was the next day and the day after the forecast day, and since the result varied depending on the initial value, it was calculated from the day before the forecast day. When the user selects the type of insulation material such as Styrofoam, Neopole, Isopink, or rigid urethane, the corresponding heat capacity, density, specific heat, and absorption rate were inputted and calculated. The schedule was divided according to whether the cooling pad was used or not. Specifically, when the cooling pad was used, it was “always on continuous” condition while when it was not in use, “always off discrete” is input. The cooling pad length was inputted as the actual house length, but for the user who does not know the exact length, the default value was set to 20% of the length of the house. According to the standard design of the broiler specified by Nonghyup (2016, 2019) [27], the cooling pad is 30 m when the house length is 114.3 m, in the year 2106 and when it is 112.0 m, it is specified to be 24 m, in the year 2019. According to the standard design, the length of the cooling pad compared to the length of the barn was about 20%, which was brought and used as the model default.
Next, the evaluation criteria for broilers suitable for South Korea were identified through a literature review on heat stress. A representative broiler’s heat stress index was studied, and among the indexes, the summer weather condition in South Korea and the type of broiler variety were compared to each other. In addition, the improvements were analyzed by comparing the case of the existing heat stress forecasting system of livestock.

3. Results and Discussions

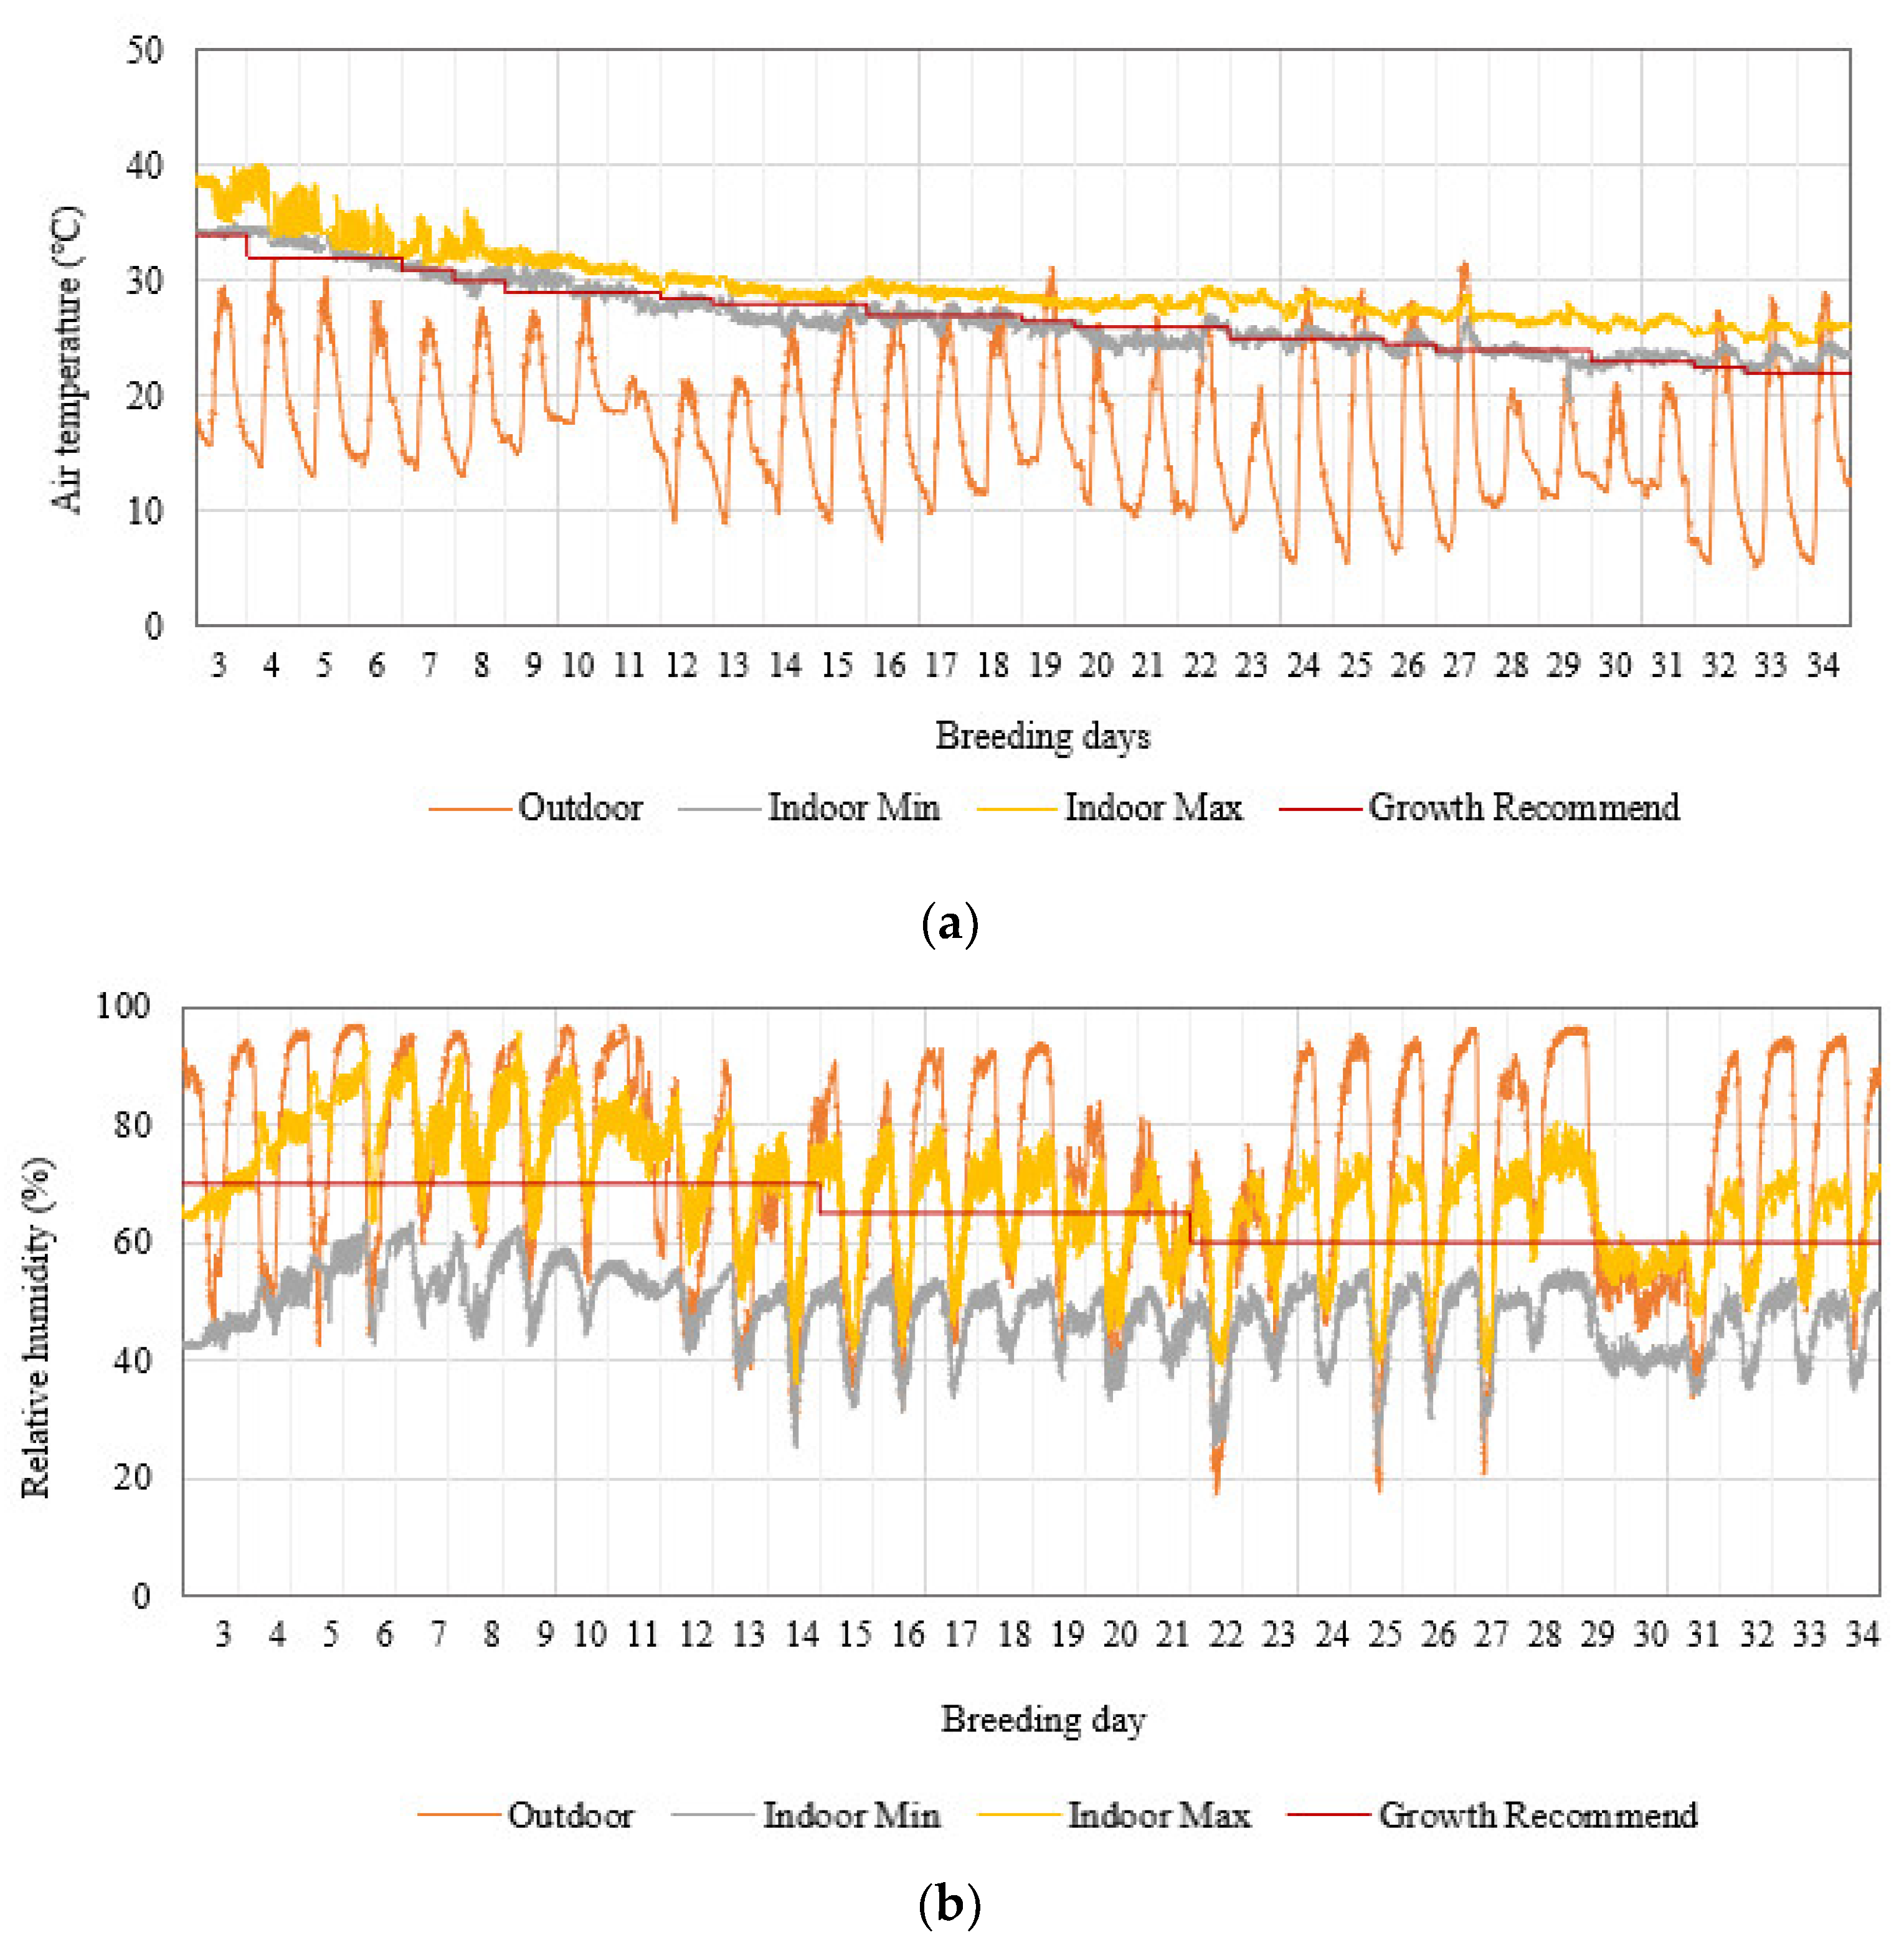
3.1. Weather and Internal Environment

The closest meteorological station was located in Gunseo-myeon, Yeonggwang-gun, about 4 km away from the broiler house, which provides Automated Synoptic Observing System (ASOS). The measured average outside air temperature outside the target building during the experimental period was 16.5 °C and the average relative humidity was 70.1%, respectively. A comparison of the field-measured external weather environment using a portable weather station with the ASOS showed that the difference between the highest temperature during the day and the lowest temperature at night was up to 4 °C and at least 1.5 °C, respectively. This was believed to be due to radiation from the concrete floor as the location where the simple station was installed is on the roof of an office building that does not block sunlight. In terms of dominant wind direction, it was confirmed that the highest wind frequency occurred from the south and southwest directions. The southwest wind was dominant during the day while the south wind prevailed during the night.
The air temperature change at different zones inside the poultry house until the broilers were introduced and shipped as shown in Figure 8. During the experiment and data collection period, the broiler growth environment was set to an appropriate level through appropriate adjustment of ventilation. Results showed that the relative humidity of the outside air increased to more than 90% at night and decreased during the day. From this, it can be noted that the relative humidity inside the broiler house is highly affected by the change in the outside relative humidity. In addition, it was also noted that the relative humidity is lower than the appropriate growth condition during the day and higher at night. The optimum humidity range was 70% at 1 week of the rearing period and 60% after 3 weeks of rearing period, and the actual humidity measured inside the broiler house was relatively similar to the appropriate growing humidity. The increase in humidity is dominated by the outside air, and there seems to be no tendency to increase during the entire growth period. In addition, the increase in moisture content of floor litter showed no significant effect on humidity generation as the litter used were newly replaced during the experimental period. Moreover, it was observed that the variation in the internal environment during the first 1 to 5 days of rearing age seems to be largely affected by the operation of the hot air blower. Specifically, the temperature during the early days of rearing was 0.07 °C higher than the appropriate rearing temperature of 35 °C. The use of hot air blower also showed a significant decrease in humidity, with 5.25% lower than the appropriate humidity of 70%. During the entire rearing period, the measured air temperature was almost similar to the allowable temperature value suggested by the Rural Development Administration (2007) [39]. When the broiler grew to the days of 22nd, the weight increased, and the amount of heat generated in the body increased, so on days when the outside temperature was high, negative pressure ventilation was performed using the tunnel exhaust fan during the day. The use of ventilation to lower the internal air temperature during this period showed that the air quality and internal humidity inside the broiler house were also improved.

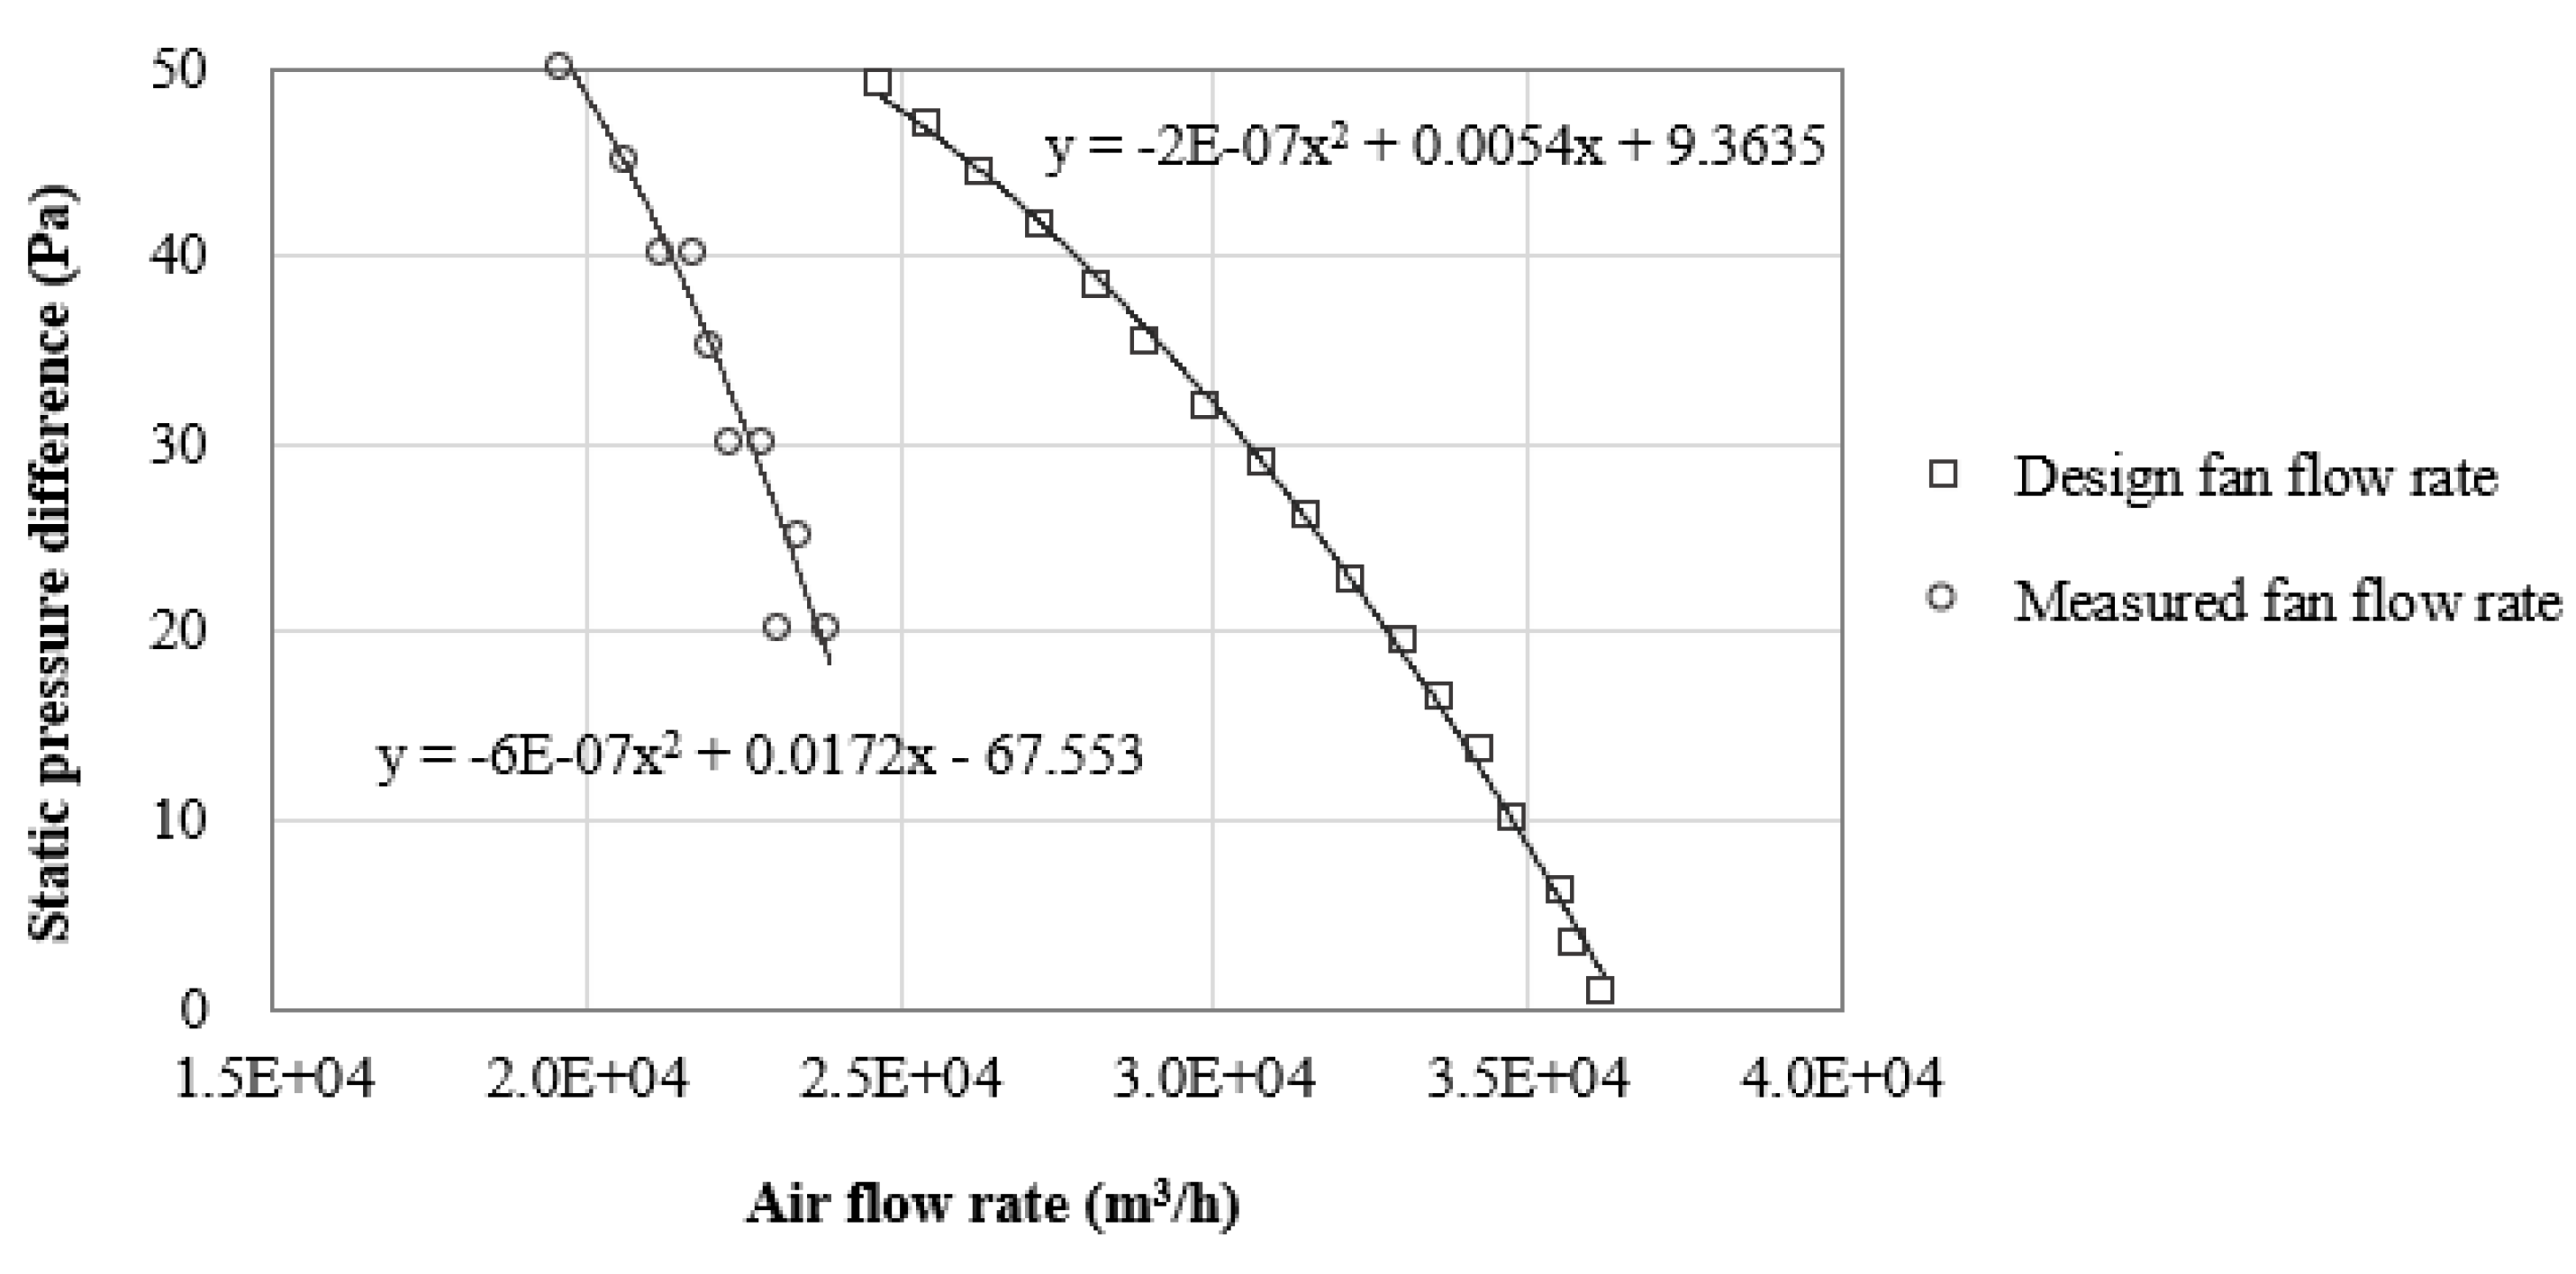
3.2. Ventilation Flow Rate Depending on the Number of Fans

By analyzing the flow rate of the target tunnel exhaust fan measured through field experiments and the difference in static pressure inside and outside the house, the field fan performance curve was derived. The results showed that a high error was observed when the static pressure difference was 10 Pa or less. In this study, the analysis was performed using only the measured values of the static pressure difference of 10 Pa or more. (Figure 9).
Compared to the design maximum fan flow rate provided by the manufacturer, the actual airflow rate measured during the field experiment was found to be only 70% of the designed flow rate. This may be caused by the difference between the evaluation method of the fan performance curve and the field measurement environment. For instance, in the approved fan performance test method, ducts are installed at the inlet and outlet of the target fan. Thus, the static pressure difference between the inlet and outlet of the fan is kept constant, making it easy to measure in the duct. However, in the case of the mechanically ventilated broiler house, the exhaust fans were installed in an open wall, not a duct. So, as the distance from the exhaust fan increased, the airflow rate inside the house decreased, and the static pressure increased. Other reasons for the decrease in performance of the target fan may include the installation of shutters to prevent infiltration through the exhaust fan, accumulation of dust around the fan, and aging of the fan belt due to long-term use. Therefore, in order to accurately estimate the ventilation rate in a mechanically ventilated broiler house, it is necessary to evaluate the fan performance change at the broiler house site. The experimental condition in which the minimum flow rate of the target tunnel exhaust fan was measured was that all 14 installed tunnel exhaust fans were operated and the slot opening was partially opened (θ = 13°).
When tunnel ventilation is used in mechanically ventilated broiler houses, the average static pressure difference inside and outside the house is from 2.5–30 Pa [40]. Under this condition the measured flow rate is reduced by 25 to 30% when compared to the flow rate predicted through the design fan performance curve. The experimental values of the flow rate reduction rate according to the static pressure difference are shown in Table 4. Park et al. (2018) was concerned about the exhaust fan failure because excessive negative pressure is formed when the static pressure difference is greater than 40 Pa [41]. The reason for the large static pressure difference measured in this study is the difference in the inlet area. When the ventilation rate was used on the calculation model according to the fan design data, heat stress of broiler in house may be underestimated. Therefore, it is more appropriate to input the ventilation rate in the energy model in consideration of the fan performance decrease.

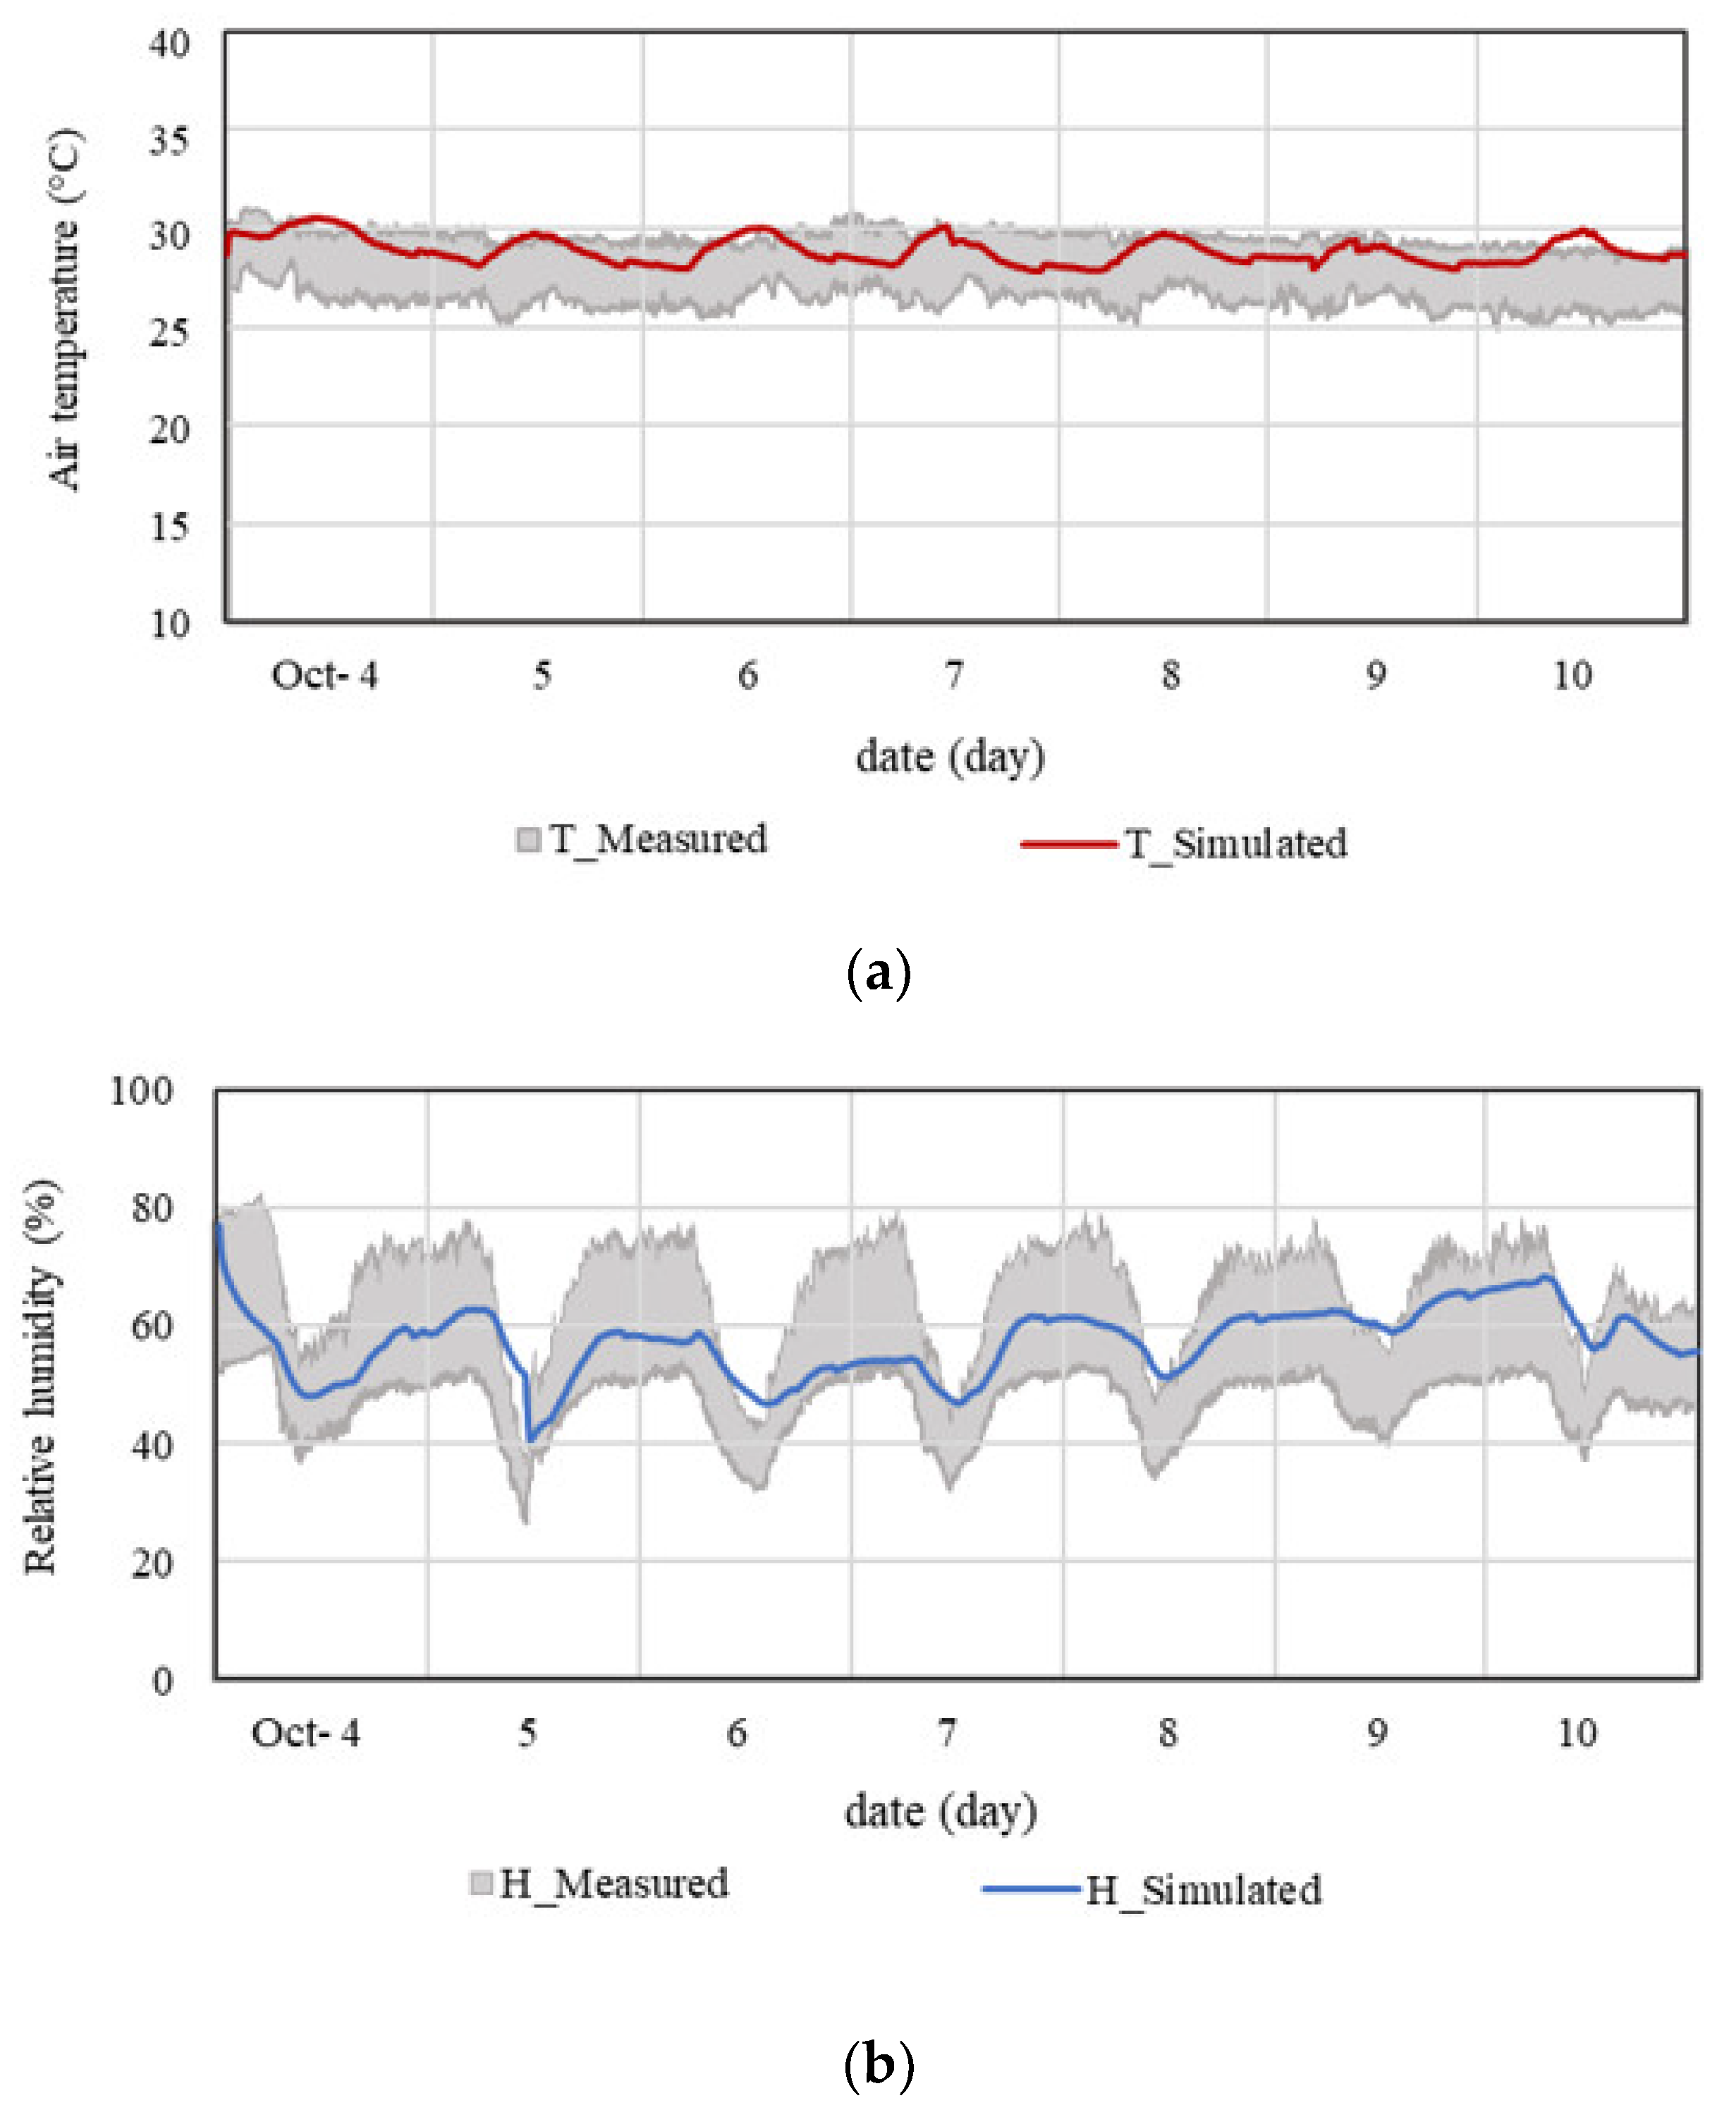
3.3. Validatdion of BES Computed Results

The accuracy of the BES model in the broiler house used in this study was validated by comparing the data of the air temperature and relative humidity inside the house measured in the field experiments with those calculated using the BES model. In the validation, the field measured and calculated data from 4 to 10 October and was compared. A 5 min average value was used for the field experiment value, and the time interval of the energy simulation was also set to 5 min. Among the energy analysis method, it is recommended that the energy analysis calculation time step is 5 min or 10 min [42]. This is because the change in energy flow due to the equipment operation or internal heat gain is too long for one hour, and the one-minute interval takes too much computation time. Figure 10 shows the graph comparing the minimum, average, and maximum values of the internal air temperature and humidity measured in the field with the calculated internal air results.
The validation result showed that the model error of air temperature and humidity inside the house fall within 10%. (Table 5) It means that the error range of the simulated results is within 10% based on the average values of the experimentally measured temperature and humidity results. Since relative humidity is a value that can be easily changed by various variables other than the air temperature inside the house, the error rate is higher than the temperature, but the measured value also has a deviation of more than 20%. The American Society of Heating, Refrigeration, and Air-conditioning Engineers (ASHRAE) suggests reliable standards for the error rate of energy analysis models in the M&V Guideline. According to this document, when the RSME is within 30% of the absolute value, it can be assumed that the model has high reliability and is suitable.

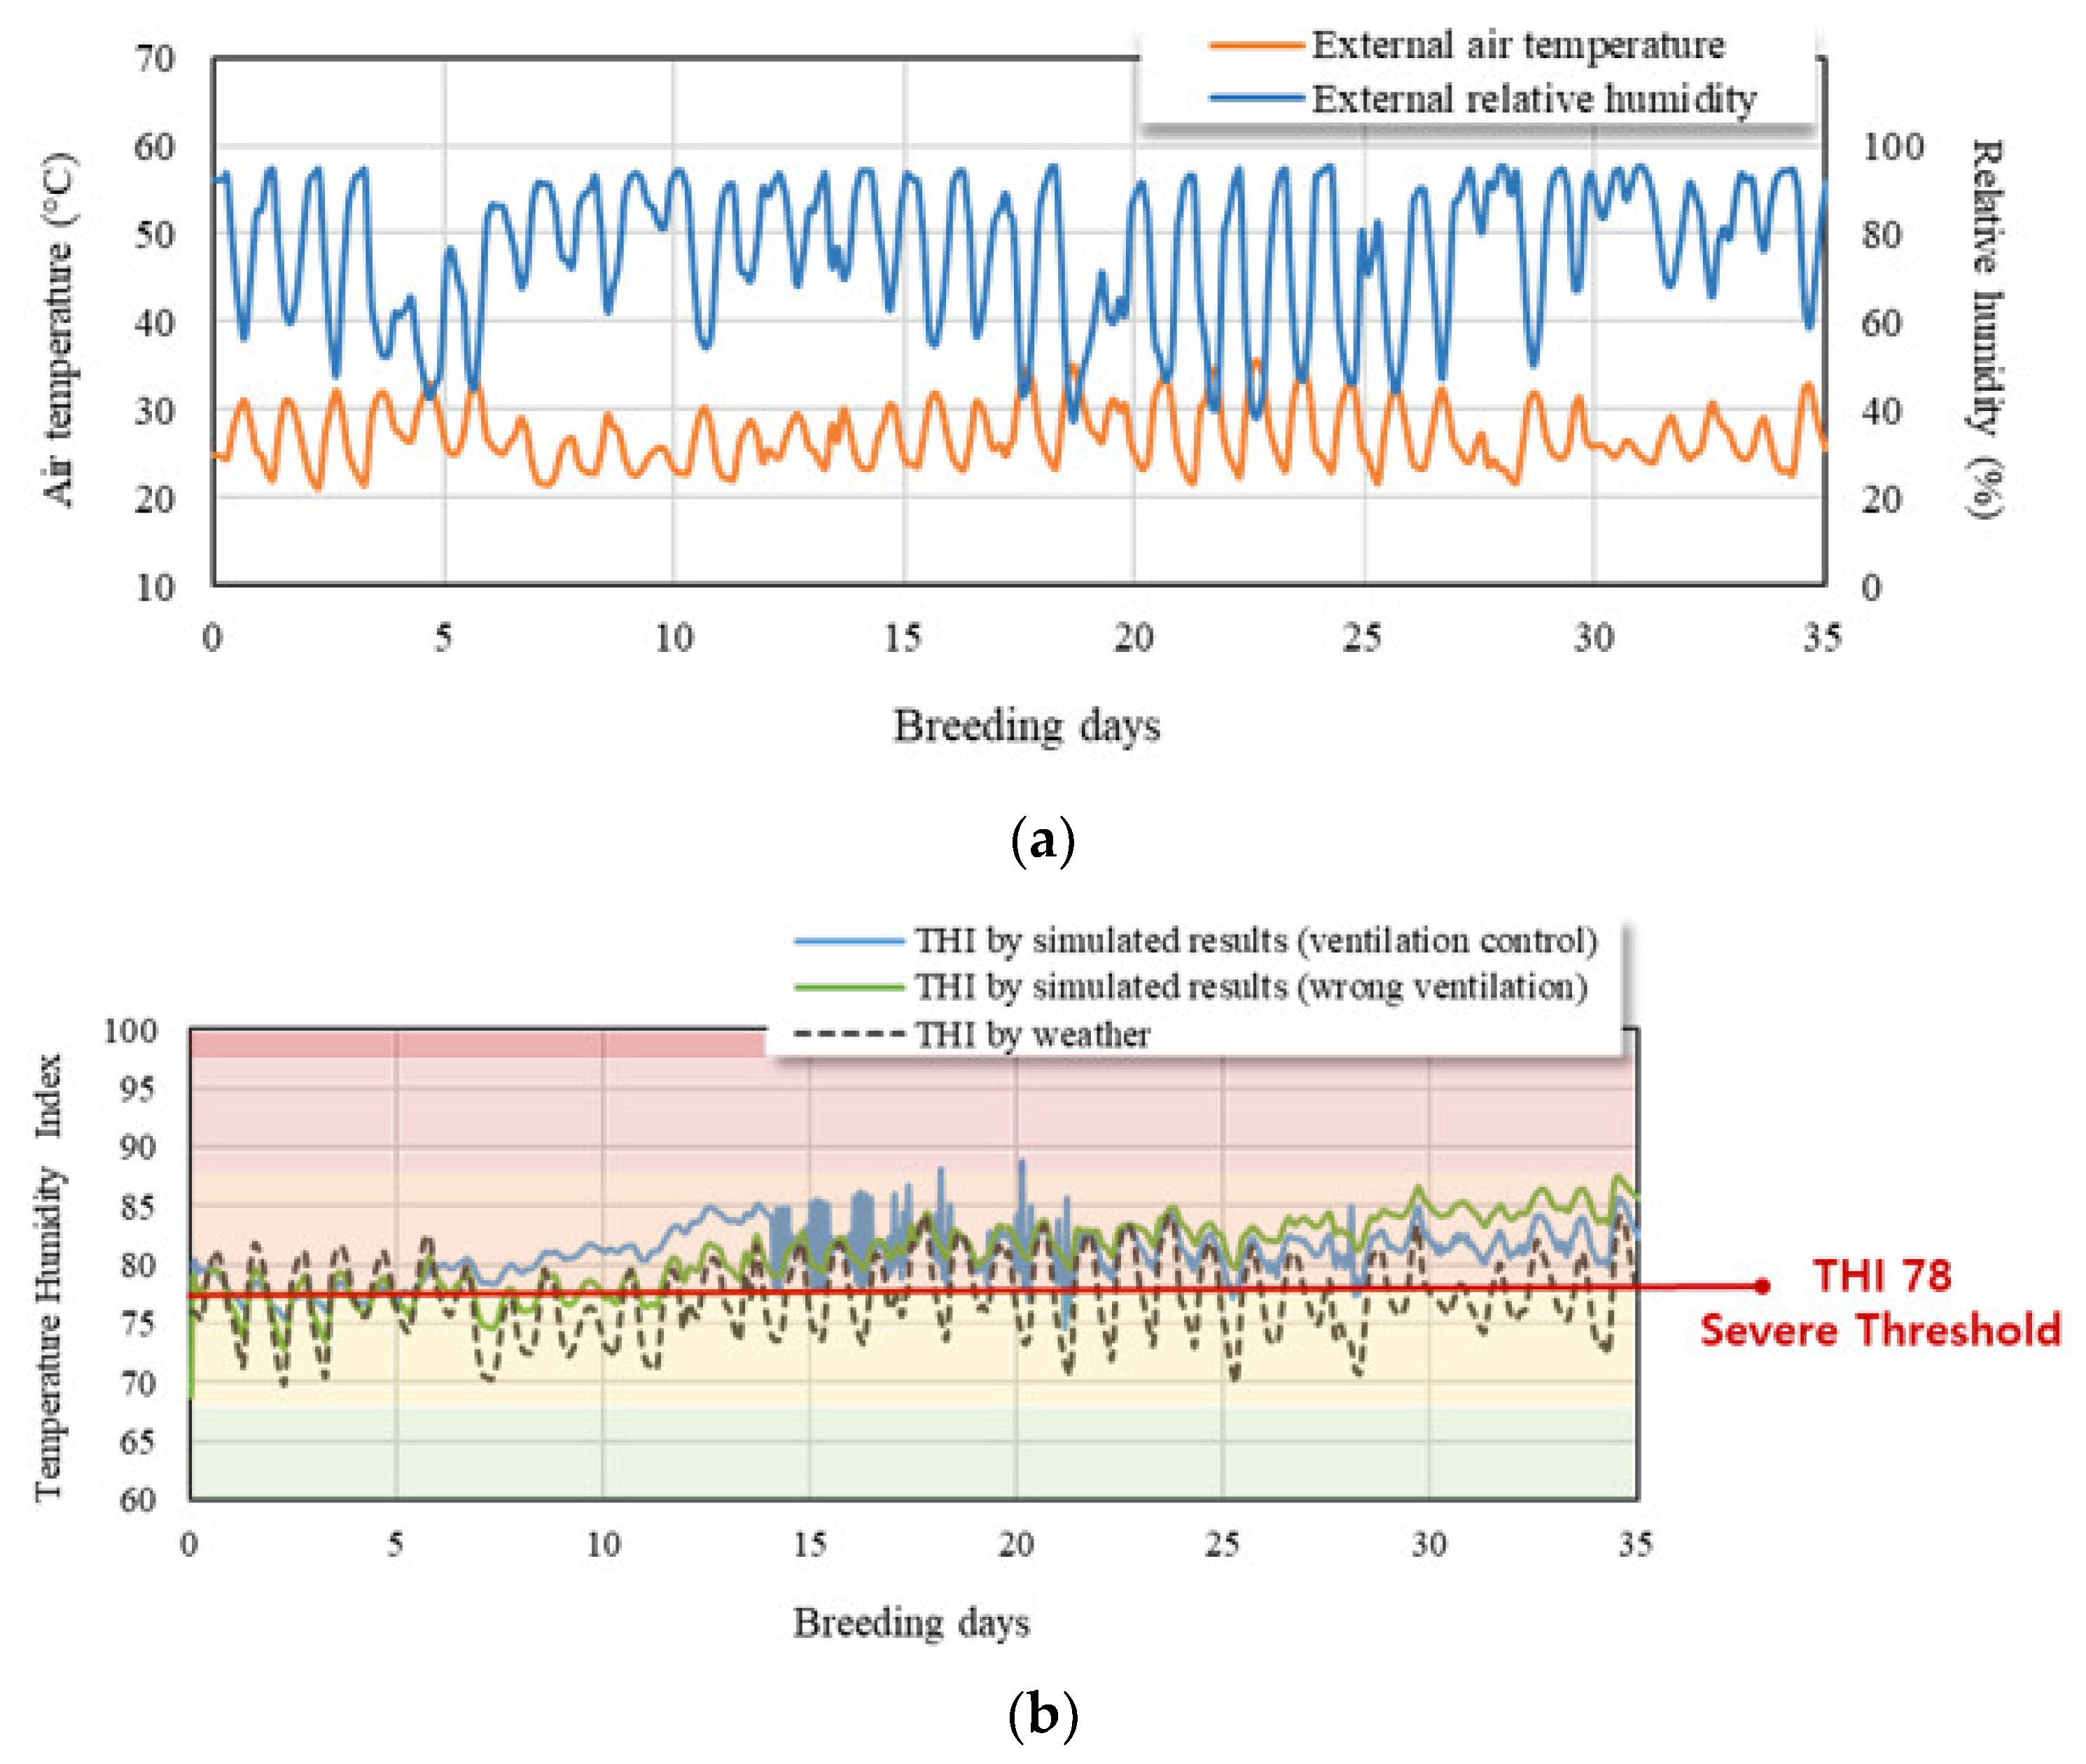
3.4. Heat Stress Index Evaluation Criteria for South Korea

Heat stress is the result of a heat load in which an animal cannot maintain homeostasis. In poultry, when the Effective Environmental Temperature (EET) is within the Thermo Neutral Zone (TNZ), which is within the upper and lower critical temperatures, the body temperature of the adult chicken is maintained at 41.2 °C [43]. When the EET rises above the upper critical temperature, the defense mechanism acts as though feed and water intake decreases and the evaporation rate increases. Heat balance formation is complex and includes several climatic factors (ambient temperature, relative humidity, wind speed, etc.), livestock factors (age, reproductive status, physical activity, adaptability, health status, metabolism, genotype, etc.), management factors (housing, shade provision, fans and sprinklers, nutrition management, etc.). In order to alleviate the heat load by using these factors, studies on high-temperature stress in livestock have been conducted for a long time.
Table 6 shows the heat stress index studied for broilers. The most commonly used index is the Temperature Humidity Index (THI), which uses air temperature and humidity data to show the effect of high-temperature stress on livestock and is useful for predicting livestock productivity simply. DeShazer and Beck (1988) analyzed whether water was sprayed or not, according to the region, the heat of vaporization was additionally calculated in the latent heat term [44]. Measured with time series data, the extreme weather of the top 1% of US weather data was also analyzed separately.
Tao and Xin (2003) developed thermal stress when exposed to high-temperature environments [45]. In addition, the Temperature Humidity Velocity Index (THVI) was developed considering the relative importance of air flow rate when growing with tunnel ventilation in summer. The experiment was conducted with male broilers 46 ± 3 days of age under 18 conditions divided into 3 stages (35, 38, 41 °C) of dry bulb temperature, 2 stages (19.4, 26.1 °C) of dew point temperature, and 3 stages (0.2, 0.7, 1.2 m/s) of air flow rate, and the body temperature increase of male broilers measured for 30 min was measured. In the case of broilers, the weight ratio of sensible heat and latent heat was divided into 85:15, and the mortality rate with respect to air flow rate was not linear, so an equation was derived in the form of an exponential function.
Chepete et al. (2005) conducted a study to derive the THI index of broilers according to the growth stage [46]. In the experimental method, about 1700 broilers were raised inside the naturally ventilated broiler house in summer and winter over 6 weeks. Here, the index was calculated by analyzing feed intake, average weight, and mortality according to the number of rearing weeks. Moraes et al. (2008) evaluated whether the high-temperature stress index for broilers proposed by the THI index was consistent with other regions [47]. In this study, they collected local weather data and confirmed that the internal environment was properly expressed as THI.
The various forms of THI index have been widely used as livestock stress index, but there are some obvious limitations. The use of this index requires the assumption that livestock responds to environmental stressors in exactly the same way, but it is impossible. For example, it is common that cows with low production (20 L of milk per day) are less affected by heat stress than cows with high production (45 L). In addition, changes in the response of livestock to climate variables have been established according to various literature. Moreover, the THI index does not consider thermal radiation (solar and long wave), wind speed, duration of exposure, or differences in age or genotype. Xin et al. (1994) reported that broilers were more sensitive to heat during the first 3 weeks of growth and that males were more affected by heat than females, Brown-Brandl et al. (1997) found age responses related to reaction response and reaction time in turkeys exposed to high heat loads [48,49], but no established relationship to respiration rate or rectal temperature was determined. Although there are recognized deficiencies, in this study, in order to analyze the most important factors of internal and external heat flow through field experiments at the house, the simulation results of inside air temperature and humidity are the most universal and have the greatest effect on heat stress, so only THI index representing only the air environment was used. Among the various THI indexes shown in Table 6, it was deemed necessary to calculate the high-temperature stress of livestock suitable for Korea’s livestock and weather conditions.
Equation (18) is not only for poultry, but also for various livestock animals such as cows and pigs, and it is a level that suggests different standards for each livestock species through the threshold value of the model [50]. Equation (19) showed only the critical value by approximating the model developed for laying hen by DeShazer and Beck (1988) to a broiler. Equations (20) and (21) are models developed by Tao and Xin (2003) and are divided into equations expressed by the dry bulb and wet bulb temperatures of the ambient air around the broiler, and equations that consider the wind speed related to the effective temperature. At Iowa State University, a heat stress index model was developed by moving broilers to a control room with temperature and humidity control and monitoring the broilers. The broiler breed is a crossbreed of ROSS and ROSS, and the experiment was conducted similarly to the conditions of many rearing methods in Korea. The heat stress level criterion was expressed by dividing it into four levels which include Normal, Alert, Danger, and Emergency, and the critical values were calculated as 33.14, 36.08, 39.02 in Equation (20), and 33.90, 37.74, and 41.59 in Equation (21). Equation (22) can be seen as similar to the shipping period in Korea by making models every 3~4 weeks and 5~6 weeks using straight-run Cobb 500 broilers, which are the second most frequently raised broilers in Korea. Although the index was developed by measuring the temperature and humidity inside the broiler house without environmental control, the biggest limitation seems to be that it is very different from the weather conditions in Korea and does not provide a step-by-step threshold of the heat stress index. Equation (23) is an index that experiments with broilers and suggests thresholds as a model developed for dairy cows using Brazilian climate data. In order to evaluate the heat stress index for Korean broilers relatively similarly, Equation (20) is judged to be the most suitable considering the weather and the species of broiler during the experiment.

3.5. Improvements to the Web-Based Forecasting System

In this study, the internal environment was calculated through energy simulation by considering the NCAM-LAMP weather forecast data, user’s basic information, calculation time, and the number of rearing broilers, and the stress level was evaluated using heat stress standards suitable for Korea. A system was developed to automatically predict all computational processing processes using Open Source energy simulation software. In order to create an automatically computable platform, the system was built to compute from ubuntu to the Command Language Infrastructure (CLI). On the developed web service site (https://poultryheatstress.co.kr, accessed on 1 August 2022) (Figure 11), the internal air temperature, humidity, and heat stress can be checked by time. It is available on the web and in text, and the color is different according to the risk of heat stress so that the user can easily understand the information through the chart. With the calculation time at intervals of 10 min, efforts were made to predict in more detail the time with a high risk of damage through the heat stress index.
There have been cases where real-time monitoring and forecasting systems for high-temperature stress in livestock were attempted at home and abroad using weather forecast data [51,52]. The National Livestock Science Institute of Rural Development Administration of Korea has developed a livestock-rearing weather information system to reduce damage to livestock from heat waves [53]. In connection with meteorological observation data from the Korea Meteorological Administration, a function was implemented to provide livestock farmers with real-time weather (temperature, humidity, etc.), heat stress index, and risks of meteorological disasters (heat waves, tropical nights, etc.) by region. In addition, the heat stress index customized livestock and livestock management guidelines for each type of livestock were provided so that farms could be equipped to reduce the productivity of livestock by responding to high-temperature stress. However, in the case of Korean cattle, natural ventilation is mainly performed, but in the case of pigs and chickens raised in windowless or semi-windowless facilities, the temperature and humidity index were calculated only by changes in external temperature and humidity. The internal temperature of most houses shows a tendency to increase and decrease similarly to the change in the outdoor temperature, but there is a limitation in that the change in the micro-weather environment in the facility according to the external weather is not simulated. To overcome this problem, this study developed an energy model that analyzes the micro-weather environment inside the facility by inputting external weather data into the model to quantify the high-temperature stress that occurs when livestock is exposed to heat waves.
The Livestock Science Institute of the Rural Development Administration applies the external weather as it is to the index, and the calculation result changes only by the weather (Figure 12). The high-temperature stress index through model calculation takes into account the age, rearing density, and ventilation rate, so it shows a value that gradually increases from the beginning to the latter half of rearing similar to the actual value, but it can be seen that the high-temperature stress increases significantly when incorrect ventilation is operated Therefore, by considering the recommended operating ventilation by internal air temperature for broilers, the high-temperature stress index does not increase significantly even when the broilers reach adulthood in the second half, and it is considered that the most absolute variable is the ventilation rate as it operates well similar to the critical point.

4. Conclusions

This study attempted to develop a forecasting system that enables users to preemptively respond to heat stress evaluation of broilers before danger occurs. To do this, several processes were conducted, including field experiments at the selected broiler house to measure and analyze the external weather, the internal environment, and the ventilation flow rate during tunnel ventilation. Air temperature and relative humidity were analyzed according to the length and width using time series data for rearing days broilers. Field-measured data analysis showed that the actual ventilation rate of the tunnel fan was reduced by 30% compared to the design ventilation rate, specified by the manufacturers of the fans. Since the ventilation flow rate is a factor that directly affects the air thermal environment inside the broiler house, it is important to input the actual ventilation amount to accurately predict the internal environment. Then, a dynamic energy model that calculates the internal environment of the house was developed and validated using the field-measured data. Compared with the measured results, the simulated results were found to have a 1.55 and 4.66 for RSME and MAPE of internal air temperature, and 6.16 and 6.69 for RSME and MAPE of internal relative humidity, respectively. Using the LAMP weather forecast data, the broiler stress index for the rearing environment was expressed as the heat stress index suitable for South Korea, and the system was developed to provide information to users by turning it into a web service. When the users input the farm location, structure and equipment, and rearing information, the heat stress index of the broilers of the previous day and the day before the forecast was calculated from the forecast time.

Author Contributions

Conceptualization, J.-H.C. and I.-B.L.; methodology, J.-H.C. and S.-Y.L.; validation, J.-H.C. and S.-Y.L.; investigation, S.-J.P. and J.-G.K.; writing—original draft preparation, J.-H.C. and I.-B.L.; writing—review and editing, J.-H.C., D.-Y.J., C.D.-V., Y.-B.C., U.-H.Y. and S.-J.L.; visualization, H.-H.J.; All authors have read and agreed to the published version of the manuscript.

Funding

This work was supported by the Korea Institute of Planning and Evaluation for Technology in Food, Agriculture and Forestry (IPET) through Living Lab Project for Rural Issues, funded by Ministry of Agriculture, Food and Rural Affairs (MAFRA) (120099-03).

Conflicts of Interest

The authors declare no conflict of interest.

Nomenclature

Parameters
P the static pressure at a point (Pa)
q the dynamic pressure at a point (Pa)
v the flow velocity at a point in the line (m/s)
ρ the density of the fluid (kg/m3)
g gravitational acceleration (m/s2)
h the height of the point relative to the reference plane (m)
Δ P the difference in the static pressure between the inlet and outlet of the fan (Pa)
Q the flow rate of the conveying air of the fan (m3/s)
c 0 , c 1 , c 2 fan performance curve coefficients
ρ d the density of air at the site
p i the static pressure in section i
v i the flow velocity in section i
A i the cross-sectional area of the section i
C D discharge coefficient
m body mass of broiler (kg)
d number of breeding days (day)
Q t o t the total heat production of broiler (W/head)
T indoor air temperature (°C)
Q s e n the sensible heat production of broiler (W/head)
Q l a t the latent heat production of broiler (W/head)
T H I temperature humidity index
R H relative humidity (%)
T D B dry bulb temperature (°C)
T W B wet bulb temperature (°C)
T H V I temperature humidity velocity index
V air velocity (m/s)

References

  1. National Institute of Animal Science. Rural Development Administration (NIAS RDA) Livestock Statistics 30. 2021. Available online: www.nias.go.kr/30/2104.pdf (accessed on 1 May 2022).
  2. Korea Rural Economic Institute (KREI). Current Status and Countermeasures of Heat Wave Damage in Rural Areas; Han Design Corporation Publisher: Tokyo, Japan, 2021. [Google Scholar]
  3. Korea Meteorological Administration (KMA). 2019 Abnormal Climate Report; Design Pickup Publisher: Seoul, Korea, 2020. [Google Scholar]
  4. Korea Environment Institute (KEI); Climate Change Risk Research Center; Korea Environmental Policy and Assessment Institute (Chae Y. et al.) 2020 Heat Wave Impact Report, 2020.
  5. Korean Statistical Information Service (KOSIS). Available online: https://kosis.kr/index/index.do (accessed on 5 March 2022).
  6. Korea Meteorological Administration (KMA). 2018 Abnormal Climate Report; Design Pickup Publisher: Seoul, Korea, 2019. [Google Scholar]
  7. Purswell, J.; Dozier, W.; Olanrewaju, H.; Davis, J.D.; Xin, H.; Gates, R. Effect of Temperature-Humidity Index on Live Performance in Broiler Chickens Grown from 49 to 63 Days of Age; American Society of Agricultural and Biological Engineers: St. Joseph, MI, USA, 2012. [Google Scholar]
  8. Moura, D.; Vercellino, R.; Santos, J.; Vale, M. Heat Stress Impact on Weight Gain in Broiler Chickens: A Meta-Analytical Study of Environmental Factor that Impact Production Losses; American Society of Agricultural and Biological Engineers: St. Joseph, MI, USA, 2015. [Google Scholar]
  9. Cândido, M.; Tinôco, I.; Pinto, F.; Santos, N.; Roberti, R. Determination of thermal comfort zone for early-stage broilers. Eng. Agrícola 2016, 36, 760–767. [Google Scholar] [CrossRef] [Green Version]
  10. Lin, C.-Y.; Hsieh, K.-W.; Tsai, Y.-C.; Kuo, Y.-F. Monitoring Chicken Heat Stress Using Deep Convolutional Neural Networks, 2018.
  11. Ha, J.-W.; Chang, H.-H.; Cha, K.-J.; Song, Y.-H. Verification of Thermal Environment and THI Prediction Equation of Hen House by Field Measurement and Model-based Simulation. J. Korean Inst. Archit. Sustain. Environ. Build. Syst. 2020, 14, 208–219. [Google Scholar]
  12. European Committee for Standardization (CEN). EN ISO 13790; Energy Performance of Buildings: Calculation of Energy Use for Space Heating and Cooling. CEN: Brussels, Belgium, 2008.
  13. Lee, S.-J.; Song, J.; Kim, Y.-J. The NCAM Land-Atmosphere Modeling Package (LAMP) Version 1: Implementation and Evaluation. Korean J. Agric. For. Meteorol. 2016, 18, 307–319. [Google Scholar] [CrossRef] [Green Version]
  14. Hong, M.; Lee, S.-H.; Lee, S.-J.; Choi, J.-Y. Application of high-resolution meteorological data from NCAM-WRF to characterize agricultural drought in small-scale farmlands based on soil moisture deficit. Agric. Water Manag. 2021, 243, 106494. [Google Scholar] [CrossRef]
  15. Daskalov, P.I. Prediction of Temperature and Humidity in a Naturally Ventilated Pig Building. J. Agric. Eng. Res. 1997, 68, 329–339. [Google Scholar] [CrossRef]
  16. Daskalov, P.I.; Arvanitis, K.G.; Pasgianos, G.D.; Sigrimis, N.A. Non-linear Adaptive Temperature and Humidity Control in Animal Buildings. Biosyst. Eng. 2006, 93, 1–24. [Google Scholar] [CrossRef]
  17. Panagakis, P.; Axaopoulos, P. Comparing fogging strategies for pig rearing using simulations to determine apparent heat-stress indices. Biosyst. Eng. 2008, 99, 112–118. [Google Scholar] [CrossRef]
  18. Seo, I.-H.; Lee, I.-B.; Moon, O.-K.; Kim, H.-T.; Hwang, H.-S.; Hong, S.-W.; Bitog, J.; Yoo, J.-I.; Kwon, K.-S.; Kim, Y.-H.; et al. Improvement of the ventilation system of a naturally ventilated broiler house in the cold season using computational simulations. Biosyst. Eng. 2009, 104, 106–117. [Google Scholar] [CrossRef]
  19. El Mogharbel, O.; Ghali, K.; Ghaddar, N.; Abiad, M.G. Simulation of a localized heating system for broiler brooding to improve energy performance. Int. J. Energy Res. 2014, 38, 125–138. [Google Scholar] [CrossRef]
  20. Fabrizio, E.; Airoldi, G.; Chiabrando, R. Study of the Environmental Control of Sow Farrowing Rooms by Means of Dynamic Simulation. In Proceedings of the 8th International Symposium on Heating, Ventilation and Air Conditioning, Xi’an, China, 19 21 October 2013; Springer: Berlin/Heidelberg, Germany, 2014; Volume 263, pp. 3–11. [Google Scholar]
  21. Zhou, Y.; Bidarmaghz, A.; Narsilio, G.; Aye, L. Heating and Cooling Loads of a Poultry Shed in Central Coast, NSW, Australia. In Proceedings of the World Sustainable Built Environment Conference, Hong Kong, China, 5–7 June 2017. [Google Scholar]
  22. Ha, T.; Kwon, K.; Hong, S.; Choi, H.; Lee, J.; Yeo, U. Estimation of THI Index to Evaluate Thermal Stress of Animal-Occupied Zone in A Broiler House Using BES Method. Korean Soc. Agric. Eng. 2018, 60, 75–84. [Google Scholar]
  23. Ha, T.; Kwon, K.; Lee, I.; Kim, R.; Yeo, U.; Lee, S. Estimation of THI index to evaluate thermal stress of piglets in summer season. Korean Soc. Agric. Eng. 2018, 60, 113–122. [Google Scholar]
  24. Lee, S.Y.; Lee, I.B.; Kim, R.W.; Yeo, U.H.; Kim, J.G.; Kwon, K.S. Dynamic energy modelling for analysis of the thermal and hygroscopic environment in a mechanically ventilated duck house. Biosyst. Eng. 2020, 200, 431–449. [Google Scholar] [CrossRef]
  25. American Society of Heating, Refrigerating and Air-Conditioning Engineers (ASHRAE). ASHRAE Handbook—Fundamentals; American Society of Heating, Refrigerating and Air-Conditioning Engineers (ASHRAE): Atlanta, GA, USA, 2017. [Google Scholar]
  26. Liu, G.; Liu, M. Development of simplified in-situ fan curve measurement method using the manufacturers fan curve. Build. Environ. 2012, 48, 77–83. [Google Scholar] [CrossRef]
  27. Ministry of Agriculture, Food and Rural Affairs (MAFRA) and Nonghyup (NH). Standard Design of the Broiler House Released Copy 2016. 2019. Available online: https://livestock.nonghyup.com/dtar/blupr.do (accessed on 18 July 2022).
  28. Laknizi, A.; Ben Abdellah, A.; Mahdaoui, M.; Anoune, K. Application of Taguchi and ANOVA methods in the optimisation of a direct evaporative cooling pad. Int. J. Sustain. Eng. 2021, 14, 1218–1228. [Google Scholar] [CrossRef]
  29. Rong, L.; Pedersen, P.; Jensen, T.L.; Morsing, S.; Zhang, G. Dynamic performance of an evaporative cooling pad investigated in a wind tunnel for application in hot and arid climate. Biosyst. Eng. 2017, 156, 173–182. [Google Scholar] [CrossRef]
  30. Xue, H.; Qiang, Z.; Ni, J.Q.; Baoming, L.; Zhengxiang, S.; Shumei, Z.; Yu, W. Effect of cooling pad installation on indoor airflow distribution in a tunnel-ventilated laying-hen house. Int. J. Agric. Biol. Eng. 2016, 9, 169–177. [Google Scholar]
  31. Lee, J.H.; Munters Korea Co. Essential facilities to improve productivity in hot weather—Misconceptions, truths, and effects about cooling pads (2). Korean Poult. J. 2018, 156–158. [Google Scholar]
  32. Choi, H.C. Ventilation Method and Cooling Pad Technology in the Heat Season; National Institute of Animal Science, Rural Development Administration (NIAS RDA): Jeonju, Korea, 2015.
  33. Perdersen, S.; Sällvik, K. Heat and Moisture Production at Animal and House Levels 4th Report of Working Group on Climatization of Animal Houses; CIGR: Horsens, Denmark, 2002. [Google Scholar]
  34. Yoo, J.S. New Feeding and Management for the Production of Poultry Farming. 2009. [Google Scholar]
  35. Lee, G.H. Energy Plus: Modeling Techniques with Air Conditioning Theory; Hansol Academy: Lalitpur, Nepal, 2018; ISBN 979-11-5656-627-4-13530. [Google Scholar]
  36. U.S. Department of Energy Federal Energy Management Program. M&V Guidelines: Measurement and Verification for Performance-Based Contracts Version 4.0. DOE/EE-1287-0286; November 2015. Available online: femp.energy.gov (accessed on 15 July 2022).
  37. Walton, G.N. Thermal Analysis Research Program Reference Manual; National Bureau of Standards: Washington, DC, USA, 1983.
  38. Clark, G.; Allen, C. The Estimation of Atmospheric Radiation for Clear and Cloudy Skies. In Proceedings of the 2nd National Passive Solar Conference (AS/ISES), Philadelphia, PA, USA, 16–18 March 1978; pp. 675–678. [Google Scholar]
  39. National Institute of Animal Science, Rural Development Administration (NIAS RDA). Korean Feeding Standard for Poultry; Evergreen Publisher: Suwon, Korea, 2007. [Google Scholar]
  40. Casey, K.D.; Gates, R.S.; Wheeler, E.F.; Xin, H.; Liang, Y.; Pescatore, A.J.; Ford, M.J. On-Farm Ventilation Fan Performance Evaluations and Implications. J. Appl. Poult. Res. 2008, 17, 283–295. [Google Scholar] [CrossRef]
  41. Park, G.-Y.; Lee, I.-B.; Yeo, U.-H.; Ha, T.-H.; Kim, R.-W.; Lee, S.-Y. Ventilation rate formula for mechanically ventilated broiler houses considering aerodynamics and ventilation operating conditions. Biosyst. Eng. 2018, 175, 82–95. [Google Scholar] [CrossRef]
  42. U.S. Department of Energy. EnergyPlus Version 9.5.0 Documentation Input Output Reference. 2021. Available online: https://energyplus.net/assets/nrel_custom/pdfs/pdfs_v9.5.0/InputOutputReference.pdf (accessed on 1 May 2022).
  43. Mount, L.E. Thermal neutrality. In Heat Loss from Animals and Man: Assessment and Control; Monteith, J.L., Mount, L.E., Eds.; Butterworths: London, UK, 1974; pp. 425–439. [Google Scholar]
  44. DeShazer, J.A.; Beck, M.M. University of Nebraska Report for Northeast Regional Poultry Project NE-127; Agricultural Research Division, University of Nebraska: Lincoln, NE, USA, 1988. [Google Scholar]
  45. Tao, X.; Xin, H. Acute synergistic effects of air temperature, humidity, and velocity on homeostasis of market-size broilers. Trans. ASAE 2003, 46, 491. [Google Scholar]
  46. Chepete, J.; Chimbombi, E.; Tsheko, R. Production performance and temperature-humidity index of Cobb 500 broilers reared in open-sided naturally ventilated houses in Botswana. In Proceedings of the Seventh International Symposium, Livestock Environment VII, Beijing, China, 18–20 May 2005. [Google Scholar]
  47. De Moraes, S.R.P.; Yanagi, J.; De Oliveira, A.L.R.; Yanagi, S.; Café, M.B. Classification of the temperature and humidity index (THI), aptitude of the region, and conditions of comfort for broilers and layer hens in Brazil. In Proceedings of the International Conference of Agricultural Engineering, XXXVll Brazilian Congress of Agricultural Engineering, International Livestock Environment Symposium-ILES VIII, Iguassu Falls City, Brazil, 31 August–4 September 2008. [Google Scholar]
  48. Xin, H.; Berry, I.L.; Barton, T.L.; Tabler, G.T. Feed and water consumption, growth, and mortality of male broilers. Poult. Sci. 1994, 73, 610–616. [Google Scholar] [CrossRef]
  49. Brown-Brandl, T.M.; Beck, M.M.; Schulte, D.D.; Parkhurst, A.M.; DeShazer, J.A. Temperature Humidity Index for Growing Tom Turkeys. Trans. ASAE 1997, 40, 203–209. [Google Scholar] [CrossRef]
  50. National Research Council (NRC). A Guide to Environmental Research on Animals; National Academic Science: Washington, DC, USA, 1971. [Google Scholar]
  51. U.S. Department of Agriculture. Heat Stress Forecast Maps. Available online: https://www.ars.usda.gov/plains-area/clay-center-ne/marc/documents/heat-stress/main/ (accessed on 1 August 2022).
  52. Kansas State University. Animal Comfort. Available online: https://mesonet.k-state.edu/agriculture/animal/#tab=download-tab (accessed on 1 August 2022).
  53. National Institute of Animal Science. Livestock Breeding Weather Information System. Available online: https://chuksaro.nias.go.kr/lwis/gis/tpIdex/tpIdex.do (accessed on 1 August 2022).
Figure 1. Research flow for heat stress energy model and forecasting system development procedure.
Agriculture 12 01666 g001
Figure 2. Outside and inside the field test facility for experiment (Latitude: 35.277, Longitude: 126.511, Yeonggwang-gun, Jeollabuk-do, Republic of Korea).
Agriculture 12 01666 g002
Figure 3. Test target facility size and internal facility status.
Agriculture 12 01666 g003
Figure 4. Framework of the medium-range weather prediction model implemented in the National Center for AgroMeteorology-Land-Atmosphere Modeling Package (NCAM-LAMP). The LAMP diagnosis and prediction data are used as high-resolution meteorological input data for poultry heat stress model in this study.
Agriculture 12 01666 g004
Figure 5. Research flow for heat stress energy model development procedure.
Agriculture 12 01666 g005
Figure 6. Measurement the ventilation flow rate of the broiler house of exhaust fan: (a) Installation of an air flow meter in the tunnel exhaust fan; (b) Ventilation flow rate change according to the number of fans; (c) Internal static pressure of exhaust fan.
Agriculture 12 01666 g006aAgriculture 12 01666 g006b
Figure 7. Research flow for heat stress forecasting system development procedure.
Agriculture 12 01666 g007
Figure 8. Measured internal environment the broiler house during the rearing period (25 September, 28 October 2020): (a) Measured and optimum growth of air temperature; (b) Measured and optimum growth of air relative humidity.
Agriculture 12 01666 g008
Figure 9. Fan performance curve results in the broiler house.
Agriculture 12 01666 g009
Figure 10. Comparison of internal air temperature and relative humidity for model validation: (a) Simulated value of air temperature compared to field measured data; (b) Simulated value of relative humidity compared to field measured data.
Agriculture 12 01666 g010
Figure 11. A sample image showing the web-based forecasting system for broiler heat stress.
Agriculture 12 01666 g011
Figure 12. Comparison of heat stress index for the Rural Development Administration system predictive warning and this research model: (a) Jeonllabuk-do Weather Data (15 July–19 August); (b) Heat stress index analysis using energy model calculation results and experimental data.
Agriculture 12 01666 g012
Table 1. Physical properties input to the broiler house structural model.
MaterialsThermal Conductivity
(kJ/hmK)
Thermal Capacity (kJ/kgK)Density (kg/m3)
sandwich panel
(100 mm Thickness)
0.13681.5100
sandwich panel
(150 mm Thickness)
0.14041.573.33
reinforced concrete7.920.842800
concrete6.30.842000
gravel7.21.01800
polyethylene film0.87922.30370.96
Table 2. EMS objects to consider to heat the production of broilers.
ParameterUnitPhysical MeaningEMS ObjectVariableProgram Calling Manager
Tin°Cinternal air temperatureSensorCalculation-
Hin%internal air relative humiditySensorCalculation-
Daydayrearing daysSensorSchedule value-
Headheadrearing scaleSensorSchedule value-
QbroilerW/headheat production per headActuator--
THIindex-Temperature Humidity IndexProgram-EndOfZoneTimestepBeforeZoneReporting
QsenWsensible heat generation of broilerProgram-BeginTimestepBeforePredictor
QlatWlatent het generation of broilerProgram-BeginTimestepBeforePredictor
Table 3. Variables the user enters into the system.
TypeInput VariableUnitExampleInputCondition
locationlatitude, longitude-127°35′addressconversion to district code format
structure and equipmentfarm widthm18constantmin 0, max 50
farm lengthm80constantmin 0, max 120
farm side heightm4constantmin 0, max 10
farm ridge heightm6.4constantmin 0, max 10
wall insulation thicknessmm100constantmin 0, max 1000
roof insulation thicknessmm150constantmin 0, max 1000
insulation type-EPSoptionEPS (styropor, Neopor), XPS
cooling pad-Oschedule0 or 1
number of fansea14constantmin 0, max 20
fan sizeinch50option30 or 50
growth informationrearing daysday5constantmin 0, max 60
rearing scalehead34,000constant-
Table 4. Flow rate reduction rate of design fan curve and field fan performance curve according to static pressure difference.
Static Pressure Difference (Pa)Tunnel Fan Flow (m3/h)Reduction Rate (%)
DesignMeasured
2032,93423,06130.0
3030,42822,04827.5
4027,86120,88025.1
5024,71319,45121.3
Table 5. Statistical analysis by air temperature and humidity for model validation.
R2RSMEMAPE
Indoor air temperature0.941.554.66
Indoor relative humidity0.896.166.69
Table 6. Heat stress index model for broilers.
NumberEquationReference
(18) ( 1.8 × T + 32 ) [ ( 0.55 0.0055 × R H ) × ( 1.8 × T 26.8 ) ] NRC (1971)[50]
(19) 0.6 × T D B + 0.4 × T W B DeShazer and Beck (1988)[44]
(20) 0.85 × T D B + 0.15 × T W B Tao and Xin (2003)[45]
(21) ( 0.85 × T D B + 0.15 × T W B ) × V 0.058
(22)3~4 Weeks: 0.62 × T D B + 0.38 × T W B ,
5~6 Weeks: 0.71 × T D B + 0.29 × T W B
Chepete et al. (2005)[46]
(23) 0.85 × T D B + R H ( T D B 14.3 ) 100 + 46.3 Moraes et al. (2008)[47]
Publisher’s Note: MDPI stays neutral with regard to jurisdictional claims in published maps and institutional affiliations.

